



Abstract
This paper presents an experimental study and modeling of the influence of surface density and fiber length on the permeability of novel nonwoven flax fiber manufactured by the paper making process. Firstly, the relation between surface density, fiber lengths and pore size distribution measured with a porometer capillary instrument is reported in this study. The results show that higher surface density gives a denser fibrous network with a low porosity rate and longer fiber decreases the total number of fibers and increases the pore size for a given surface density. A liquid permeability study was then carried out to identify the impact of surface density, short fiber length and fiber volume fraction on in-plane impregnation of the reinforcement. Permeability was found to be inversely proportional to the reinforcement of surface density. In contrast, an increase of the fiber length increases the in-plane permeability of the reinforcement. Finally, a mathematical modeling is proposed to predict the permeability behavior of these innovative natural fiber webs.
Resin transfer molding (RTM) is one of the most popular liquid composite molding (LCM) processes for the production of high-performance composites. Both small and large components can be molded with a wide choice of resins and fiber reinforcements for the production of parts.1,2 In this process, a dry preform or a stack of dry reinforcements is placed inside the mold cavity, and a pre-catalyzed liquid polymer resin is injected to impregnate the reinforcement, giving a solid composite part after curing. 3 Even if fiber reinforcements combine high mechanical properties with a low density, the production costs represent a major challenge in the use of such materials, which can be reduced by decreasing the production time. 4
In RTM processing, the impregnation of the dry fibrous reinforcement with a liquid resin is key for processing time and mechanical performance of the molded part. According to Darcy’s law, the flow resistance in a porous reinforcement increases while increasing the fiber volume fraction. When a part with a very high fiber content is produced, the mold-filling time can reach the limit of the workable time of the resin before gelation. 5 Therefore, precise permeability values are particularly important for the filling time prediction and process optimization. This enables the computation of the flow behavior in large complex molds, while at the same time it helps in investigating the different possible setups for better impregnation. 6 However, permeability measurements are sensitive to several factors and, hence, prone to errors. 7 Furthermore, permeability is distinguished into two types: saturated and unsaturated. In the unsaturated phase the injected fluid flows through the dry sample, replacing the air between and inside the fiber bundles in the sample. In the saturated phase, the fiber preform is fully impregnated with the test fluid, which is continuously replaced by new incoming fluid. 7 Permeability can also be measured by either the one-dimensional (1D) flow method (linear flow front) or the two-dimensional (2D) radial flow method.6–8 In the radial flow experiment, the in-plane permeability components in the principal directions of the preform and their orientation with respect to the reference axes can be measured. This is an advantage compared to the 1D method. In both methods, the flow front position is recorded as a function of time.6,7 In the 1D approach, errors associated with race tracking of liquid and mold deflection can occur because one of the plates of the experimental mold is made of tempered glass or plexiglass to allow recording of the flow front position; however, mold deflection has to be quantified to avoid inconsistent results.7,9 In fact, deflection of the mold cover during compaction of the fibers or resin injection under pressure can lead to a non-uniform cavity thickness, and thus to incorrect permeability measurements.7,10
Several studies on the permeability of various natural fiber reinforcements have been published.11,12 Studies focused on the impregnation analysis of jute, flax and similar natural fibers in the form of wovens and textiles manufactured with the same techniques as glass fiber reinforcements. Permeability and even capillarity flows were studied for such fibers and compared to glass fibers, where the main difference is due to the hollow structure of the natural fibers. It was observed that the magnitude of capillary pressure in natural fiber fabrics was two to three times higher than that reported for synthetic fibers, because the hollow and inhomogeneous structure of natural fibers provides more capillary channels in which micro-flow can occur. 13
Natural fiber-reinforced composites have gained popularity in various engineering applications, automotive transports (body components, casings, cabins, seats, etc.), rail transports (doors, seats, interior panels, ventilation housings, etc.), marine transports (hovercrafts, racing boats, pleasure boats, canoes, etc.) and are proposed as a realistic alternative to glass fibers in polymer composite reinforcement. This popularity is supported by their unique properties. Flax, jute, sisal, hemp, kenaf, coir and many other natural fibers are environment friendly, have relatively high specific strength and modulus due to their low density, are renewable and recyclable and have good bio-degradability. From a manufacturing point of view, these fibers are of low cost, are non-abrasive to processing equipments, do not cause irritation and have a low health risk and are of lower energy consumption during fiber preparation and composite molding.14–22
A particular interest is given to flax fibers, and many researchers have investigated and addressed their competitiveness and suitability for polymeric matrix reinforcement.19,23–28 Flax fibers as reinforcement are used in different forms and configurations (such as monofilament fibers, nonwovens, rovings, fabrics, etc.) with a variety of manufacturing techniques to produce composites (film stacking, vacuum infusion, compression molding, RTM, etc.).19,29–32 Most of research on flax fiber composites has focused on the mechanical properties and fiber treatments.19,23,30,31,33 The advantages of flax fibers compared with hemp, bamboo, jute and others natural fibers become even more important with higher mechanical properties and a close equivalent longitudinal stiffness and a higher specific stiffness to glass fibers, due to the lower density of flax.19,23,31
In this work, a nonwoven flax reinforcement manufactured with the paper making process was studied. The originality of the manufactured reinforcement comes from the fact that no external chemical treatment or textile techniques are used to keep the cohesion between fibers and from the use of the paper making manufacturing process. Natural mechanical and chemical bonds that develop during wet processing provide sufficient cohesion between fibers. These reinforcements were made using chopped flax fibers processed with machinery commonly used in the paper industry, resulting in a very thin layer of 100 µm thick, as presented in Figure 1. Two directions result from the manufacturing process due to the preferential alignment of the fibers. The direction of the roll is the machine direction (MD) and the direction of the width is the cross-direction (CD). Only the MD was considered in this work. An experimental study was conducted to investigate the open porosity of the flax fiber web, as manufactured, and its permeability to a liquid resin. Finally, a mathematical analysis was conducted to model the permeability of the nonwoven as a function of fiber length, surface density and fiber volume fraction.
Structure of nonwoven flax (S100L5).
Theoretical background
Permeability and 1D flow time calculation
For isotropic materials such as fibrous webs, single measurements of permeability are usually performed using a 1D approach.
1
In the case of orthotropic fibers, this characterization requires a minimum of three experiments (three orientations) to define the permeability tensor as a function of fiber orientation. Darcy’s equation can be used to calculate the permeability from a 1D flow using the following equation

The compressibility of reinforcement is a key parameter affecting the permeability by influencing the porosity distribution of the fibers (i.e., macro/micro porosity distribution). It also defines the fiber volume fraction (Vf), which can be calculated from the following equation

Pore size distribution determination techniques
According to some authors, 6 the permeability (K) is a pore-structure parameter depending only on the pore geometry of porous media. It is influenced by the relationship between the different porosity scales, which in turn affects the relationship between flow path dimensions and fluid/fiber boundary. 34 Researches have also found that unsaturated permeability is mostly influenced by capillary pressure of the fluid flow, which depends not only on pore size but also on surface tension of the fibers. 35 Understanding the pore size distribution and morphology is essential to the optimization of RTM processing, ensuring a full impregnation of the fibers.36,37
The properties affecting the porosity of reinforcement are key parameters of the molding process, due to their impact in the flow behavior. It is then important to understand the pore size distribution and pore morphology to better predict the flow behavior of fibrous reinforcements. Morphology parameters of a fiber bed, such as pore size distribution and pore shape, as well as several characterization methods, are reviewed by Cuperus and Smolders. 38 The authors present a synthetic review of different techniques based on gas adsorption–desorption, the bubble pressure method, the liquid expulsion technique and thermos-porometry. In this study, a liquid displacement technique was used to characterize the porosity of the natural fiber webs, as described in the Pore size measurement section.
Materials and experimental methodology
Production of nonwoven flax
Samples manufactured in this study using the paper making equipment

Pore size measurement
Porosity is influenced by the internal structure of the fibrous network and the morphology of the surface finish of the reinforcement. The internal structure is controlled by the type, diameter and length of the fibers, their orientations and the level of compaction. The surface morphology of the fiber web influences the flow path between the layers of reinforcement. 39
In this study, a liquid expulsion technique based on the measurement of the pressure necessary to blow air through liquid-filled pores was used to characterize the “interconnected pores” of the fibrous webs. This is done in a porometer instrument by first completely wetting the porous media with a non-wetting fluid (Quantachrome's Porofil Wetting Fluid). In this case, the pores are filled with the liquid due to the capillary equilibrium, following the equation

When the first bubble appears (called “the bubble point”), the pore size related to this “bubble pressure” represents the largest pore present in the porous media. With a further drop of pressure, smaller pores are emptied until eventually the entire porous media is dried. The flow versus pressure drop curve generated this way is usually “S-shaped” and the analysis of the flow–pressure curve is generally performed using a statistical distribution to characterize the different pore sizes. 40
A Porometer 3G™ from Quantachrome Instruments Inc. (Figure 2) was used in this work to measure the pore size distribution of natural fiber webs. This instrument can be used efficiently for pore sizes within the range of 0.013–500 µm. Test samples are of circular form, with a diameter of 25 mm. After wetting the sample, in the first test run (called the “wet” run), the saturated sample is exposed to an increasing gas pressure until it can overcome the surface tension of the liquid in the largest pores to push the liquid out (Figure 3). The resulting volumetric flow of gas through the emptied pores is measured and the pore size is calculated using the Washburn equation
Porometer used for pore size distribution measurements.
40
Schematic diagram of the porometer physical principle.
40




For each type of fiber web in Table 1, the interconnected porosity was measured on 10 samples to ensure reliable results. For each run, the sample (a single web layer) was installed in the holder and measured at its natural thickness; Vf as reported in Table 1. For the studied reinforcements, with natural thicknesses varying from 176 to 403 µm, the interconnected porosity gives a good insight of the fibrous structure of the reinforcement that is useful for optimizing the manufacturing of the nonwoven.
The aim of this investigation was to characterize the fibrous structure as it comes from the modified manufacturing process, which usually uses wood fiber to produce paper. Comparing the interconnected porosity of fiber webs at the same Vf and surface density will be part of a future study once the manufacturing process is better understood and optimized.
Permeability measurement setup and procedure
The permeability measurement apparatus PermLab 2™ (Figure 4), available at Ecole Polytechnique of Montreal, was used in this study. It is composed of a 19 mm thick tempered glass plate on top, a steel plate at the bottom (comprising an injection port at one end and a venting port at the other end), an intermediate steel frame (spacer plate) to give a precise cavity thickness and a rubber O-ring for sealing. This unit has already been used in the permeability benchmark exercise at Ecole Polytechnique de Montreal
41
and follows the guidelines developed during this exercise. The reinforcement layers are stacked and placed inside the steel frame that fixes the cavity thickness between the top and bottom plates. The layers are then compressed between the plates to reach the fixed thickness and obtain the desired fiber volume fraction (Vf), from 10% to 50%, controlled by the thickness of the intermediate frame. Four layers of 200 mm ×100 mm were used for the experimental permeability characterization.
Permeability characterization equipment PermLab 2.
Unlike synthetic fibers, the permeability and porosity of natural fiber webs are known to be variable as a result of the fiber swelling during the mold-filling process. 42 Moreover, the saturation of natural fibers can cause swelling, and this contributes to reduce the porosity and increase the flow resistance in saturated flow. Generally, unsaturated permeability is affected by fluid absorption and saturated permeability is affected by fiber swelling. Both effects lead to a decrease in permeability.43–46 In the present study, silicon oil was used for permeability determination, since it decreases the effect of swelling of natural fibers, as was observed in previous works.13,47
Using a constant injection pressure of 100 kPa, the permeability is measured by recording the progression of the flow front during the test. The pressure and flow front positions are recorded with PermLab 2™, which gives the evolution of the flow front and its velocity in real time, along with the calculated permeability value. The fluid used to conduct the permeability tests is a silicon oil with a viscosity of 100 centistoke. To avoid the “race-tracking” effect, which is a source of error induced by preferential liquid flow along the sides of the reinforcement stack, a latex sealant is applied on the sides of reinforcement.
Visual porosity analysis
Several techniques exist to quantify the observable porosity of porous materials. Modern microscopy enables not only visualization on a microscopic scale but also the conversion of micrographs to digital images for post-processing. These images may then be optimized and analyzed using image processing and analysis tools to give a complementary understanding of the reinforcement’s internal structure. 37 In this work, a Keyence VHX-1000 series Digital Microscope was used to characterize the observable porosity. Following the guidelines described by LeBel et al., 37 10 images were taken for each sample, as shown in Table 1, and then analyzed using MATLAB post-processing code. This analysis was carried out on one layer of fiber web at its natural thickness and corresponding Vf, as reported in Table 1. Compacting the web at different thicknesses will increase Vf and decrease porosity; however, the aim of this analysis was to characterize the fibrous structure, as it comes from the new manufacturing process of the webs. Once the manufacturing process of the nonwoven is optimized, future works will focus on the characterization of web properties as a function of Vf and surface density.
Results and discussion
Porosity analysis
Porometer analysis
Proper analysis and interpretation of the pore size measurements are important to establish a relationship between the mean pore size, the web surface density and the short flax fiber length. This relationship will help in future understanding of the distribution, compaction and rupture of short fibers during the manufacturing of the nonwovens, and so its optimization (i.e., the water content of the slurry, compaction pressure, projection gun, etc.). Figure 5 shows the typical pore size distribution obtained with the Porometer 3G™ on one layer of nonwoven flax (Table 1), which is approximately lognormal, that is, the logarithm of the measured pore size is approximately Gaussian.
48
It can be observed in this analysis that both the surface density and fiber length have a significant effect on the number of pores (the area below the Gaussian curve) and on the pore size distribution.
Effect of surface density and fiber length on the pore size distribution of nonwoven flax manufactured in this study (differential pore number per cm2).
As expected, increasing the surface density of the fiber web decreases the pore size. This can be seen by comparing the maximum pore size (MaxPS) for each surface density, where MaxPS decreases while increasing surface density. These results are also affected by the increasing Vf as surface density increases (Table 1). It is then not possible to differentiate these two contributions to the pore size.
However, fiber length also has a significant effect on pore size, as longer fibers result in a more opened structure and increase MaxPS. In this case, the same Vf was measured for each combination of fiber lengths L5 versus L10. This can be observed in Figure 6, where MinPS and MaxPS for 5 mm length fibers are consistently smaller than those for 10 mm length fibers. Note that samples with surface densities of 50 and 100 g/m2 were tested at the same Vf of 19%, while samples of 150 and 200 g/m2 were tested at 27% and 34%, respectively. Varying the Vf of the fiber web resulted in the same trend of MinPS and MaxPS, and their difference between 5 and 10 mm fiber length was keep constant in all cases. These results indicate that for the same surface density and Vf, fiber web manufactured with longer fibers will exhibit higher liquid permeability and faster processing cycles.
Effect of surface density on the minimum (MinPS) and maximum pore size (MaxPS).
Microscopy and image analysis
Figure 7 shows a series of micrographs of the 5 and 10 mm fiber length with the observable pores delimited in green, as obtained from the MATLAB analysis described in the Visual porosity analysis section. This image analysis aims to understand the distribution of 5 and 10 mm fibers along the fiber web through the observable pores in the plane of the nonwoven. Thus, this observable porosity, called here-on “in-plane porosity,” will differ from the total open porosity of the fibrous reinforcement as commonly used. Figure 8 shows the in-plane porosity computed by image analysis on one layer of fiber web at different surface densities and fiber lengths. A linear decrement of the in-plane porosity of the fiber web is observable with increasing surface density. Note again that samples with surface densities of 50 and 100 g/m2 were tested at the same Vf of 19%, while samples of 150 and 200 g/m2 were tested at 27% and 34%, respectively. Varying the Vf of the fiber web resulted in the same linear trend of in-plane porosity as previously observed in Figure 6.
In-plane porosity detection by microscopic image analysis. (Color online only.) Effect of surface density and fiber length on in-plane porosity observable by image analysis.

Moreover, the 10 mm fiber length shows that, in all cases, a higher in-plane porosity than the 5 mm fiber length. This is due to the topology of the fibrous structure with more fiber-to-fiber intersections for fiber webs with shorter fiber lengths. This observation is consistent with the findings of the Porometer analysis section and is an indication of the processability of the fiber web; for the same surface density, faster flows will occur on 10 mm fiber length. This phenomenon will be studied in the next section.
A mathematical model was also developed for the in-plane porosity (Ipp) as a function of the surface density of the nonwoven (Sd) and short fiber length (Lf)

Figure 8 shows a good agreement between the model prediction and experimental observations. This model will be used later in this research project to optimize the manufacturing of the nonwoven flax fiber.
Permeability analysis
In-plane permeability experiments on the 5 mm fiber length web are presented in Figure 9 as a function of fiber volume fraction (Vf). For all surface densities studied in this work, an exponential decrease in fluid permeability was observed while increasing the fiber volume fraction. An increase in Vf reduces the pore size and consequently leads to an important geometry decrement of the pore size distribution, thus increasing the flow resistance and decreasing the permeability values. Capillary pressure is inversely proportional to the pore size.
13
At the microscale, the capillary pressure affects the rate at which a fluid flows into or through a capillary network and it depends on the fluid interfacial tension, viscosity and density and the pore geometry. Factors such as the pore size distribution, the shape of pores and the orientation of flow channels also affect the capillary flow rate. Therefore, the pore size distribution of the fiber webs manufactured in this study will influence the capillary flow and so the impregnation of the fibrous network and their unsaturated permeability. For the same fiber volume fraction, permeability was found to be higher for a nonwoven of 50 g/m2 than for a nonwoven of 100 g/m2. This is consistent with previous results (Figures 5–8), as more macro-pores were observed on the 50 g/m2 than on the 100 g/m2 nonwovens. The pressure-driven flows are more dominant on low-density fiber webs, while capillary flows are more dominant on highly dense fiber webs.
Permeability of 5 mm fiber webs for different surface densities.
Natural fiber webs experience larger permanent deformation than glass fiber during compaction due to the fiber lumen closure, which increases as the fiber content increases.43,49,50 For layers of different surface densities, each one will compress differently during the compaction phase according to the number of fiber-to-fiber interactions, as shown in Figure 7. This produces a change in the pore distribution and in the fluid permeability of the nonwoven. This can be noticed on the varying slopes of the fitting curves that are not constant for all surface densities, indicating that the permeability is not only function of Vf but also of the fiber web structure resulted from the new manufacturing process. Compacting the 50 g/m2 fiber web at 50% Vf will result in a different fibrous structure than compacting the 200 g/m2 at the same Vf, due to the number of fiber-to-fiber interactions. This flow analysis will then be useful in future studies to optimize the manufacturing of the nonwoven for better impregnation during component manufacturing.
A mathematical model of in-plane permeability was developed in order to account for the Vf and surface density of the fiber web Sd and fiber length Lf

Equation (7) is presented in Figure 9 compared to experimental data with a good agreement between both. Equations (6) and (7) are highly useful for predicting the porosity (i.e., flow behavior and mechanical performance) and permeability (i.e., processability) of new flax reinforcement that could potentially be manufactured using the process described in this work. Such analysis will help in selecting the right reinforcement parameters in order to obtain a given mechanical performance and processability by liquid molding.
Fiber length is one of the key parameters describing the fibrous architecture of flax web manufactured in the present study. The fiber length has an effect on the fibrous network structure of the material; increasing the fiber length decreases the average number of fibers per unit of area, thus increasing substantially the pore size, as shown in Figure 5.
Figure 10 shows the permeability data of measures conducted at 40% of fiber volume fraction for different surface densities of fiber webs made with 5 and 10 mm fiber lengths. For the same fiber volume fraction, longer flax fibers lead to an important increment in the liquid permeability. This is important for the processing of natural fiber reinforcement, since it leads to faster impregnations while using liquid molding techniques.
Effect of fiber length on the in-plane permeability at a Vf of 40%.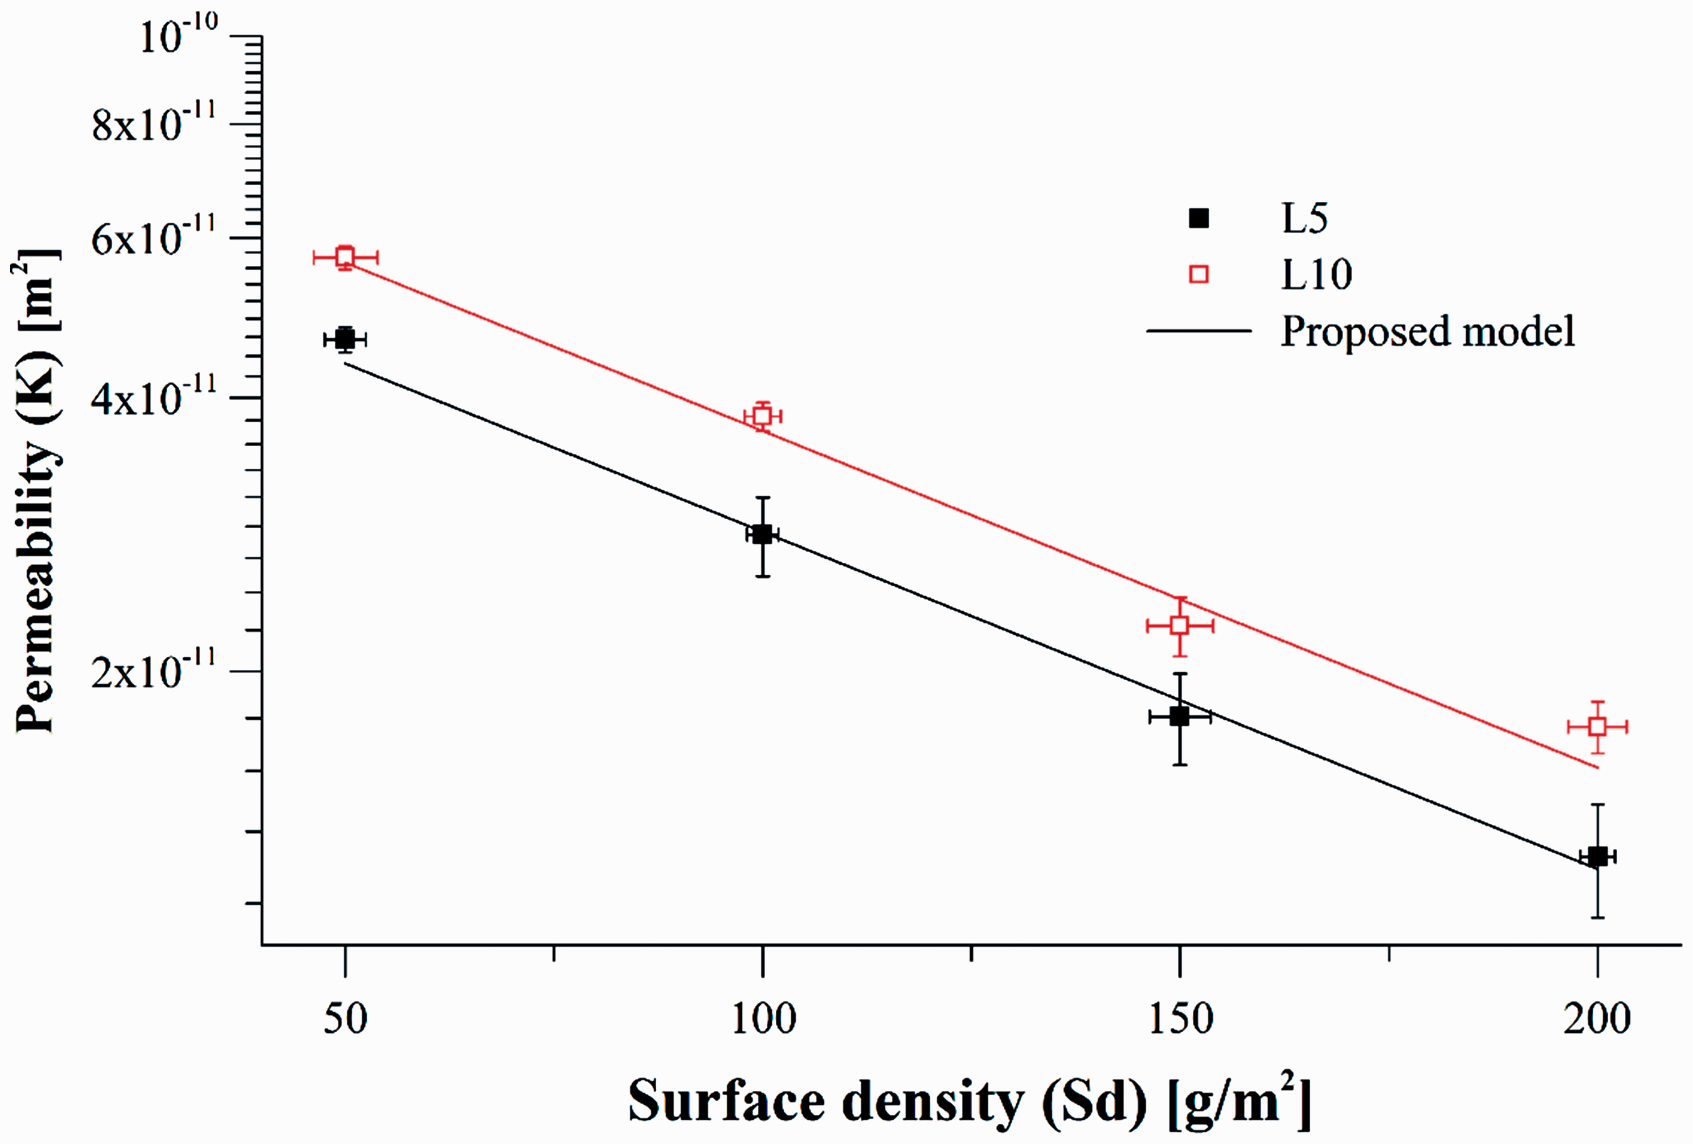
Figure 10 also shows the predictions of the mathematical model developed in this work (Equation (7)), with a good agreement with experiment data for 5 and 10 mm fiber webs. It can be concluded that for the same Vf, longer fibers will result in faster impregnations, while higher surface densities will slow the web impregnation. These results will help in future optimizations of the reinforcement in attempting to improve the mechanical performance and ease of processing while minimizing the variability of the fibrous structure and manufacturing cost.
Conclusion
A new type of nonwoven flax fiber reinforcement manufactured with paper making equipment was presented in this study. The work focused on the porosity and impregnation of these thin fiber webs. The experimental analysis of the open porosity of fiber webs demonstrated a relationship between the surface density of the material, fiber length and pore size distribution. The results indicate that for the same surface density and Vf, fiber web manufactured with longer fibers will exhibit higher open porosity. This trend was observable for all different surface densities studied in this work. In addition, higher surface densities give thicker layers, which increases the ability to form pores inside the layer through the thickness. Also, higher surface density will increase the number of fibers per unit of area and decrease the free space between the fibers, which gives a denser fibrous network with a low porosity rate. Fiber length has a direct effect on the number of fibers per unit of area; increasing the fiber length decreases the total number of fibers and increases the pore size for a given surface density. A mathematical model was presented to predict the observable open porosity of the fiber webs as a function of surface density, Vf and fiber length.
An experimental analysis was carried out to measure the in-plane permeability of the fiber webs, resulting in an exponential law as a function of Vf. For the same Vf, permeability was found to be higher for a fiber web of 50 g/m2 than for that of 100 g/m2. This is consistent with porosity observations, since more macro-pores were observed on the 50 g/m2 fiber webs than on the 100 g/m2 fiber webs, where the proportion of micro-pores is increased by increasing the surface density. Similar trends were measured for higher surface density fiber webs. In addition, it was validated that an increase in the fiber length also increases the in-plane permeability of the reinforcement. Finally, a mathematical model was created to predict the in-plane permeability of the fiber web as a function of Vf, surface density and fiber length. This analysis will help in selecting the optimum reinforcement parameters in order to obtain a given mechanical performance and processability of the fibers by liquid molding.
Footnotes
Acknowledgement
Special thanks to Nicolas Vernet from the Safran Group for his support in the experimentation part.
Declaration of conflicting interests
The authors declared no potential conflicts of interest with respect to the research, authorship and/or publication of this article.
Funding
The authors disclosed receipt of the following financial support for the research, authorship, and/or publication of this article: This work was supported by the Natural Sciences and Engineering Research Council of Canada (NSERC) and the Centre de recherche en plasturgie et composites (CREPEC).