
Abstract
Due to the similarities between cashmere and wool, the automatic identification of these two animal fibers continues to be a huge challenge in textile society. In this paper, for the identification of micrographs of cashmere and wool, bag-of-words and spatial pyramid matching are used. Each fiber image was regarded as a collection of feature vectors in our logic. The vectors, extracted from the original dataset, were fed into a support vector machine for supervised classification. The codebook size and the resolution level were completely investigated. The experimental results indicated that the image segmentation delivered a positive contribution in enhancing the accuracy of classification. The overall performance of the model was robust under various blend ratios. It verifies that the bag-of-words with spatial pyramid match is an effective approach to the identification of cashmere and wool fibers.
Wool and cashmere are two kinds of highly similar animal fibers with a particular surface structure consisting of an outermost scale cuticle. Currently, the identification of these two kinds of animal fibers is accomplished in accordance with the morphology of the scales of individual fibers using optical or scanning electron microscopy. 1 Skilled microscopists distinguish cashmere and wool fibers based on differences in morphological characteristics. 2 These differences mainly include the form of scale margin, the distance between the external scale margins, and the general scale patterns. 3 Besides morphology based identification methods, near infrared spectroscopy, protein analysis, and DNA analysis technologies were also employed to identify cashmere and wool fibers.1,4–7 For example, Zoccola et al. 1 proposed a method based on near infrared spectroscopy for the identification of cashmere, wool, and yak in accordance with the differences among spectra of these animal fibers. Vineis et al. 4 extracted keratin from different animal fibers and keratin was digested by enzyme to produce peptide mixtures. The peptide analysis of the mixtures was used to assess relative percentages of fibers present in blends. Tang et al. 5 extracted mitochondrial DNA from cashmere and wool fibers for the identification of the two kinds of animal fibers.
Although some new methods have been developed, the cuticle scale pattern is still the major reference for distinguishing animal fibers. Technically, morphological identification of animal fibers was regarded as a problem of pattern recognition. She et al. 8 extracted nine scale parameters of merino wool and mohair via image processing. A total of 280 scales of merino fibers and 280 scales of mohair fibers were collected as samples. An artificial neural network (ANN) model was constructed for image classification. The feature vectors extracted from samples were fed into the ANN model and the recognition rate reached 94.6%. Ma et al. 9 measured eight characteristic parameters from wool and cashmere fibers. A support vector machine (SVM) was chosen as classifier for supervised classification. This method achieved an identification accuracy near 89.0%. Shi and Wu 10 extracted four shape parameters from micrographs of cashmere and fine wool fiber and established a multi-parameter Bayes model. A total of 100 cashmere fibers and 100 wool fibers were selected as a dataset. The Bayes model achieved an identification accuracy of 90.5%.
However, these methods were limited by the quality of the micrographs. For some blurry images, it is difficult to measure exact shape parameters such as scale height and scale area. Instead of calculating geometric characteristics of fibers, some researchers deciphered scale patterns by means of other methods. Zhong et al. 2 transferred the microscopic images of wool and cashmere fibers into projection curves. In order to reveal the numerical features embedded in the projection curves, they compared three different approaches, including discrete wavelet transform (DWT), direct geometrical description (DGD), and recurrence quantification analysis (RQA). The numerical features were fed into three classifiers, ANN, SVM, and Kernel ridge regression (KRR), to perform supervised classification. Experimental results demonstrated the combination of RQA and SVM achieved the best accuracy.
During the last few years, the bag-of-words (BoW) approach has drawn significant attention in the field of image classification and object recognition. It has been successfully applied to many fields, such as medical image analysis and industrial inspection, and has achieved good performances.11–13 The BoW model in computer vision originated from the BoW method for document classification. 14 In document classification, a document can be represented by a histogram of words. In the BoW model for image classification, an image can be represented using a histogram of image features. An image was considered as a document by treating image features as words. In order to achieve this, the features of images were defined as “codewords,” 15 which are represented by vectors. In this sense, image classification is converted into the classification of a collection of vectors.
In the BoW approach, SVM commonly outperforms other classifiers, including Naïve Bayes and Hierarchical Bayesian models, for image classification. 14 Since an image was represented as a histogram of vectors, the histogram intersection kernel could be chosen as a kernel function of SVM in the BoW approach.13,14,16 However, information about the spatial arrangement of features in the image was not considered in the histogram intersection kernel. For this problem, Grauman and Darrell 17 proposed the spatial pyramid match (SPM) kernel based on different levels of resolution. Lazebnik et al. 18 further improved the SPM kernel. SPM maps the features, which were represented as histograms of codewords, to a multi-dimensional multi-resolution histogram. The major advantage of SPM is that it can capture co-occurring features to show promising results in many applications.17,19 This paper focuses on the evaluation of the BoW with SPM approach for the SVM based classification of cashmere/wool fiber micrographs.
Methods
In this paper, fiber identification was reached in three steps. In the first step, we performed image preprocessing to enhance the features and to remove the noise. In the second step, we constructed a bag-of-words model to reformulate the features of fibers. In the third step, we employed SVM as the classifier to obtain the identification result. For convenience of explanation, in the following sections, the bag-of-words model will be abbreviated to BoW. The bag-of-words with spatial pyramid match model is abbreviated to SPM.
Sample collection and image preprocessing
The cashmere samples were collected from several different origins, including Inner Mongolia, Shanxi, and Tibet. The wool samples were collected from Inner Mongolia. Samples were prepared in the form of tops by the Erdos Group. Fiber images were captured with 10 × 50 magnification via an optical microscopic system (CU-5), which was manufactured by Beijing UVTec Co., under ISO 137-1975, IWTO-8-97, and GB/T 10685-2007. Microscope images were stored in “bmp” format as 768 × 576 pixels in size. Each image contained only one fiber (cashmere or wool) and the majority of the fiber trunk was clearly captured. All fiber images had been pre-labeled as wool or cashmere by seasoned experts. It is worthwhile mentioning that the total number of samples was equal to the total number of microscopic images. Therefore, the identification of animal fibers was transformed into the classification of fiber images.
Typically, the optical micrographs of fibers may not be ideal; as shown in Figure 1, bubbles and impurities may appear. There were even a small number of blurry images in the sample. Since the information for fiber identification is contained in the surface of the fiber instead of the background, fibers were segmented from the background before feature extraction. Taking the wool fiber in Figure 1(b) as an example, the detailed steps of image preprocessing follow. Figure 2 is the flowchart for image preprocessing.
Original microscope images of cashmere and wool fibers. (a) Original cashmere fiber. (b) Original wool fiber. The flowchart of image preprocessing.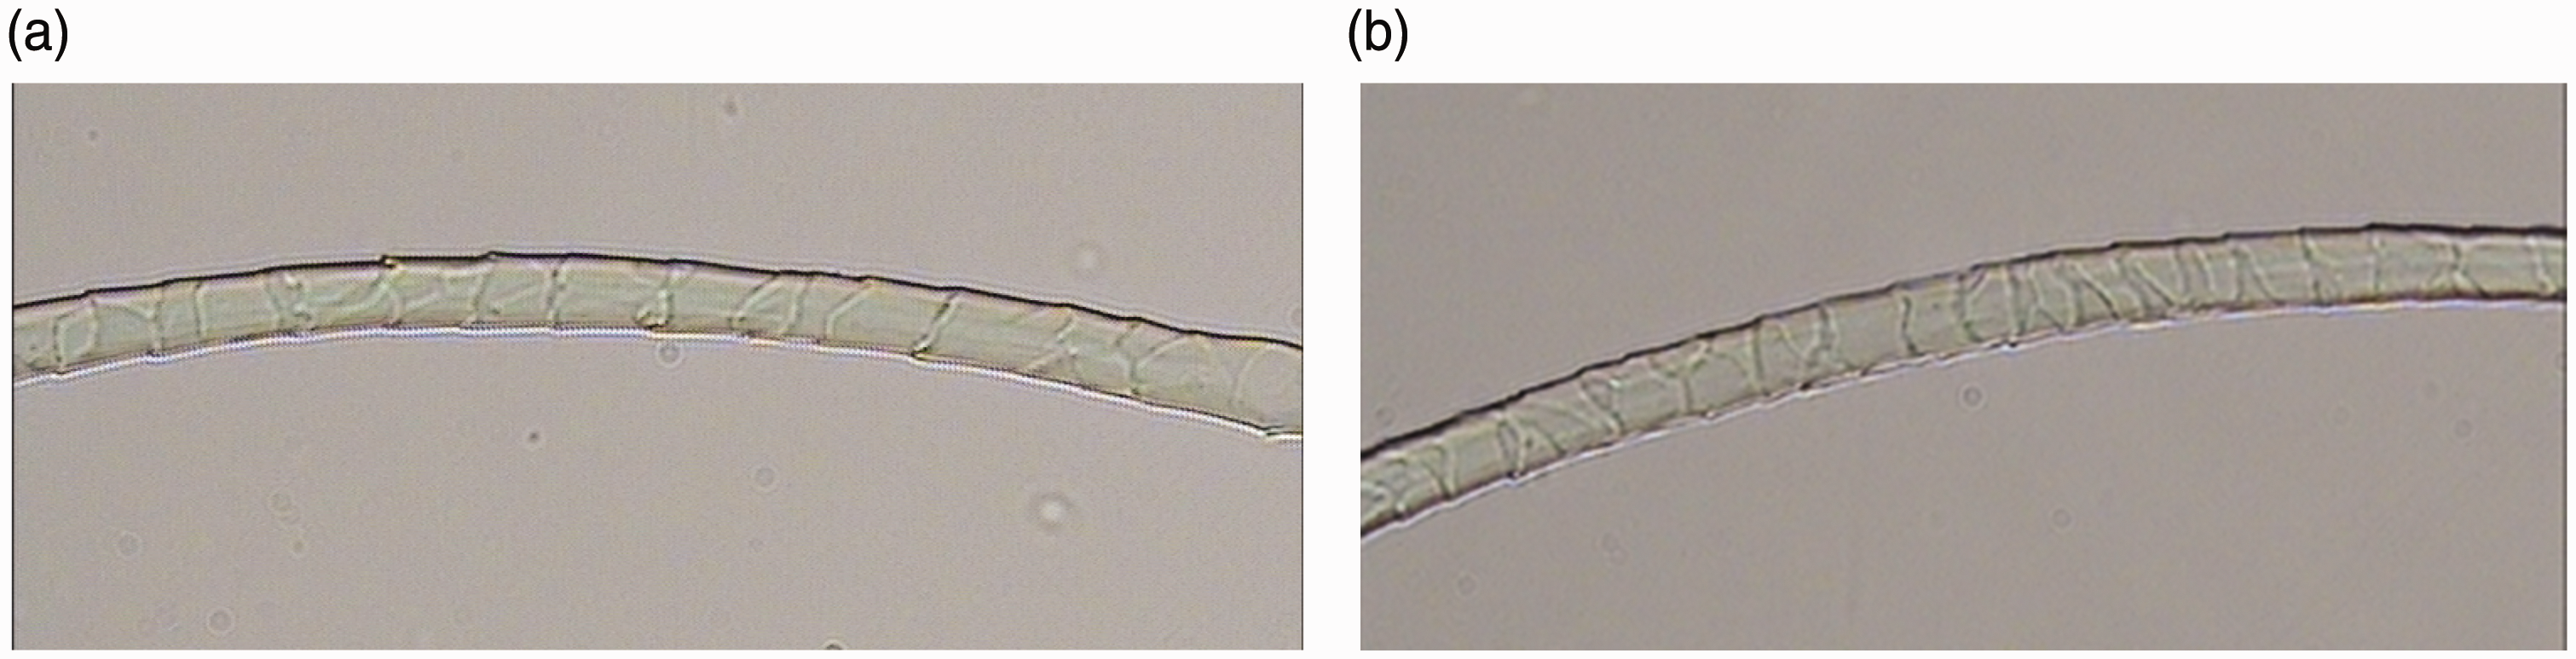

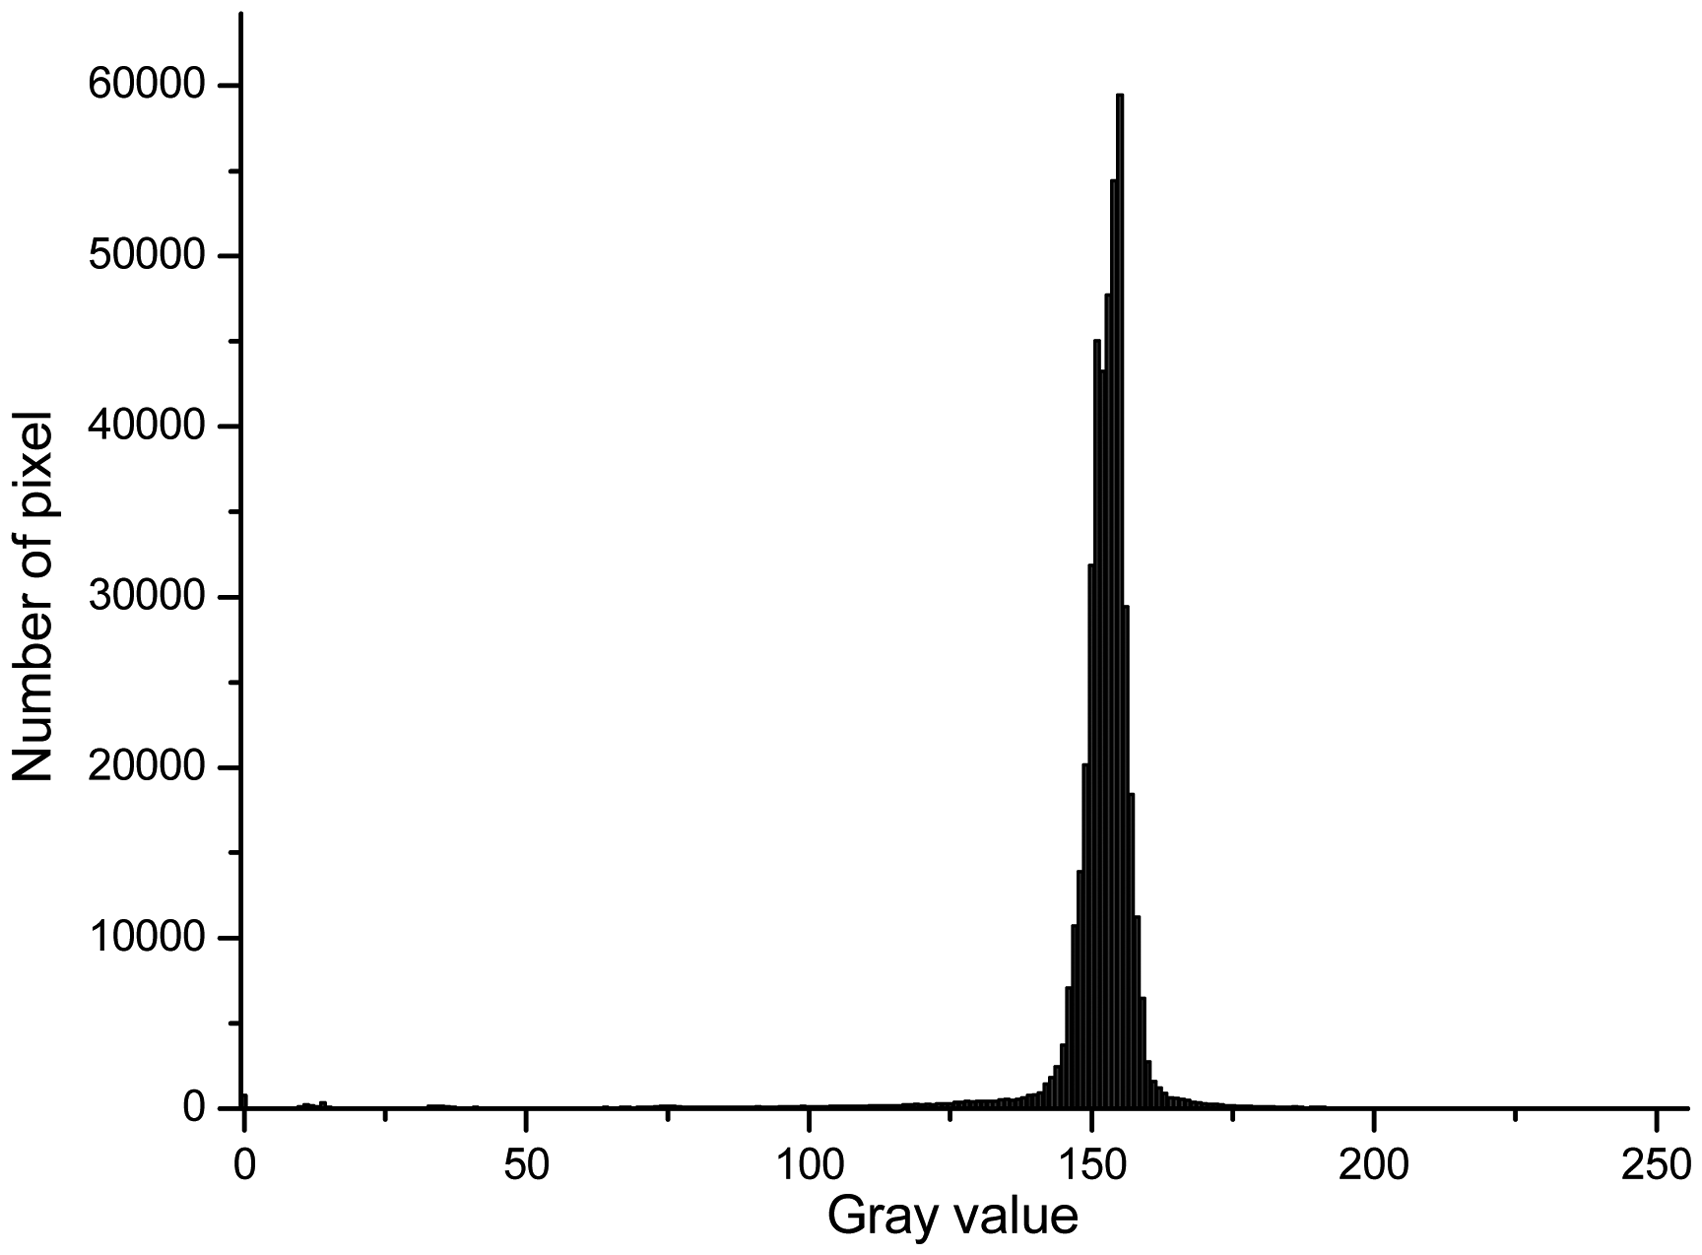
Step 1. Image preprocessing. (a) Highpass filtering. (b) Contrast stretching. (c) Binarizing. (d) Removing small connected components. (e) Filling margin. (f) Segmenting from background. Gray level histogram of the wool image.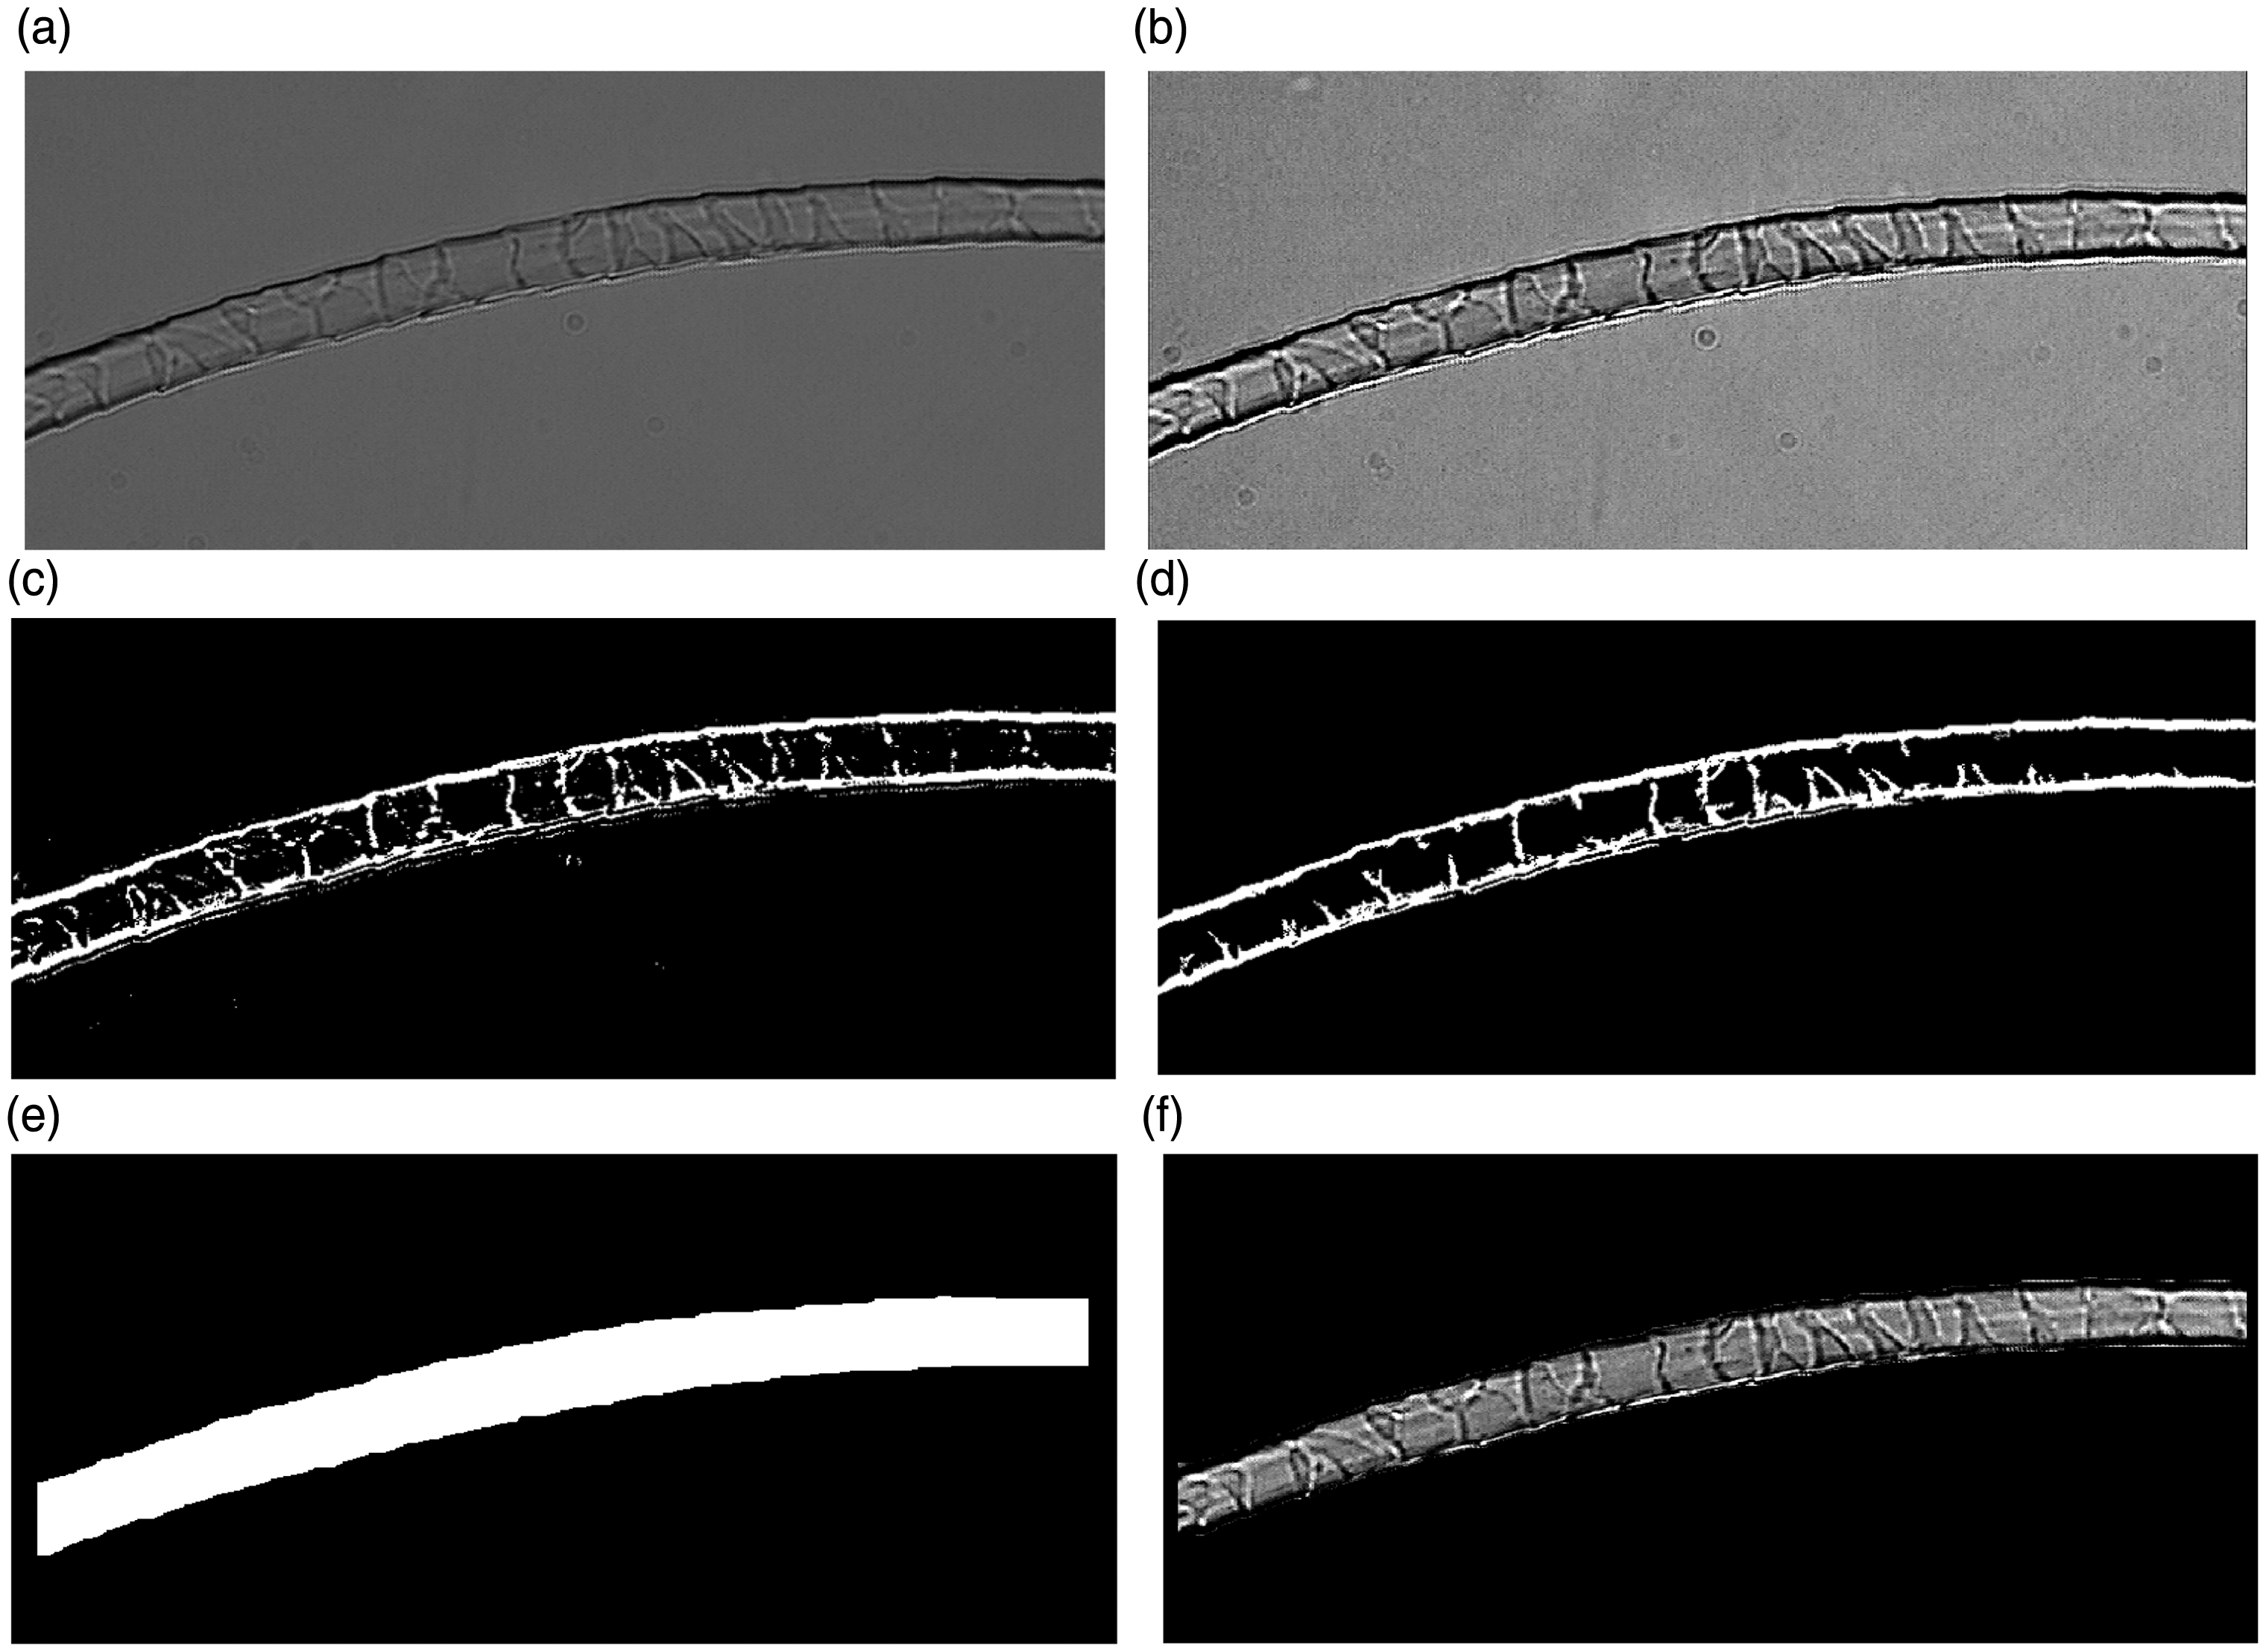
Step 2.
Step 3.
Bag-of-words model
As shown in Figure 5, image classification with BoW mainly includes three stages. In the first stage, the local features of the images were detected and described by a local descriptor. In the second stage, the feature descriptors extracted from the images were clustered. Each cluster center was taken as a codeword and all codewords constituted a codebook. Therefore, each image can be represented by a histogram of codewords. In the third stage, a classifier was trained for image classification. The detailed explanations follow.
The three stages of BoW.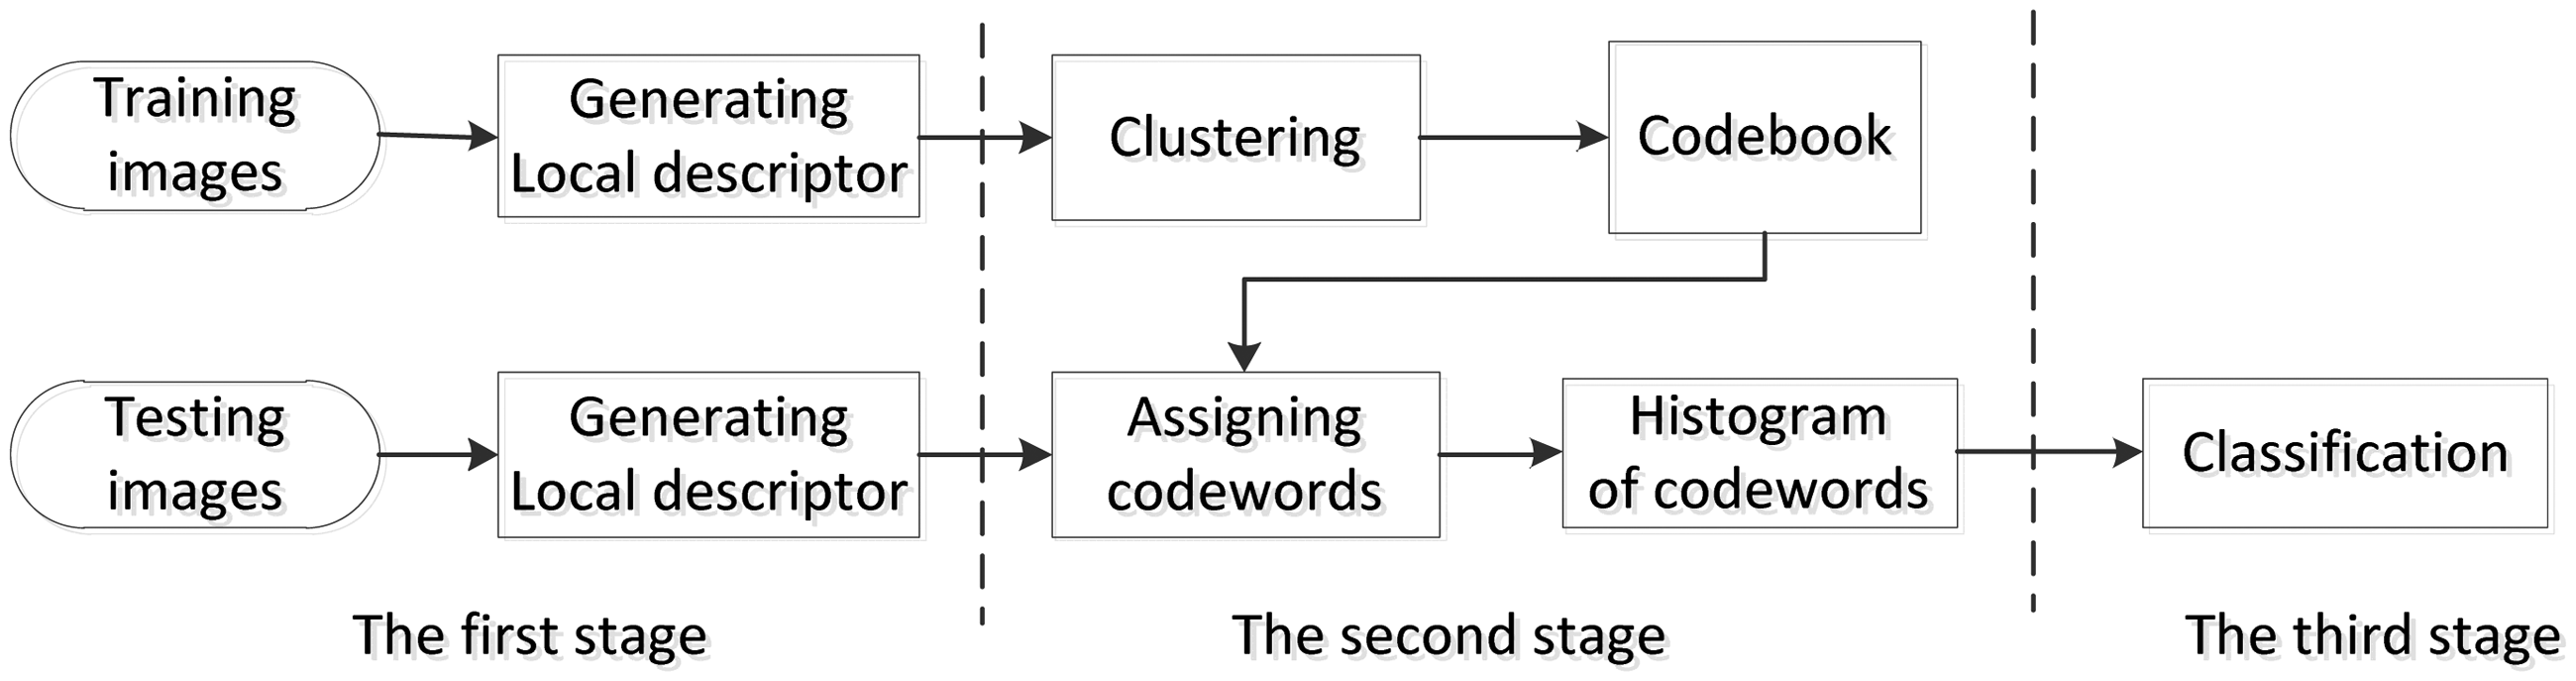
Feature extraction
In our study, the scale invariant feature transform (SIFT) method was chosen to represent the fiber images. 21 SIFT descriptors are invariant to translation, rotation, and image scale. Compared with other local descriptors, SIFT descriptors performed best in image classification. 22 The SIFT algorithm consists of four steps: detecting local extrema, locating the keypoints, assigning the dominant orientation for each keypoint, and generating keypoint descriptors.
Step 1.

Second, the Difference of Gaussians (DoG) images were generated by the subtraction of two successive Gaussian blurred images. A DoG image

Thirdly, each pixel in the DoG image was compared with its neighbors. The pixels with the extrema (maximum/minimum) were treated as the candidate keypoints.
Step 2.
Step 3.
Step 4.
Codebook construction and image representation
As shown in Figure 6, the descriptors extracted from each image in the training set were collected together. Each descriptor (vector) was considered as a point in a multi-dimensional space. A K-means clustering algorithm was applied to convert similar descriptors to a cluster. The final cluster centers were defined as codewords (analogous to words in a document), which was regarded as representative of several similar descriptors. After clustering, all descriptors were converted to a collection of codewords. The collection of codewords was called a “codebook.”
15
Therefore, each descriptor in the images can be mapped to a codeword and each image can be represented by a histogram of codewords. The histogram representation for a fiber image is
Fiber image representation using BoW.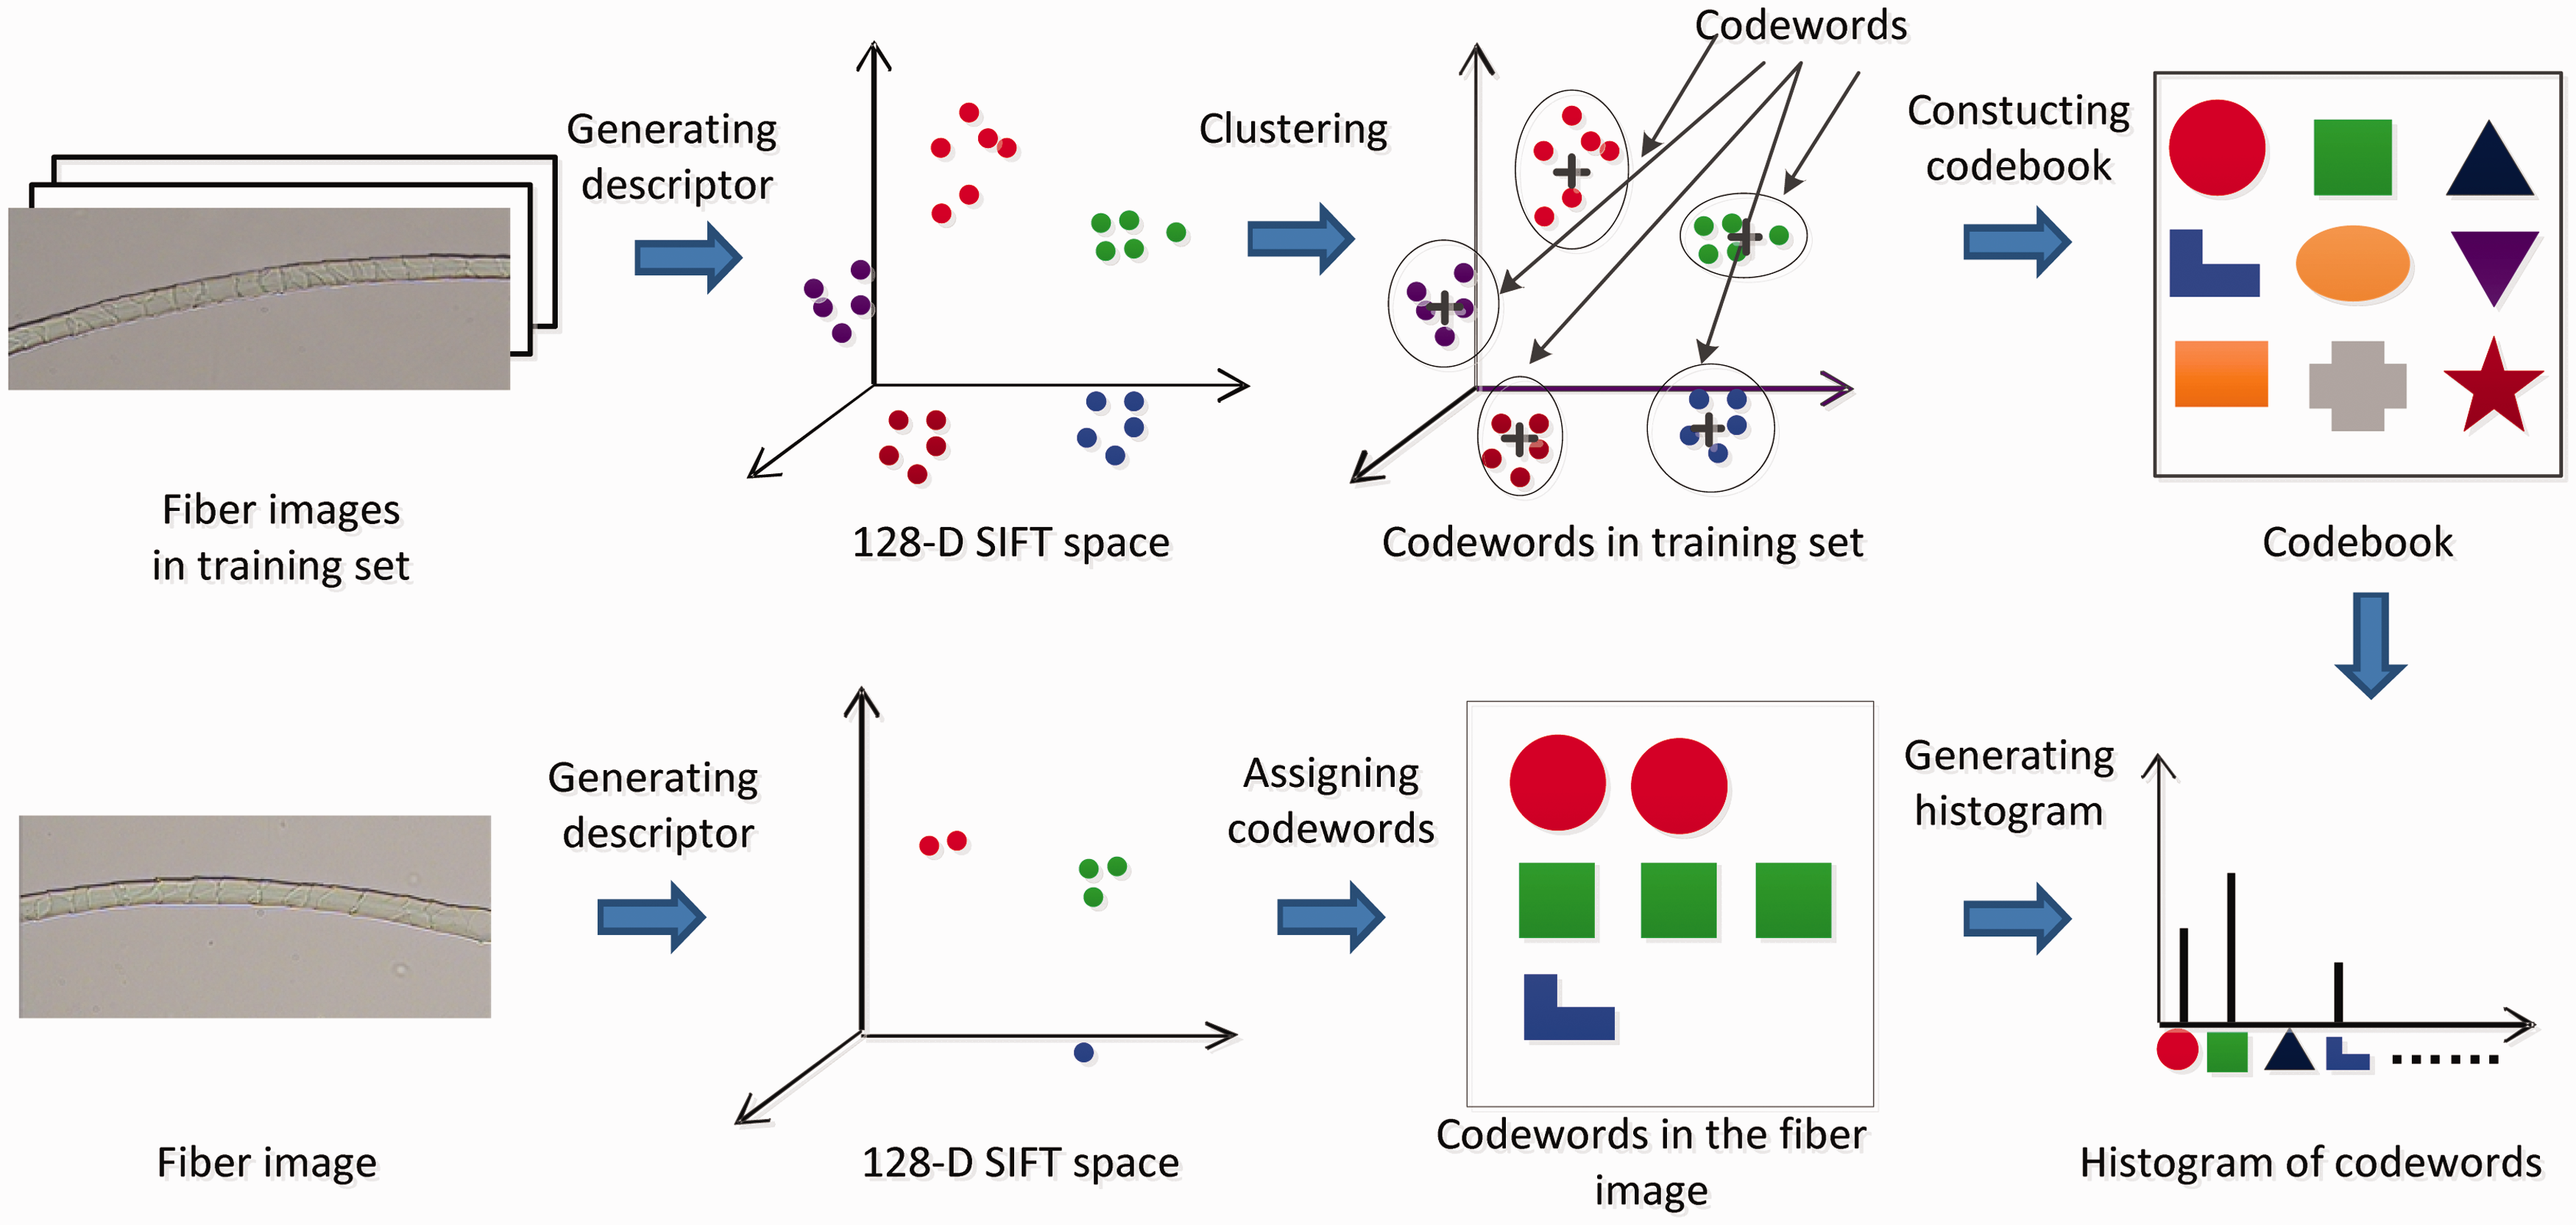

Classification
Support vector machine
In our study, SVM was chosen as the classifier to perform binary classification. SVM is one of the most popular supervised learning methods for classification and regression. It can create a hyperplane as a decision boundary in high dimensional space and classify the dataset. The hyperplane has the largest distance to the nearest data of every class. The optimal hyperplane is achieved by training a number of data. The error function is defined as follows


Spatial pyramid match kernel
The BoW model with SPM is an extension of the standard BoW. The SPM kernel can map the features of images to multi-resolution histograms and measures the similarity between images. In SPM, the feature vectors extracted from images can be regarded as points in a multi-dimensional feature space.
To represent the multi-resolution, as shown in Figure 7, an image was averagely divided into a sequence of grids at resolution 0, …, L. At the top in Figure 7, the image, which contains three feature types (codewords), is partitioned into three successive levels of resolution. At the bottom in Figure 7, for each level, the number of features falling in each grid cell is counted. According to Equation (6), each spatial histogram is weighted. SPM kernel An example of a three-level spatial pyramid.

Figure 8 is an example of matching for one feature type between two images. As shown in Figure 8, the three rows correspond to three successive levels of resolution l+2, l+1 and l, respectively. In Figure 8(a), two images are represented as two feature (points) sets, X and Y. Each grid corresponds to a bin at this level. The green bold lines indicate the new matches formed at this level. The black bold lines indicate a match that already occurred at a finer level. In Figure 8(b), the histograms of X (blue) and Y (red) show the number of features in a certain grid at this level. In Figure 8(c), the intersections between the histograms in Figure 8(b) are shown. For example, the new matches found at three levels of resolution are 2, 2, and 1, respectively.
An example of matching at three levels of resolution. (a) Points sets, (b) Histograms pyramids and (c) Intersection.
For simplicity, Figure 8 only considers an example of a single feature type. Usually, an image contains various feature types. For M feature types,
Experimental results and discussion
Experimental setup
A sample set with 1458 fiber images (cashmere and wool) was prepared. We performed three experiments to evaluate our approach. In the first experiment, we investigated the choice of the size of codebook and the level of resolution. In the second experiment, we compared the performance of the original images and images segmented from the background. In the third experiment, the fibers (cashmere and wool) were selected to form several datasets with different blend ratios. We evaluated the stability of SPM on these datasets. All the experiments were run on an Intel(R) Xeon(R) E5-2620 v3 CPU@2.0GHz machine with 24GB memory.
For each dataset, we randomly selected 70% of the fiber images of the dataset as a training set and the remaining 30% as a testing set. The identification accuracy of cashmere and wool was defined as


Experimental study
The choice of the size of codebook and level of resolution involves the trade-off between generalizability and discriminability. 23 In this experiment, we investigated the performance of SPM at various sizes of codebook and different levels of resolution. A total of 1458 fiber (737 cashmere and 721 wool) images were chosen as the dataset. Twelve sizes of codebook were selected: 50, 100, 200, 300, 400, 500, 600, 700, 800, 900, 1000, and 1200. Five successive levels of resolution were set to 0, 1, 2, 3, and 4. In fact, SPM is equal to the standard BoW model when the level of resolution is set to zero. 18
As shown in Figure 9, five curves represented the performance of SPM at different levels of resolution. The size of codebook and the level of resolution had an obvious impact on the accuracy of classification. Meanwhile, these curves showed a similar trend. The identification accuracy at each level was low when the size of codebook was small. This indicated that the small size of codebook could not afford adequate discrimination for the two kinds of fiber images. With an increase in the size of codebook, the performance started to rise. When the size was set in the range (500, 800), SPM at each level of resolution achieved a higher identification accuracy. The accuracy did not increase significantly or even began to fall (level 0, 1, and 2) when the size of codebook exceeded 800. Two reasons are responsible for the decline. The first one is that only limited features are contained in fiber images. When excessive codewords were chosen in the training stage, similar features were assigned to different codewords. This led to weak discrimination for fiber images in the testing set. The second reason is that too many codewords generated a model over-sensitive to disturbances such as blurring and noise caused by the intrinsic nature of fiber micrographs. These two reasons together led to a poorer generalization of the testing set when the size of codebook was too large.
Accuracy of SPM at different scale levels.
It is noticed that the curves at levels 3 and 4 did not decline when the size of codebook exceeded 800. The possible reason is that, although an excessively high level of resolution reduced the generalization ability of the model, SPM with higher levels combines multiple levels of resolution. It kept the stability of the model. 18 Csurka found that a high performance was achieved at an intermediate size of codebook, rather than a large size of codebook. 14 This coincided with our observation that SPM with level 2 achieved the best performance for codebooks with a size over 50. Considering the identification accuracy and the dimensions of features, an SPM model with a resolution level of 2 and a codebook size of 600 was chosen in subsequent experiments.
We further investigated the impact of the size of codebook by comparing the error rates of the training set and testing set. In this experiment, the dataset still contained 1458 fiber (737 cashmere and 721 wool) images. Fourteen sizes of codebook were selected: 50, 100, 200, 300, 400, 500, 600, 700, 800, 900, 1000, 1200, 1400, and 2000. Figure 10 exhibits the error rate of identification at resolution level 2 for the training set and testing set under various sizes of codebook. The identification error for the training set decreases with increasing size of codebook. For the testing set, the lowest error was achieved when the size was 600. The error began to go up when the size of codebook was greater than 800. To avoid over-fitting, as shown in Figure 10, choosing an appropriate size of codebook is very necessary.
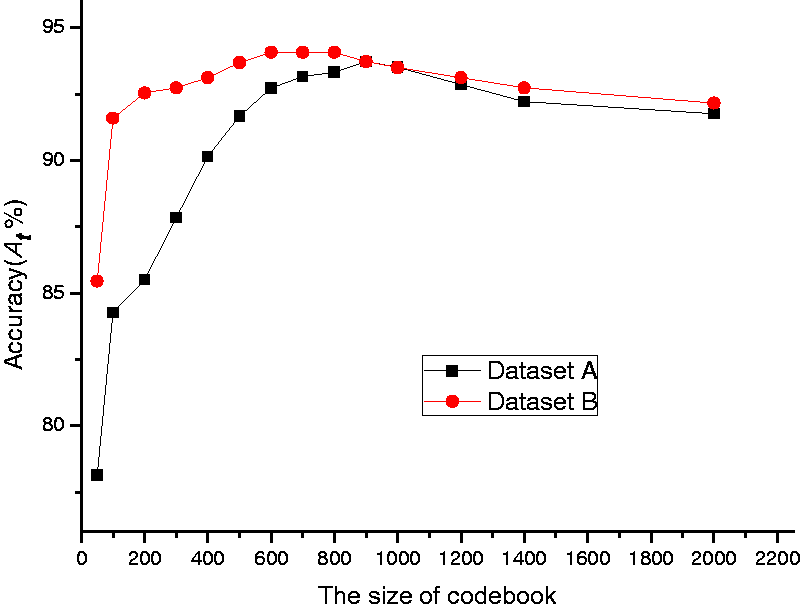
In order to evaluate the effect of image segmentation on performance, we compared the identification accuracies between treated and untreated images, respectively. Each dataset contained 737 cashmere and 721 wool fibers. The dataset with untreated images was called dataset A, and the dataset containing images after image segmentation was called dataset B. According to the foregoing discussion, the resolution level was set to 2. Figure 11 exhibits the performance of SPM under various sizes of codebook for these two datasets. Obviously, the identification accuracies in dataset B outperformed those of dataset A. This indicated that the proposed image segmentation delivered a positive contribution in enhancing the identification accuracy. Although the highest accuracies under the two datasets were almost the same, the dimensionality of feature vectors was much lower when the size of codebook was 600. This means the cost of computation was reduced significantly.
Accuracy of the training set and testing set. The performance of SPM in original images and segmented images.
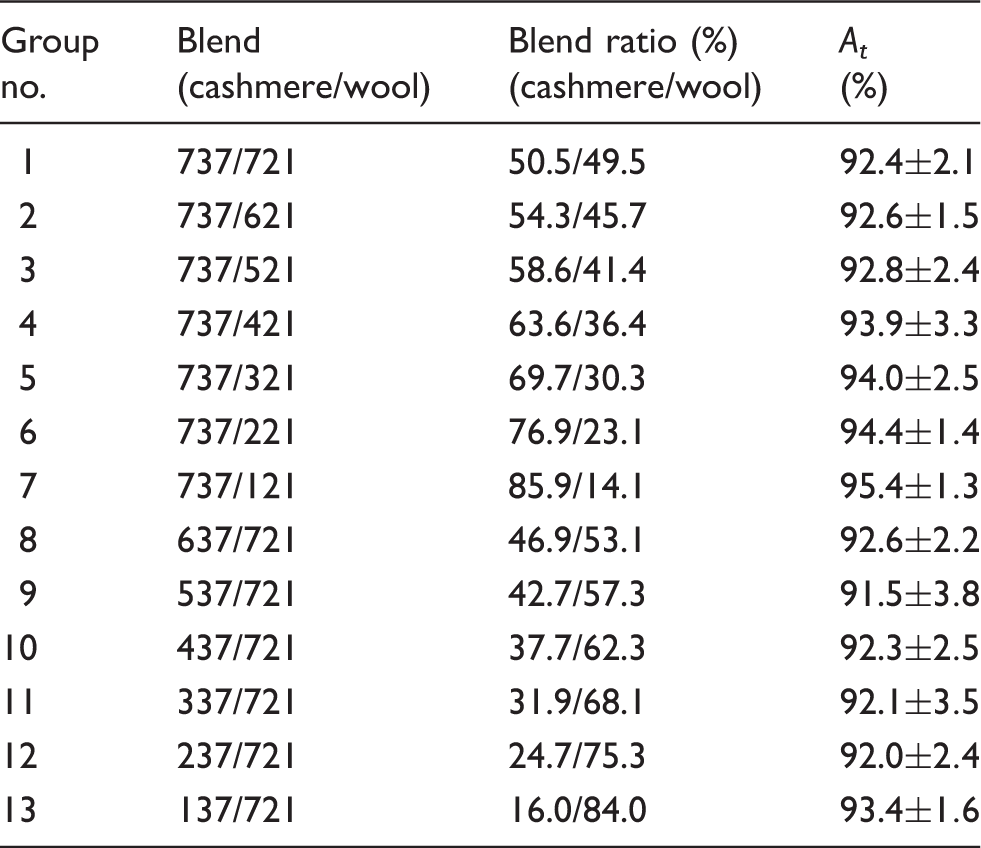
The performance of spatial pyramid match under different blend ratios
Conclusion
This paper presented an evaluation of the BoW with SPM model to identify the microscopic images of cashmere and wool fibers. This is the first systematic investigation of this representation scheme in the field of fiber identification. Several experiments were performed to evaluate the performance of the model. Firstly, we compared the identification accuracy of the model at various sizes of codebook and different levels of resolution. Considering discrimination and generalization, a codebook size of 600 and a resolution level of two were recommended in the model. Secondly, by comparing the processed images and the original images, it was found that the former could retain effective information contained in the images and lower the cost of computation. Finally, experiments were performed under datasets with different blend ratios. Results indicated that the identification accuracy is stable for the model to identify cashmere and wool fibers.
Footnotes
Declaration of conflicting interests
The authors declared no potential conflicts of interest with respect to the research, authorship, and/or publication of this article.
Funding
The authors disclosed receipt of the following financial support for the research, authorship, and/or publication of this article: This work was supported by National Natural Science Foundation of China (Grant No. 61572124), and the Fundamental Research Funds for the Central Universities (Grant No. CUSF-DH-D-2016016).