



Abstract
Polyurethane (PU) coating became popular in recent decades to achieve water resistance in clothing fabrics with enhanced visual properties. But reduced breathability of coated fabric is a setback for the clothing industry; therefore, there have been various attempts to achieve breathable water-resistant coatings. A new and facile method of enhancing breathability of PU-coated fabrics, which has been called micro-cracking, has been recently studied and highly encouraging outcomes have been obtained for the use of the process in industry. But when any process is considered to have industrial applications, it is essential to conduct not only the optimization but also modeling studies to find out whether the outputs are predictable; the process is controllable and allows us to see how the results are affected by process parameters. This work conducts a modeling study of micro-cracking processes of PU-coated samples to complete this evaluation. For this purpose, an artificial neural network (ANN) and a least square support vector model (LS-SVM) are developed for the prediction of various properties of PU-coated fabrics after micro-cracking. The results showed that the effects of micro-cracking process on various properties of coated fabric could be predicted through ANN or LS-SVM modeling; specifically, the ANN exhibited better performance in the test set of the data. Thus, it is concluded that the results and the measurements were found to be compatible for defining the process as an industrial alternative.
Coating with various polymers is used to impart new properties to textile fabrics like water resistance, flame retardance, antibacterial properties, UV resistance and abrasion resistance, creating a non-homogeneous composite structure.1–6 Polyurethane (PU) coating has increased its popularity in recent decades as it achieves water-resistant textile fabrics with enhanced appearance; however, breathability (the ability of fabric to allow the transmission of water vapor and air) is also crucial when considering the coating of garment fabrics. There are several ways to achieve breathable water-resistant coating: from densely woven 100% cotton fabrics to polytetrafluoroethylene (PTFE) membrane lamination. After the PTFE membrane approach had huge commercial success, several manufacturers developed breathable coatings based on modified PU, since PU synthesis and modification is an easier and cheaper process. In this case, PU is chemically modified by introducing ionic or nonionic hydrophilic segments that make the final polymer water- or solvent-soluble. 7 Micro-porous polymer coating is another commercially available application. The know-how for this utilization depends on producing micron-level pores through the ionic polymer layer (PU is most suited for this purpose) by the phase separation process as a result of selective evaporation of solvent and non-solvent. 8
A new and facile method of enhancing breathability (air and water vapor permeability) in PU-coated fabrics has been recently studied, so-called micro-cracking. The process starts with coating of the sample fabric with a conventional PU polymer. The coated sample is then dipped into a bath including polar solvents, which were previously used as solvents in PU preparation, followed by drying in the laboratory environment. The results show that micro-cracking processes increase water vapor and air permeability of coated fabric, but the permeability values are still significantly lower than those of an uncoated sample. It has been concluded that the decomposition effect of micro-cracking in the solvent bath is considerably reduced, giving higher water resistance than in the uncoated fabric. A comparison has also been conducted between a PU-coated sample (micro-cracked via the process parameters giving the highest enhanced breathability while retaining water resistance) and a commercially available PU membrane-laminated sample for breathability performance. The results showed that micro-cracking process resulted in higher air permeability than the membrane-laminated sample, and a similar water vapor permeability value would be achieved for a lower coating density. This comparison was highly encouraging for introduction of the process for industrial purposes. 9
When any process is considered to have industrial applications, it is essential to conduct optimization and modeling studies to find out if the process outputs are predictable and the data obtained through measurements are reliable. Undoubtedly, analytical models allow researchers to produce reliable, repeatable decisions and results. Using modeling highlights the repeatability of experiments and reproducibility of findings, and it is also accepted that the industry is eager for any process that will allow control of and knowledge regarding how the outputs are affected by the process parameters.10–12
Modeling
In cases where abundant data like measurement results are available, the major tools for modeling are artificial neural networks (ANNs) and the support vector model (SVM). ANNs are powerful tools that have the ability to identify highly complex relationships between input and output data. 13 They have been extensively studied to process models, and their use in industry has been growing rapidly. The SVM is a machine-learning technique based on statistical learning theory and the structural risk minimization principle. The SVM uses quadratic programming optimization to identify model parameters, while avoiding local minima, and has an advantage over other regression methods. A modified version of SVM, called the least square support vector model (LS-SVM) results in a set of linear equations instead of a quadratic optimization problem. 14
ANN modeling
An ANN is an information-processing system that roughly replicates the behavior of a human brain by emulating the operations and connectivity of biological neurons. 15 It performs human-like reasoning, learns attitudes and stores the relationships of the processes on the basis of a representative dataset that already exists. In general, neural networks do not need a detailed description or formulation of the underlying process and thus appeal to practicing engineers who tend to mostly rely on their own data.16–20 Recently, neural networks have been successfully applied to process modeling and control of textile surfaces.21,22
A typical ANN has feed-forward architecture and consists of three or more layers of neurons: one input layer, one output layer and one or more hidden layers (Figure 1). Each of the layers has a set of connections, with a corresponding scalar weight between itself and each neuron of the preceding layer. When the weight of a particular neuron is updated, it is said that neuron is learning and the ANN is training. In a feed-forward back-propagation ANN, the input data ANN architecture.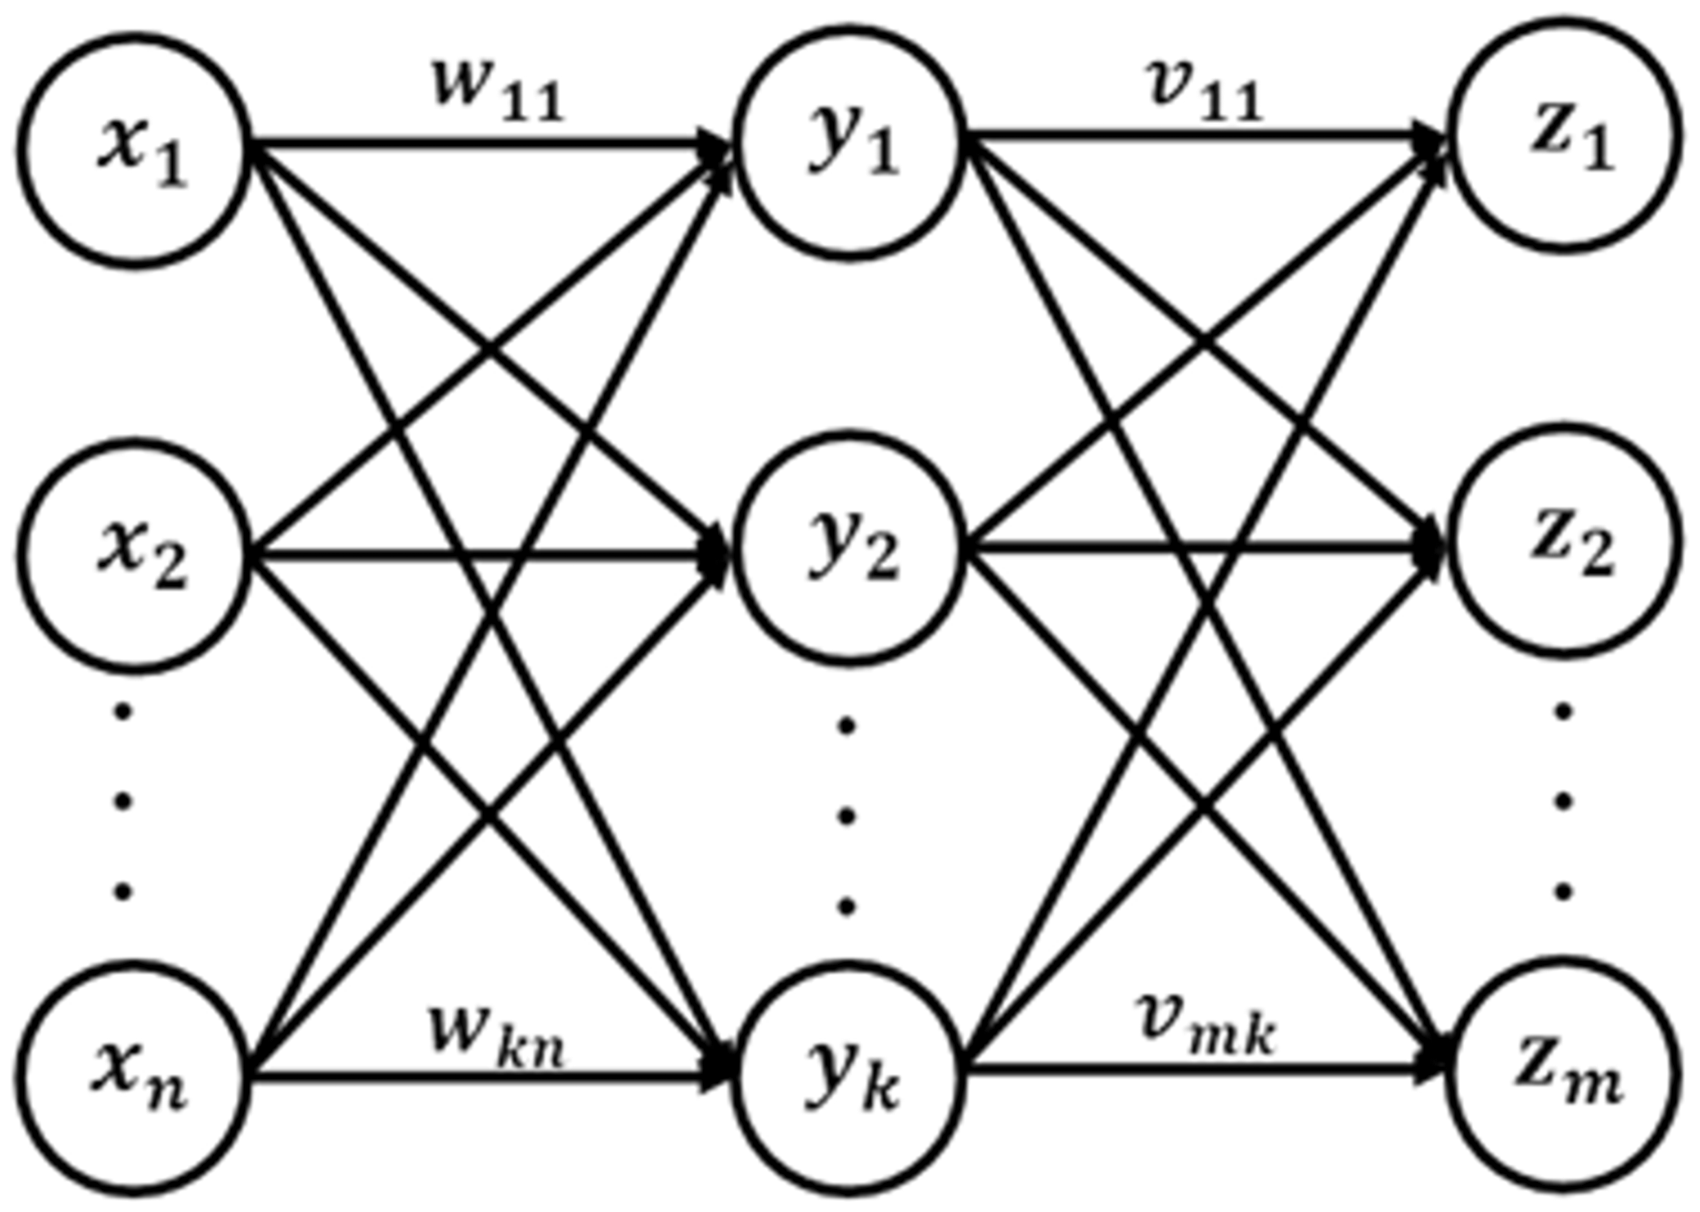


The most commonly used activation functions in ANN architectures are linear (purelin) and sigmoid (logsig) transfer functions. A transfer function determines the relationship between inputs and outputs of a neuron and a network. Selection of transfer function for layers is an important parameter. The best structure of transfer functions is evaluated on the basis of mean square error (MSE) of the training dataset. logsig function produces outputs in the range of 0 to 1, and it can be defined as:


In this study, the optimum configuration is achieved by using the purelin transfer function in the output layer and using logsig in the hidden layer.
LS-SVM modeling
The SVM was first introduced by Vapnik
23
and is an efficient technique for problems characterized by small samples, nonlinearity, high dimension or local minima.
24
The SVM uses quadratic programming optimization to identify model parameters, while avoiding local minima, and has an advantage over other regression methods.
25
The SVM shows outstanding performance since it can lead to global models that are often unique by embodying the structural risk of the minimization principle. Furthermore, sparse solutions can be found. However, building the SVM model is computationally difficult because it involves a solution of a nonlinear optimization problem. A modified version of SVM, called the LS-SVM, was proposed by Suykens and Vandewalle.
24
This model results in a set of linear equations instead of a quadratic optimization problem as in the original SVM. A general LS-SVM architecture is given in Figure 2.
LS-SVM architecture.
The standard LS-SVM algorithm can be defined for a given set of training data:
26



The constraint of that problem is described as:


Here,





In equation (15),

Thus, the LS-SVM can be obtained as:

This study aims to develop an ANN with a feed-forward back-propagation learning algorithm and LS-SVM models for the prediction of various textile-related properties of PU-coated fabrics after micro-cracking. There is not much study on LS-SVM modeling of textile treatments in the literature. This work is also a comprehensive comparison of two models. It has been stated before that SVM-based approaches are comparable to ANNs in accuracy; 28 however, due to much greater robustness, they are more recommended for industrial applications. In this article a brief description is given for the micro-cracking process, the measurements obtained and the models proposed. The results and the measurements were found to be compatible for assessment of the process as an industrial alternative by showing that the process could be modeled.
Materials and method
Constructional properties of the fabrics

*PU coating at 0.2 mm blade distance ** PU coating at 0.4 mm blade distance.
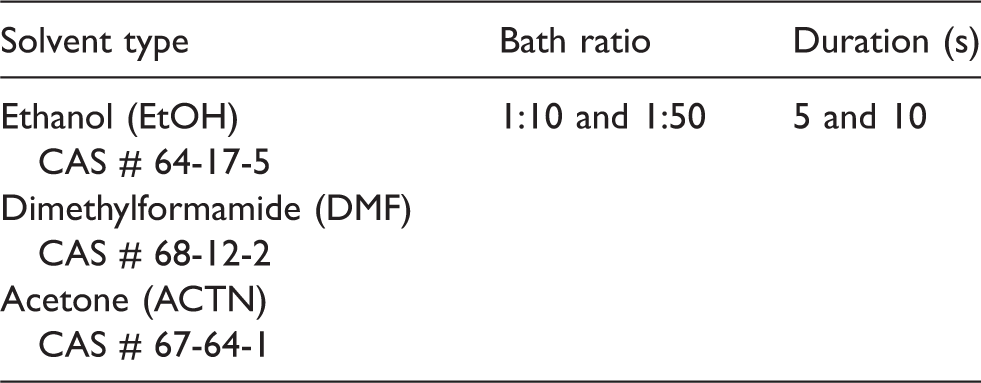
The micro-cracking bath variables
Measurement
The coated and micro-cracked samples were subjected to air permeability (ASTM D737-75), water vapor permeability (EN ISO 11092), water vapor resistance (EN ISO 11092), water resistance (EN ISO 811), wicking (DIN 53924) and breaking strength and elongation (ASTM D5035) and abrasion resistance (EN ISO 12947-3) measurements to complete the dataset for the modeling study. The measurement procedures are detailed elsewhere.7,9,29,30 All the measurements were completed in the controlled laboratory environment at about 24℃ and 55% RH and repeated three times. The average of three measurements was taken for each parameter.
Fifty-two data points (four of them belonging to coated but not micro-cracked fabrics; and others obtained through the combination of the process parameters) delivered from the measurements were divided into training and test sets randomly (accomplished by the modeling software). Thirty-six data points were used for training and the rest were used for the test set. The same training and test sets were used for both models.
The input data for the models were density, molecular weight and vapor pressure at 20℃ values of the solvents as given by Reichardt and Welton, 31 along with bath ratio and duration in the bath values as mentioned in Table 2. Fabric density and weight increase of samples after coating are given in Table 1. The outputs were air permeability (dm³/s), water vapor permeability (%), water vapor resistance (Pa.m2/w), wicking in weft direction (mm), wicking in warp direction (mm), water resistance (mbar), breaking strength in weft direction (N), breaking strength in warp direction (N), breaking elongation in weft direction (%), breaking elongation in warp direction (%) and abrasion resistance (%) values of the coated and micro-cracked samples to which the process was applied in differing solvent types, bath concentrations and durations.
The number of neurons and activation functions used in ANN

All data were normalized to be between 0 and 1 using equation (3) in order to increase accuracy of both models and prevent any parameter from dominating the output. The output data were later denormalized after actual application in the models.
For the development of the models, Neural Network Toolbox, LS-SVM Lab v1.7 and MATLAB 7.0 were used. A MATLAB script was written for each model that loaded the data file, trained and validated the network and saved the model architecture.
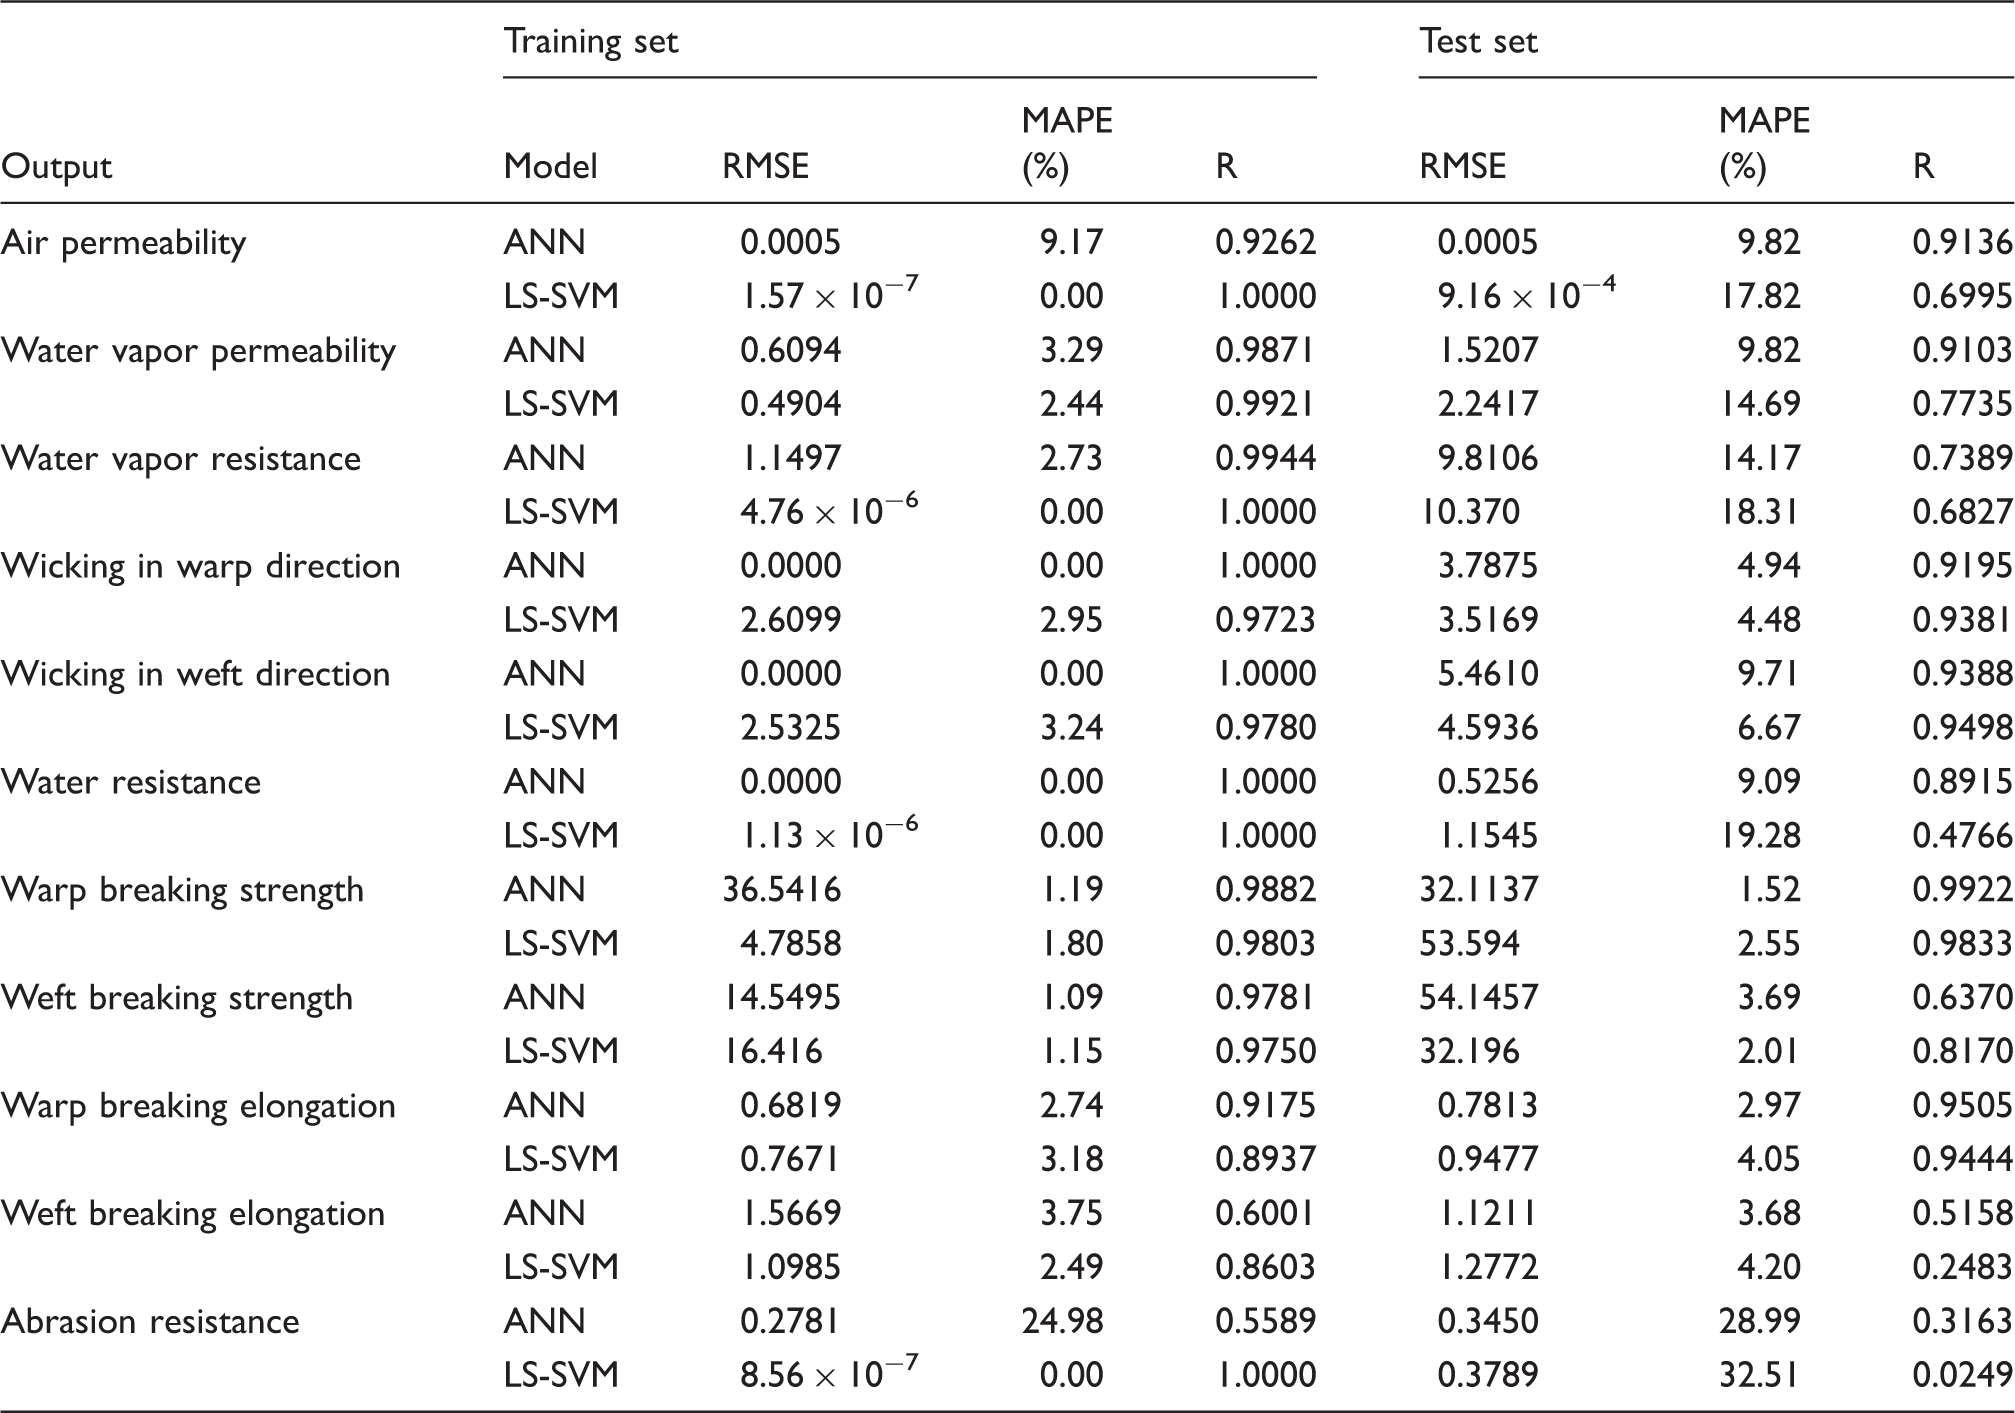
The model performances were then assessed by evaluating the scatter between the experimental and predicted results via statistical parameters – that is, correlation coefficient (R), mean absolute percentage error (MAPE %) and root mean square error (RMSE). The statistical values were determined as follows:



Results and discussion
The experimental data obtained from the samples were used for the modeling computations. The modeling results are given in Figures 3–13, showing training and test sets.
Air permeability of the samples. (a) Training and (b) test data for the ANN model. (c) Training and (d) test data for the LS-SVM.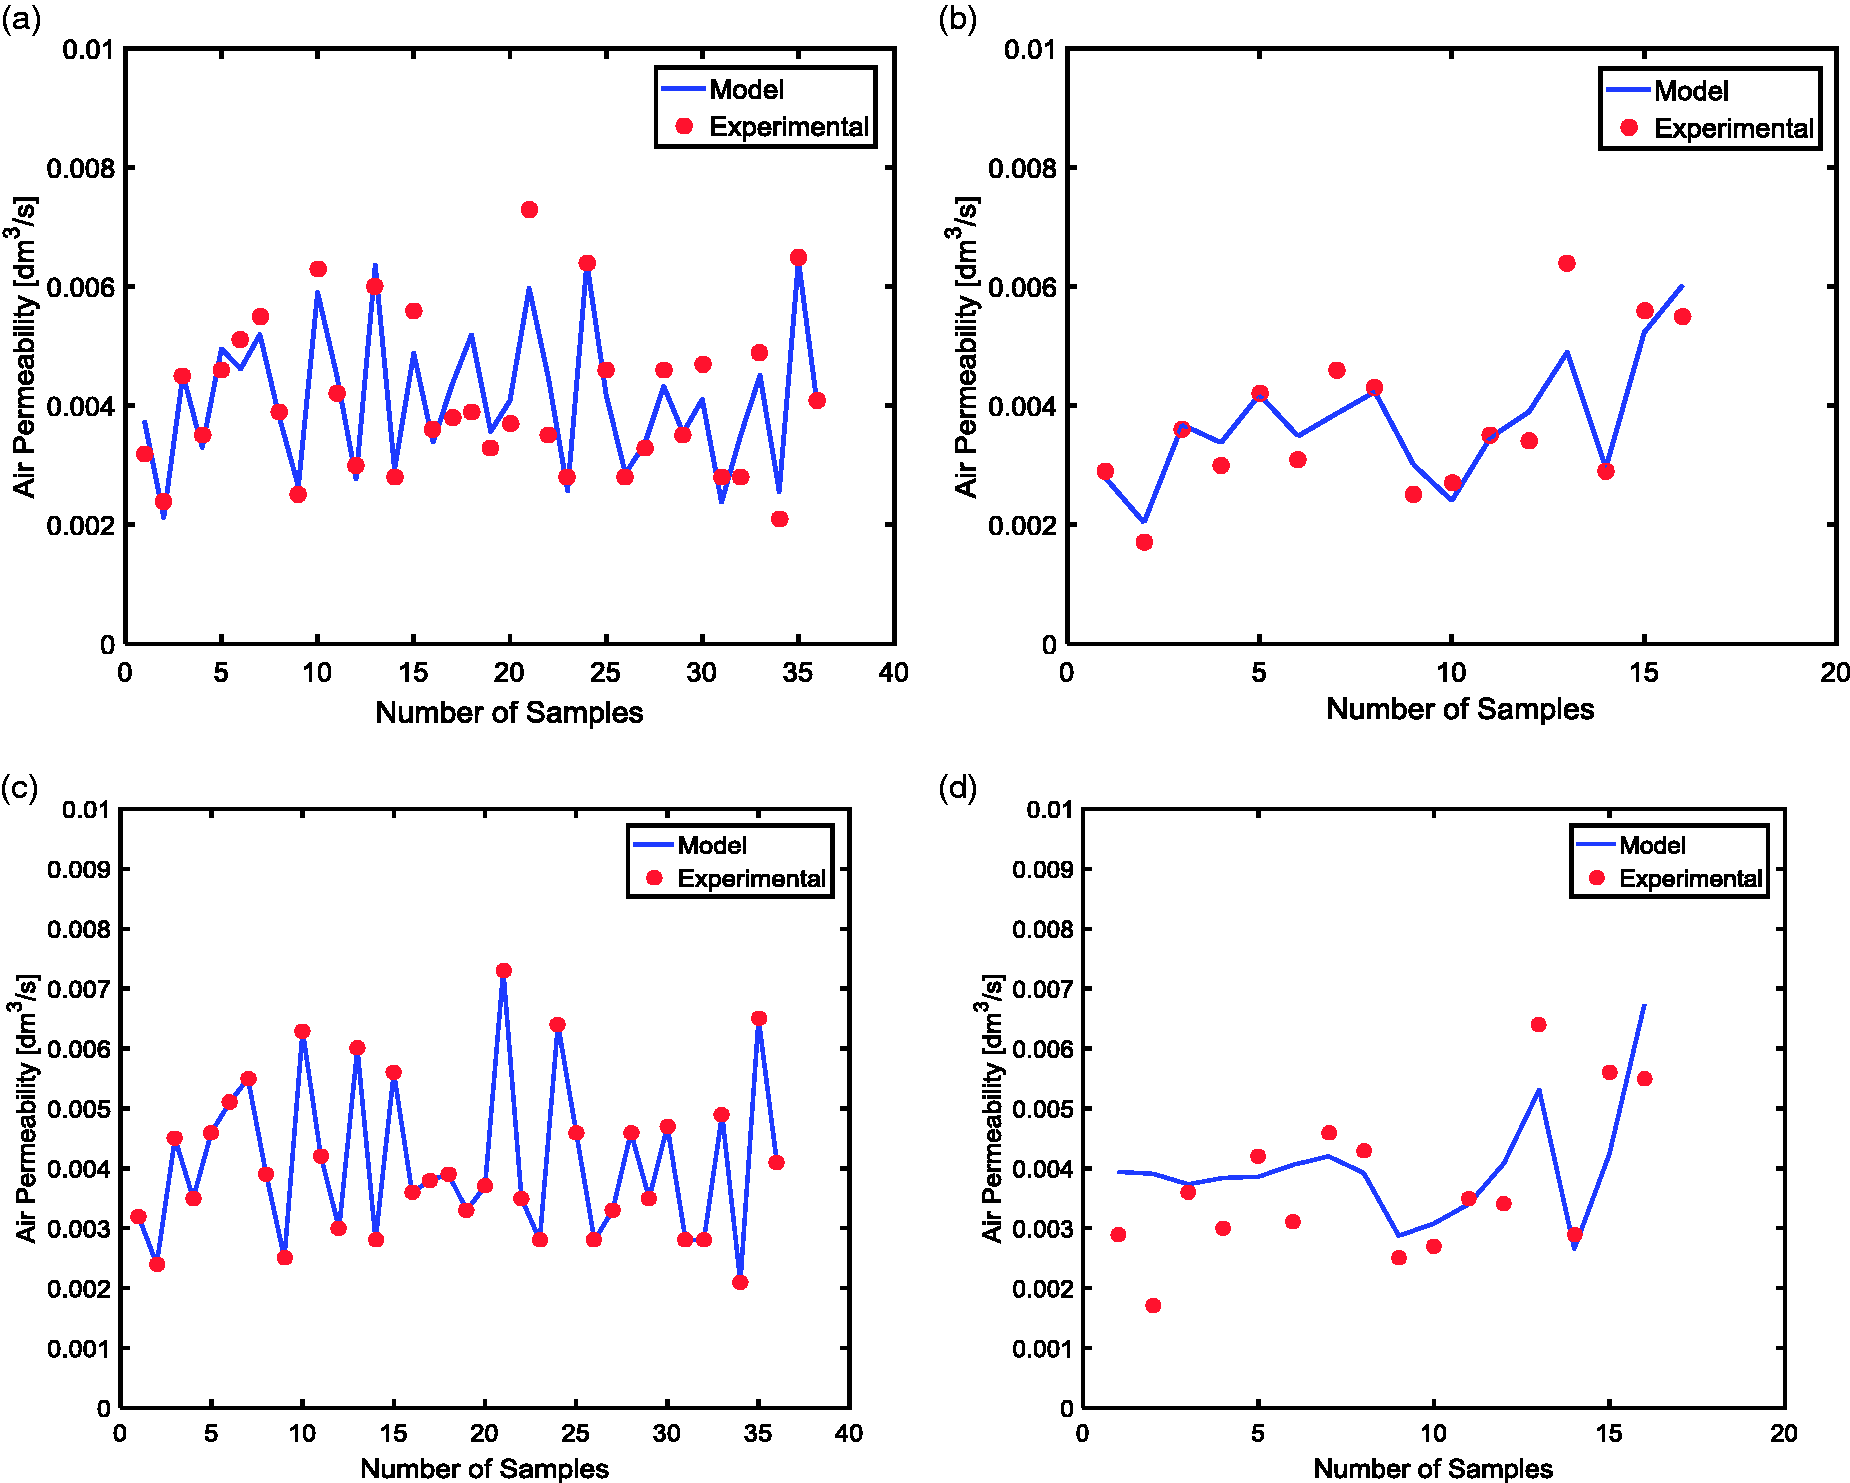
As seen in Figure 3, when air permeability is considered the LS-SVM model presented better performance in training, but the ANN model captured the general trend with higher success in testing.
According to the results given in Figure 4, both models performed better in training; on the other hand, the ANN model gave more reliable results in predicting the water vapor permeability of test data.
Water vapor permeability of the samples. (a) Training and (b) test data for the ANN model. (c) Training and (d) test data for the LS-SVM model.
The same trend as in water vapor permeability was seen in water vapor resistance (Figure 5); the ANN model produced closer predictions and showed better performance in the testing set.
Water vapor resistance of the samples. (a) Training and (b) test data for the ANN model. (c) Training and (d) test data for the LS-SVM model.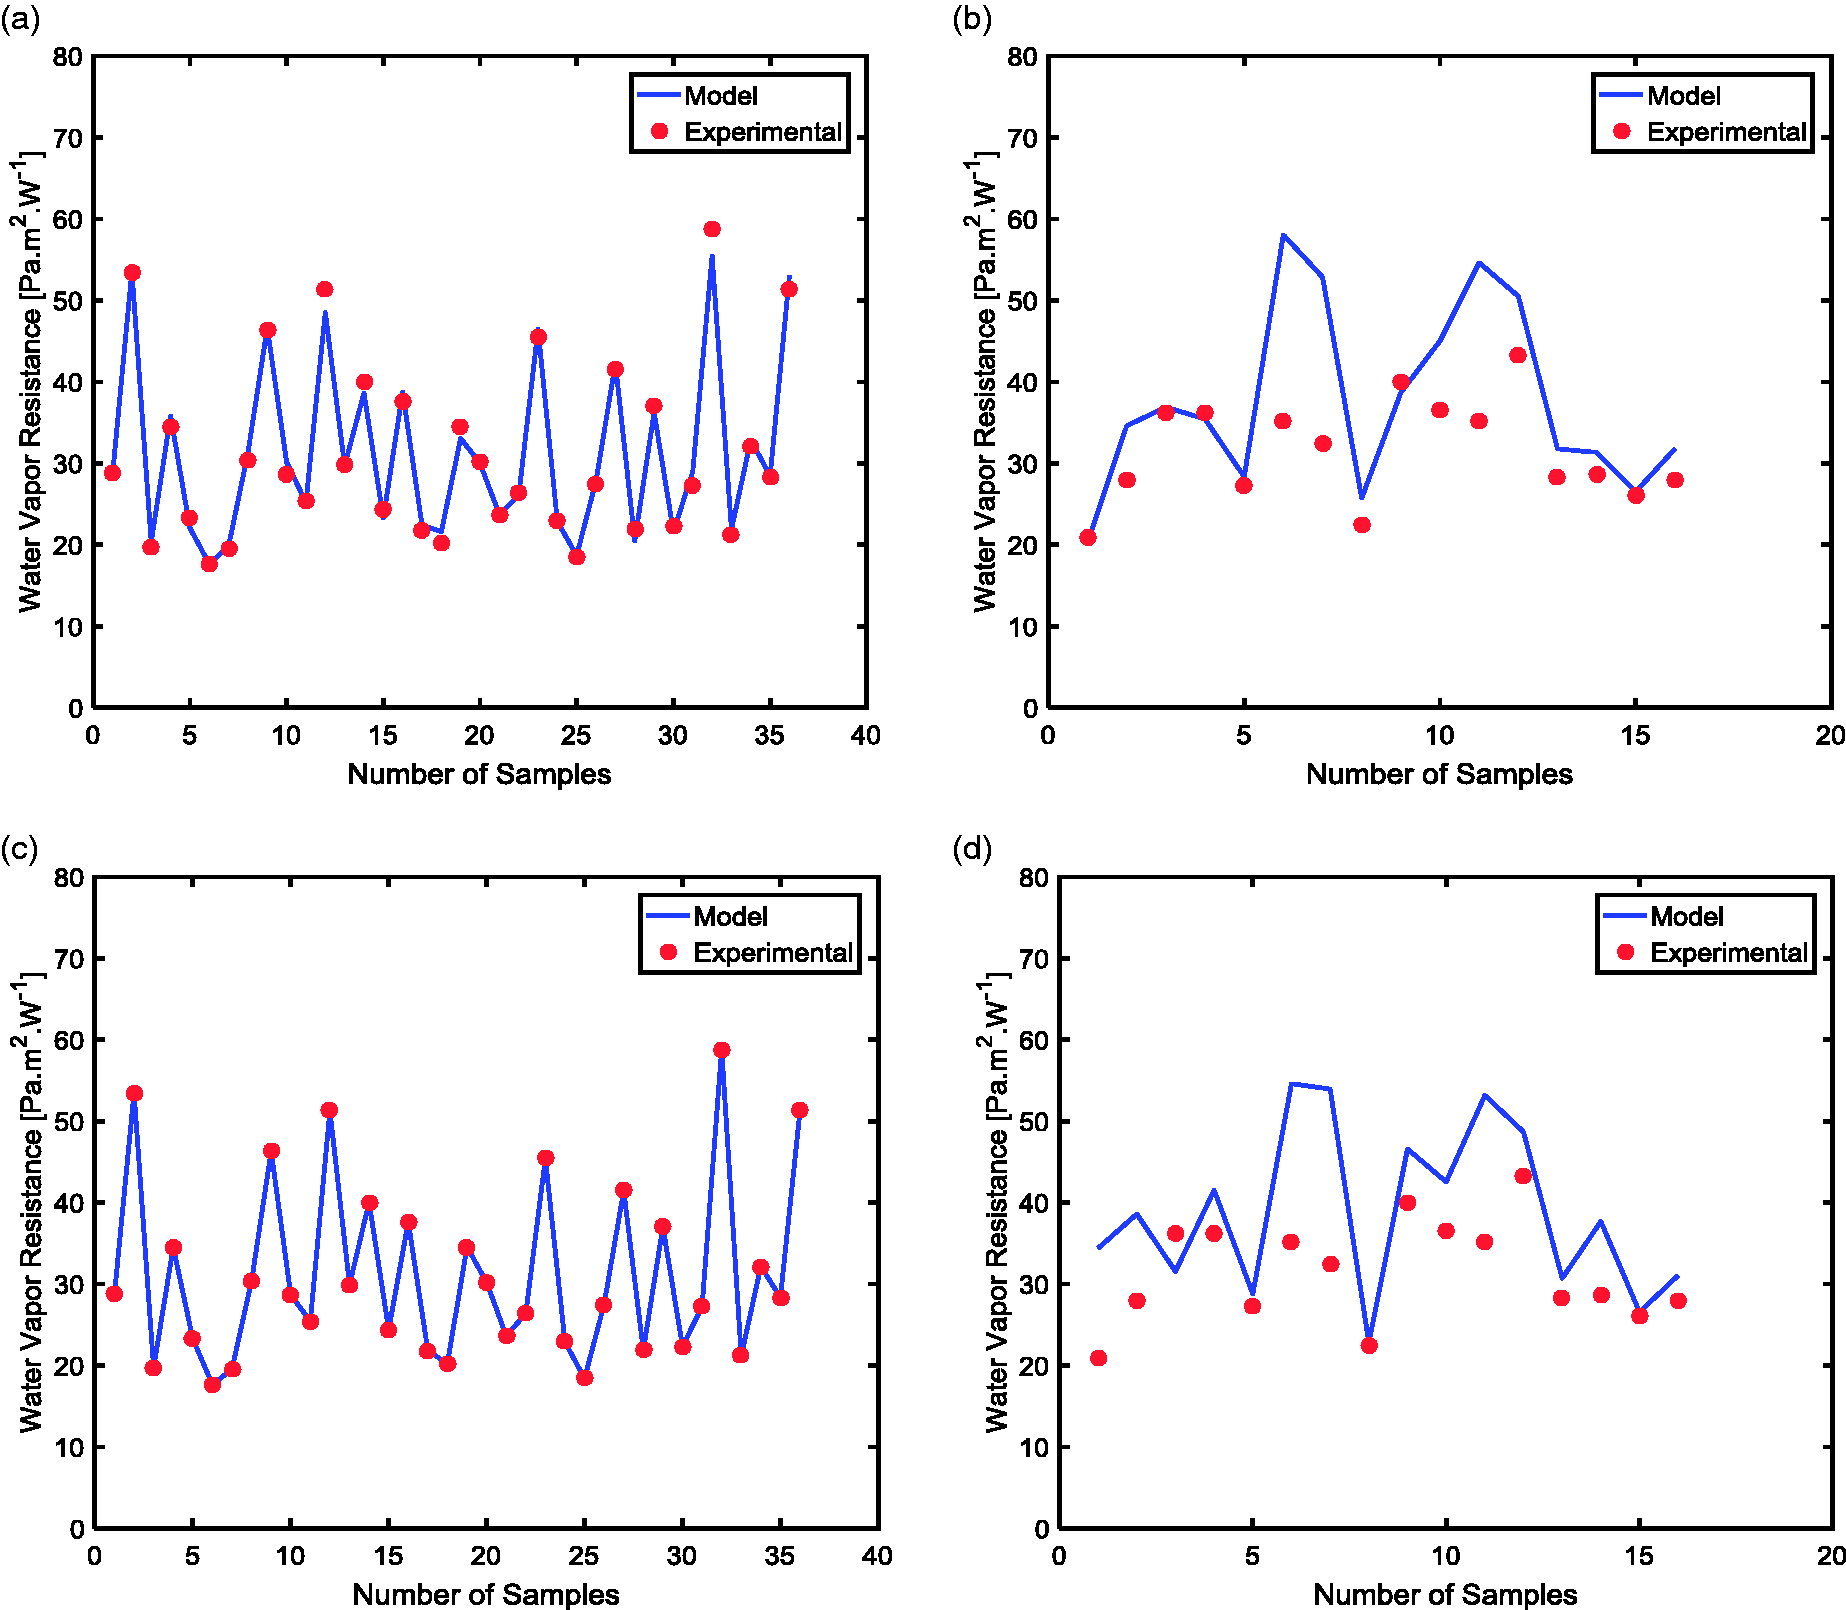
Figures 6 and 7 show that both models worked well in predicting the wicking behavior of samples in the weft and warp directions.
Wicking in the warp direction of the samples. (a) Training and (b) test data for the ANN model. (c) Training and (d) test data for the LS-SVM model. Wicking in the weft direction of the samples. (a) Training and (b) test data for the ANN model. (c) Training and (d) test data for the LS-SVM model.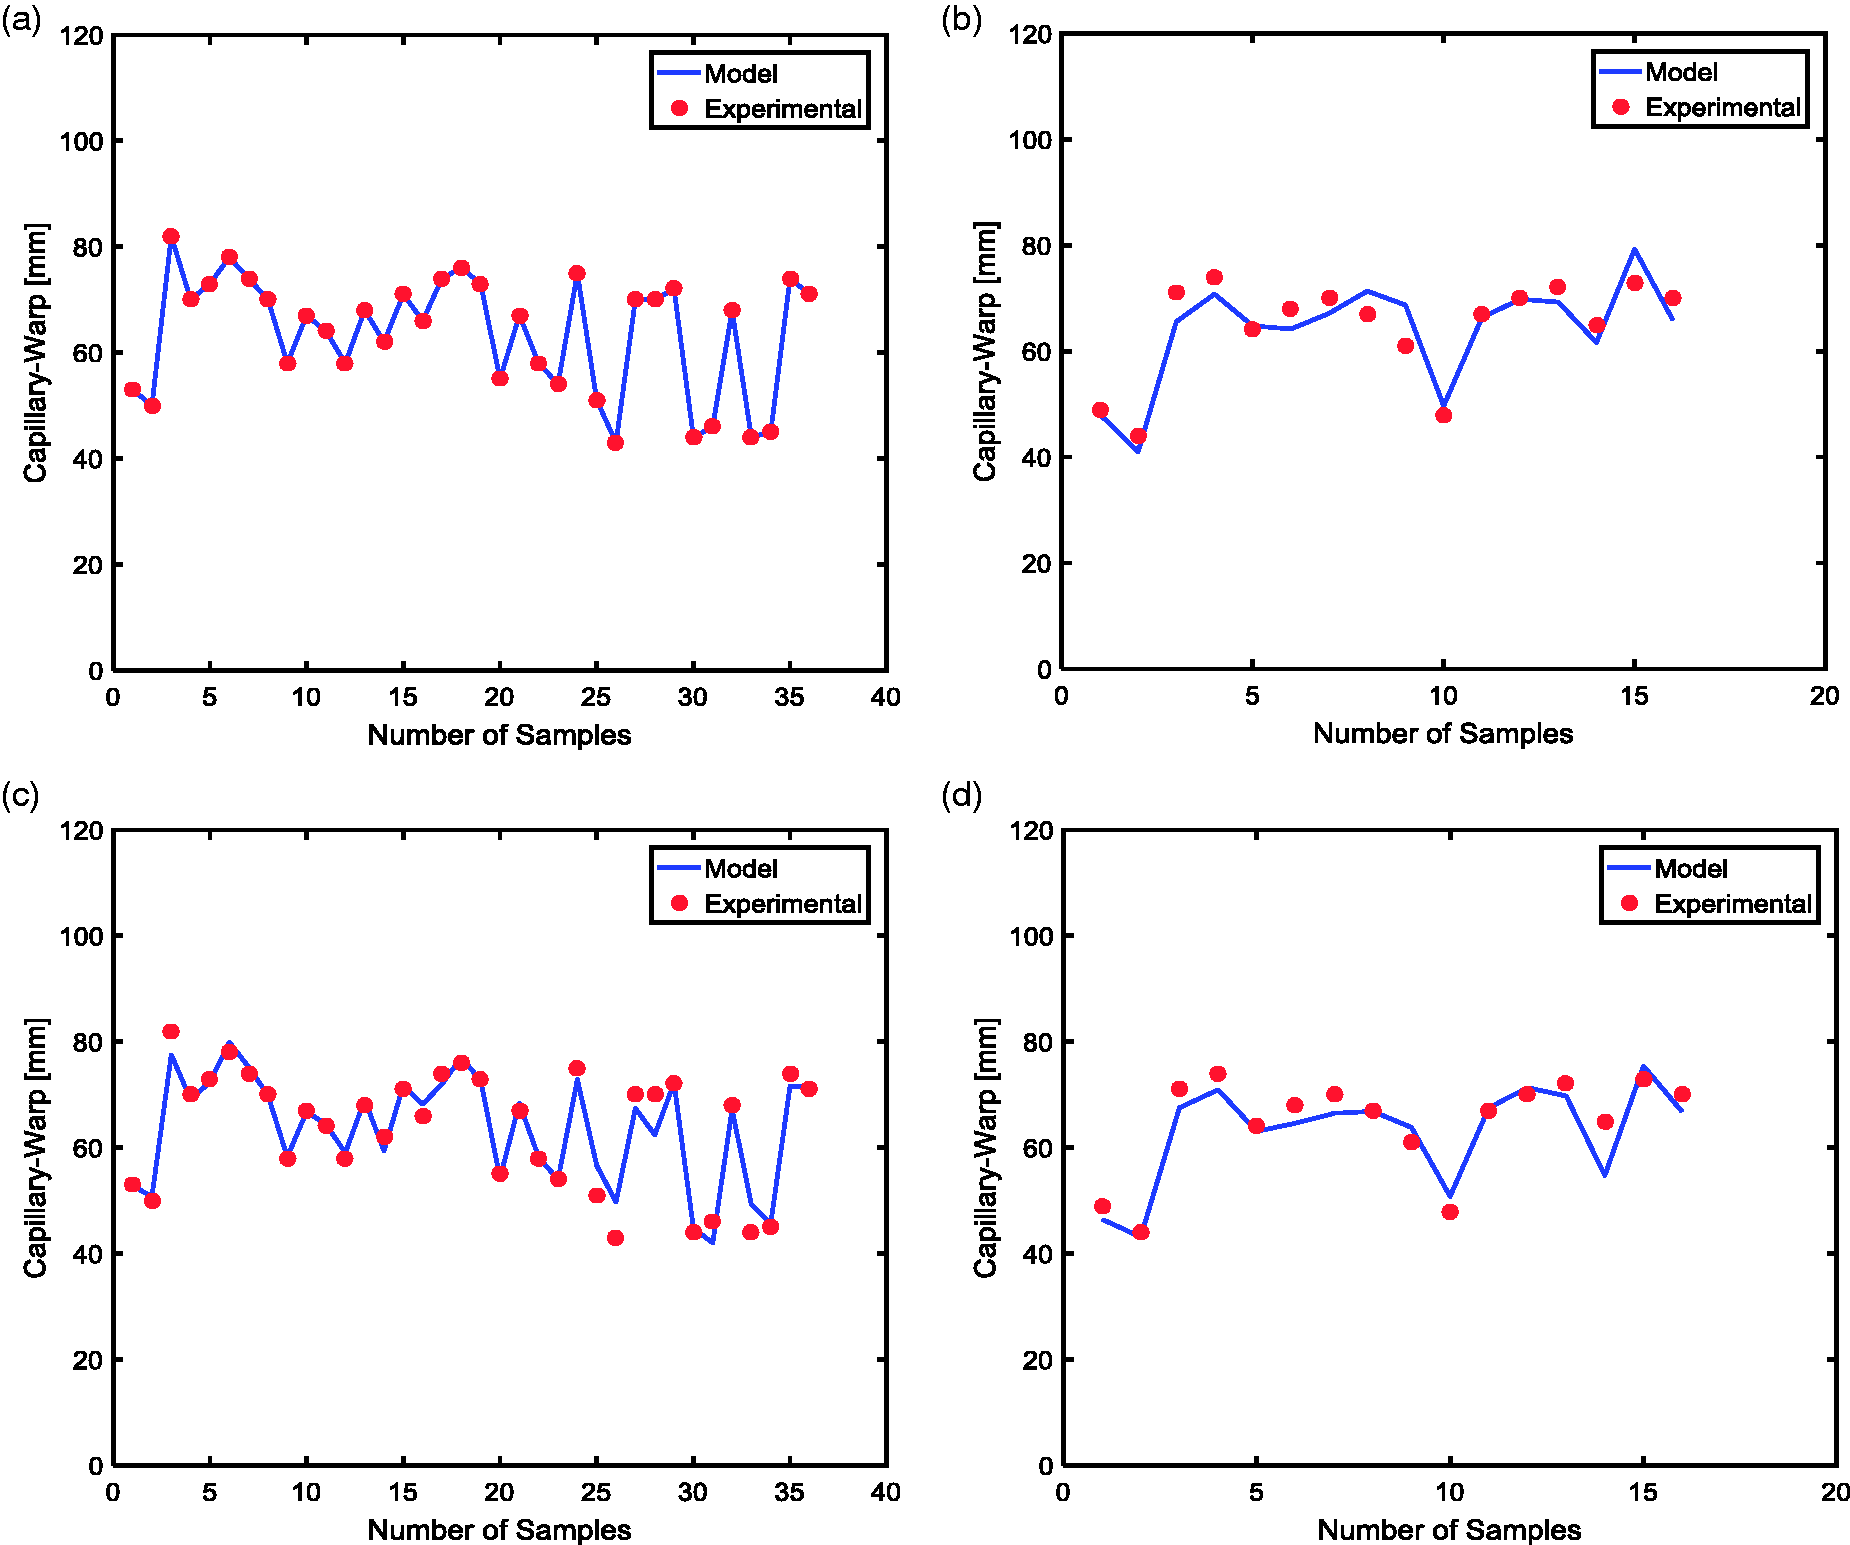
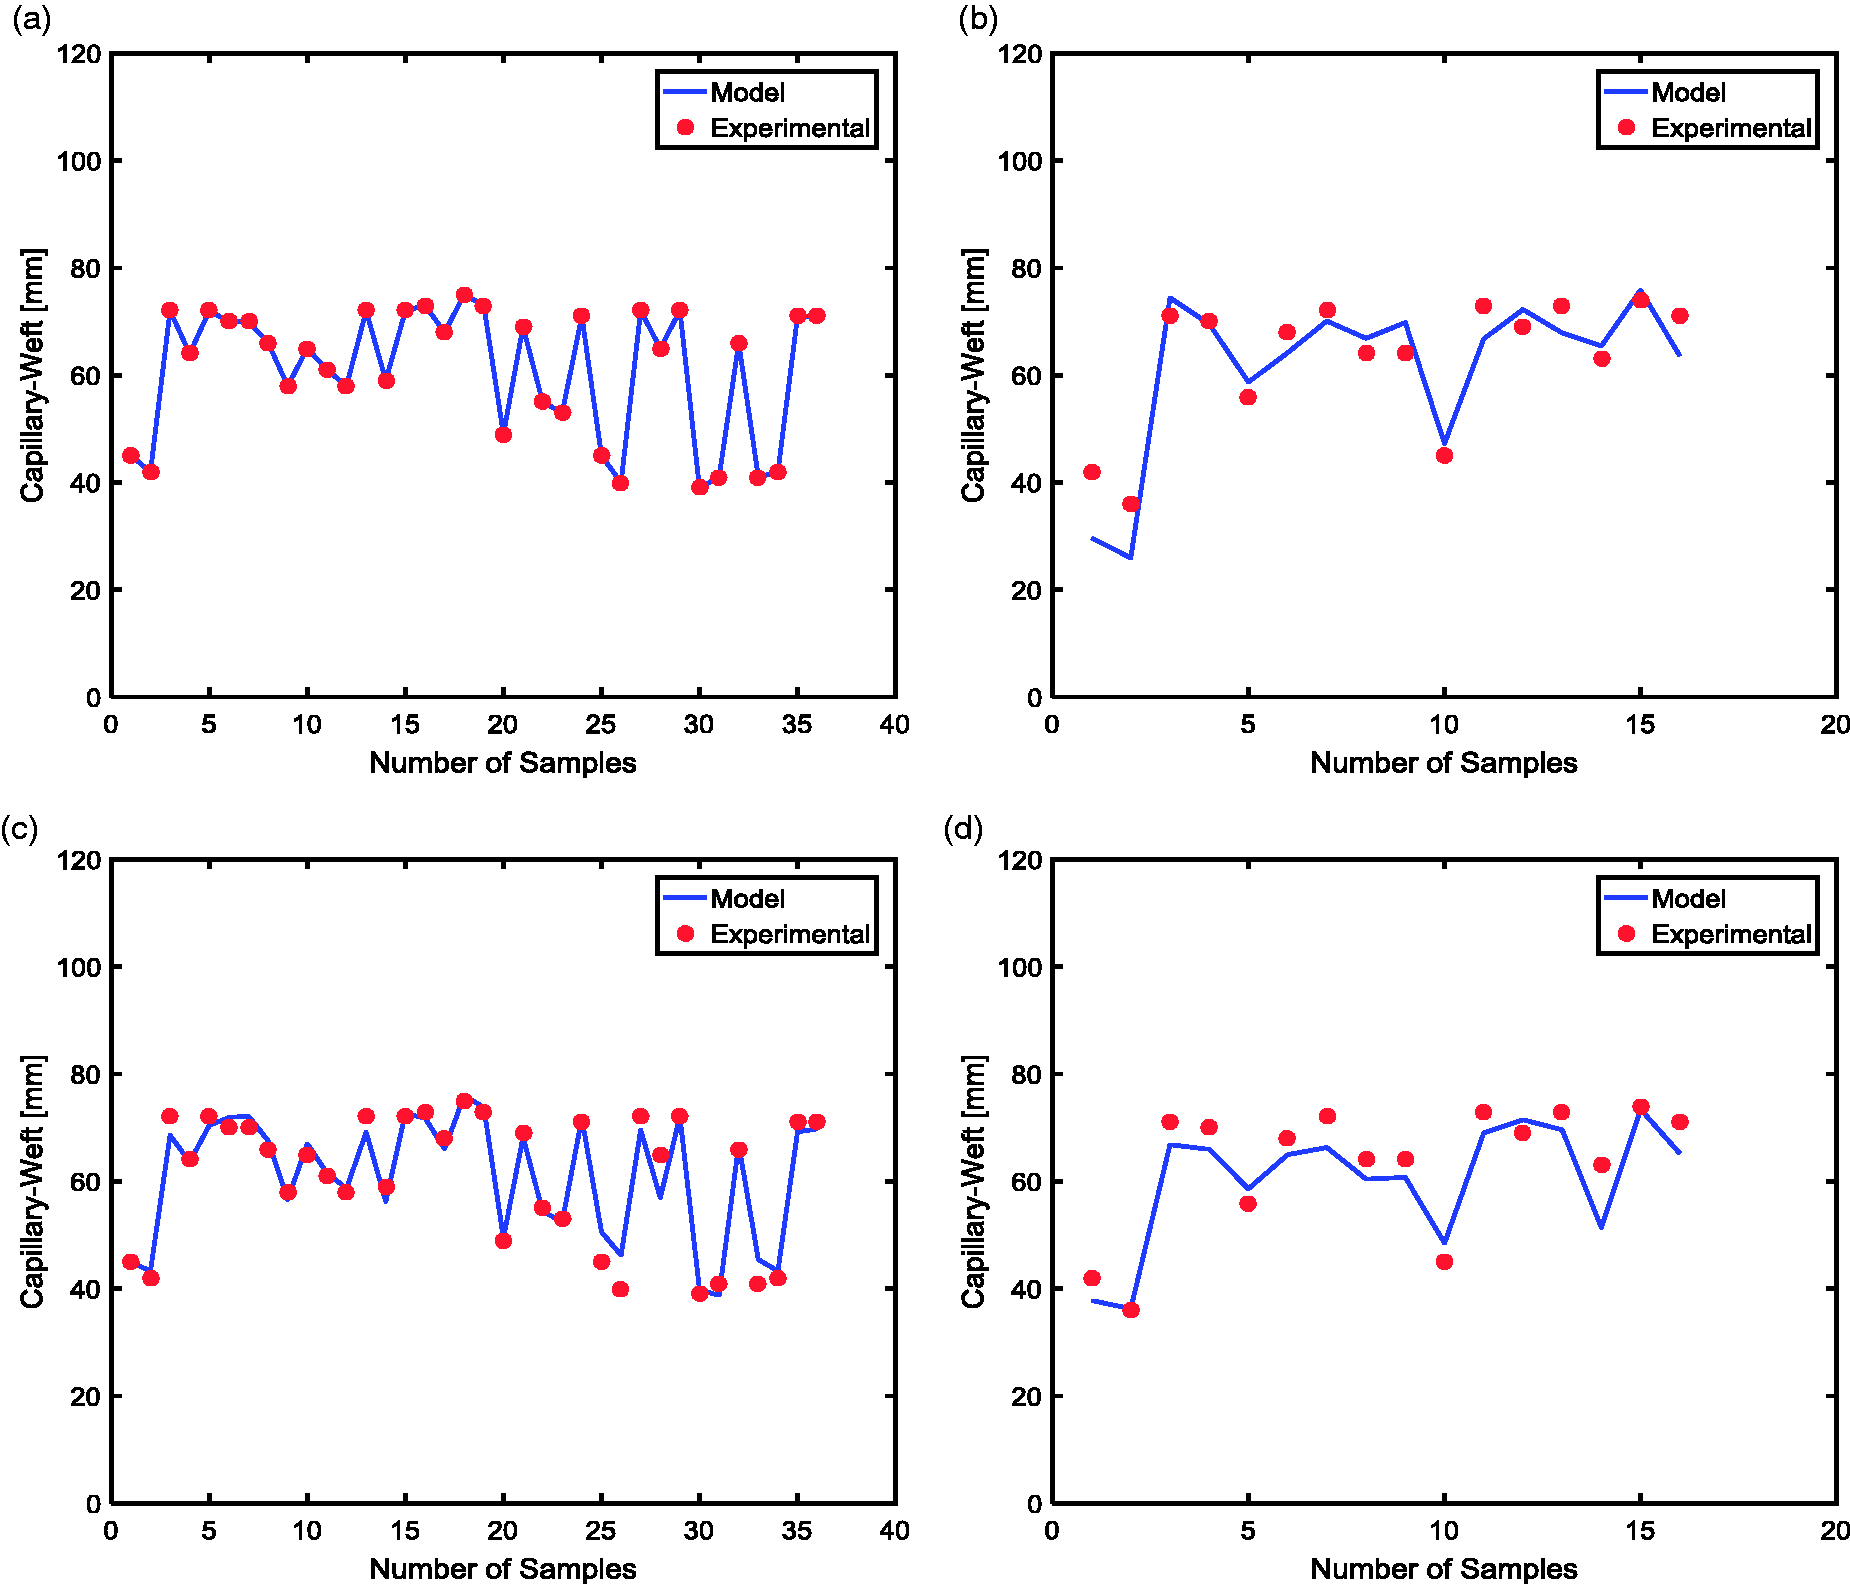
Figure 8 indicates that both models captured the trend well in training and testing, but the ANN model exhibited better performance in the testing set for water resistance.
Water resistance of the samples. (a) Training and (b) test data for the ANN model; (c) training and (d) test data for the LS-SVM model.
Figures 9–12 show that both models gave successful performances in predicting tensile behavior (breaking strength and elongation) of samples after micro-cracking and gave very close predictions.
Warp breaking strength of the samples. (a) Training and (b) test data for the ANN model. (c) Training and (d) test data for the LS-SVM model. Weft breaking strength of the samples. (a) Training and (b) test data for the ANN model. (c) Training and (d) test data for the LS-SVM model. Warp breaking elongation of the samples. (a) Training and (b) test data for the ANN model. (c) Training and (d) test data for the LS-SVM model. Weft breaking elongation of the samples. (a) Training and (b) test data for the ANN model. (c) Training and (d) test data for the LS-SVM model. Abrasion resistance of the samples. (a) Training and (b) test data for the ANN model. (c) Training and (d) test data for the LS-SVM model.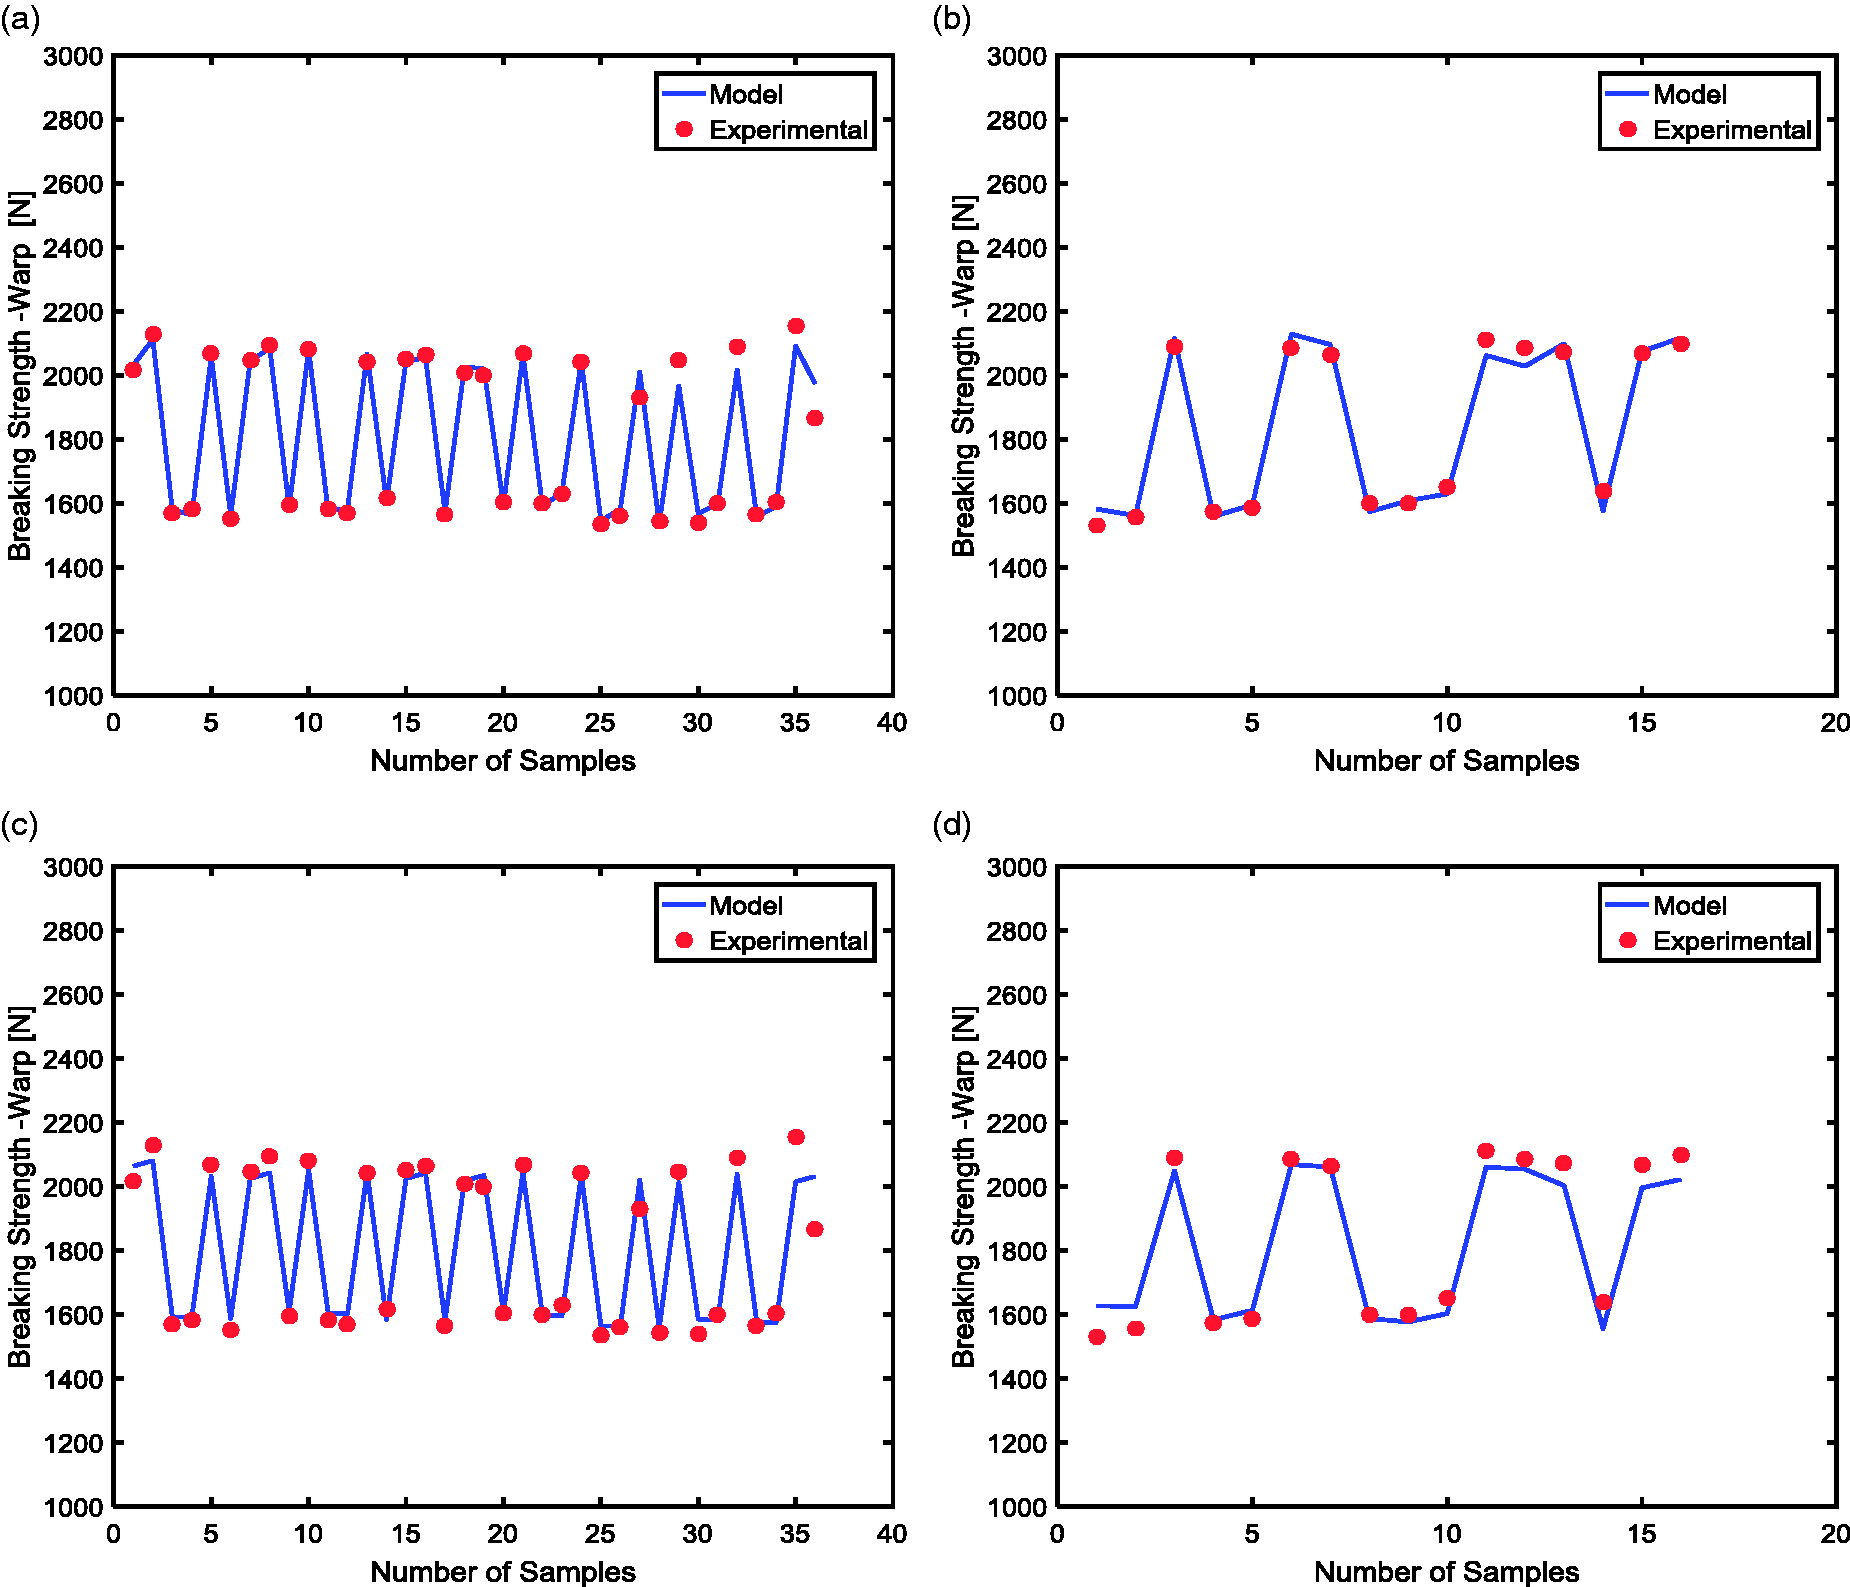


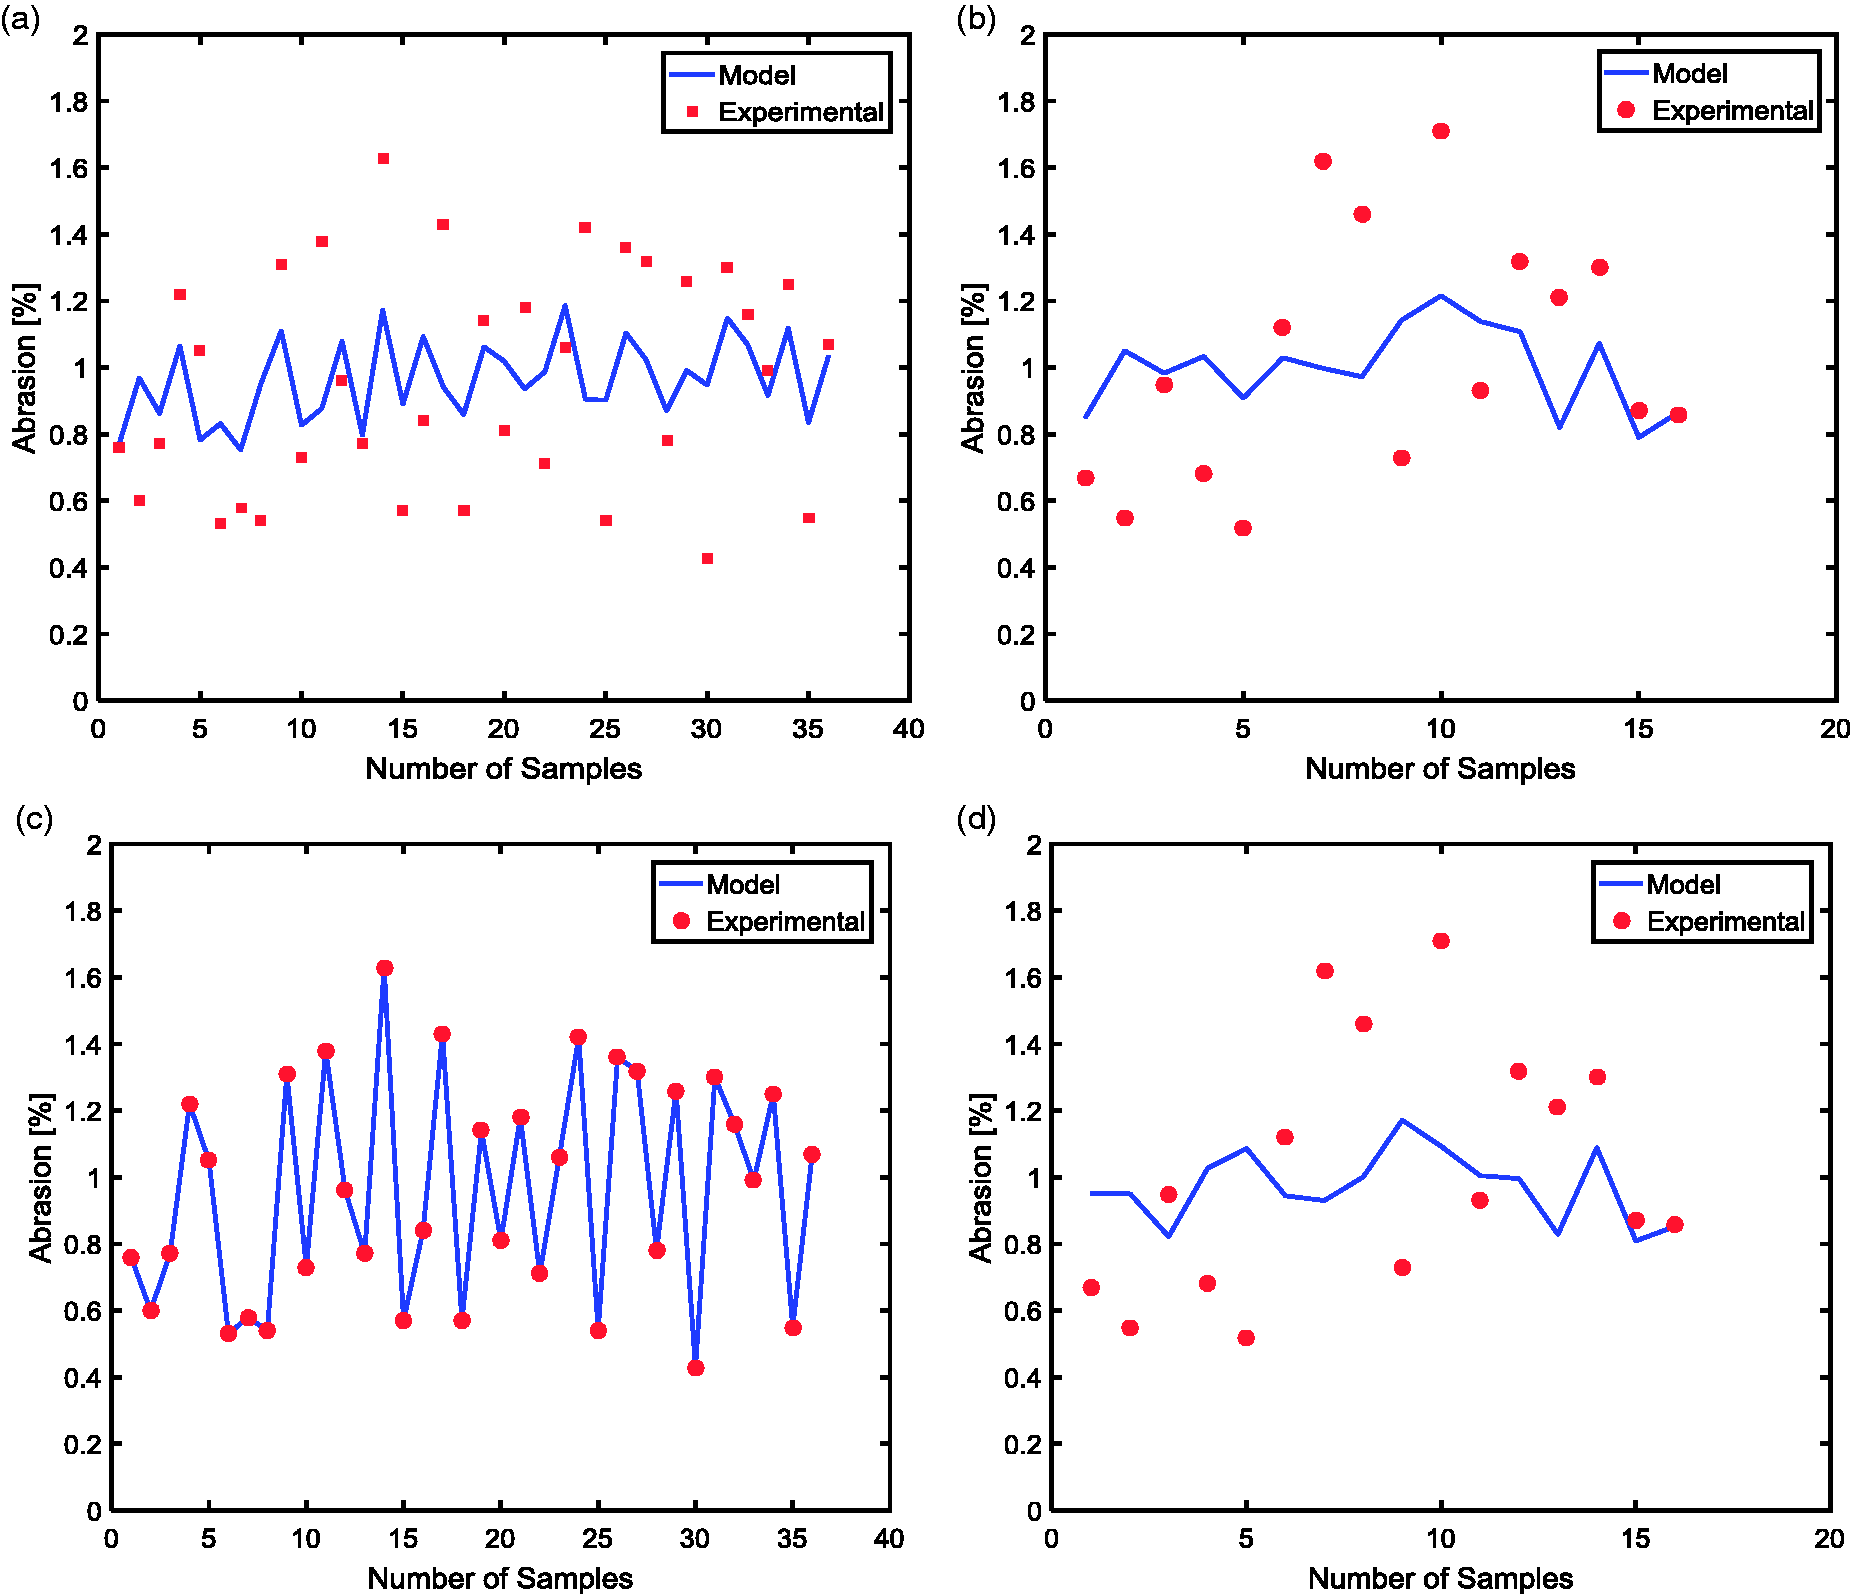
According to Figure 13, it may be said that the ANN model failed to predict abrasion resistance of the samples and the LS-SVM model only worked in the training set.
Statistical parameters of the models
Conclusion
This study used two modeling techniques in prediction of various properties of PU-coated fabrics after micro-cracking, which previously gave highly successful results for complex and nonlinear systems. The process, which can be defined as dipping the coated fabric in a polar solvent bath, has been recently studied to obtain water-resistant fabric with enhanced breathability. The early results showed that the process would have industrial applications, therefore a modeling study was conducted to find out if the process gave predictable and repeatable results since modeling can figure out the repeatability of experiments and reproducibility of findings, as indicated by various publications. Thus, the ANN and LS-SVM models were developed for the prediction of the outputs of micro-cracking; and the inputs were typical properties of the solvents used, bath ratio, duration in bath along with fabric density and weight increase of samples after coating. The performance of the models were screened via statistical parameters and it is observed that the ANN exhibited better performance in the test set except water vapor resistance and abrasion resistance of the fabric; also, the LS-SVM exhibited better performance in predicting wicking performance of coated samples after micro-cracking. These differences are the primary factor reflecting the success of the model. Also, variations in the modeling performance are inevitable when there is a large number of outcomes, such as in this study. But overall evaluation demonstrated that the effects of micro-cracking process on various properties of coated fabric could be predicted through ANN or the LS-SVM models, and therefore it is concluded that the process could meet the controlling and predicting concerns of industrial applications. As such, this study completes the assessment of the micro-cracking process to determine if it could find industrial applications.
Footnotes
Declaration of conflicting interests
The authors declared no potential conflicts of interest with respect to the research, authorship and/or publication of this article.
Funding
The authors disclosed receipt of the following financial support for the research, authorship, and/or publication of this article: The study was supported by TUBITAK under program contract no. 114M105.