
Abstract
The overall comfort of a bedding system is, among others, the result of the moisture and thermal management capabilities of its components, including mattress ticking fabrics. The hand of mattress ticking fabrics, their smoothness, softness, flexibility, and thermal properties, in particular, partially contribute to the sleep quality. Manufacturers pay a great deal of attention to this aspect and make efforts to improve fabric hand as customers always touch and squeeze the fabric and the perceived fabric hand will partially influence their buying decision. In this study the hand of 12 mattress fabrics was investigated by the Fabric Touch Tester (FTT), which is a relatively new characterization method of fabric hand. The FTT measures simultaneously 13 fabric indices related to four categories of fabric physical properties, namely bending, compression, and thermal and surface properties. These fabric indices are subsequently used by the FTT software to predict three primary comfort indices (i.e. smoothness, softness, warmth) and two global comfort indices (i.e. total hand and total feel). The fabrics were differentiated by three production parameters, namely fabric mass per unit area, concentration of softener and fiber composition. Relevant tactile properties for mattress ticking fabrics, such as smoothness, softness, warmth, and flexibility, were assessed by an expert panel and the average scores given by the assessors were correlated with the fabric indices measured by the FTT. Among the selected variables, fabric mass per unit area has the greatest influence on all FTT fabric indices. Due to the large fabric set, considerable variances were observed between the scores assigned by the panels. That resulted in poor correlations between tactile properties and selected production parameters, although the trend seems to be correct and all the factors were found to be statistically significant. Strong correlations were found between the FTT fabric indices and tactile properties assessed by the panels, except warmth, which suggests that the FTT is suitable to assess mattress ticking fabrics with elevated mass per unit area and uneven texture.
Sleep is a vital and basic activity of humans and a psychological need for the human body. Its quality is affected by factors such as room and bed microclimate. Various studies have been conducted using electroencephalogram monitoring to study the effect of temperature on sleep and to identify a thermoneutral zone, defined as the range of optimum temperatures in which the human body feels thermally comfortable. 1 Some studies1,2 indicated that the thermoneutral zone in the bedding microclimate is around 30℃ and the preferred ambient temperature is 19℃. Moving away from the thermoneutral zone increases the number and duration of wakefulness periods. For instance, high nocturnal awakening was noted at an ambient temperature of 13℃ and a temperature in the microclimate of 26.1℃.1,2 Although both temperatures above and below the thermoneutral zone have disruptive effects on sleep patterns, cold ambient temperatures tend to be more disruptive to sleep than warm ambient temperatures; therefore, thermoregulation of bedding textiles must be more effective toward cooler temperatures.1,3 Heat loss in bedding occurs through the leakage of microclimate air to the ambient temperature through bedding upper layers and with the conduction of heat to the mattress. Temperature drops in the bedding microclimate also occur due to the ventilation effect; therefore, duvets should not only have insulating, moisture absorbing, and temperature compensating effects, but they should also adapt to the body shape. 1 Moreover, the heat-related sleep disruption tends to concentrate more on initial sleep segments. 4 The thermoneutral zone has minor variations in various groups, for instance between men and women, elderly and young, and people from different geographical locations. 1
Sleepwear, bedding textiles, and mattress ticking fabrics all contribute to the overall perception of comfort, in addition to ambient and bed microclimate. Sleepwear and bedding textiles have close contact to the skin; therefore, their tactile properties are extremely important, 5 especially in events of lying in bed for a longer period of time, which may be the case for elderly or disabled people. The importance of adequate surface properties meant to control friction and pressure between the skin and bedding textiles was highlighted within a European study 6 in which employees from caregiving institutions were asked to recommend improvements for bedding textiles. 7 Mattress ticking fabrics with specialty fibers or various surface treatments envisaging easy-care, overall well-being, improved hygiene, and microclimate already exist on the market. The moisture and thermal properties of mattress ticking fabrics make a great contribution to the overall sleep comfort. Several studies investigated various possibilities of enhancing the thermal comfort of these fabrics and evaluated their thermal properties, water vapor, and air permeability accordingly. For instance, the influence of selected design parameters (i.e. fabric tightness, fabric design, and Outlast® fiber composition) on the thermal comfort of knitted spacers used as mattress ticking fabrics was investigated by Onal et al. 8 They concluded that fabric thickness has a significant influence on fabric thermal properties, except thermal diffusion, and that elevated Outlast® fiber composition lead to a high thermal absorptivity and caused a cool feeling. In another study, 9 four types of mattresses ticking fabrics differentiated by raw materials (cotton, viscose-polyester, wool) and mass per unit area were padded with Phase Change Materials (PCMs) aiming at thermal comfort bed systems. This study gives no details about the heating element (stainless steel conductive yarn and respective sewing pattern) but claims that the best results were achieved with the highest PCM concentrations and that the PCM loaded fabrics remained temperature stable during the cooling process for about 110 seconds. A more recent study 10 has analyzed the thermal comfort of commercially available jacquard knitted mattress ticking fabrics with various fiber contents and also found that fabric thickness is the most important parameter for a comfortable sleep environment. Within another study, 11 the thermal comfort of an innovative four-layer sandwiched mattress was subjectively analyzed by a panel of 10 participants. The perception of the thermal comfort was quite subjective; therefore, the authors recognize the need for an additional study to objectively assess the thermal comfort of the two mattresses designed.
Unlike thermal comfort, the tactile properties of mattress ticking fabrics have been less investigated. Within a European research project, 12 a new generation of mattresses, pillows, bedding textiles, and nightwear systems was developed aiming at enhanced sleep comfort. Among others, several natural fibers (i.e. hemp, bamboo, chitosan, soya, etc.) were screened for their potential usage in mattress ticking, pajamas, and bedding textiles. Their tactile properties were evaluated by the Kawabata Evaluation System (KES) and the results highlighted the elevated THV (Total Hand Value) of the soya, chitosan, and bamboo fabrics as compared with cotton fabrics. 13 To the best of our knowledge no further studies exist that investigate the hand of mattress ticking fabrics. Nevertheless, the authors believe that, in particular, the smoothness and softness of these fabrics also significantly contribute to sleep quality and that fabric flexibility additionally influences further fabric processing (e.g. sewing of the mattress cover). Moreover, during the purchasing phase, customers always touch and squeeze the fabric and the perceived fabric hand will eventually, together with other criteria, influence their buying decision. Therefore, manufacturers pay a great deal of attention to this aspect and make efforts to improve the fabric hand. Fabric hand properties may be objectively assessed by well-established methods and instruments, 14 among which are KES-F, FAST and PhabrOmeter, and the results can be further correlated with the results from subjective evaluation involving expert or non-expert panels. Both objective and subjective methods have their limitations in terms of type of properties measured, ease in handling and interpretation of results, time, and costs. For instance, the PhabrOmeter measures only the drape, while the FAST and KES-F systems measure simultaneously compression, bending, extension and respectively compression, bending, surface, and tensile properties by using distinct modules. None of these three instruments measures the thermal properties and separate instruments are necessary to measure each of the fabric properties. 15 The Fabric Touch Tester (FTT) was quite recently developed by SDL Atlas 16 in collaboration with the Hong Kong Polytechnic University and claims to overcome some drawbacks of the well-established methods and instruments. The FTT is an integrated instrument that can simultaneously measure four kinds of physical properties of the fabric (i.e. compression, bending, surface, and thermal properties) and generate 13 fabric indices. These fabric indices are further employed to compute three primary comfort indices, namely softness, smoothness, and warmth, as well as two global indices called total hand and total feel. Fabrics for clothing have been investigated by means of this instrument 17 and their tactile properties, such as smoothness, softness, prickliness, warmth, and dampness, were subjectively evaluated by panels. The relationship between these tactile properties and fabric properties measured with the FTT was statistically described by prediction models with an R2 in the range of 0.695–0.97. A later study 15 describes the mechanical designs of the four modules of the instrument and the respective FTT indices. Subjective evaluations conducted by the panels, statistical results (e.g. analysis of variance (ANOVA) for discrimination and Gauge R&R for repeatability) and the correlations between the score given by the panels and the FTT indices were further discussed in this paper. In another study, 18 the sensorial comfort of fabrics for protective clothing was assessed by the FTT and it was found that this instrument is sensitive enough to discriminate between fabrics with comparable mass per unit area or thickness. Other studies19,20 report about the ability of the FTT to discriminate between primary comfort indices of knitted fabrics differentiated by yarn type (i.e. ring-spun yarns and air-jet yarns) and finishing treatments. This instrument was also employed to assess the tactile properties of fabrics consisting of various man-made cellulosic materials (e.g. Tencel®, Modal) and good agreements were reported between the FTT comfort indices (e.g. softness, smoothness) and expert panels as well as between the smoothness and softness determined by the FTT and by the Tissue Softness Analyzer (TSA). 21
To the best of our knowledge, the FTT was not previously used to analyze mattress ticking fabrics, which differ in architecture from clothing textiles and also exhibit elevated mass per unit area. Moreover, none of the existing FTT-related studies report on the influence of production settings on the FTT fabrics indices or primary or global comfort indices. Mattress ticking fabrics discriminated by several production settings were designed and investigated by the FTT and their smoothness, softness, warmth, and flexibility was assessed by panels. In this study, an attempt is made to correlate the results of the FTT with the results of the panels and develop statistical prediction models that describe the relationship between selected production parameters and fabric tactile properties.
Materials and methods
Materials
Manufacturers may manipulate and enhance the hand of mattress ticking fabrics by varying several production settings. Fabric mass per unit area, fiber composition, or various finishing treatments are examples of parameters that are often tuned during the production of mattress ticking fabrics. Double jersey mattress ticking fabrics filled with thick Bulk Continous Filament (BCF) polyester yarns (PES) in the middle layer, were produced for this study on an industrial double-plate circular knitting machine. The knitted fabrics differentiated by mass per unit area and fiber composition of the upper layer were subsequently impregnated with a silicone softener. Three levels of variation were selected for the concentration of softener and for the mass per unit area, chosen to cover a large range of settings commonly used by manufacturers during production and to enable the detection of potential quadratic effects of the input parameters on the FTT fabric indices. The fiber composition was also varied, envisaging better hand and thermal properties. For economic reasons, viscose yarns (CV) were used only in the upper layer (which is close to the body) and polyester yarns (PES) were used for the back-side of all fabrics. The fabrics were developed according to a Design of Experiments (DoE). DoE is a method for systematically planning and conducting experiments by making controlled changes to input variables in order to determine their effect on a given response. The overall objective of such a method is to gain maximum amounts of information on the cause–effect relationship with a minimum number of experiments (combinations of input factors). A “Custom Design” of JMP software (company SAS) was used in this case. 22 There are 18 possible combinations of production parameters (two-level composition, three-level softener concentration, and mass per unit area) and this design recommends a minimum of nine experiments to be done in order to correctly estimate the effect of the three input variables on the fabric properties measured by the FTT. For practical reasons and to enable correct evaluation by the panels, we have arbitrarily limited the total number of experiments to 12. Previous studies 23 noticed a decrease of accuracy of subjective assessments with an increase of the number of fabrics and fabrics attributes evaluated.
Characteristics of the 12 fabrics produced according to a Design of Experiments
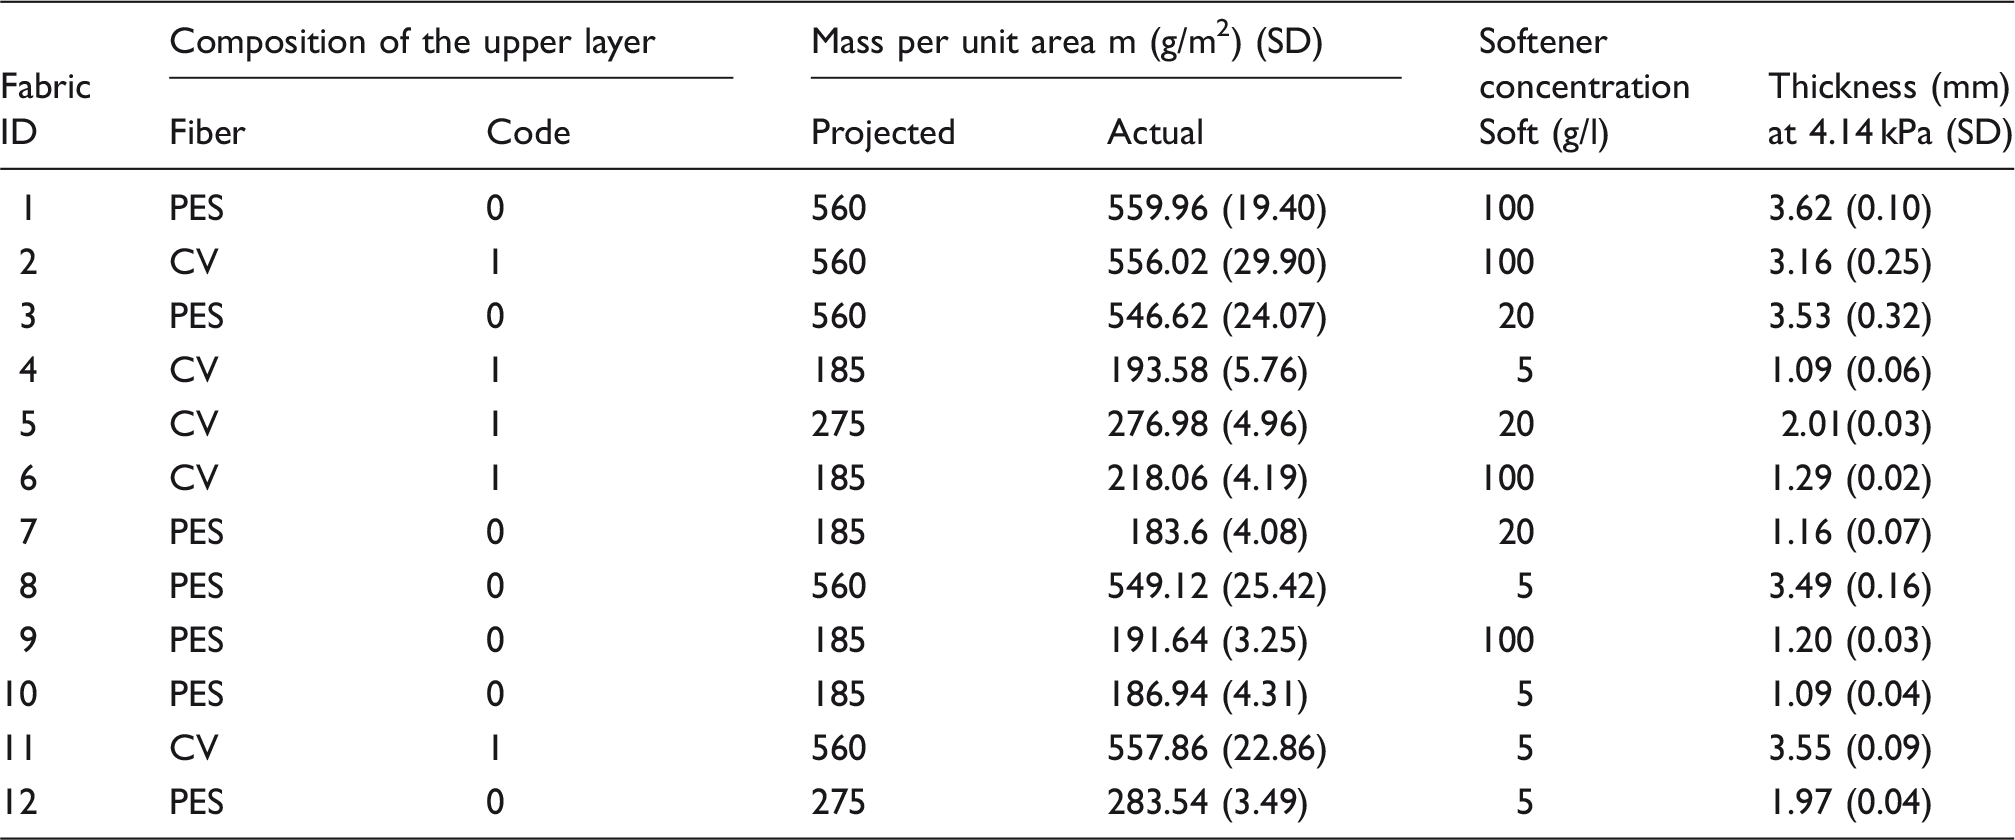
PES: polyester; CV: viscose.
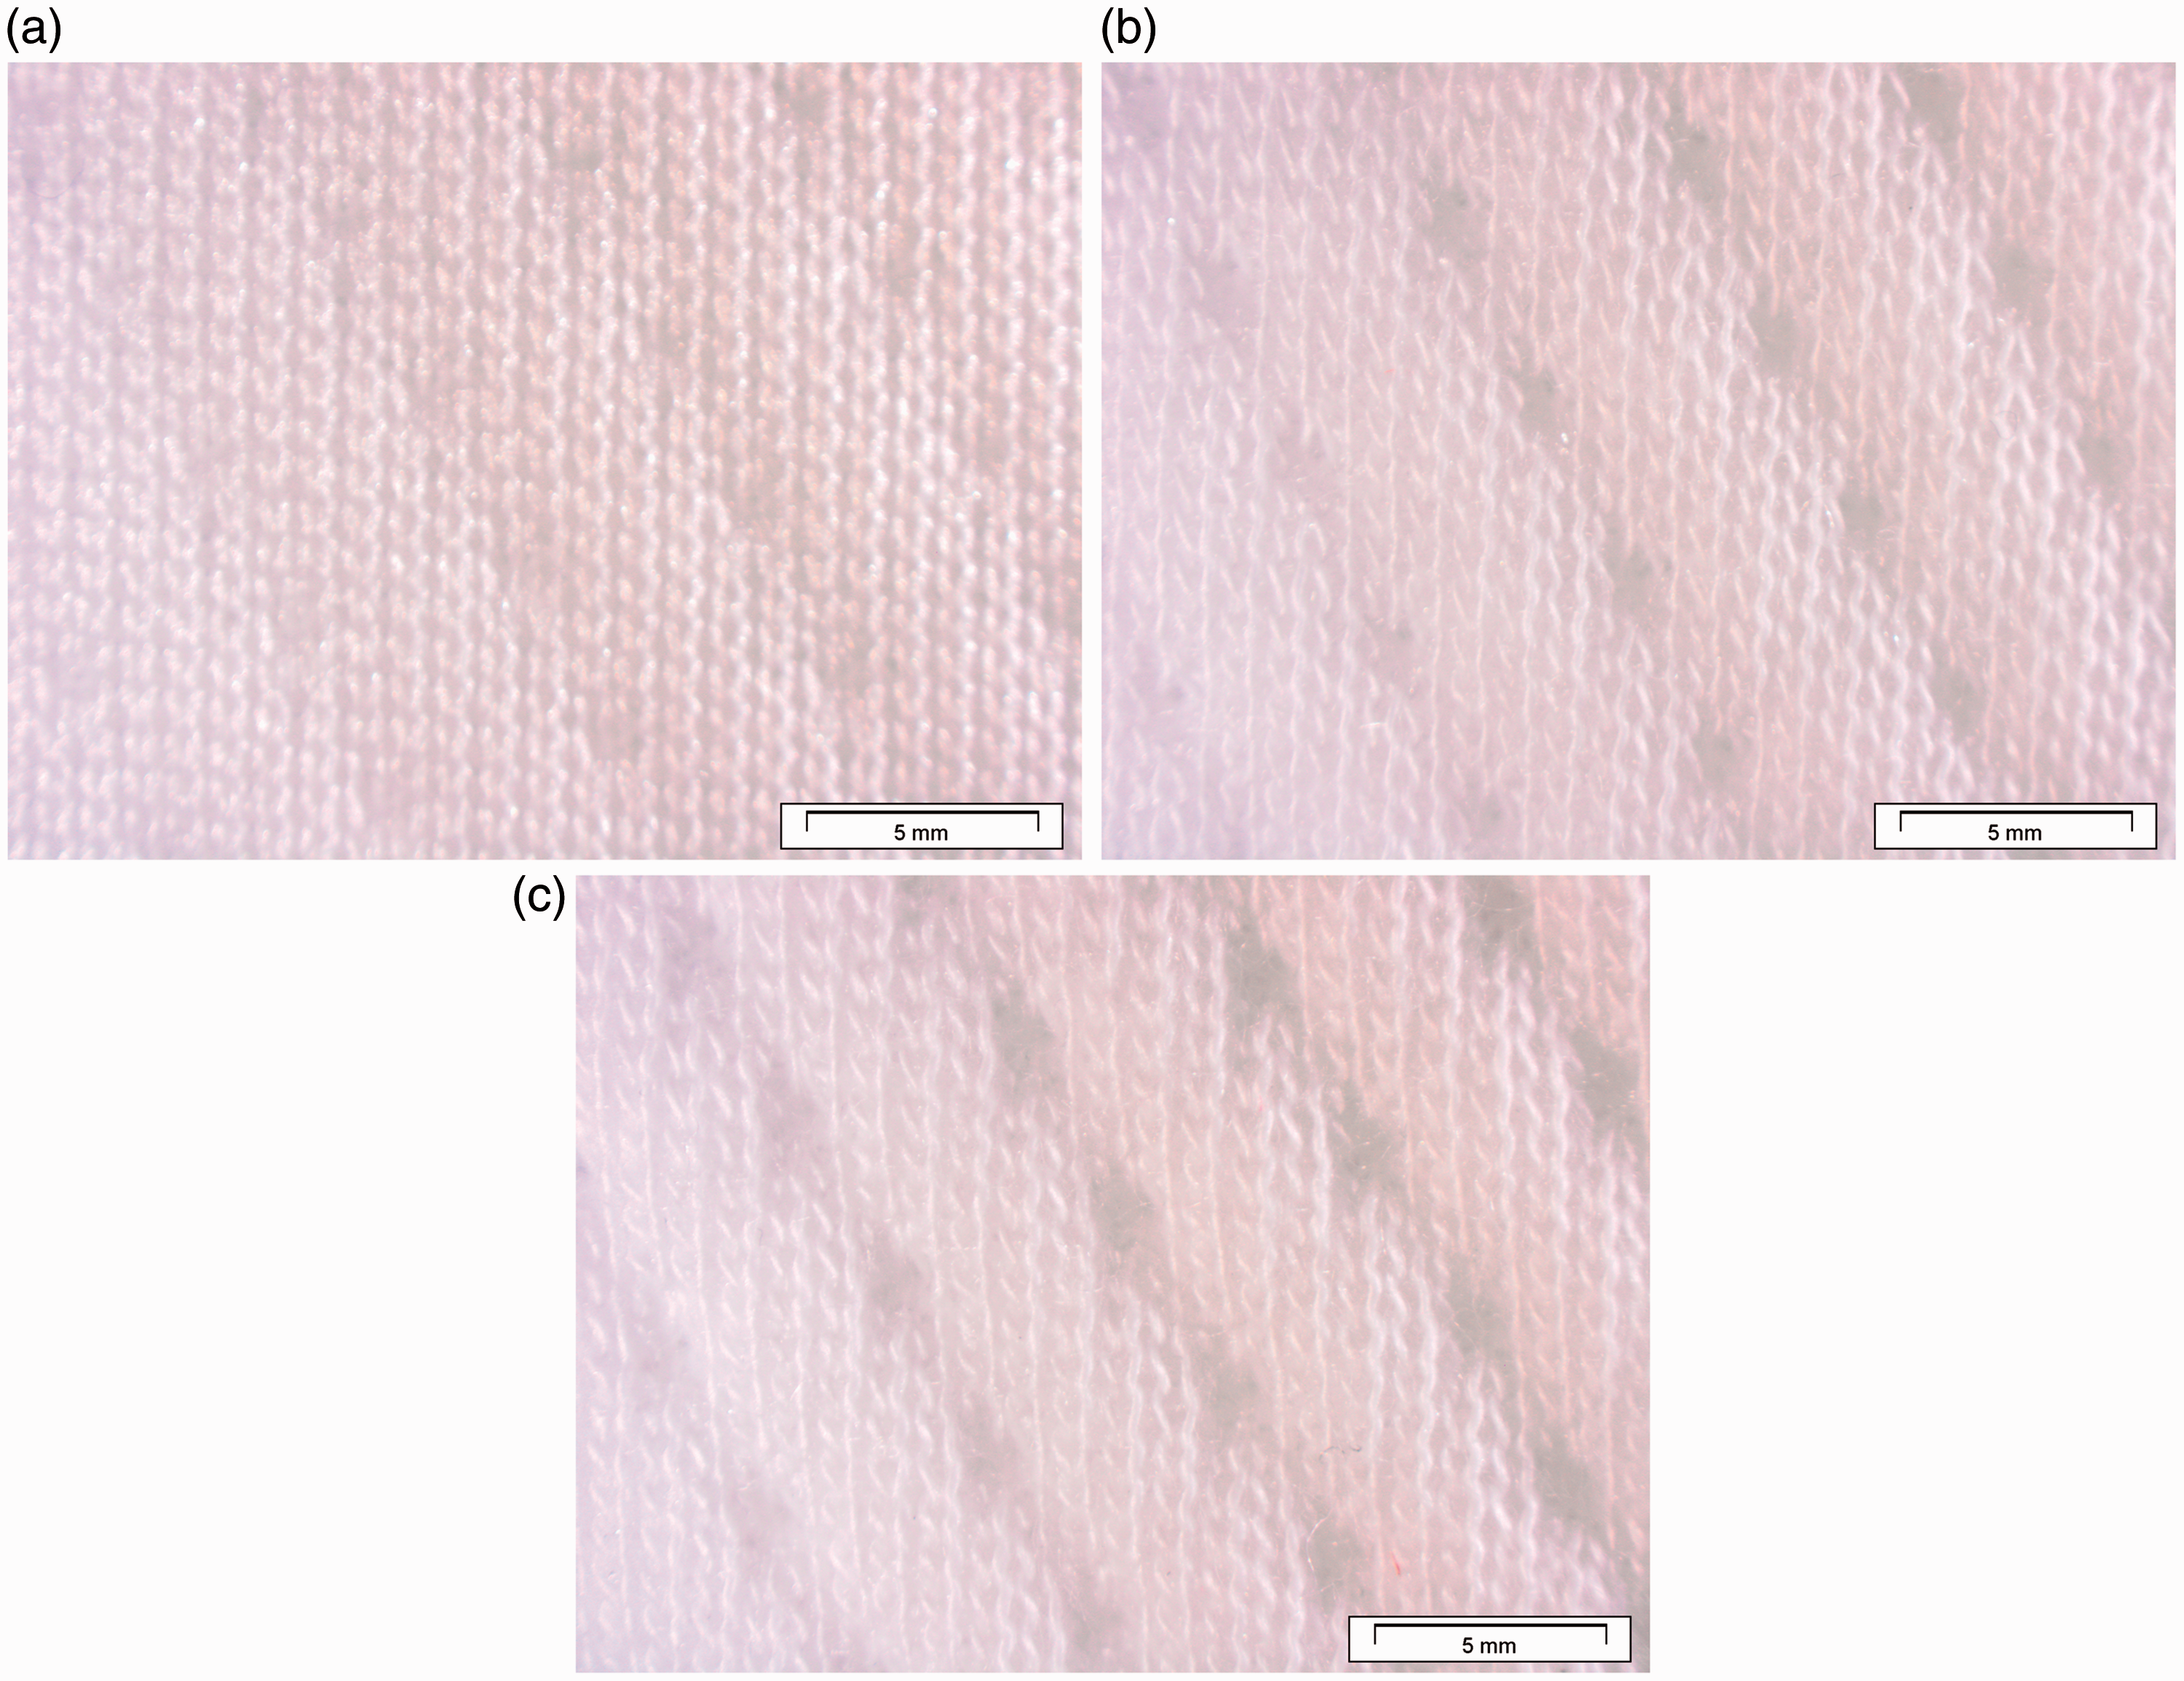
Texture of (a) fabric ID 10 (185 g/m2), (b) fabric ID 12 (275 g/m2) and (c) fabric ID 8 (560 g/m2); magnification × 6.3.
Objective assessment of fabric hand properties by the FTT
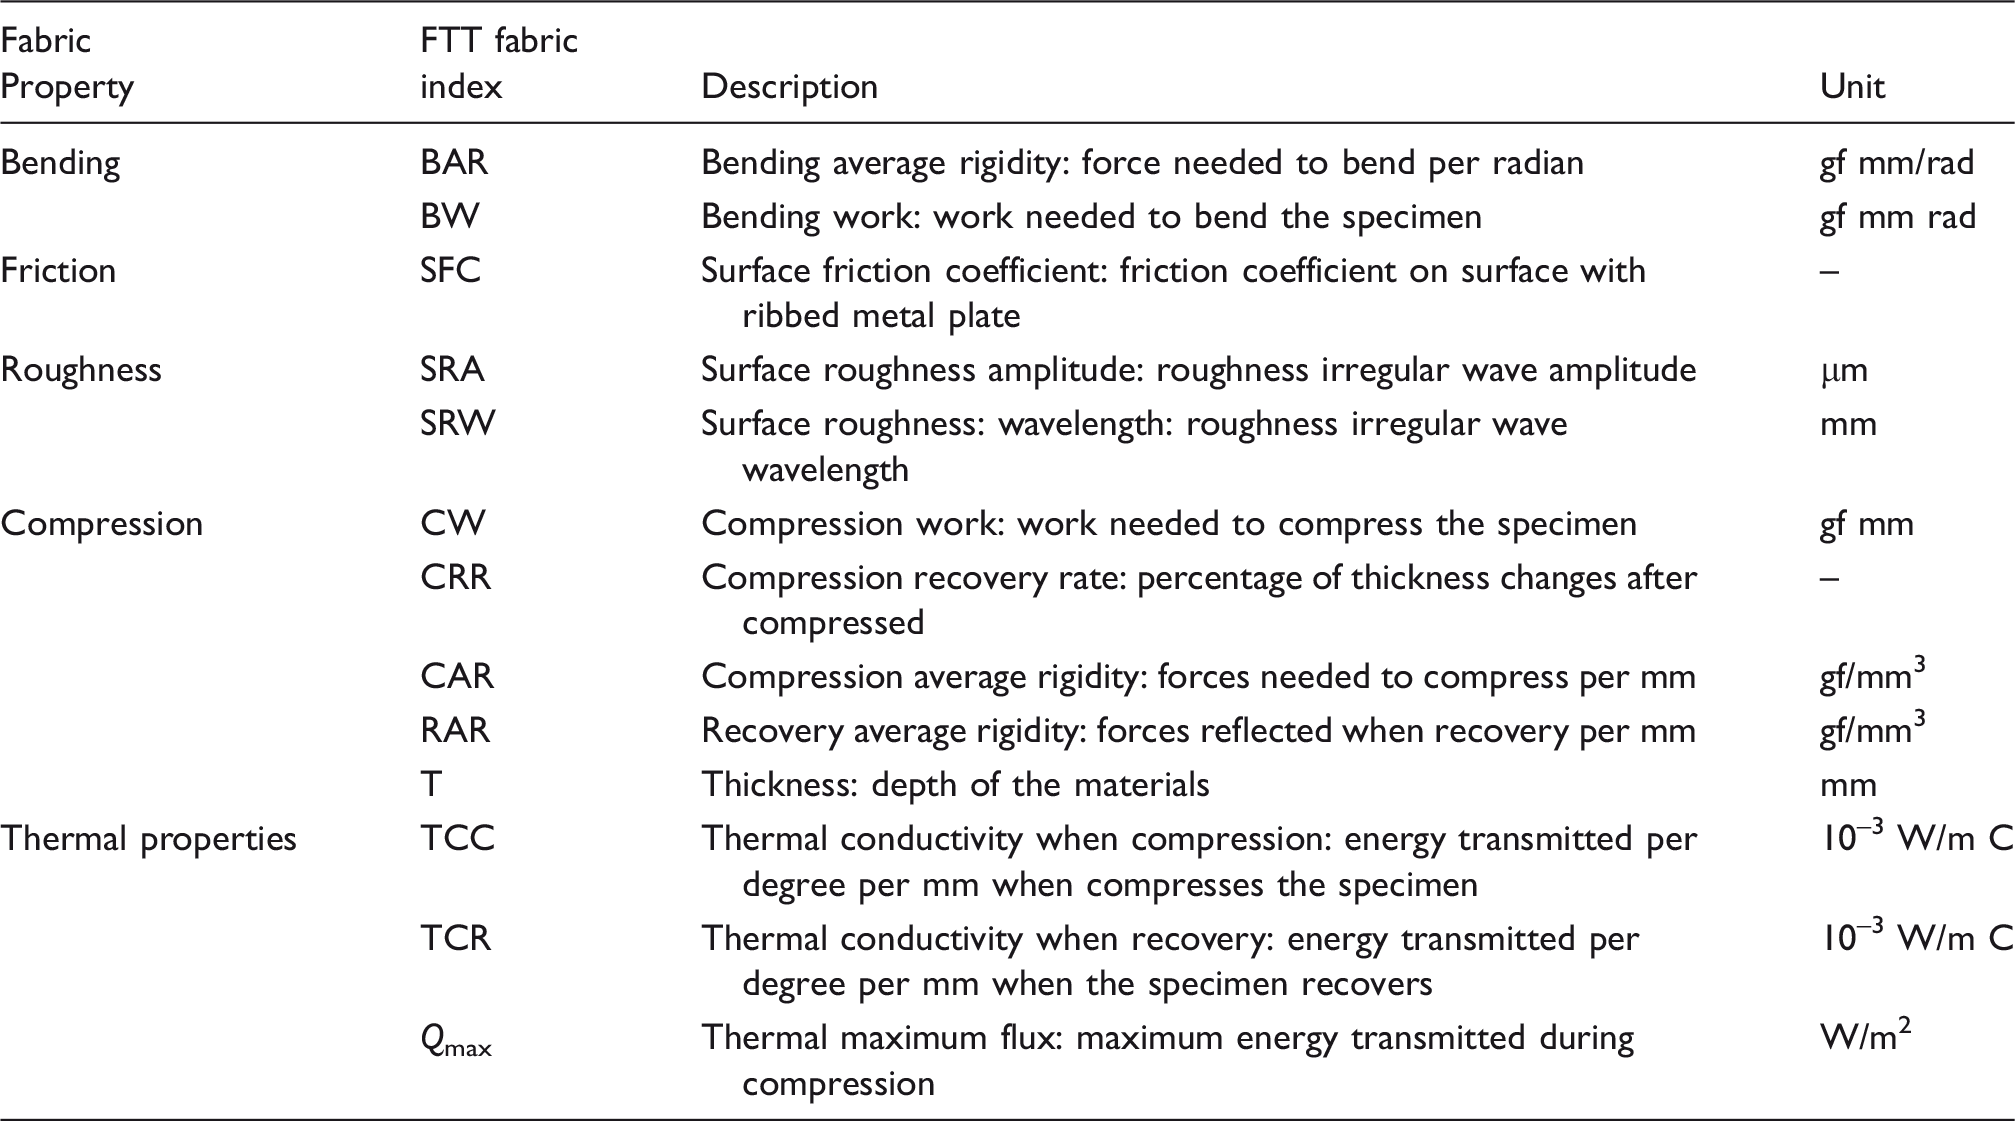
Definitions of the fabric indices measured by the Fabric Touch Tester (FTT)
Subjective assessment of fabric tactile properties by panels
Ten assessors evaluated the warmth, smoothness, softness, and flexibility of the 12 fabrics on a scale from 1 to 10, where a score of 10 indicates the warmest, smoothest, softest, and most flexible fabric. No reference fabrics were provided, so the fabrics were compared with each other. The 12 fabrics were assessed according to AATCC5-2011, evaluation method 8.1.2.25 The assessors were experienced textile researchers, five men and five women aged between 37 and 55 (44.3 ± 5.8). Each assessor received a questionnaire and a set of 12 square (20 cm × 20 cm) fabrics. The assessment took place in a conditioned room and the assessors were not blindfolded. The assessors were informed about the procedure and the fabric attributes to be evaluated were explained. The specimen was placed on a nonmetallic surface, with the surface to be evaluated uppermost. The warmth of the fabric was evaluated first by touching the fabric surface with the finger tips. The evaluator then touched the specimen by lightly pressing it with the fingers and the palm of the hand to evaluate its smoothness. Finally, the specimen was picked up and rubbed between thumb and fingertips (i.e. softness evaluation) and then bent to assess its flexibility. The assessors only evaluated the face-side of the mattress ticking fabrics to detect possible variations of tactile properties with fiber composition (polyester or viscose), which was varied only on this side of the fabric.
Results and discussion
Influence of the production parameters on the FTT fabric indices
Mean (standard deviation SD) of the Fabric Touch Tester fabric indices for the face-side of the 12 fabrics, in the wale (a) and course (e) directions

Influence of fabric mass per unit area (m), softener concentration (Soft), and viscose (CV) on the Fabric Touch Tester (FTT) fabric indices
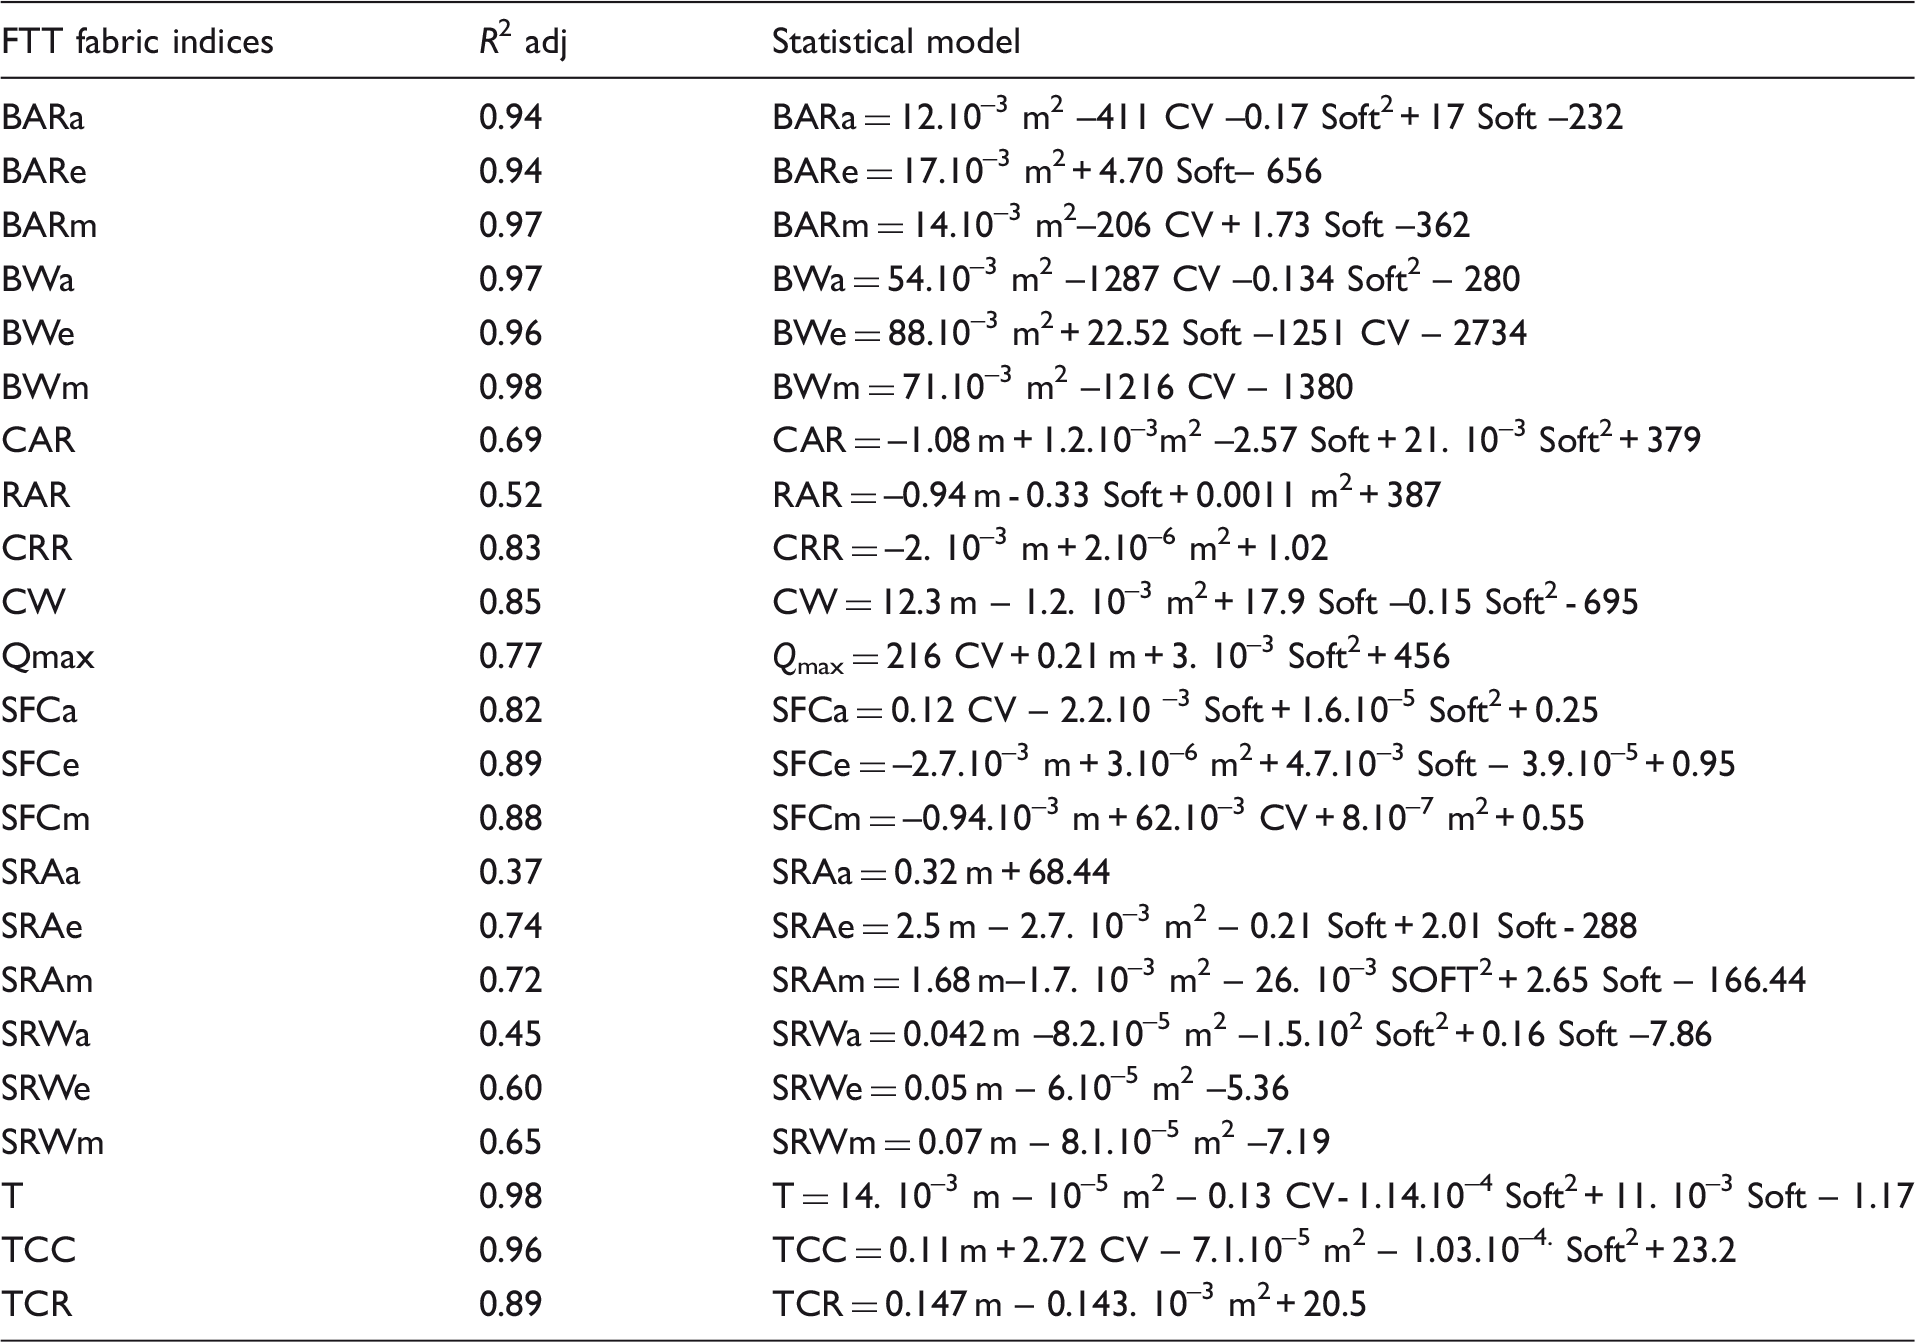
a: wale direction; e: course direction
Among the selected factors, fabric mass per unit area (m) has a dominant effect on all fabric indices, except surface friction coefficient in the wale direction (SFCa). This relationship is linear or quadratic. For instance, the bending indices quadratically increase with increasing mass (m). The same was noticed for the compression indices (except compression work CW) and surface friction coefficient in the course direction (SFCe). Compression work (CW) also is strongly influenced by mass per unit area, but the relationship is linear. It was quite expected that heavy fabrics will require high compression work to be bent or compressed. Moreover, thermal conductivity during compression (TCC), during recovery (TCR) and fabric thickness (T) exhibit a strong relationship with the fabric mass per unit area. In Figure 2 examples are given that illustrate the strong influence of mass per unit area (m) on (a) BAR and (b) average surface roughness wavelength (SRWm). In Figure 2 the full line indicates the predictive model as shown in Table 4, while the dots represent the measurements and the dotted lines are the confidence bands.
Influence of fabric mass per unit area (m) on (a) bending average rigidity (BAR) and (b) average surface roughness wavelength (SRWm).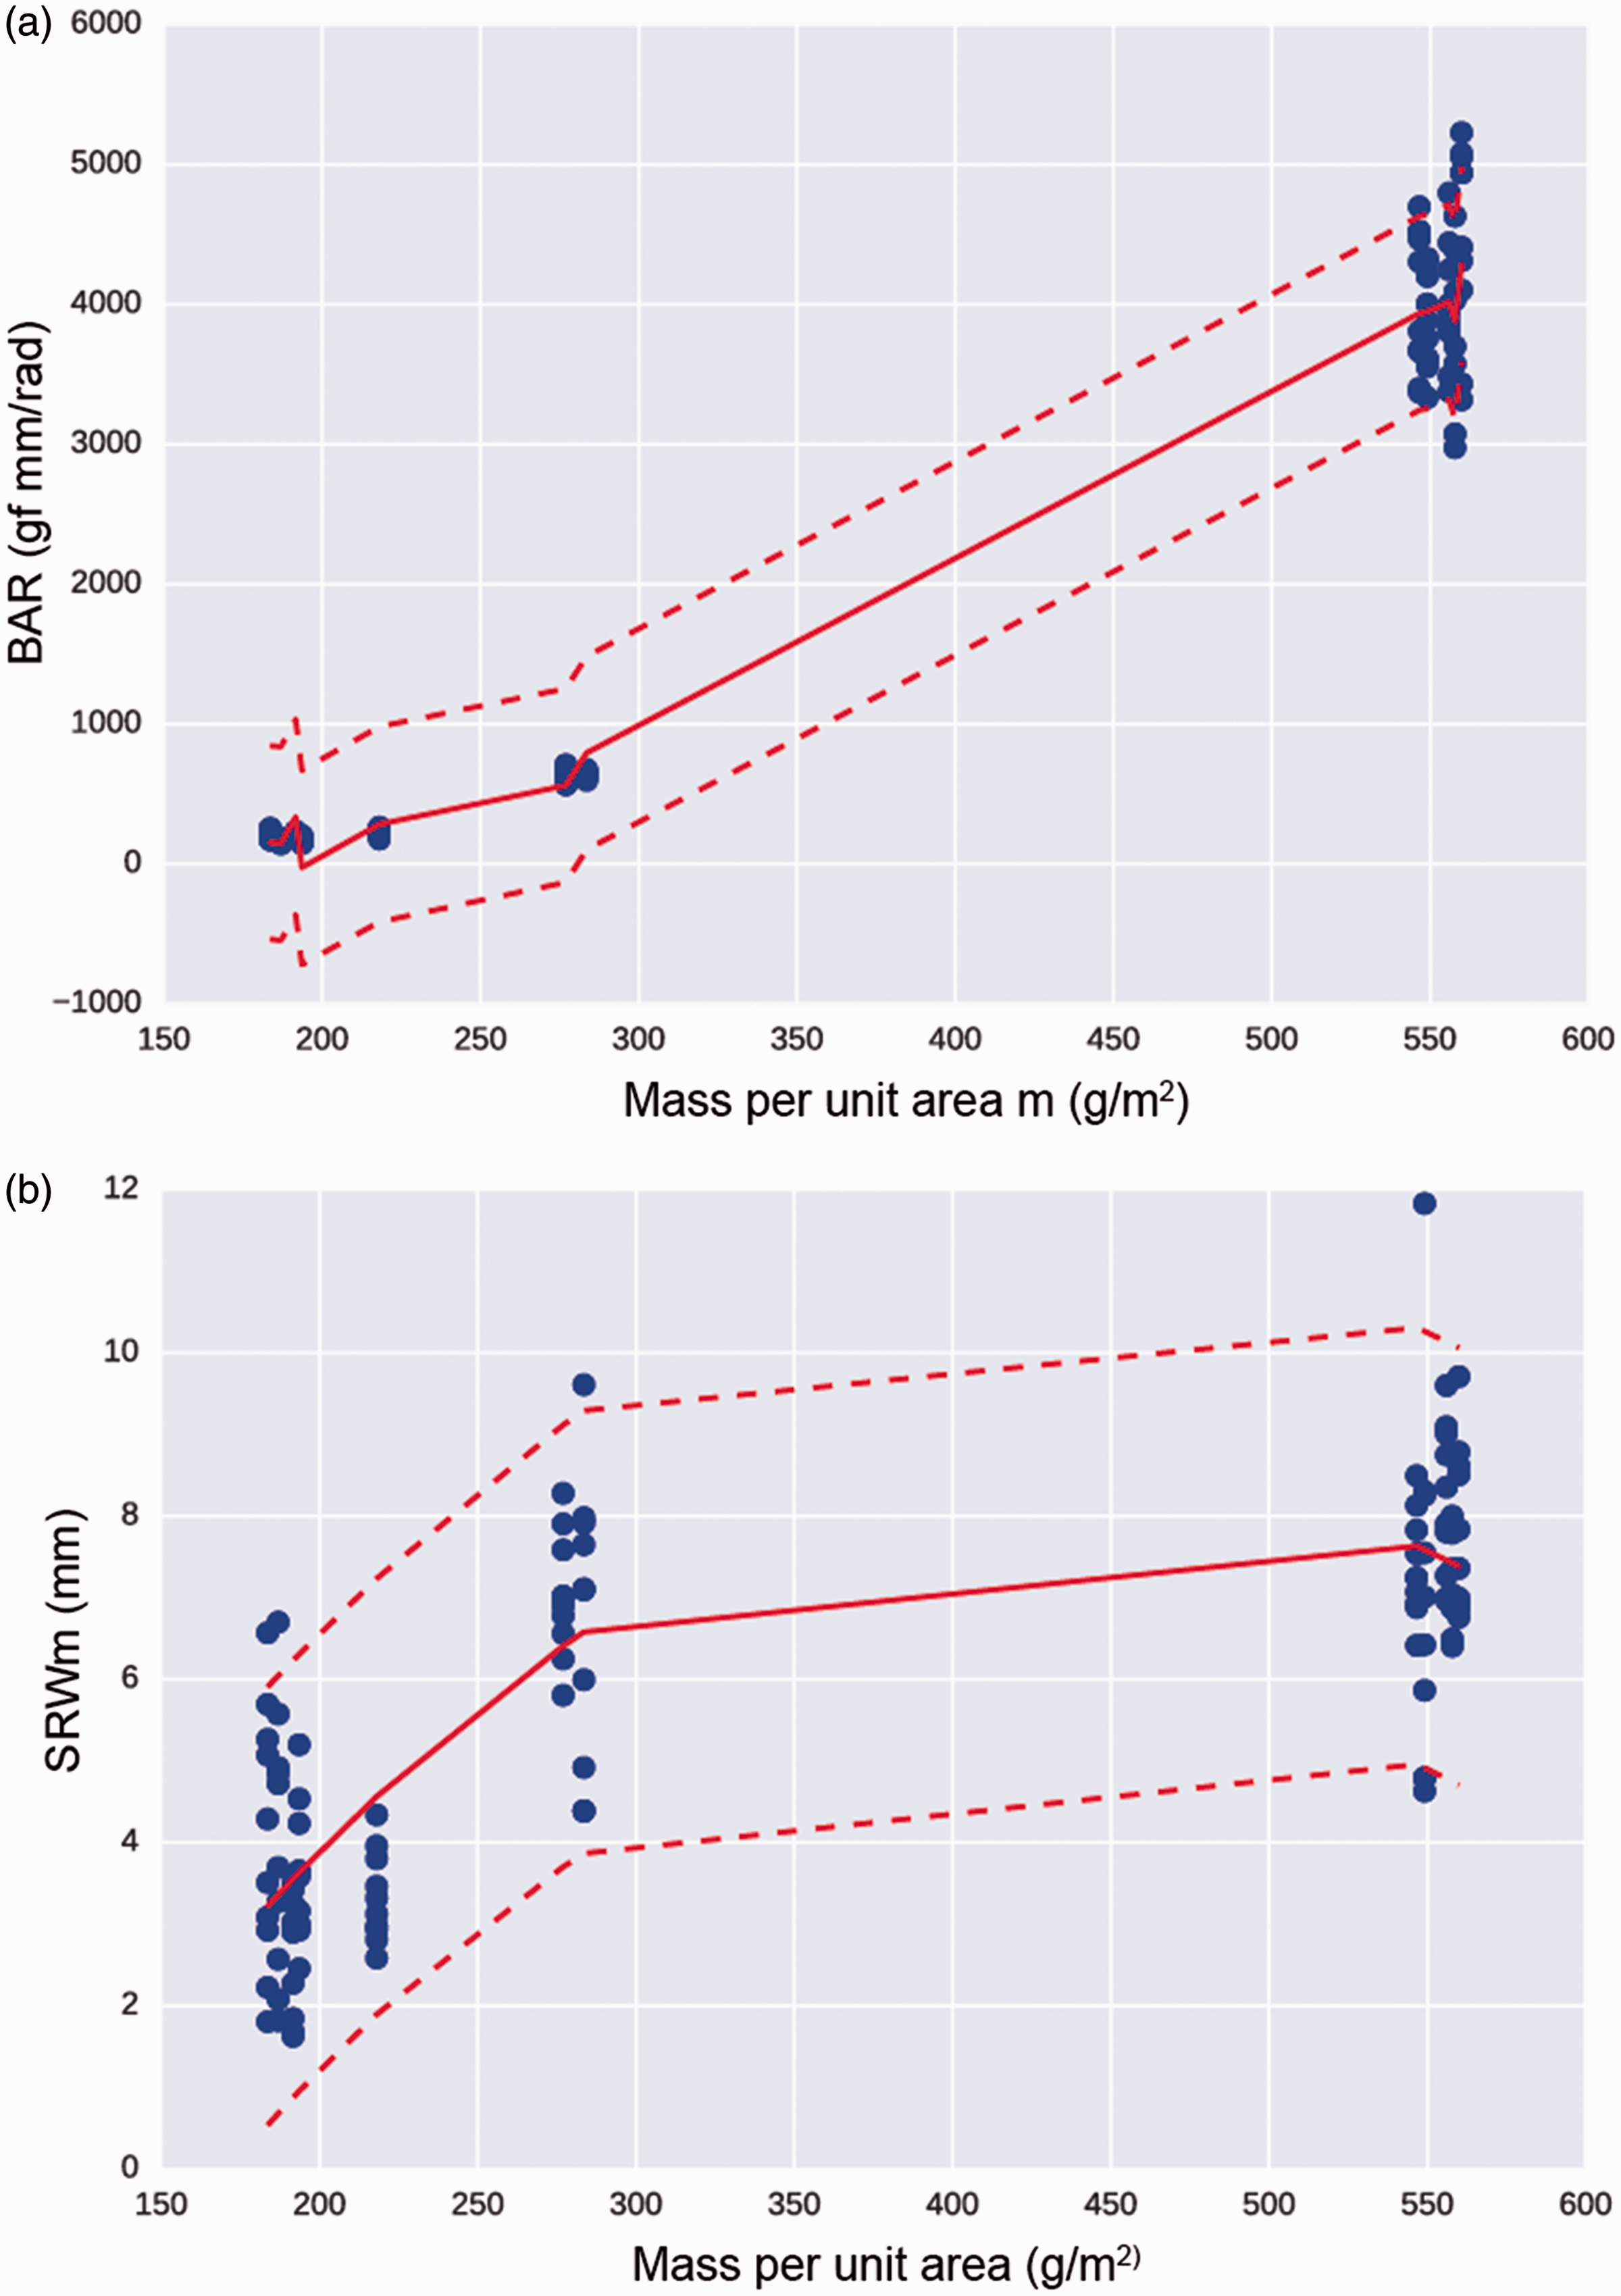
As shown in Table 4, softener concentration (Soft) has also a statistically significant influence (linear or quadratic) on almost all indices, but this influence is less pronounced than mass per unit area (m). The fiber composition of the upper layer has a statistically significant influence on several FTT fabric indices, such as BAR in the wale direction (BARa), BW (BWa, BWe, BWm), maximum thermal flux (Qmax), surface friction coefficients (SFCm) and on thermal conductivity during compression (TCC) and fabric thickness (T). For instance, the maximum thermal flux (Qmax) is higher in fabrics with yarns (CV) and these fabrics also have a higher average friction coefficient (SFCm).
As mass per unit area (m) is the dominant factor and its range is quite large (i.e. 185–560 g/m2) we have also analyzed the five lightweight samples (i.e. IDs 4, 6, 7, 9, 10) and five heavy samples (i.e. IDs 1, 2, 3, 8, 11) independently, to determine if viscose fibers (CV) and softener level (Soft) have an important influence within each group. We found that CV and Soft only play a minor role for bending properties and a major role for the compression properties of the heavy fabrics. CV is important to explain the Qmax differences within the group. For the light fabrics, composition CV influences the surface friction coefficient SFC, and the softener concentration (Soft) influences the roughness amplitude SRA. At the same time, for the heavy fabrics, the mass per unit area (m) is dominant and SRA changes are not related to composition or softener level. Mass has also a dominant effect on the roughness wavelength SRW but the heavy fabrics do show a dependence also on the concentration softener Soft. The thermal conductivity during compression (TCC) of both heavy and light fabrics is influenced by the composition (i.e. CV leads to higher TCC), while thermal conductivity measured during recovery (TCR) was not dependent on concentration and composition. These results correspond with the overall results shown in Table 4, where composition and softener concentration are mostly secondary effects in the models. The results indicate that the effects of composition and softener will depend on the mass per unit area of the fabric, and hence only come forward in a global model if the effect is likewise over the different weight groups or is sufficiently strong in a single group.
Fabric tactile properties assessed by panels
The mean values (M) and standard deviation (SD) of the scores given by 10 assessors for the fabrics’ warmth, softness, smoothness and flexibility can be seen in Figure 3, where the heaviest fabrics (IDs 1, 2, 3, 8, and 11) are indicated by a lighter color. Due to the high number of fabrics evaluated, disagreements were noticed between respondents, which are indicated by the large SDs bars. This is in agreement with previous research,
23
where 13 samples were ranked by panels and that recommended limiting the number of specimens to 10 or using another evaluation method, such as the paired-comparison technique. The best consensus between the assessors was achieved for flexibility, while warmth of the fabrics was most difficult to assess.
Mean scores and standard deviation given by assessors for (a) warmth, (b) smoothness, (c) softness and (d) flexibility for fabric IDs 1–12.
Influence of production parameters on selected tactile properties of the fabrics
Relationship between the tactile properties of the fabric and mass per unit area (m), concentration softener (Soft), and viscose composition (CV)
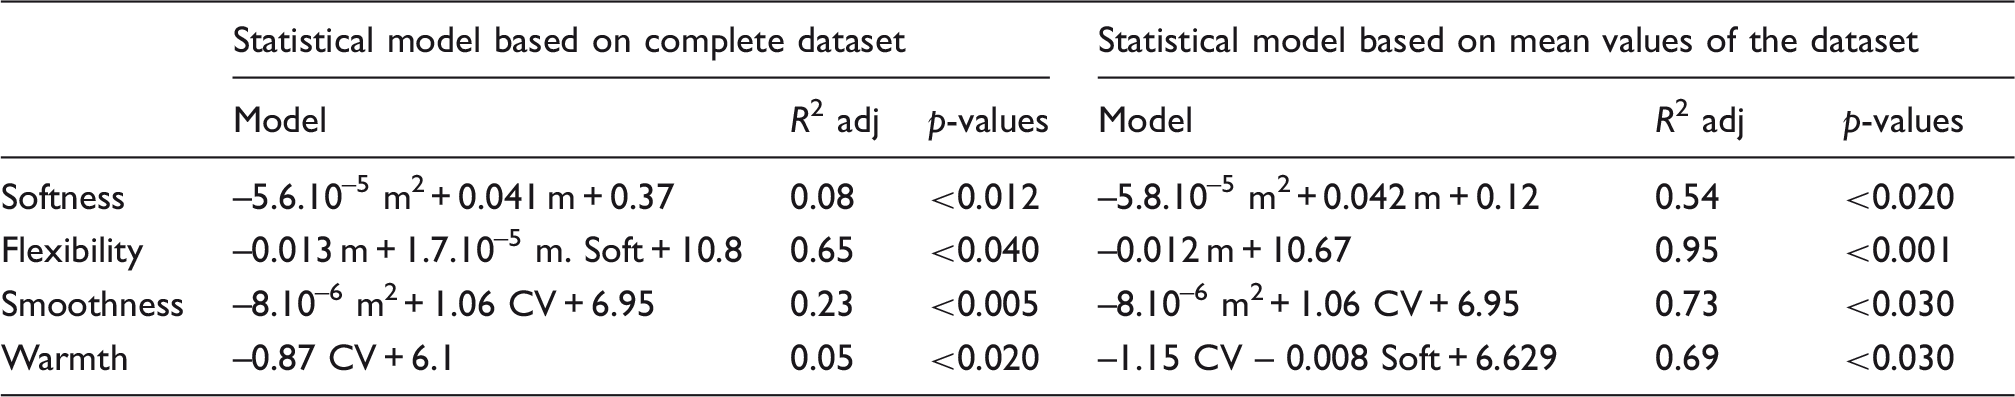
Among the three selected variables, only mass (m) has a significant influence on the softness of the fabrics, but it is a rather poor predictor, as indicated by the low R2 adjusted value. On the other hand, a good model was found for fabric flexibility which strongly depends on the fabric mass per unit area, while the overall model also detects an influence of the concentration softener. Although weak due to the variance in human grading, the statistical model in Table 5 suggests that viscose fabrics (CV) are smoother than the polyester fabrics (PES) and that smoothness of the fabrics with similar composition decreases when their mass per unit area (m) increases. A similar trend is also present in Figure 3(b), which shows mean scores of smoothness of 7.4, 6.4, and 4.5 for polyester fabric IDs 10, 12, and 8 with mass per unit area of 185, 275, and 560 g/ m2, respectively. To clarify this, the fabric IDs 10, 12, and 8 were analyzed with a stereoscope Olympus SZX10 equipped with a software Cell^D. These three polyester fabrics were treated with a similar quantity of softener (5 g/l) and were differentiated only by their mass (m). The images in Figure 1 show a change in texture with the fabric mass per unit area (m). This was also indicated by the FTT, which measured higher values for the surface roughness amplitude (SRA) for the heavier fabric IDs 1, 2, 3, 8, 11 as compared with the lightweight fabric IDs 4, 6, 7, 9, and 10 (see Table 3). This surface unevenness is a consequence of the production process of these double-layered knitted fabrics filled with BCF yarns. The negative influence of the mass (m) on smoothness should therefore be carefully interpreted and not extended to other type of fabrics with different architectures. Lastly, the mass per unit area seems to have no significant influence on fabric warmth. The statistical model suggests that viscose fabrics (i.e. IDs 2, 4, 5, 6, 11) are cooler than the polyester fabrics and the model that considers the mean values also shows a small negative influence of the softener concentration on fabric warmth. The model that considers the complete dataset is particularly weak, which is due to the high variance between the scores given by assessors, who had difficulties classifying the fabrics according to their warmth. Despite the poor model, the trend found seems to be correct and in line with other research. For instance, viscose fabrics (PES/CV) were found to be smoother and exhibited a higher Qmax than polyester fabrics (PES), as shown in Figure 4(a). Viscose fabrics seem to have a higher friction coefficient (SFCa) than polyester fabrics, as shown by model in Table 4 (SFCa = 0.12 CV – 2.2.10–3 Soft + 1.6.10–5 Soft2 + 0.25). The additional moderate, negative influence of the softener concentration on SFCa can be also seen in Figure 4(b). This is in line with other research
24
that showed an increase of Qmax with the increase in smoothness of the fabric surface. KES-F equipment was used in that study to assess several fabric indices and it showed that denim fabrics washed several times become smoother and feel cooler due to a higher Qmax. They also claim that successive washings reduce the surface roughness and lead to an increase of the friction coefficient. We have also analyzed the light and heavy fabrics separately. Within the group of heavy fabrics, only the mass per unit area (m) of the fabric had a significant influence on its warmth. Nevertheless, for the light fabrics, a similar model to the one shown in Table 5 can be constructed, which shows that viscose fabrics feel cooler and also that more softener leads to cooler fabrics.
Viscose fabrics (PES/CV) have a higher Qmax (a) and friction coefficient SFC (b) than polyester fabrics (PES).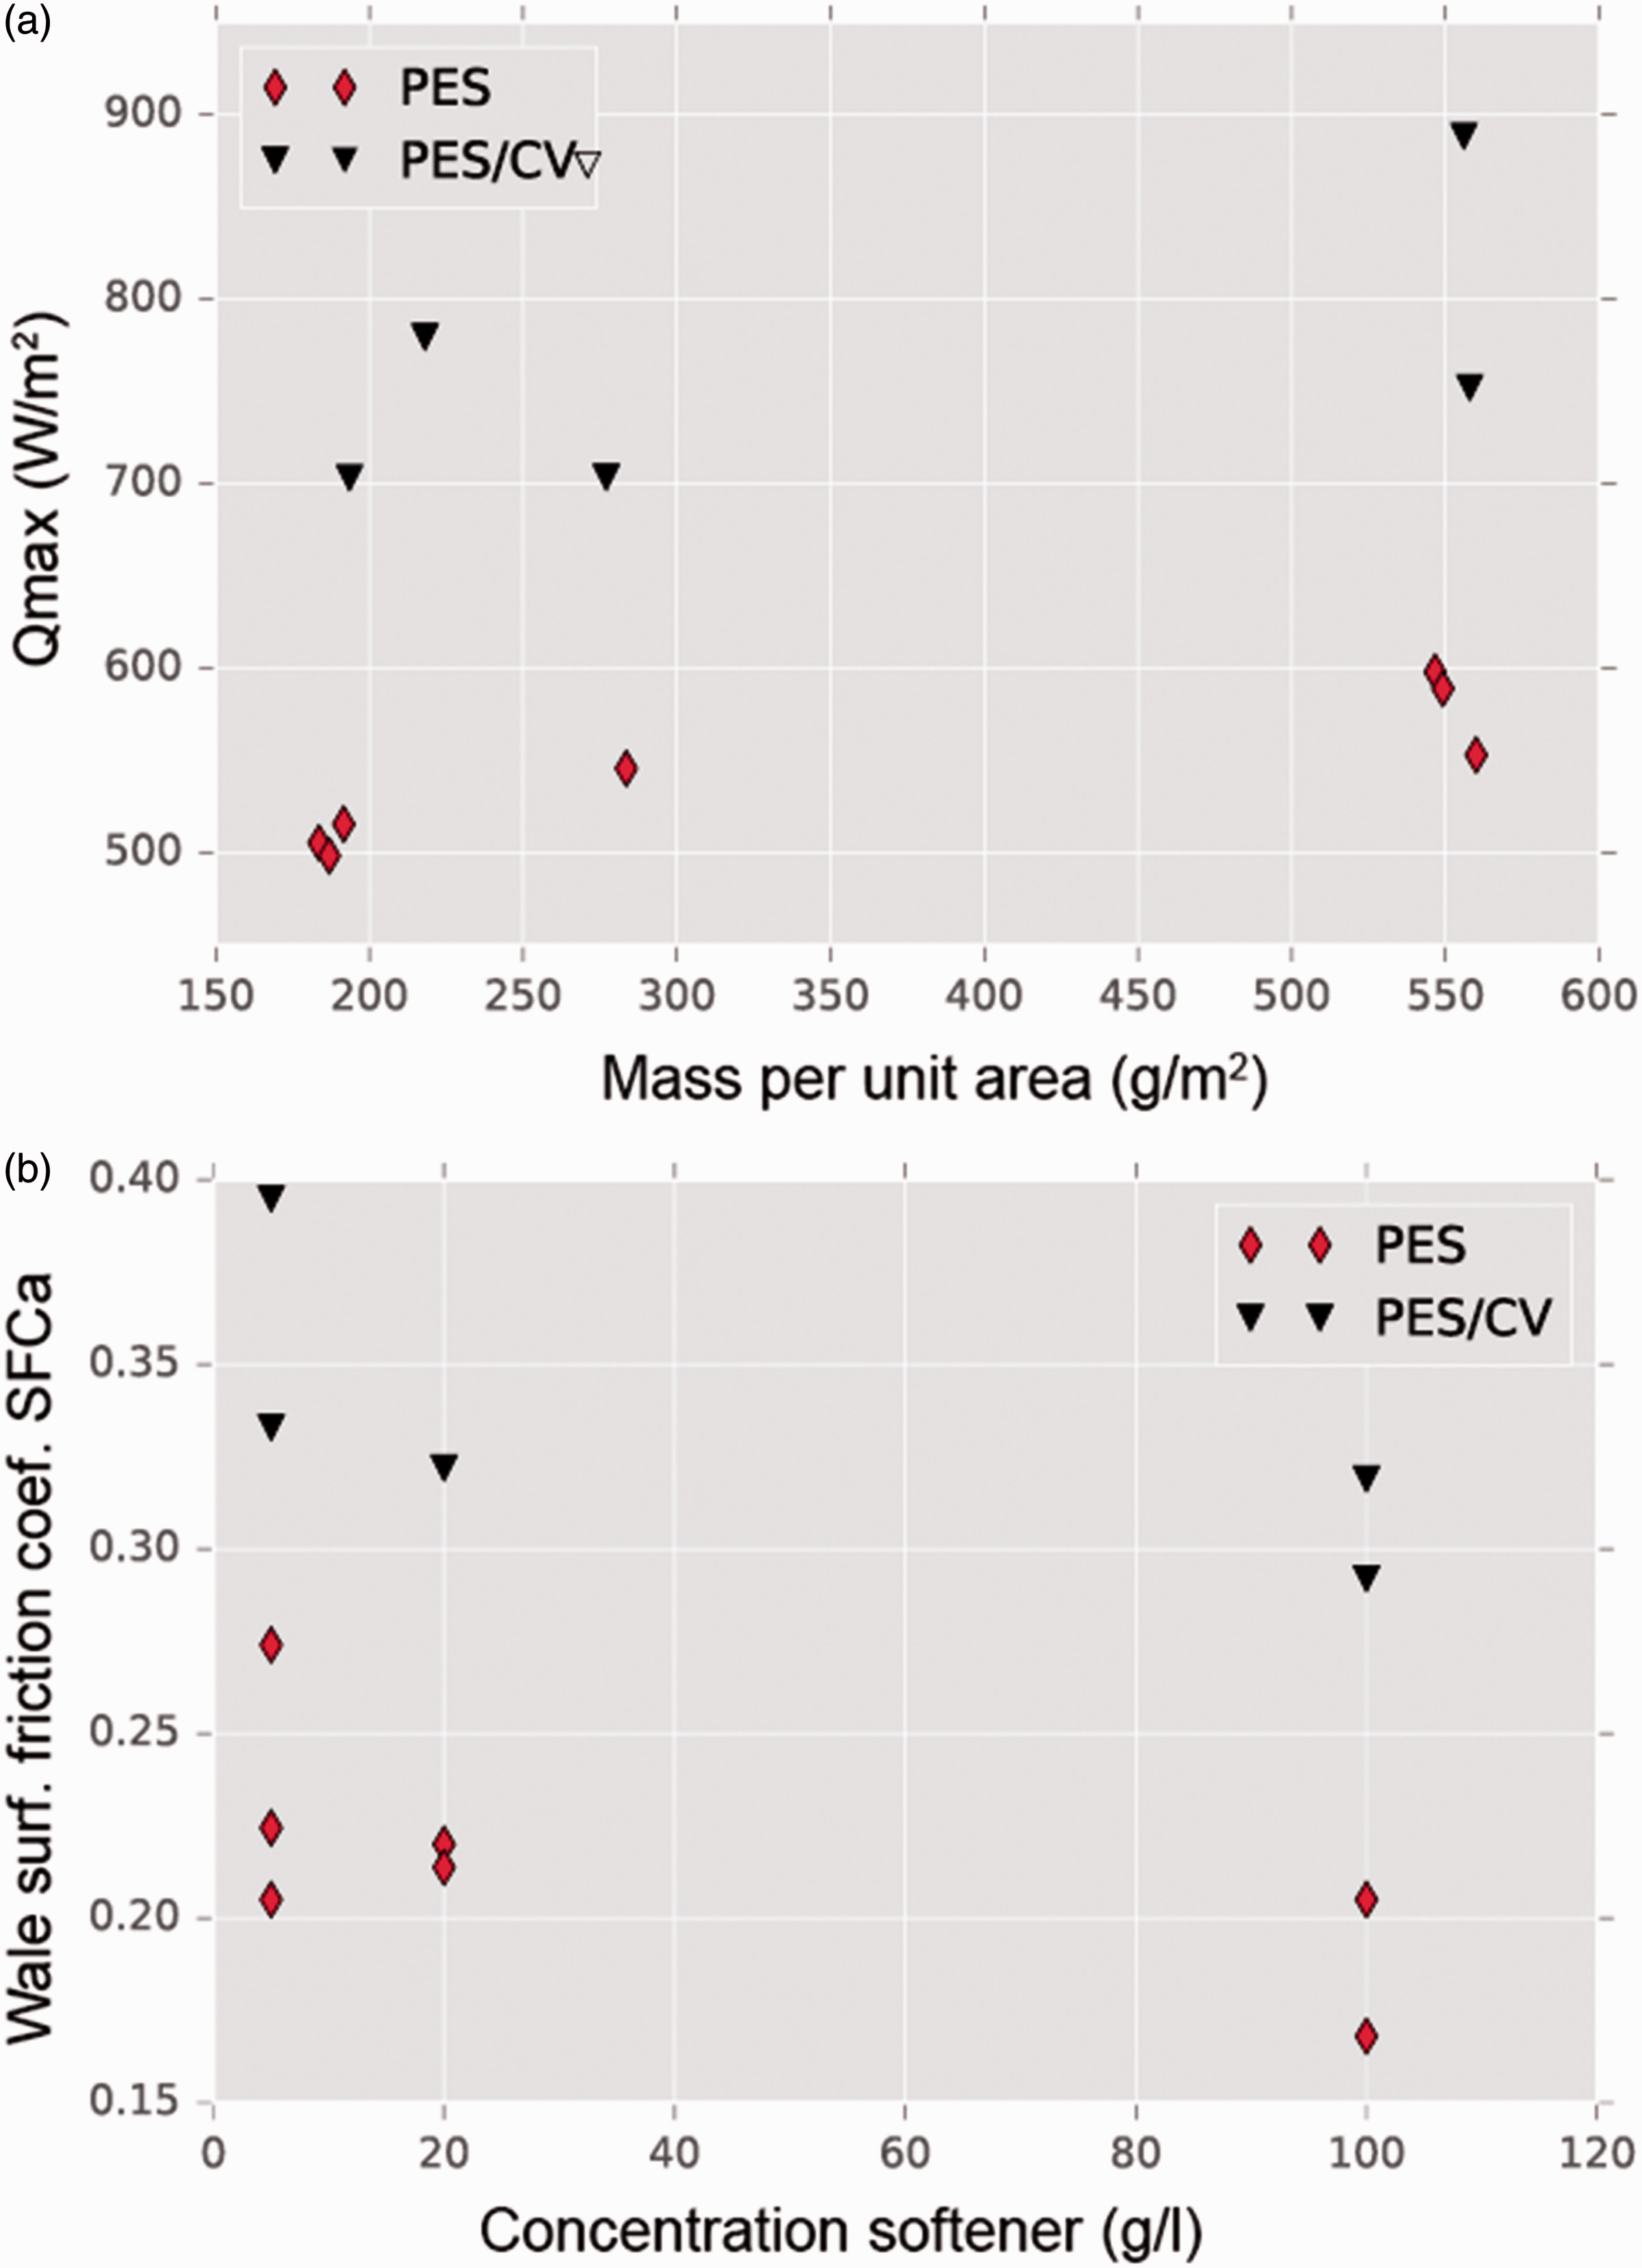
Influence of the FTT fabric indices on selected tactile properties of the fabrics
Relationship between the tactile properties assessed by panels and the Fabric Touch Tester fabric indices

It was found that the bending work BW, compression recovery rate CRR, roughness wavelength SRW and thermal conductivity TCR have a significant influence on the fabric softness (R
2
adj = 0.78) and fabric flexibility could be fully predicted based upon the differences in thickness, and hence mass per unit area. A very strong statistical model (R
2
adj = 0.88) was obtained for smoothness, which is positively influenced by the friction coefficient (SFCm), compression rigidity (CAR), and roughness wavelength (SRWm), and negatively influenced by compression recovery average rigidity (RAR). Hu et al.
17
evaluated various fabrics for clothing and found that compression properties (i.e. compression force FCmean) account for 69.5% and 77% of the variance in smoothness and softness, respectively. The increase of SFCm leading to smoother fabrics (see Figure 5(a)) is somehow unexpected but is, however, consistent with our findings in the Influence of production parameters on selected tactile properties of the fabrics section and other research.
24
As shown in Figure 1, the heavy fabrics have more texture, which reduces the contact surface between the FTT friction test element and the fabric and, hence, lower SFC is measured. The texture variation with the fabric mass per unit area leads also to higher roughness SRWm and lower CAR and may justify why the panel evaluates the heavier fabrics as less smooth (see Figures 5(b) and (c)).
Lightweight fabrics (m 185) exhibit a high friction coefficient SFCm (a), low roughness SRWm (b), and high CAR (c), and are evaluated as smoother than the heavy fabrics (m 560).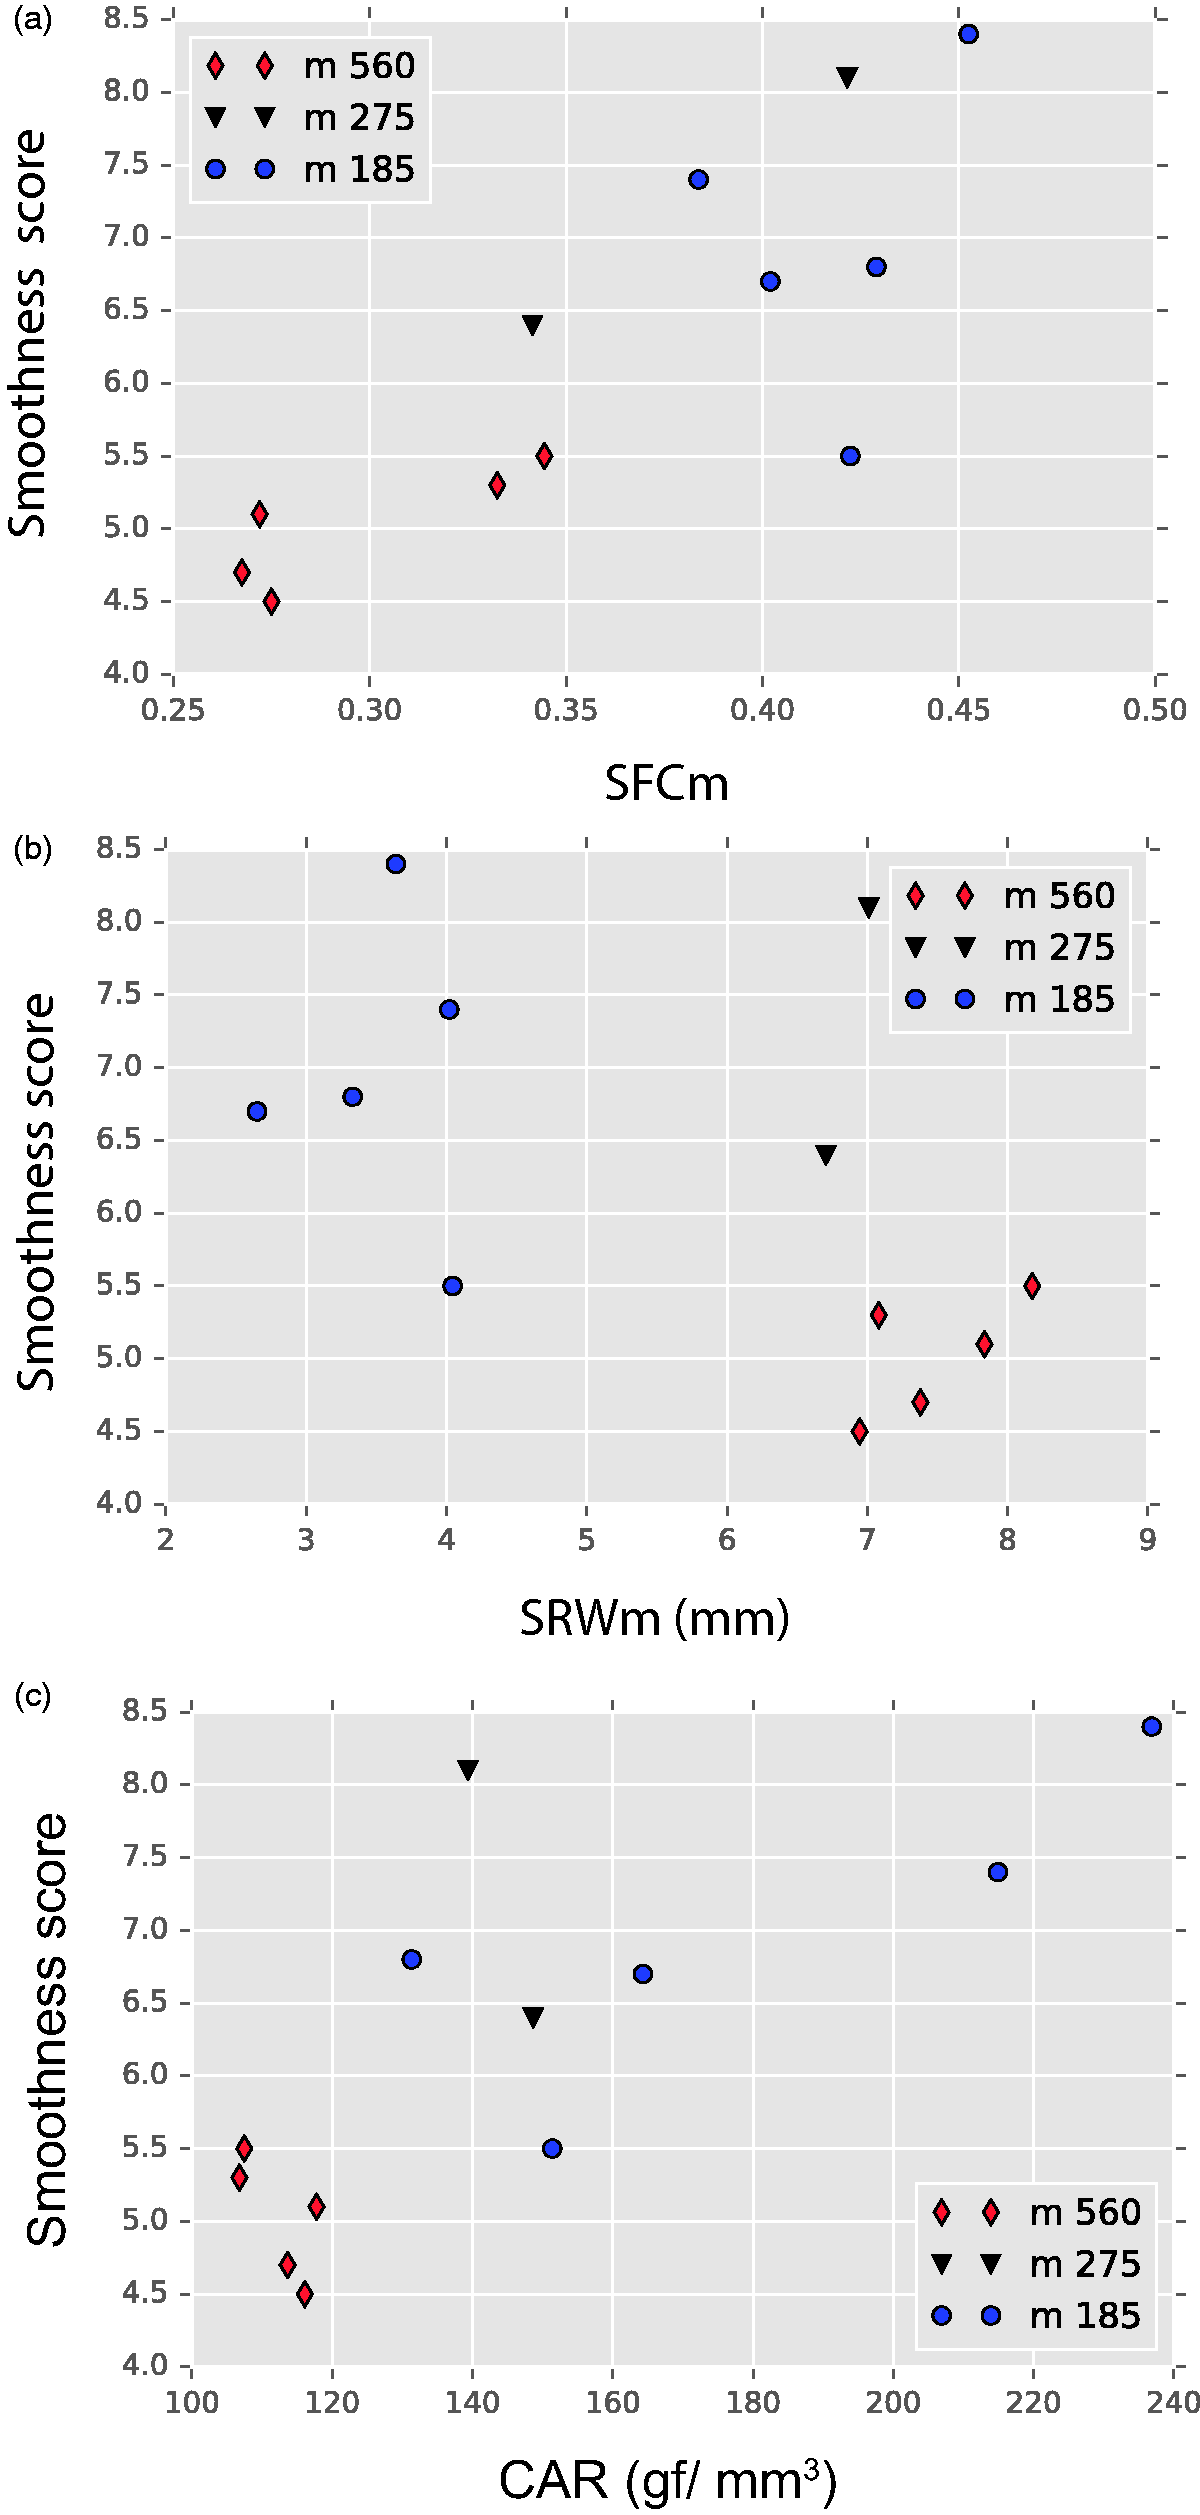
In the model constructed, SRWm acts as a correction term, with SCFm as the primary variable, explaining the positive sign of the SRWm coefficient. This shows that focusing only on friction coefficients to evaluate smoothness is not correct. A lower SFCm leads to a smoother fabric only if the other properties of the fabric (i.e. roughness), can be kept constant, which is not the case for the considered mattress ticking fabrics. Concerning the FTT and the used friction plates to measure friction, the SFCm can only be used as a direct predictor for smoothness if the fabrics used have sufficiently smooth surfaces. This is not the case for our fabrics; therefore, we constructed a smoothness model excluding SFCm. The model obtained via stepwise regression (Smoothness = –1.86.10–4 BWm + 3.54.10–3 Qmax + 0.02 CAR + 0.19 TCR – 6.89) is slightly better (R 2 adj = 0.89) than the original model, although the first terms have slightly worse p-values than the original model. This model shows the same CAR-dependency, while friction and roughness terms have been replaced by BW and thermal variables. The thermal input corresponds with cooler fabrics feeling smoother, while increasing BW also leads to less smooth fabrics. The warmth of the fabrics could not be modeled well with the FTT fabric indices. A weak relation with Qmax is obtained (R 2 adj = 0.39), with warmer fabrics having lower Qmax as expected, but this is not sufficient to explain the panel results. It seems that the FTT does not measure sufficient parameters to grasp the full warmth feeling of humans on touch or the human variation in grading is too large to obtain good models based on 10 assessors. The model can be improved (R 2 adj = 0.713) by considering mixed terms and quadratic terms (i.e. warmth = –0.016 SFCm*Qmax – 0.43 T2 + 0.002 TCC * TCR), but at the cost of an overly complex model.
Conclusions
In this study the influence of three production settings on the fabric hand assessed by the FTT and four tactile properties assessed by expert panels was investigated. Among the selected variables, fabric mass per unit area has the largest influence on all FTT fabric indices. Considerable variances were observed between the scores assigned by the panel due to subjective perception of assessors and probably also due to the large fabric set. That resulted in poor correlations between tactile properties and selected production parameters, although the trends seems to be correct and all the factors were found to be statistically significant.
This study shows once again the complexity of the fabric hand assessment, both by human subjects and instruments. Correct subjective assessment is particularly complex in the case of a high number of fabrics with special textures. Nevertheless, strong correlations were found between the FTT fabric indices and tactile properties assessed by the panels, except warmth. The results are promising and show the potential of the FTT to assess mattress ticking fabrics, with elevated mass per unit area and uneven texture and also its ability to distinguish between such fabrics differentiated by several production parameters. Nevertheless, further research should be conducted to confirm these results and build statistical models dedicated to these types of fabrics to predict their primary and global comfort indices.
In our study the fabric mass per unit area is varied within a large range and, therefore, this parameter was identified as most significant among all three variables considered. Further studies should narrow this range to correctly identify the contribution of other factors, such as fibers, softener concentration, etc. Also, the size of the fabric set should be reduced to allow more accurate subjective evaluation. These findings are relevant to stakeholders of mattress ticking fabrics. Previous research paid limited attention to the sensorial comfort of mattress ticking fabrics, although enhanced fabric hand seems to be demanded more and more by customers. The results suggest how selected production parameters may be tuned to enable price-efficient engineering of fabrics with enhanced tactile properties. Changes of fabric hand due to production settings were clearly quantified by the FTT, an instrument that was previously mainly employed for clothing fabrics.
Footnotes
Acknowledgements
The authors would like to acknowledge company BekaertDeslee Textiles for producing the fabrics, as well as Myréne Vanderhoeven for performing FTT tests.
Declaration of conflicting interests
The authors declared no potential conflicts of interest with respect to the research, authorship and/or publication of this article.
Funding
The authors disclosed receipt of the following financial support for the research, authorship, and/or publication of this article: This work was supported by IWT Belgium within the international ERANET-CORNET research project Touché, IWT 140387.