



Abstract
Monitoring the light-induced decomposition course of azo dyes is essential to understand their degradation pathways and mechanisms. In this study, two model dyes are synthesized and used for stimulating the photodegradation processes of azo and hydrazone dyes, respectively. Their intermediates formed during initial and final fading processes are characterized by high-performance liquid chromatography-electrospray ionization-mass spectrometry, gas chromatography-mass spectrometry and ion chromatography. Results reveal that no dramatic differences are observed between the two dyes, although hydrazone dye would undergo a more complicated degradation process. Hydroxyl radicals are the dominant reactive species involved in the photodegradation of both model dyes under ultraviolet irradiation. In the initial steps, the intermediates are almost hydroxylated derivatives, while low-molecular-weight dicarboxylic acids and their hydroxylated and esterified derivatives, as well as non-volatile inorganic ions, are detected and evidenced in the final steps. Furthermore, photodegradation pathways and mechanisms for the two model dyes are proposed accordingly.
Keywords
Azo dyes, as one group of the most important synthetic colorants, have abundant species and tremendous consumption. Nevertheless, compared with other kinds of dyes, most azo dyes show relatively poor photostability, which not only reduces visual quality and added value of garments, but also produces numerous toxic substances to contact skin directly and threatens human health.
Generally, the complex photofading process of azo dyes derives from various factors and their intrinsic chemical structures always play a determining role.1–3 In particular, substituent groups have been demonstrated to impose distinct effects on azo-naphthylamine or hydroxyazo dyes. For instance, Kienle et al. 4 considered that electron withdrawing groups would accelerate the fading of a series of substituted hydroxyazo dyes, while Atherton and Peters 5 observed the opposite effects on benzene azo-naphthylamine dyes. This contradictory phenomenon was then explained by an azo-hydrazone tautomerism mechanism of hydroxyazo compounds, 6 according to which, the tautomeric equilibrium of hydroxyazo compounds was primarily affected by the nature (electron withdrawing or donating) of substituents. Subsequently, a correlation was obtained between the dye fading rate and the content ratio of hydrazone to azo. 7 Furthermore, Hempel et al. 8 pointed out that the fading rate of azo dyes in azo form was enhanced by electron donating substituents, while that of hydrazone tautomer was promoted by electron acceptors.
Due to difficulties in detecting the content ratio of hydrazone to azo, 9 numerous works have been done on the physical chemistry and reactive species involved in the dye photodegradation. It was proposed that oxidation decoloration of azo dye involves singlet oxygen generated by its hydrazone tautomer. 10 However, Jansen et al. 11 and Yamaguchi and Sasaki 12 suggested a quite weak function of singlet oxygen in the photodegradation of hydrazone dyes, and Kuramoto and Kitao 13 detected both photochemical oxidation and reduction products. Okada and Morita 14 also indicated that the fading process of reactive azo dyes involved both photochemical oxidation and reduction, and mainly photooxidation in the presence of oxygen. Imada et al. 15 found that hydrazone dyes tended toward photooxidation, while azo dyes preferred photoreduction. However, Hihara et al. 16 found that azo dyes were more susceptible to singlet oxygen than hydrazone dyes (i.e. photooxidation was easier for azo dyes) using the semiempirical molecular orbital PM5 method. Despite numerous studies on the photofading of azo dyes, an extremely complex picture emerges and related photofading mechanisms still remain unclear.
With the development of experimental equipment and methods, substantial researches have focused on the photodegradation pathways and mechanisms of azo dyes.17,18 However, only a few have noted the roles of intermediates formed during the photodecoloration of sulfonated azo dyes. 19 Recently, gas chromatography/mass spectrometry (GC-MS), 20 high-performance liquid chromatography/mass spectrometry (HPLC-MS) 21 and HPLC with ultraviolet-visible spectroscopy (UV-Vis) 22 have been reported as suitable methods for monitoring the degradation of azo dyes. Electrospray ionization mass spectrometry (ESI-MS) has been employed for structural identification of sulfonated azo dyes. 23 However, there is still a lack of sufficient information about photodegradation intermediates of azo dyes, especially sulfonated intermediates. To further reveal their degradation pathways and fading mechanisms, the analysis of photodegradation intermediates seems necessary.
In the present work, two sulfonated azo dyes were synthesized and used as model dyes. The degradation products of both under ultraviolet (UV) irradiation are analyzed and identified using HPLC-ESI-MS, GC-MS and IC (ion chromatography). As a result, the light-induced degradation pathways and mechanisms of sulfonated azo dyes are proposed.
Experimental details
Chemicals
Sodium 4-amino-naphthalenesulfonate (>95.0%) and sodium 1-naphthol-4-sulfonate (>85.0%) were purchased from TCI (Shanghai) Development Co., Ltd. All other reagents were of analytical purity and used as received from Sinopharm Chemical Reagent Co., Ltd. High purity water (resistivity = 18.2 MΩ·cm) made by a Master-S plus UVF ultra-pure water system (Hitech Instruments Co., Ltd, China) was used throughout the study.
Synthesis of model dyes
Synthesis of sodium 1-amino-2-arylazophthalene-4-sulphonic (dye 1)
The synthesis of dye 1 required two steps:
24
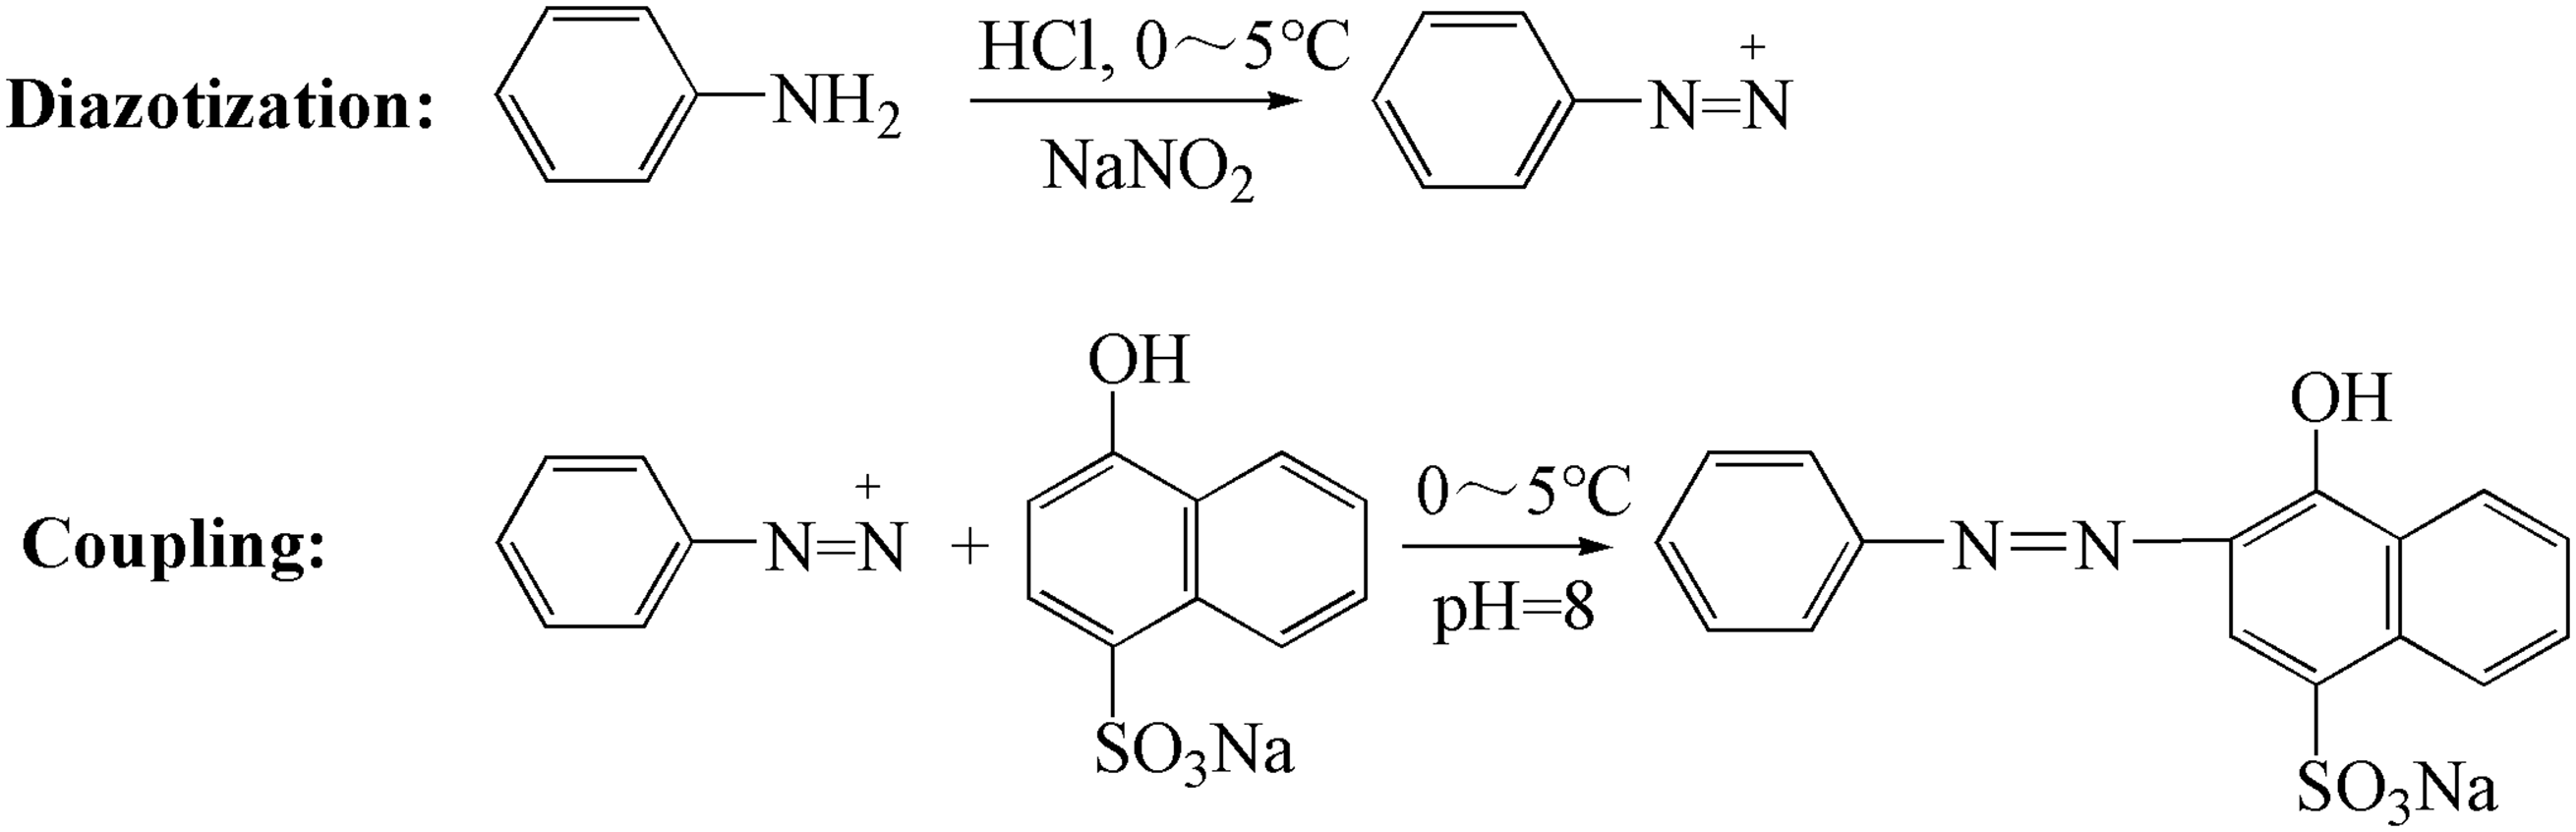
(i) diazotization and (ii) coupling (Figure 1).
(i) Diazotization: aniline (1.86 g, 0.02 mol) and hydrochloric acid (36%, 4 mL) were dissolved in 25 mL water, and the solution was stirred at 0–5℃. After 5 min, 25 mL sodium nitrite solution (0.84 mol/L) was added. The diazotization process was monitored by Ehrlich reagent. The patch test of the Ehrlich reagent confirmed that aniline had been consumed. Excess nitrous acid was destroyed by the addition of sulfamic acid (0.2 g, 0.002 mol) as the color of potassium iodide starch paper changed from brown to blue. Finally, transparent solution A was obtained. (ii) Coupling: sodium 1-naphthol-4-sulfonate tetrahydrate (5.42 g, 0.021 mol) was dissolved in 30 mL water and solution B was obtained. Solution A was added into solution B under sufficient stirring. The pH of the coupling reaction solution was adjusted to 5 by Na2CO3 solution. After 3 h, a patch test of sodium 1-amino-8-naphthol-3, 6-disulfonate confirmed that the coupling reaction had completed, and the pH of the reaction solution was increased to 8. Sodium 1-amino-2-arylazophthalene-4-sulphonic was precipitated by adding sodium chloride (1.5 g), and isolated by filtration. The product was recrystallized and dried in a vacuum oven at 60℃. A product purity of above 99% was tested by HPLC (Eclipse XDB-C18 (250 mm × 4.6 mm) mobile phase composed of 0.005 mol/L acetonitrile-tetrabutylammonium bromide (60/40, v/v, UV-detector). Synthesis scheme of sodium 1-amino-2-arylazophthalene-4-sulphonic.

Synthesis of sodium 1-hydroxy-2-arylazophthalene-4-sulphonic (dye 2)
The synthesis of dye 2 required two steps:
25
(i) diazotization and (ii) coupling (Figure 2).
(i) Diazotization: the same diazotization with dye 1 was implemented to obtain a transparent solution A. (ii) Coupling: sodium 1-naphthol-4-sulfonate tetrahydrate (6.08 g, 0.021 mol) was dissolved in 30 mL water and solution B was obtained. Solution A was added into solution B under sufficient stirring. The pH of the coupling reaction solution was adjusted to 8 by Na2CO3 solution. After 1 h, a patch test of sodium 1-amino-8-naphthol-3,6-disulfonate confirmed that the coupling reaction had completed. Dye 2 was precipitated by adding sodium chloride (1.5 g), and isolated by filtration. The product was recrystallized and dried in a vacuum oven at 60℃. The purity of the product was above 99%, which was tested by HPLC using the aforementioned conditions. Synthesis scheme of sodium 1-hydroxy-2-arylazophthalene-4-sulphonic.
Characterization of model dyes
The structures of two model dyes synthesized were confirmed by Nuclear Magnetic Resonance (NMR) spectroscopy (400 MHz), Infrared (IR) Spectrometry and Mass Spectrometry (Varian 310). Proton nuclear magnetic resonance (1H NMR) spectra were recorded on a 400 MHz spectrometer (Bruker Biospin GmbH, Germany), operated at 20℃ using deuterated water as the solvent and tetramethylsilane (TMS) as the reference. IR spectra were obtained on a Thermo Scientific Nicolet iS 10 Fourier transform infrared (FT-IR) spectrophotometer by the KBr pellet method. ESI-MS analysis was performed in negative ion mode; the mass range was 300–350 m/z. High purity nitrogen was used as the nebulizer. The heated capillary was set to 280℃ and the capillary voltage was –50 V.
Effects of light sources on the photofading of model dyes
All light irradiation experiments of dye solutions were conducted in a photoreactor, as described,
26
with circulation water of 25 ± 2℃. A total of 200 mL 100 mg/L model dye solution (pH = 6.5) was placed into a 250 mL cylindrical reaction vessel, and all photoreactions were carried out in air-saturated conditions under 500 W xenon light and 100 and 500 W mercury lamps, respectively. About 5 mL of solutions were collected at intervals of 60 min and corresponding UV-Vis absorptions ranging from 200 to 800 nm were measured using a UV-3300 Spectrophotometer (Hitachi, Japan), and the maximum absorbance in the visible region was obtained. Based on the Lambert–Beer Law, the decoloration percentage was calculated according to following equation:

Characterization of intermediates
HPLC-MS analysis
A total of 200 mL 100 mg/L dye solution was placed into a 250 mL cylindrical reaction vessel, and all photoreactions were carried out under UV light in air-saturated conditions. After 2 h, about 50 mL of solutions were collected and concentrated to ca. 2 mL through evaporation under vacuum at low temperature. The formed intermediates were separated by HPLC under gradient conditions using an Eclipse XDB-C18 column and a mobile phase composed of 20 mM ammonium acetate/ acetonitrile (95/5 (v/v) to 50/50 (v/v) in 35 min, then to 0/100 (v/v) in 2 min) at pH 6.8, 35℃ with a flow rate of 0.3 mL/min. The eluent from the chromatographic column entered the ESI interface and the MS spectrometer. MS analyses were performed in the positive and/or negative ion mode with the mass range of 200–400 m/z. High purity nitrogen was used as the nebulizer. The heated capillary was set to 280℃ and the capillary voltage to ± 20 and ± 50 V.
GC-MS analysis
A total of 200 mL 100 mg/L dye solution was placed into a 250 mL cylindrical reaction vessel, and all photoreactions were carried out under UV light in air-saturated conditions. After 6 h, about 100 mL of solutions were collected, and concentrated to ca. 2 mL and then freeze dried. The residue was dissolved in 200 µL anhydrous pyridine, followed by the addition of 100 µL hexamethyl disilazane and 50 µL chlorotrimethylsilane. 27 The silylated sample was further analyzed by GC-MS. Separation was performed on a DB-5 MS capillary column (30 mm × 320 µm × 0.5 µm). Electron Impact (EI) mass spectra were monitored from 30 to 400 m/z.
IC analysis
The formed inorganic ions were determined using an IC1010. The elution was a solution containing 3 mmol/L NaHCO3 and 2.5 mmol/L Na2CO3, and elution was performed in anion mode at 35℃ with a flow rate of 1.5 mL/min. The reference ion was made by the solution of NaCl, Na2SO4, NaNO3, C2O4Na2 and CH3COONa.
Results and discussion
Synthesis and characterization of model dyes
For hydroxyazo dyes, two structurally distinct compounds exist in a rapid equilibrium, called azo-hydrazone tautomerism. The photofading mechanisms of azo dyes in both azo and hydrazone forms still remain unclear. Besides, impurities contained in commercial dyes might also play a complicated role in dye fading. Thus, it is meaningful to synthesize model dye of high purity to clearly deduce its photofading mechanism. The hydrazone form does not exist in dye 1 due to amino substituent on the ortho-position of the diazo component, while both azo and hydrazone forms exist in dye 2. Besides, the compounds exist mainly in hydrazone form in nearly neutral (pH 5.5–8.0) and weak acid (pH 4.8–5.2) solutions. 28
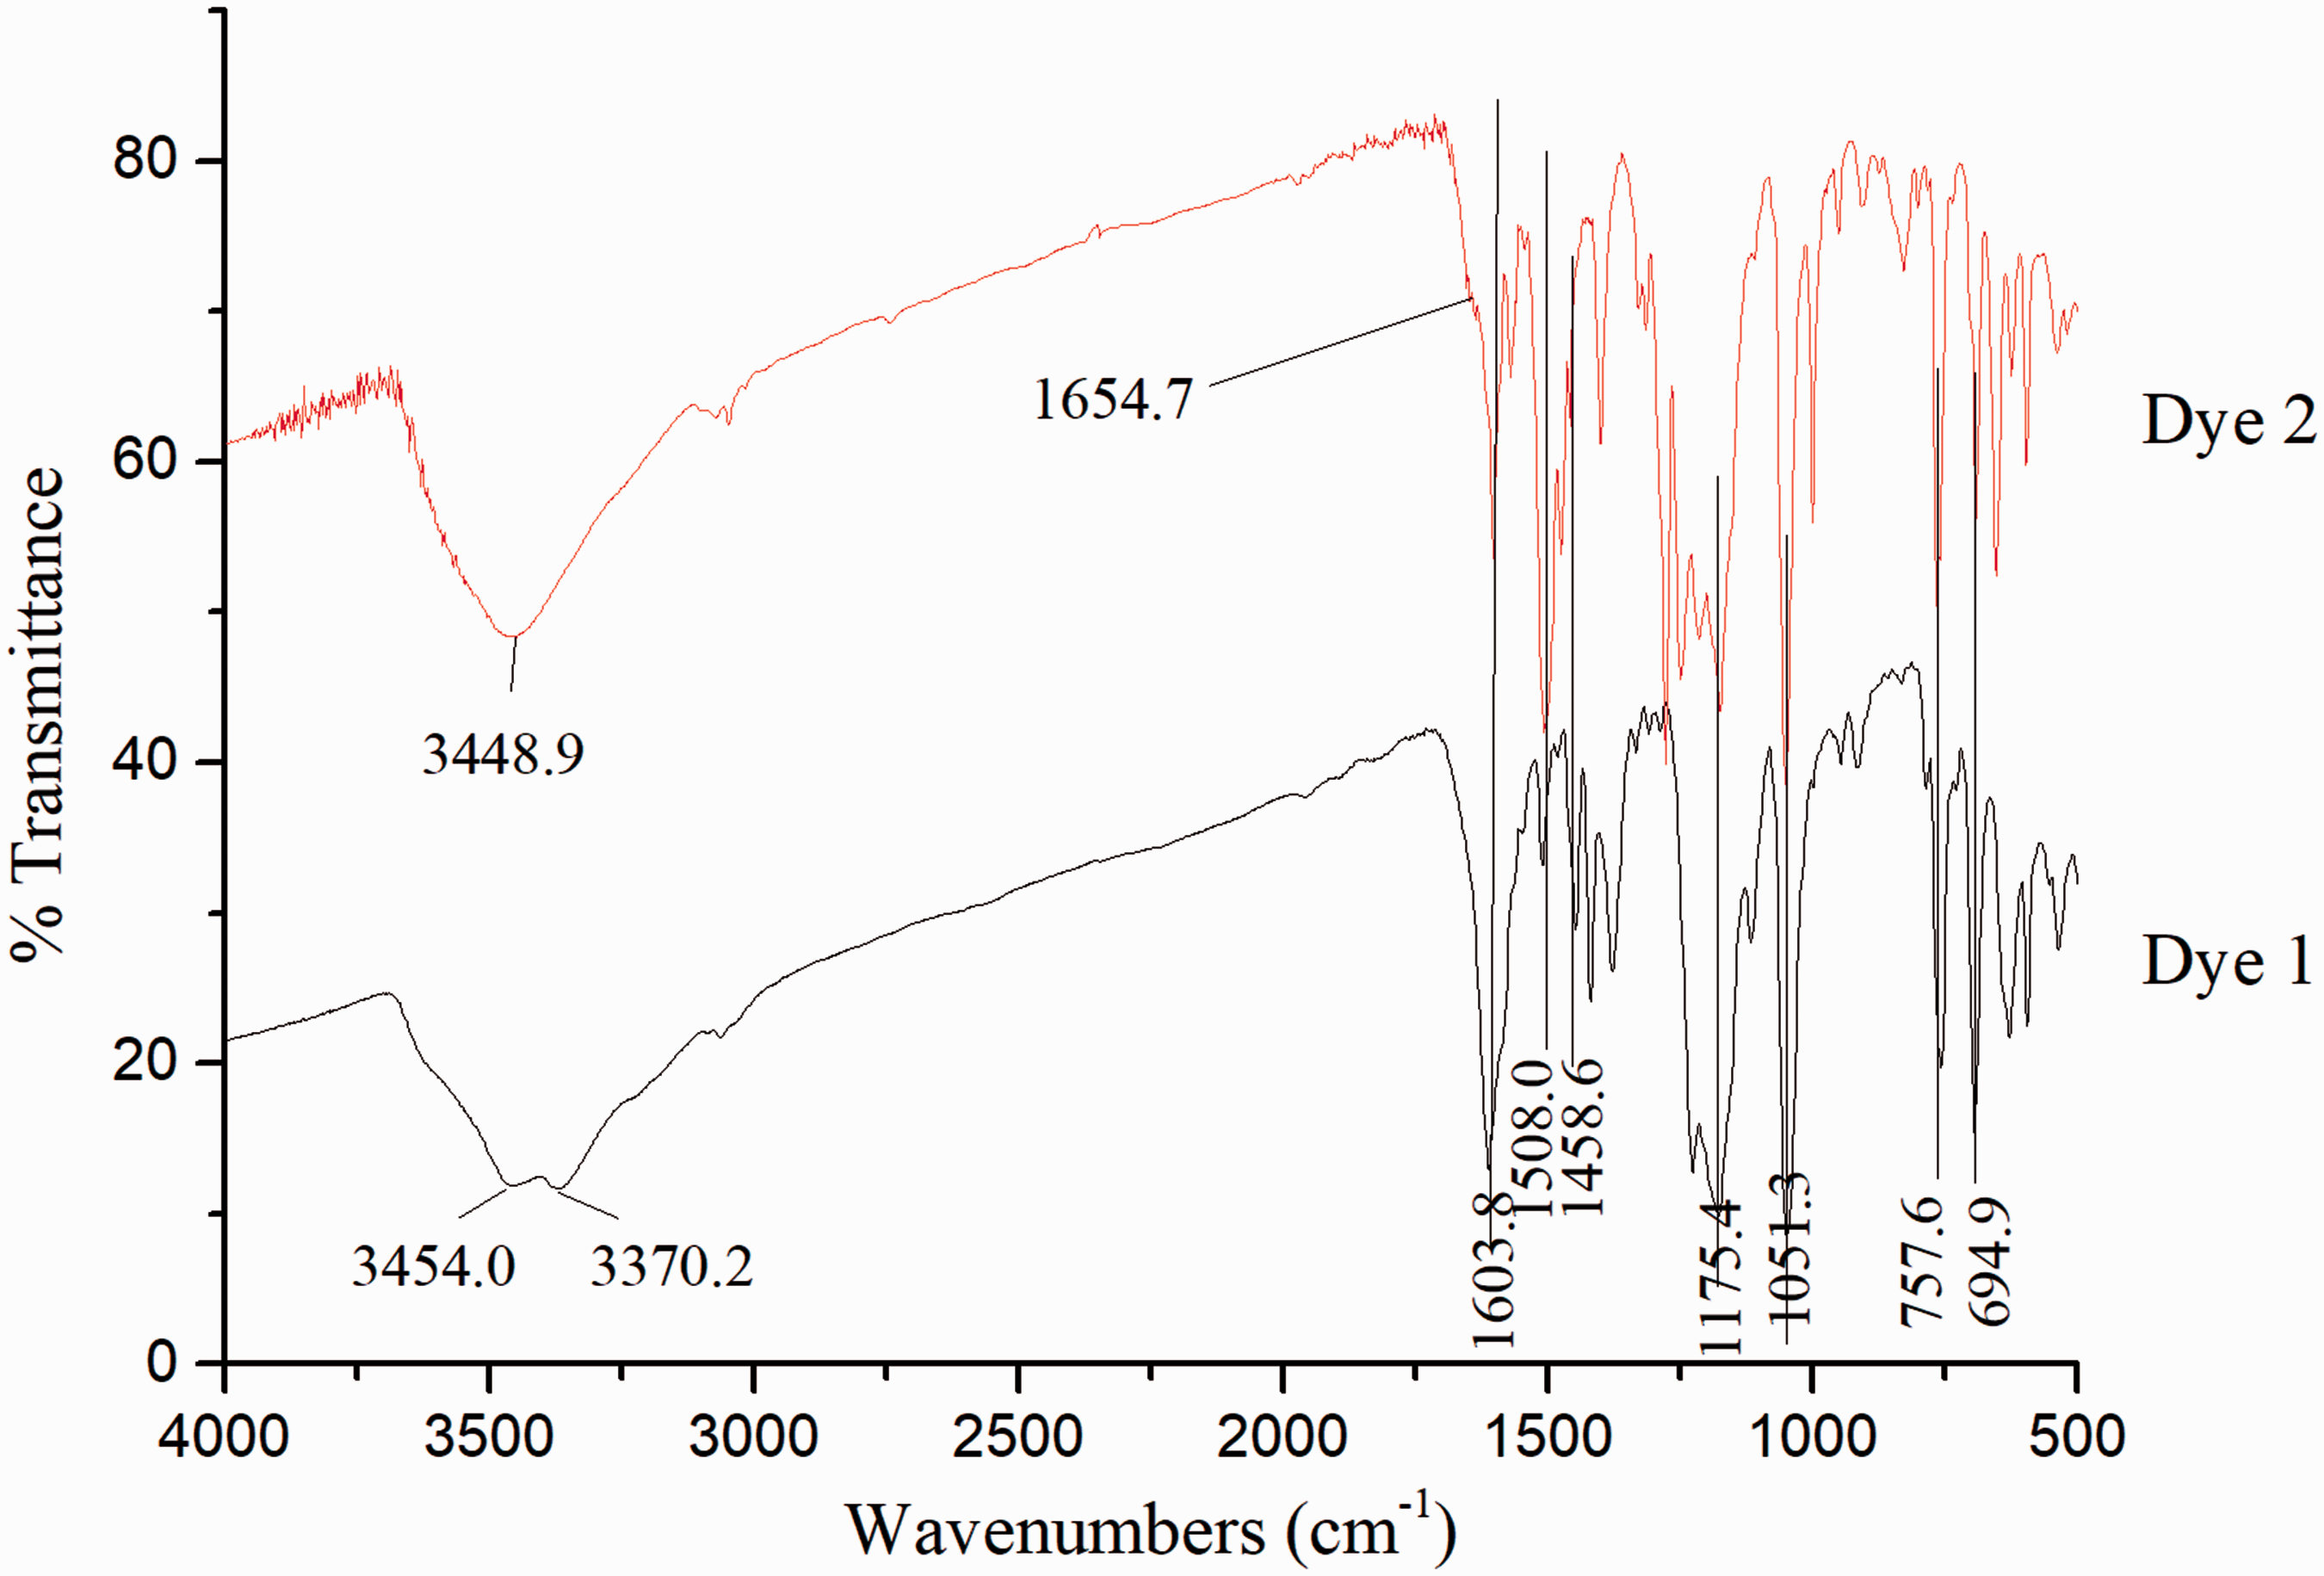
The 1H NMR spectra of synthesized model dyes are shown in Figure 3 with the singlets due to corresponding hydrogens marked. Unfortunately, the active hydrogens in the amino substituent (dye 1) and hydrazo position (dye 2) are undetected when D2O is used as the solvent. In order to further confirm their structures, IR and ESI-MS spectra are detected, with results shown in Figure 4 and Table 1, respectively. IR spectra demonstrate some characteristic peaks as straightforward identifications. Specifically, the broad band near 3448.9 cm−1 is attributed to OH vibration, and the double peaks at 3454.0 and 3370.2 cm−1 due to NH2 vibration. Features at 1603.8, 1508.0 and 1051.3 cm−1 derive from skeletal vibrations and curving vibration of benzene and naphthalene, while those at 757.6 and 694.9 cm−1 were produced by mono-substituted benzene curving vibration. The peak near 1175.4 cm−1 is supposed due to the stretch of the sulfonic group. Besides, the waist peak observed at 1654.7 cm−1 indicates the C=O stretching vibration in dye 2, and the small peak observed at 1458.6 cm−1 reflects the N=N stretching vibration in both dyes. As shown in Table 1, the molecular ion peak at 326 m/z is attributed to [M1-Na]– (the molecular mass of dye 1 (M1) is 349, and that of Na is 23). That at 327 m/z corresponds to [M2-Na]– (the molecular mass of dye 2 (M2) is 350). The chemical structures of the two model dyes are thus confirmed by 1H NMR, IR and ESI-MS spectra.
Proton nuclear magnetic resonance spectra of synthesized model dyes in D2O and the assignment of peaks: (a) dye 1; (b) dye 2. Infrared spectra of synthesized model dyes. Molecular ion peak obtained from electrospray ionization mass spectrometry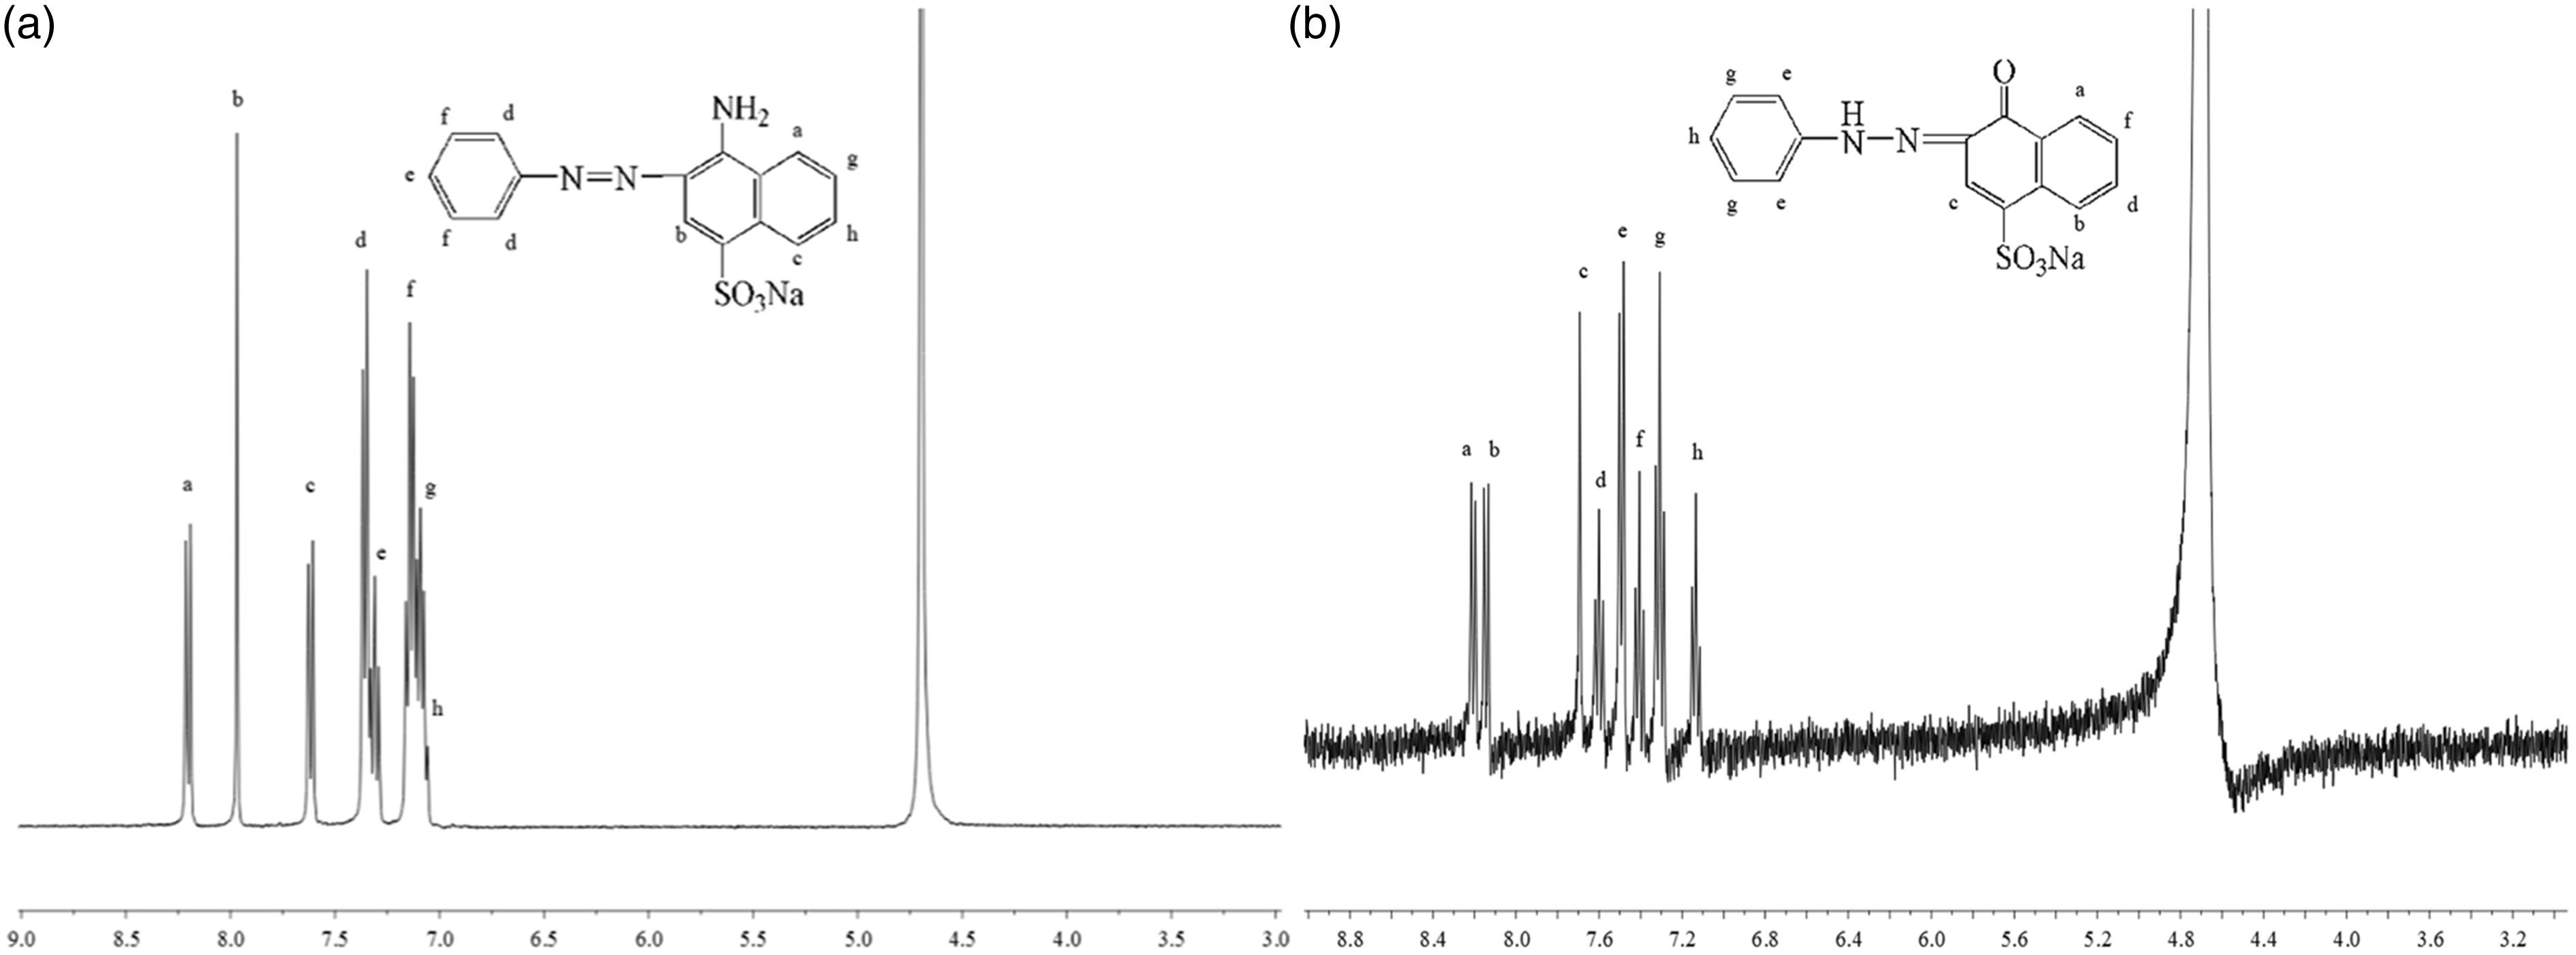

Effects of light sources on dye photofading
The photodecoloration of the two model dyes under different light sources is measured and is shown in Figure 5. It is found that dye photofading varies considerably with light sources. Under xenon light, no decoloration could be detected. However, both model dyes fade dramatically under the mercury lamp and the decoloration rate increases with increased light power, since the mercury lamp and the xenon lamp are mainly used to simulate UV light and sunlight, respectively. Photofading of both model dyes in solution is due to UV light rather than visible light. Furthermore, the decoloration rate is proportional to exposure time under the mercury lamp, indicating that the dye fading mechanism remains identical under different mercury lamp powers. This is because mercury lamps with different powers have similar emission spectra, and thus serve the same role during the dye decoration. Hence, a 500 W mercury lamp is used as the light source to study dye photodegradation in the following parts.
Effects of light sources on the photofading of the two model azo dyes: (a) dye 1; (b) dye 2.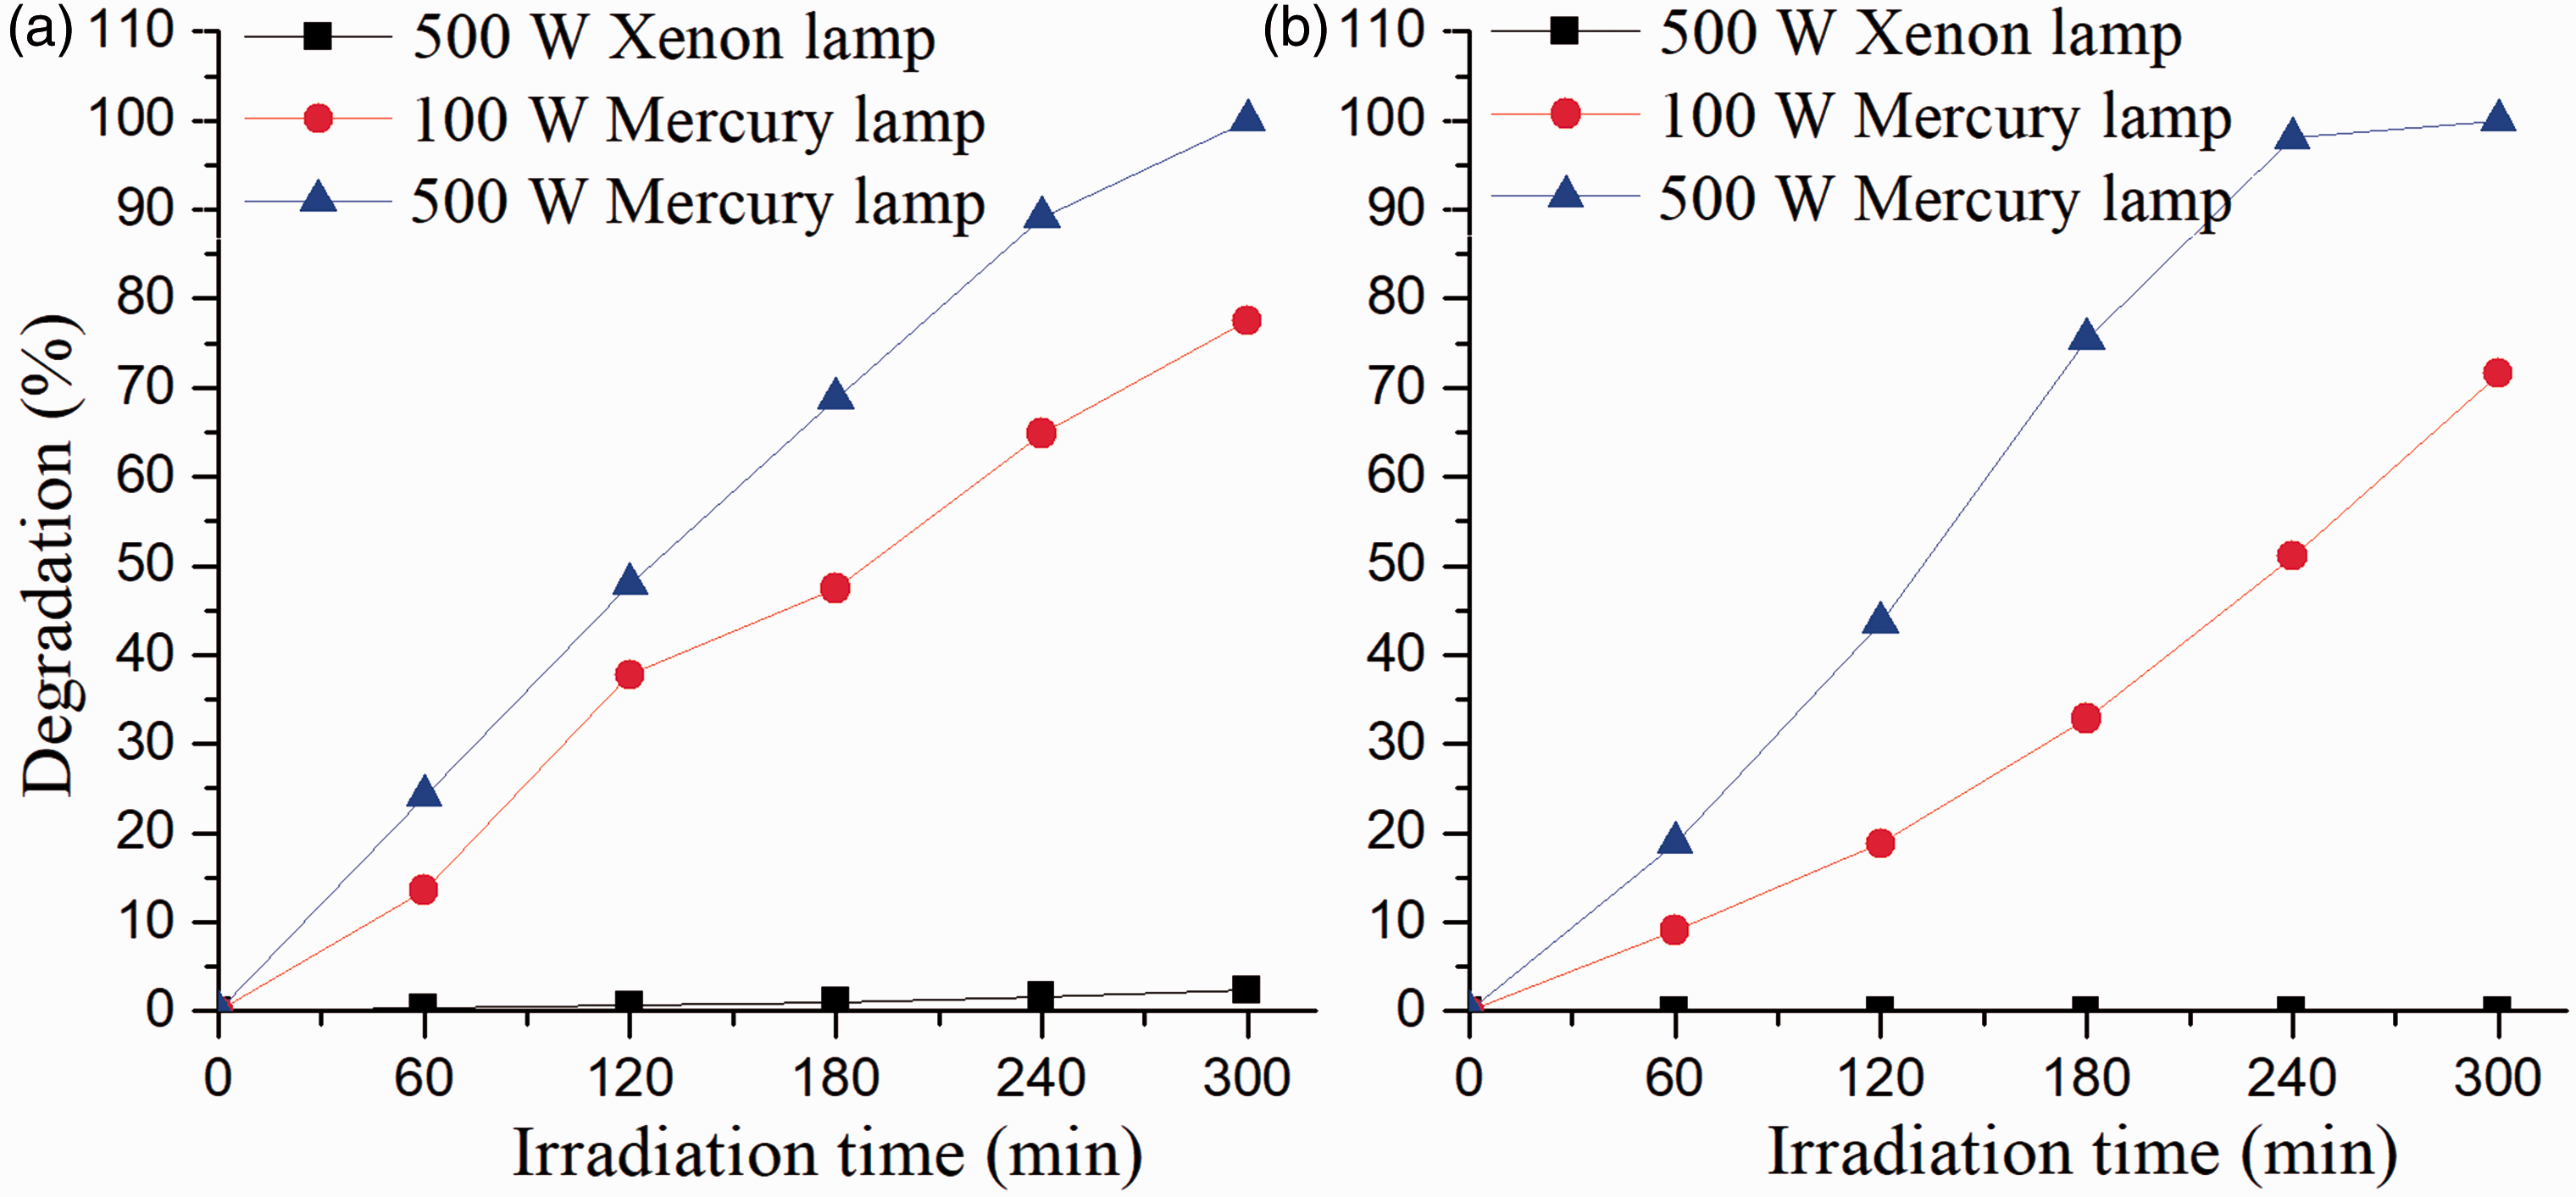
Characterization of intermediates formed during the initial fading process
Intermediates of dye 1
Many anionic fragments, as well as their retention and m/z values, are detected through HPLC and MS techniques and are given in Figure 6. All fragments are hydroxylated derivatives of dye 1, and their chemical structures are detected and are shown in Table 2. As proposed by Datyner et al.,
29
in the aqueous environment, photofading of azo dyes is induced by hydroxyl radicals. The hydroxyl radical, as a kind of electrophile, has been detected in dye solution, and would attack the dye molecules selectively. As shown in Figure 6, m/z values of 338, 354 and 376 correspond to different hydroxyl adducts with certain structures (Table 2), while m/z values of 342 and 360 relate to hydroxyl adducts with their isomers. The retention times of 342 m/z are 16.25 and 20.39 min, meaning that the hydroxyl radical attacks different positions of dye 1. The 360 m/z with three retention times (9.87, 11.94 and 28.34 min) indicates three different structures of hydroxyl adducts. The hydroxyl free radical is not inclined to react with the naphthalene ring with the electron withdrawing sulfonic group. The retention time of m/z 342 fragments is 20.39 min, and higher than that of dye molecules (16.07), indicating a hydroxyl radical attack in the naphthalene ring.
19
The stabilizing effect of hydroxyl would make this molecule less hydrophilic, and thus facilitate its interaction with the stationary phase. Moreover, the retention times of m/z 338, m/z 354 and m/z 376 are 12.91, 12.21 and 13.31 min, respectively, suggesting that the hydroxyl radical attacks in the azo moiety. The conjugated system is destroyed by hydroxylation, and the polarity of hydroxylated derivatives is enhanced. Thus, the interaction between these hydroxylated derivatives and the stationary phase is weakened. The molecule of m/z 360 has three retention times (9.87, 11.94 and 28.34 min), corresponding to distinct isomers, but there is not enough information for the assessment of hydroxyl radical attack positions. As shown in Figure 6, hydroxyl radicals tend to attack the azo moiety with relatively high electron density. Besides, other hydroxylated derivatives may also be generated, for hydroxyl radicals with high reactivity would also react with benzene and naphthalene rings. Unfortunately, only a molecular ion peak can be obtained by ESI-MS without other details about specific reaction sites found. All hydroxylated derivatives encounter further decomposition and their micromolecular fragments are characterized by GC-MS. In addition, there are no fragments detected under the positive ion mode within the mass range of 200–400 m/z.
High-performance liquid chromatography/mass spectrometry patterns of dye 1 at degradation time of 2 h displayed at different m/z values. Intermediates of dye 1 detected after 2 h irradiation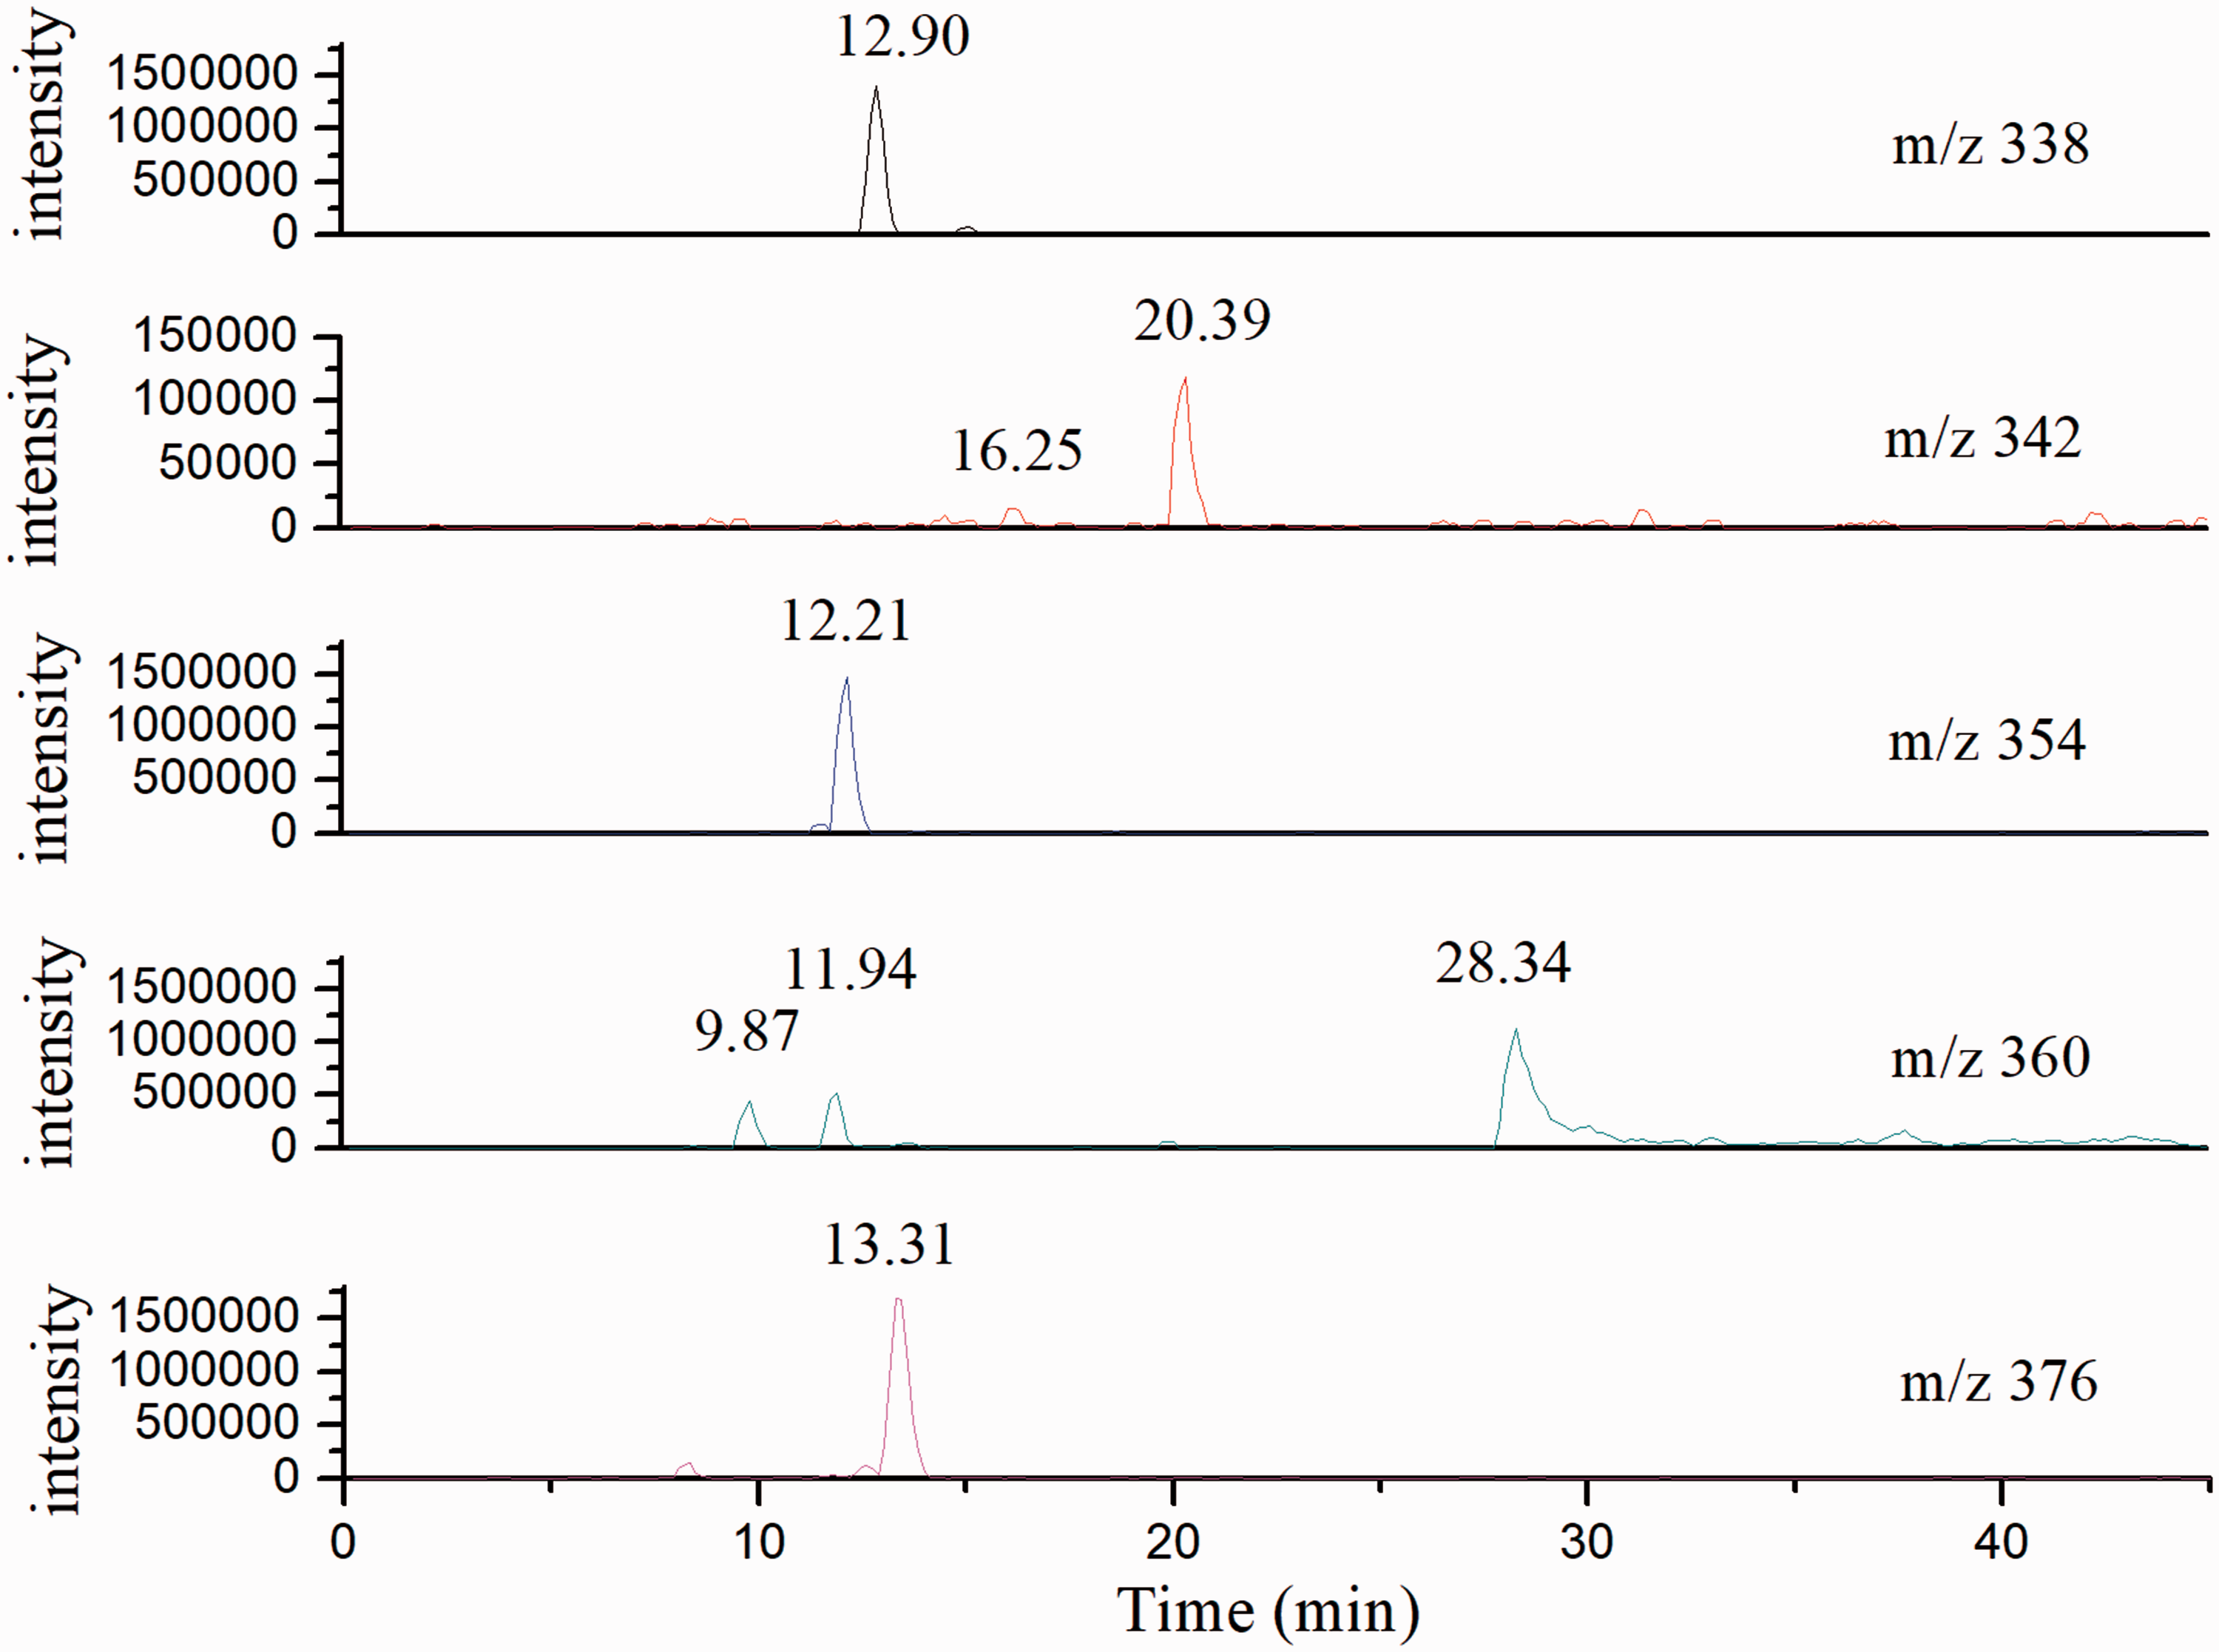

Intermediates of dye 2
Degradation fragments detected by HPLC and MS techniques are shown in Figure 7. Compared with degradation fragments of dye 1, more hydroxylated derivatives are captured and their chemical structures are proposed in Table 3. It can be found that three isomers (m/z 343) are generated due to the reaction between hydroxyl free radicals and dye 2. Their retention times are 14.75, 15.72 and 23.86 min, respectively. These isomers could further react with hydroxyl free radicals through different reaction paths. In one path, the retention times of m/z 359, m/z 375 and m/z 311 are 22.06, 15.44 and 21.53 min, respectively. This is because the interaction between hydroxylated derivatives and the stationary phase is enhanced when an ion pair exists. In the other two paths, the retention times of m/z 347, m/z 363, m/z 361 and m/z 377are all shorter than that of dye 2 molecules. These fragments are considered to be produced by hydroxyl radical attacks on the conjugated system.
High-performance liquid chromatography/mass spectrometry patterns of dye 2 at degradation time of 2 h displayed at different m/z values. Intermediates of dye 2 detected after 2 h irradiation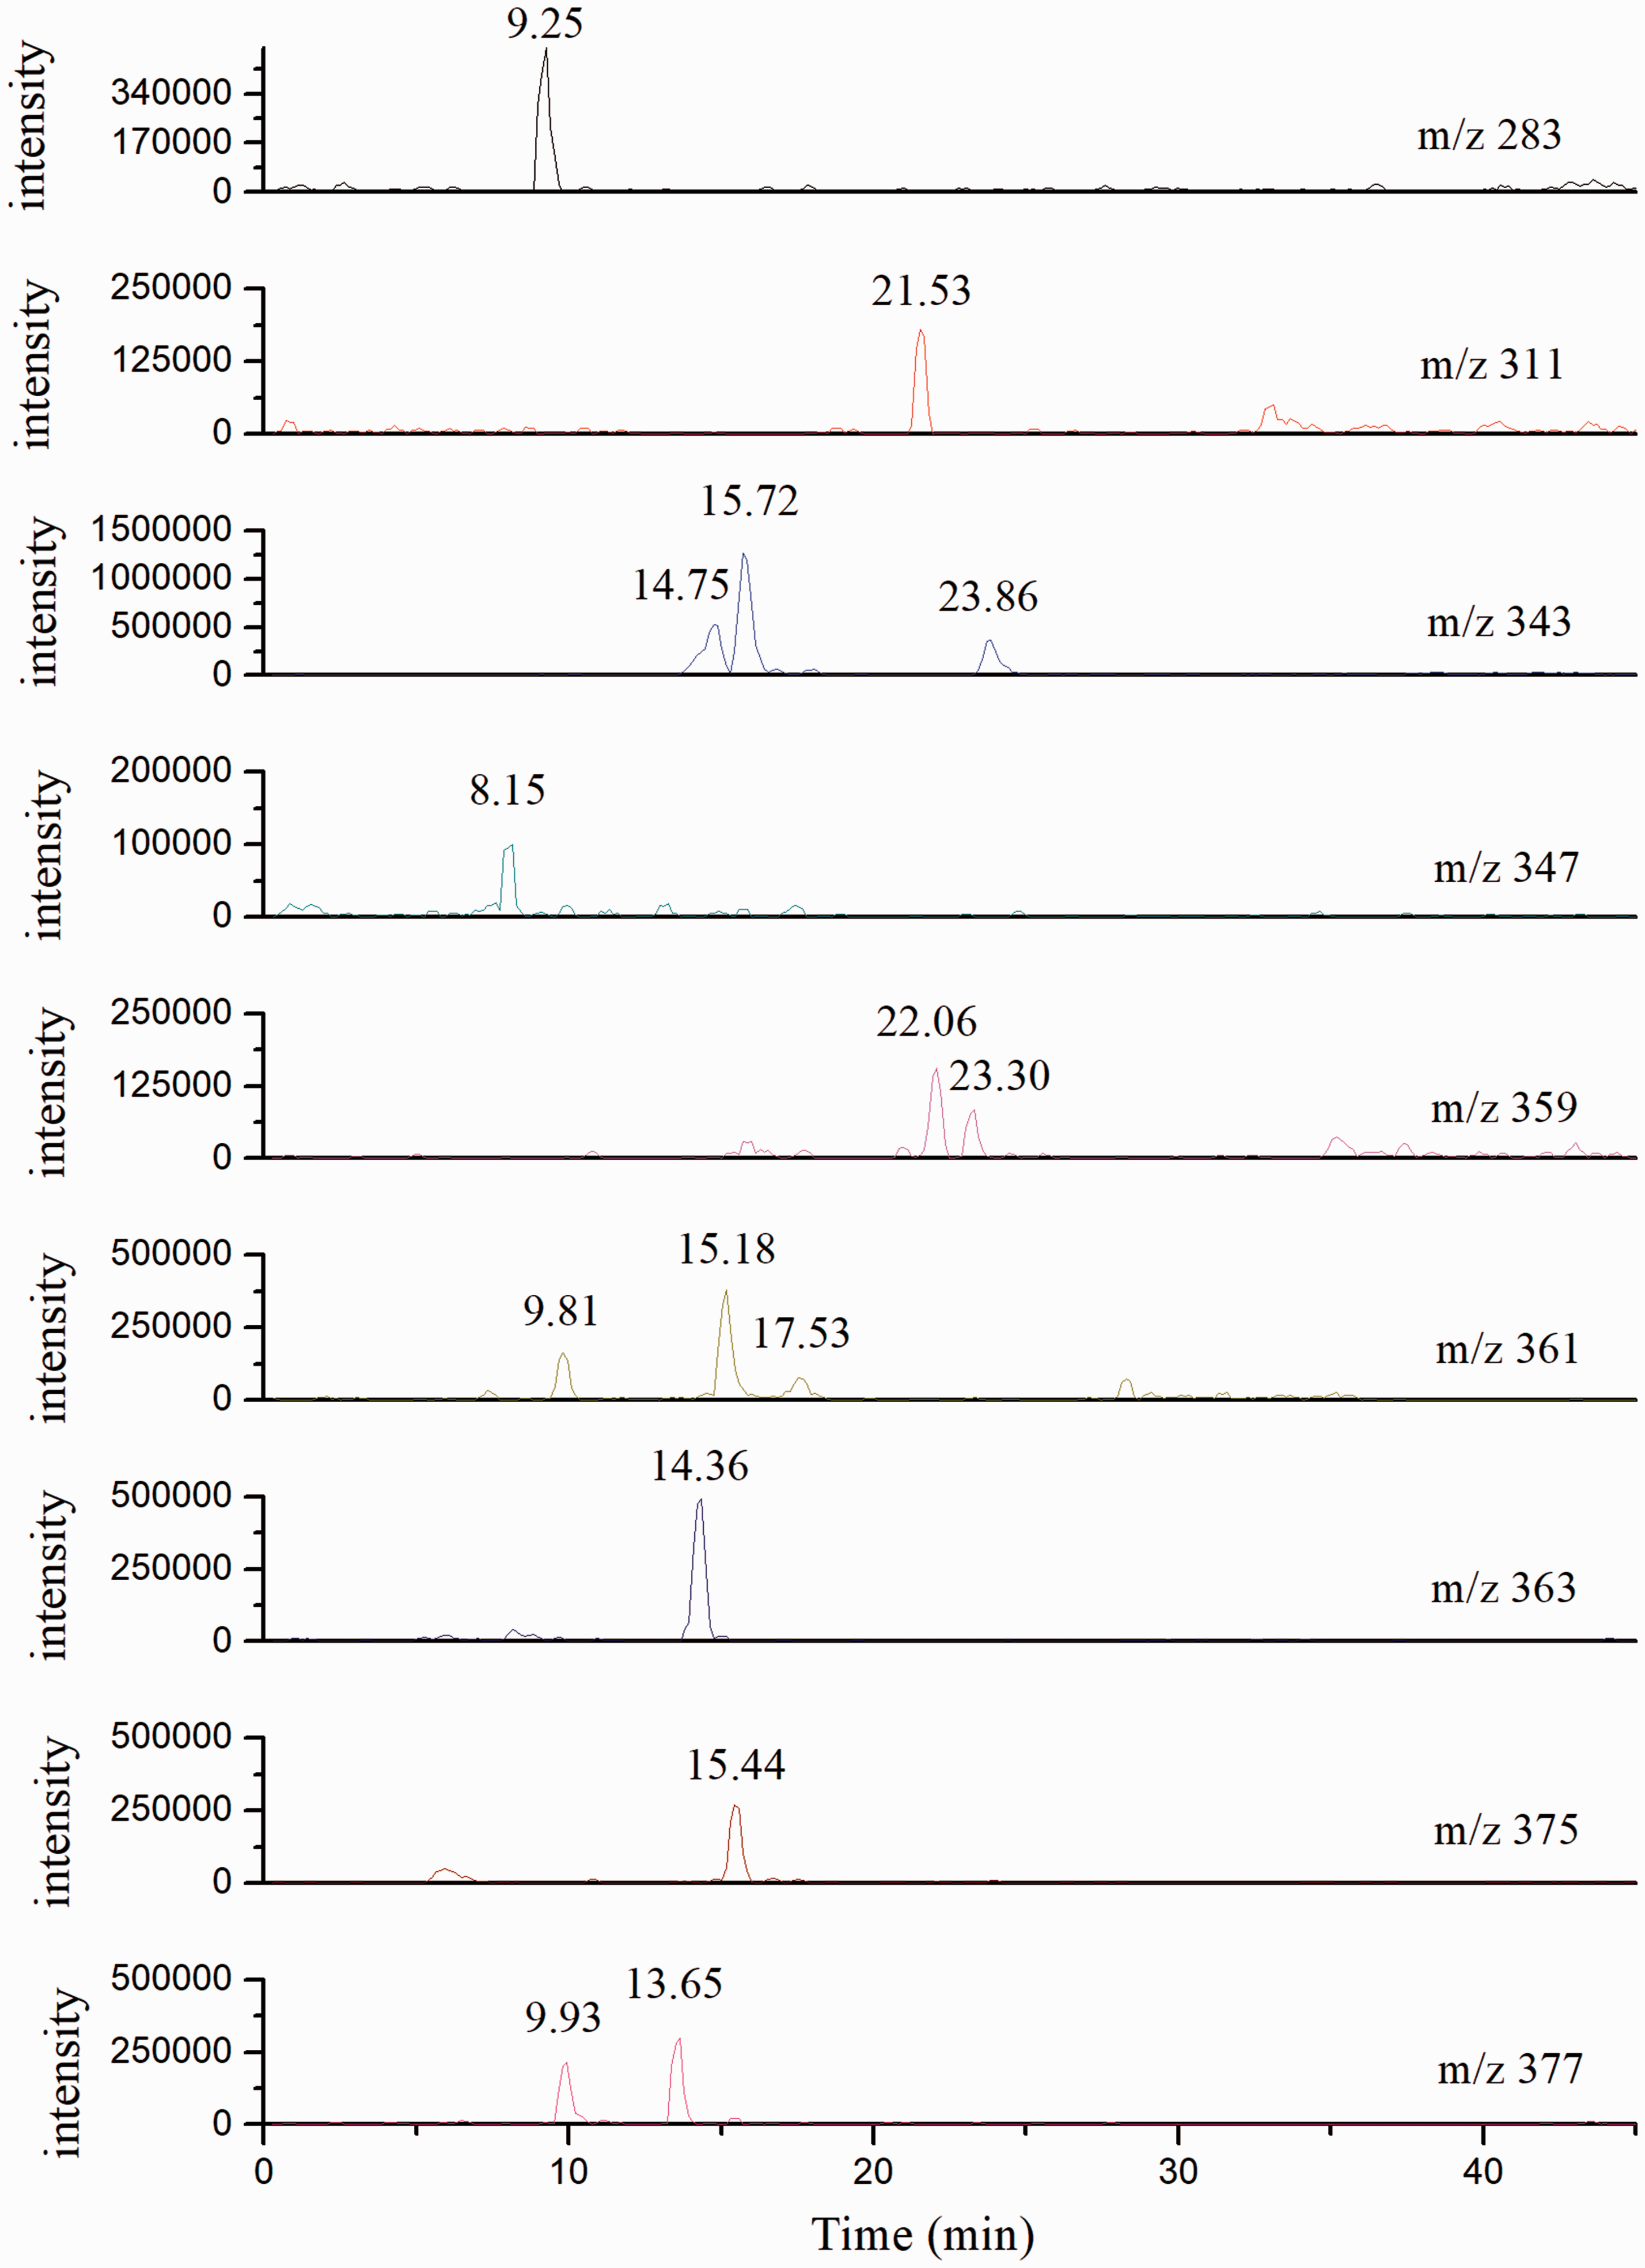

Characterization of intermediates formed during the final fading process
The degradation fragments of dyes 1 and 2 after 6 h UV irradiation are detected using GC-MS and IC. The GC chromatograms and identified intermediates performed by utilizing electron ionization source are shown in Figure 8 and Table 4. The main intermediates were low-molecular-weight dicarboxylic acids and their hydroxylated and esterified derivatives. No amino materials were detected because they can easily evaporate during the sample preparation process. The results suggest that both dyes go through the breaks of azo moiety and the cleavage of benzene and naphthalene rings. From Figure 8, it also can be seen that maleic acid and fumaric acid can only be detected in photodegradation products of dye 2 rather than dye 1, demonstrating that the photofading of dye 2 undergoes a much more complicated process.
Gas chromatograms of the samples obtained from light-induced degradation of dyes 1 and 2 after 6 h irradiation. Retention times and the identified products corresponding to Figure 8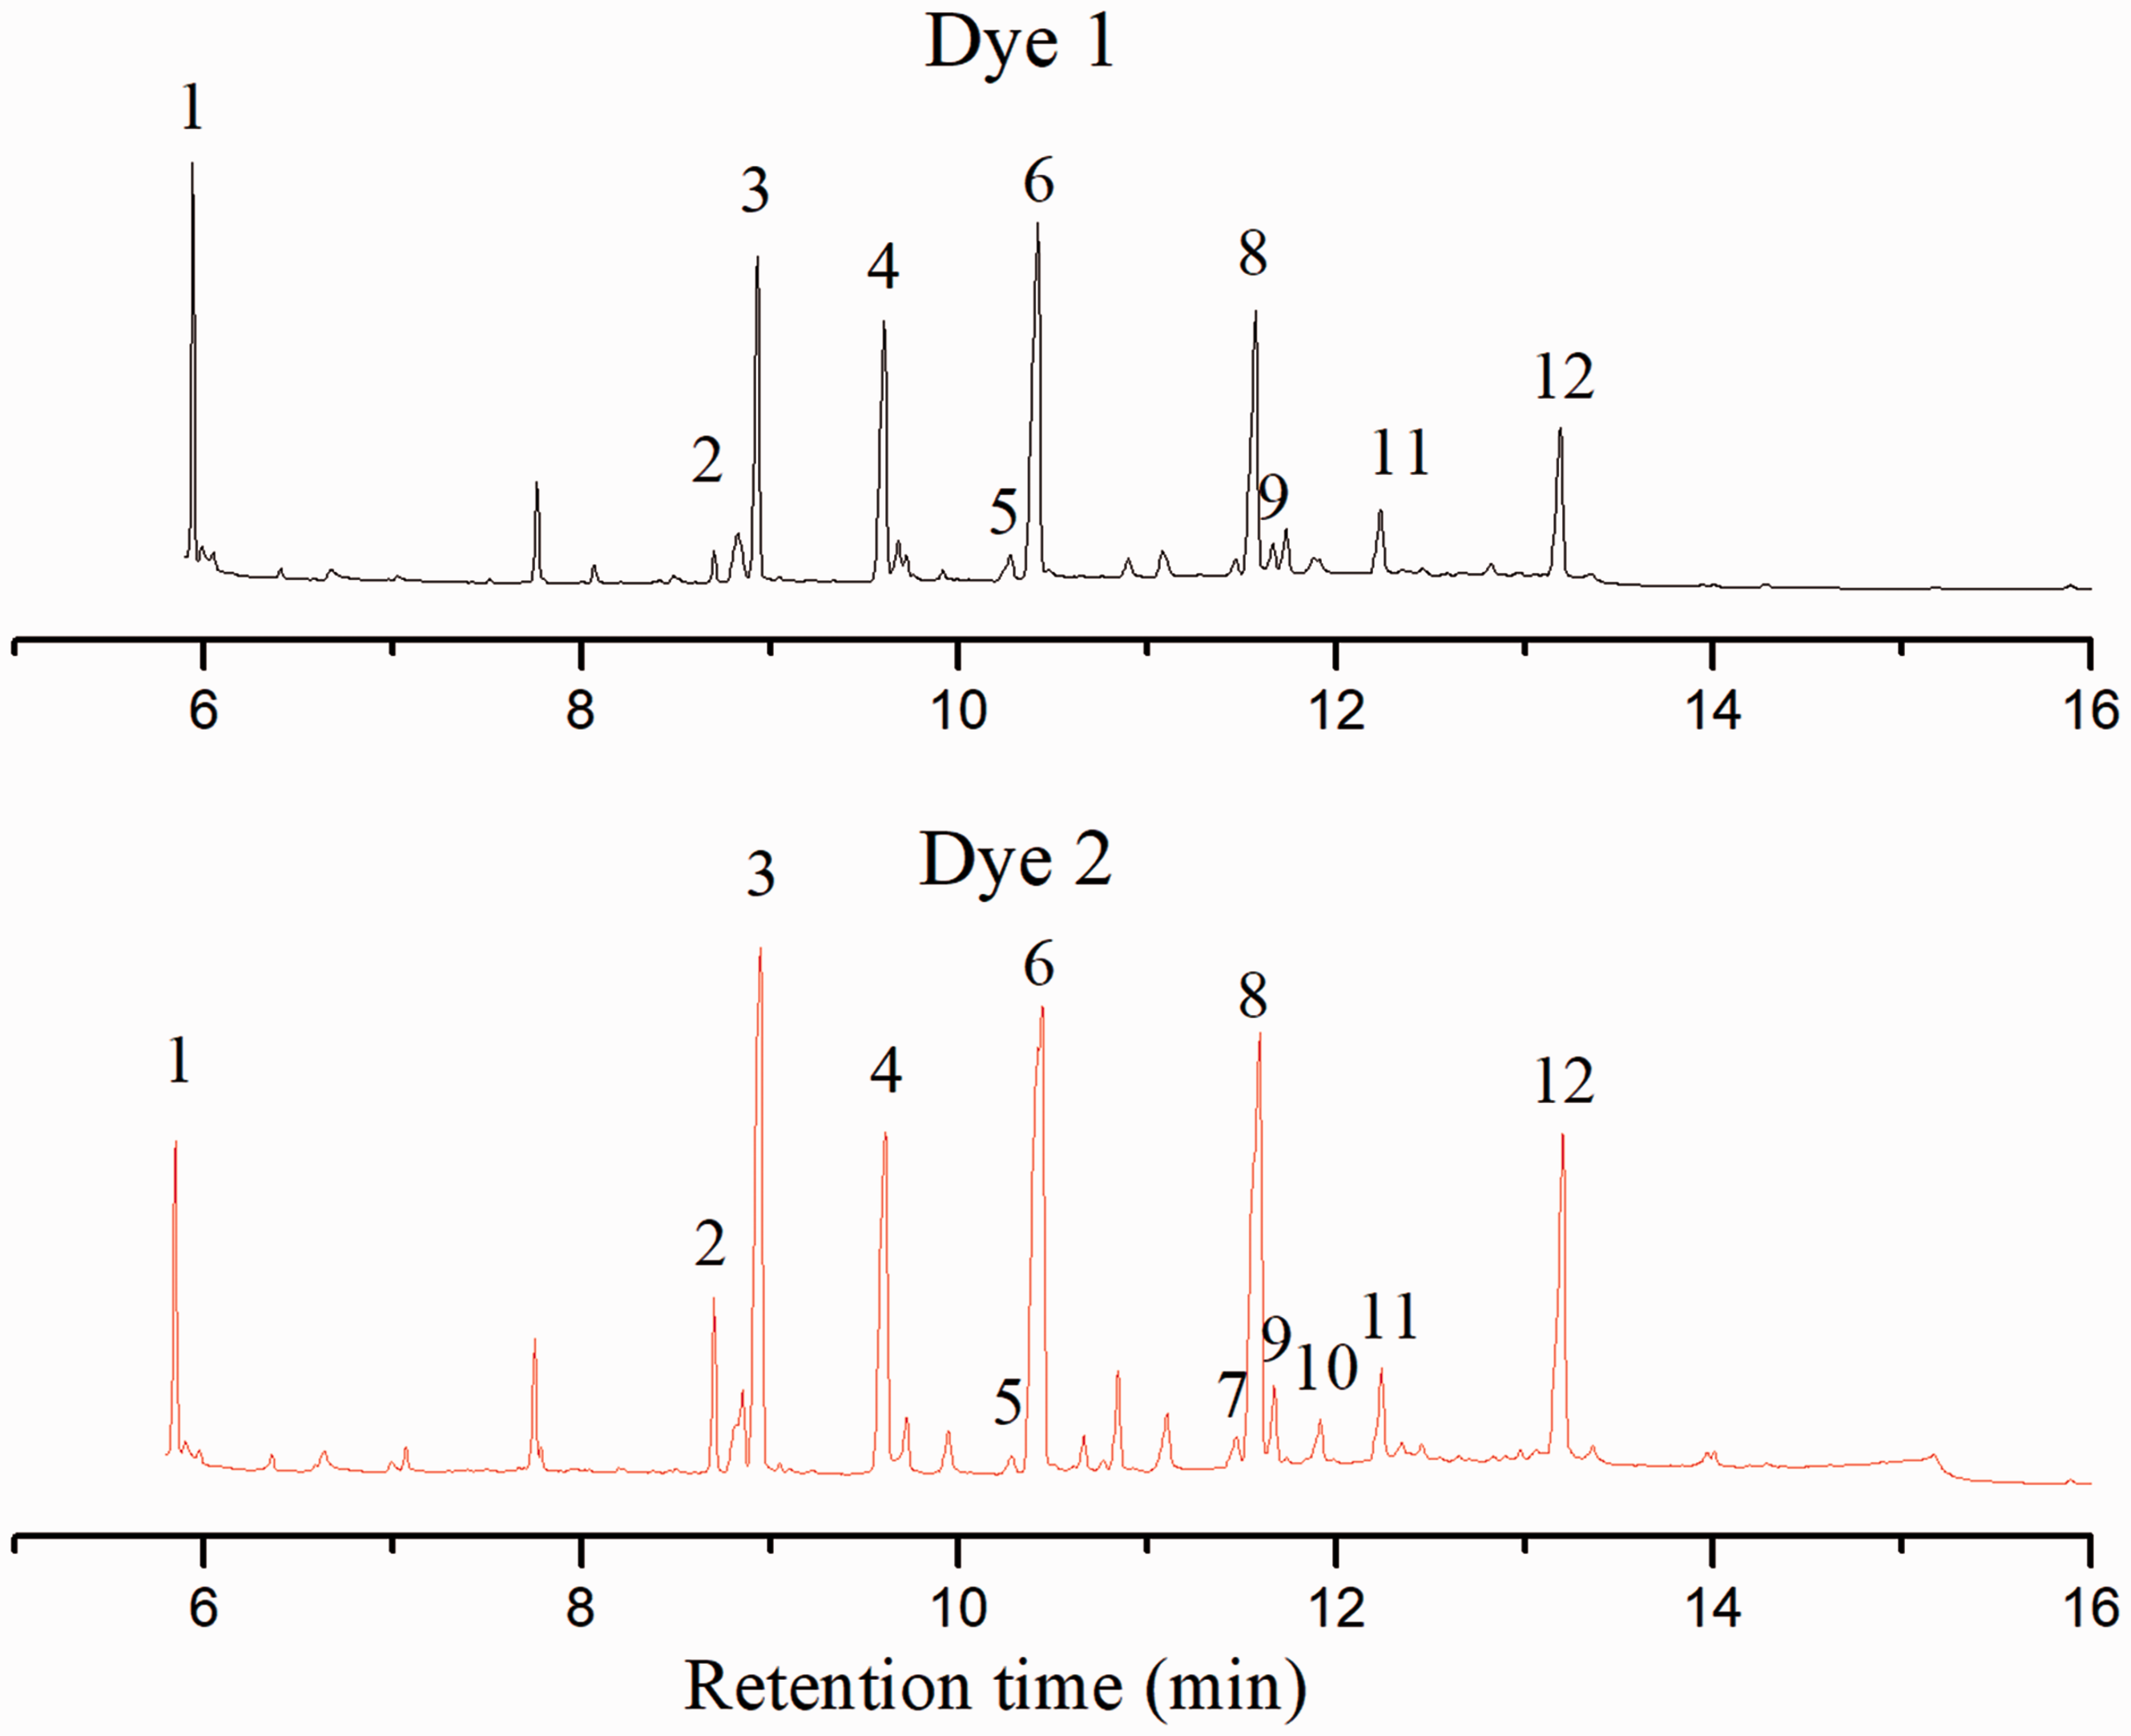

During the photodegradation process of azo dyes, both volatile organic molecules and non-volatile inorganic ions could be produced. Those less volatile ions can be detected by using IC.
As indicated in Figure 9, the acetate ion (CH3COO–), chloride ion (Cl–), nitrate ion (NO3–), sulfate ion (SO4–) and oxalate ion ( Ion chromatograms of the samples obtained from light-induced degradation of dyes 1 and 2 after 6 h irradiation.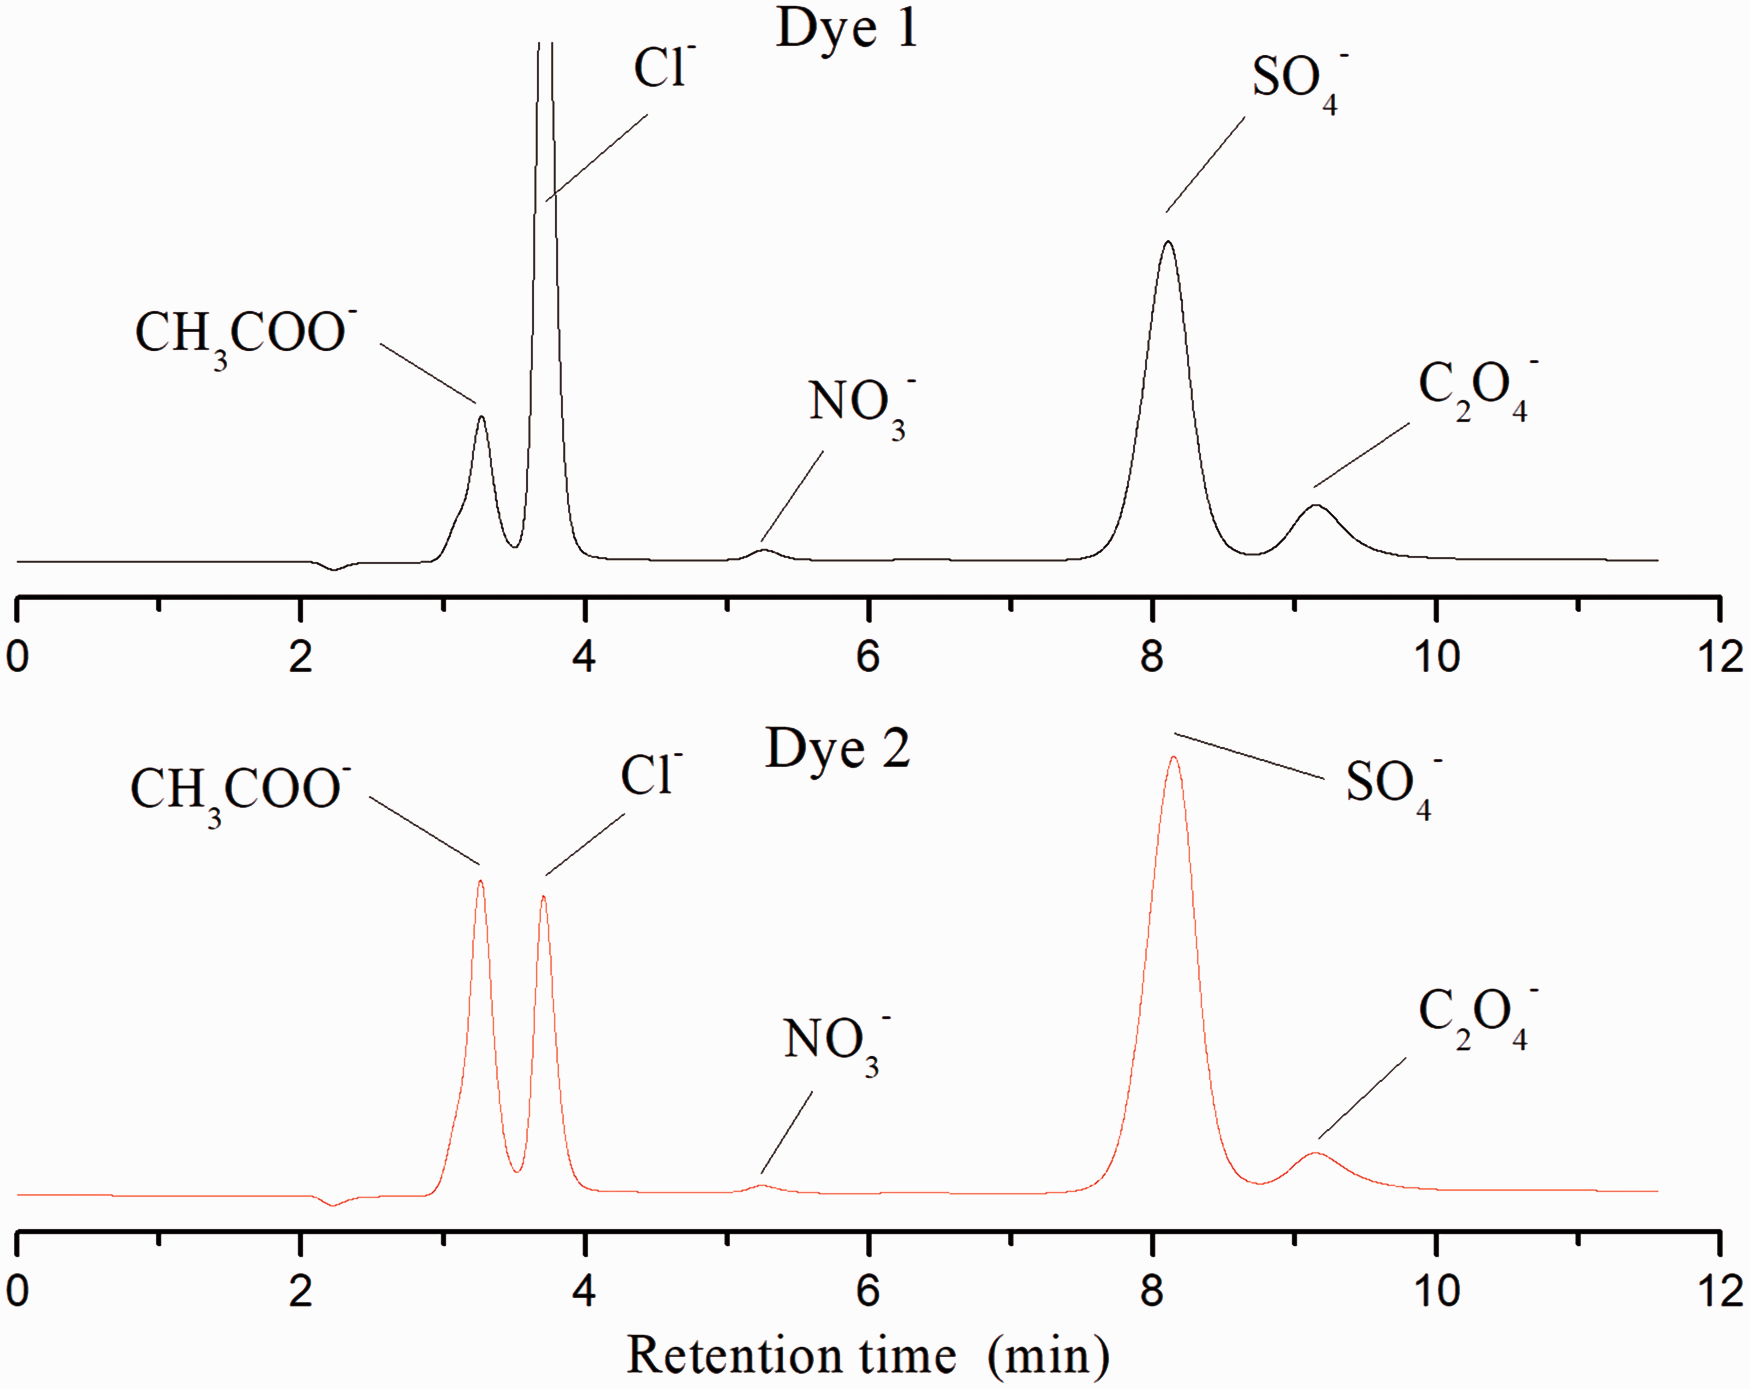
Proposed mechanisms
According to the above results, several intermediates are detected and characterized, and their formation processes are demonstrated in Figure 10. In the designed experiments, all photochemical reactions were conducted at pH 6.5 under room temperature. Thus, dye 1 is supposed to be the model azo dye, and dye 2, which exists mainly in hydrazone form, is considered as the model hydrazone dye. However, no dramatic differences are observed when the model dyes are irradiated under UV light. As Figure 10 demonstrates, the degradation intermediates are all hydroxylated derivatives, indicating that the photofading of both azo and hydrazone dyes is induced by hydroxyl free radicals. The degradation fragments formed during the final fading process are almost dicarboxylic acids and their hydroxylated and esterified derivatives. Hence, hydroxyl radical induced reactions are supposed to be the main mechanisms for photofading of azo dyes under UV irradiation.
Proposed scheme of light-induced degradation of dyes 1 and 2 based on products identified by high-performance liquid chromatography/mass spectrometry, gas chromatography/mass spectrometry and ion chromatography.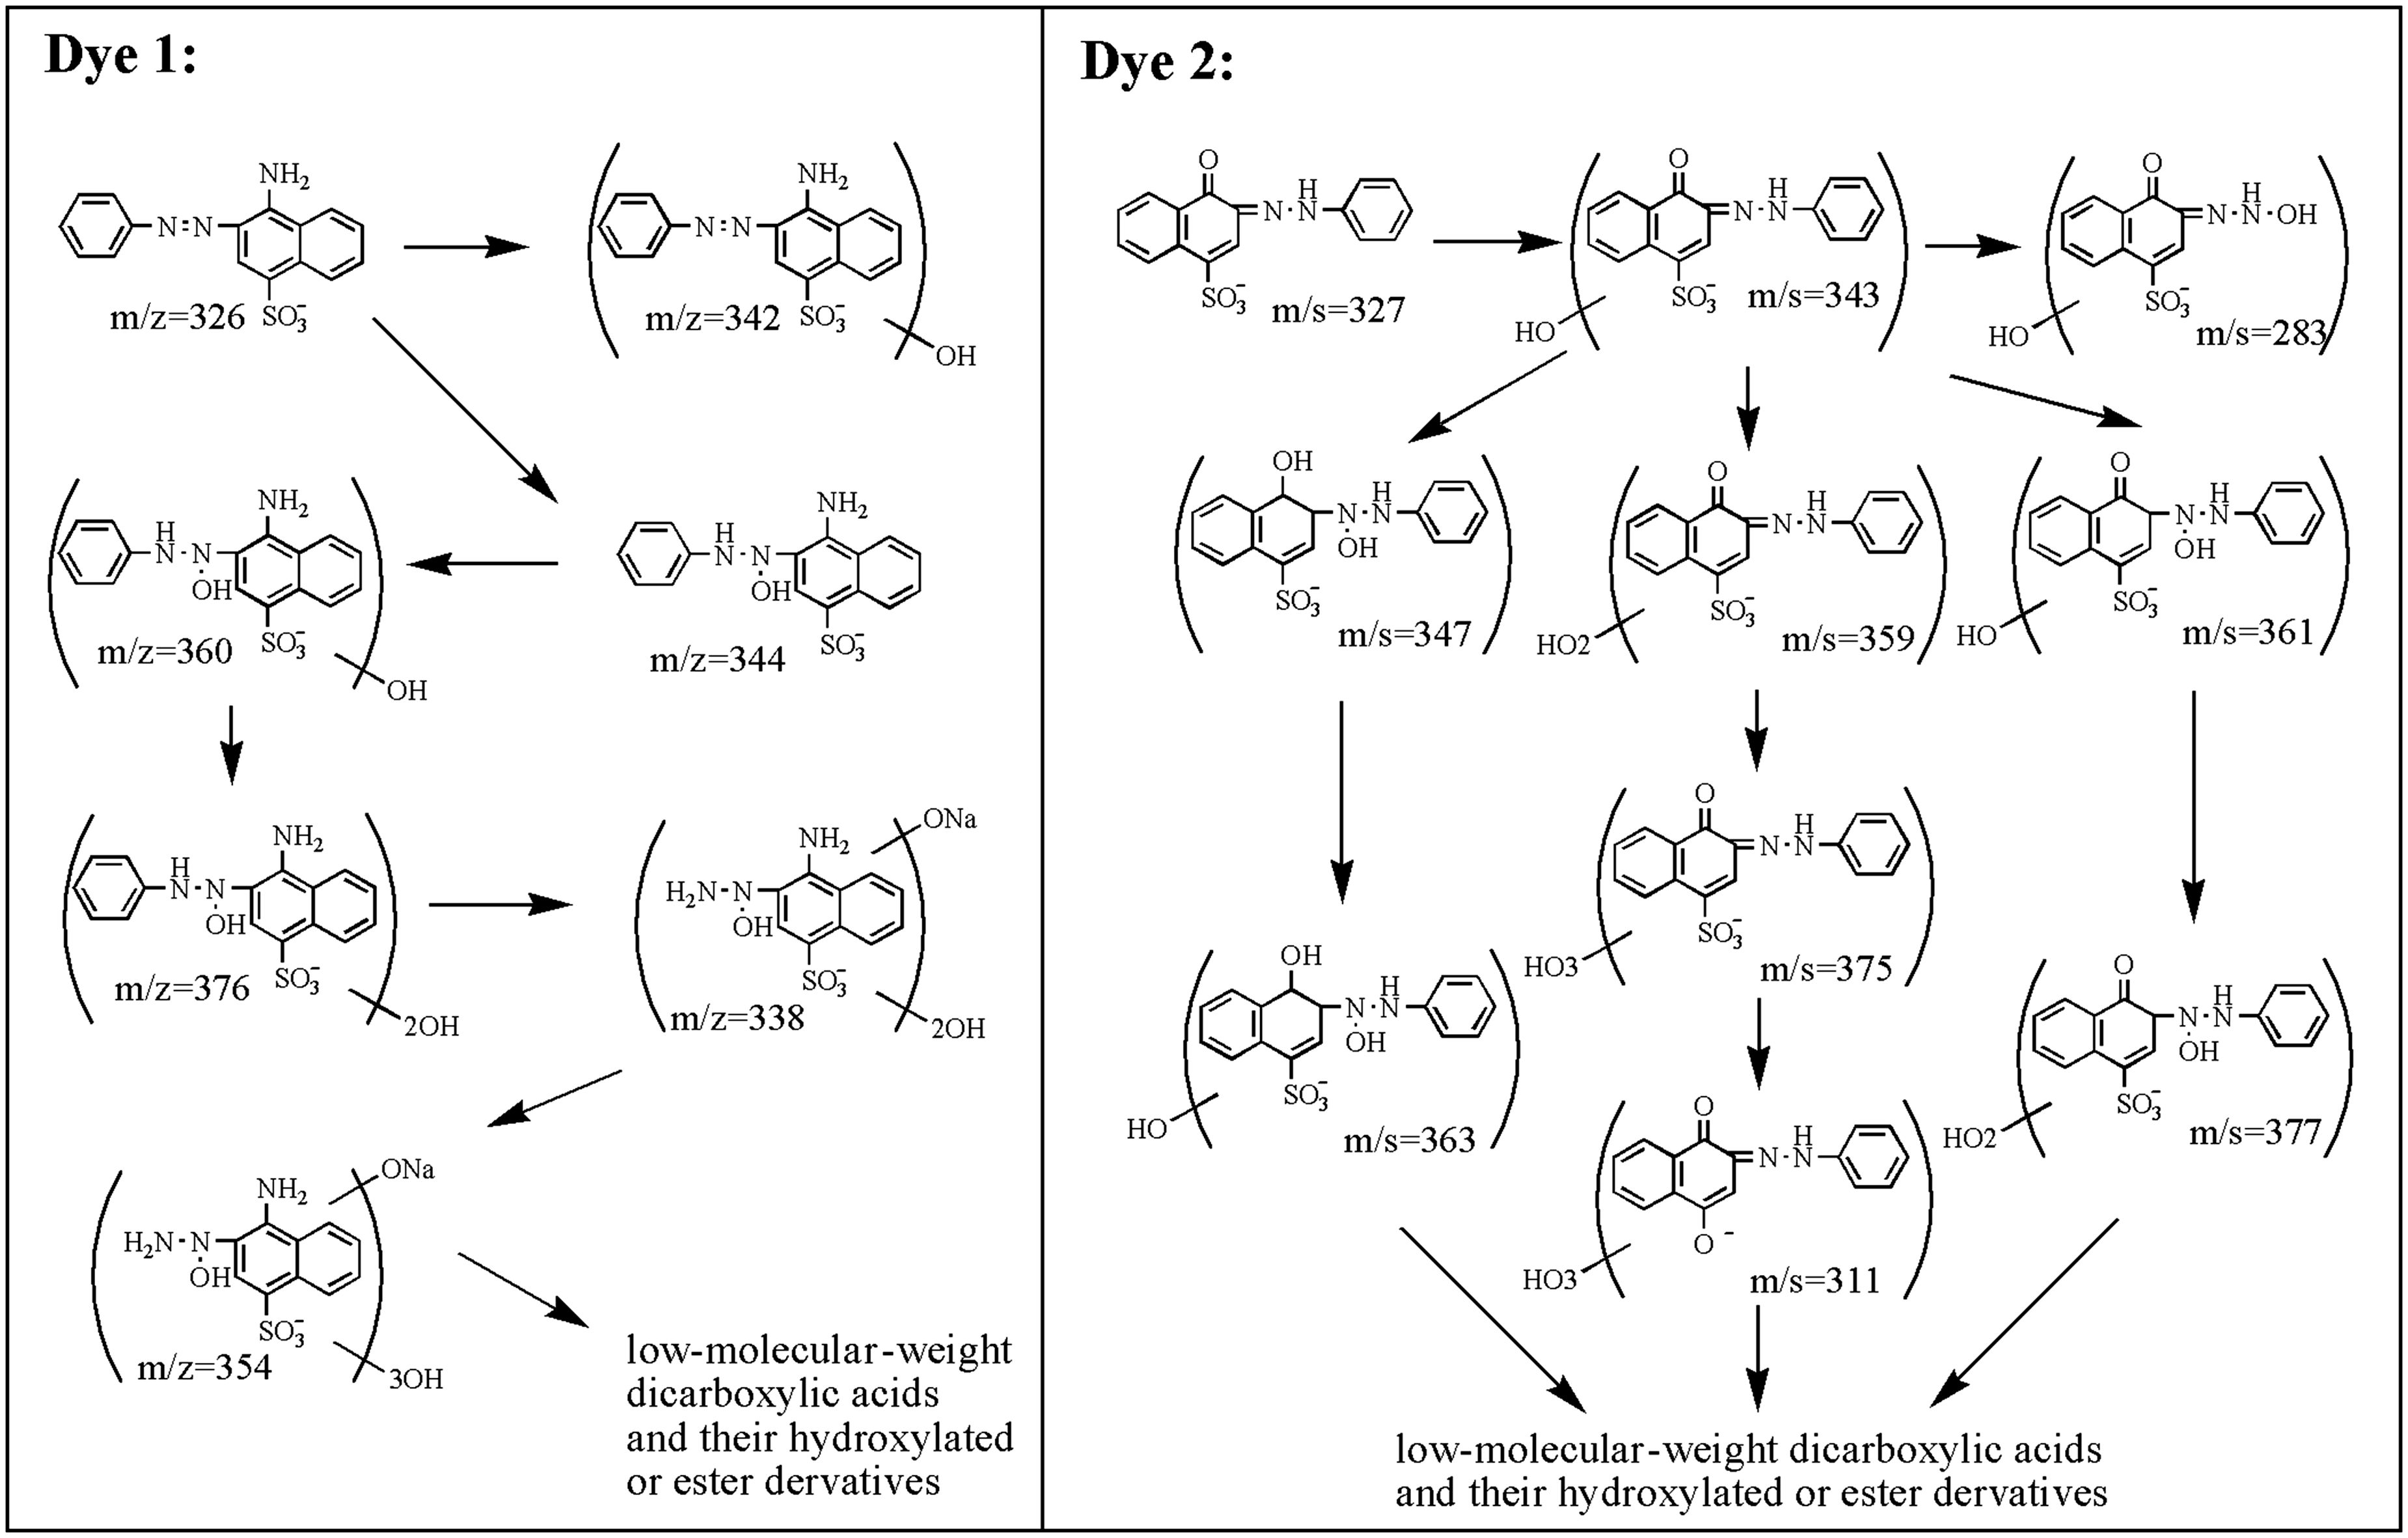
However, with more identified hydroxylated derivatives, dye 2 undergoes a more complicated degradation process compared with dye 1, which should be attributed to the nucleophilic addition of the hydroxyl radical. On one hand, the hydroxyl radical is inclined to attack the hydrazine moiety with relatively strong electron cloud density. Thus, the conjugated system is easy to destroy. On the other hand, the hydroxyl radical is also supposed to attack aromatic and naphthalene rings.
Conclusions
The photofading of model azo and hydrazone dyes under UV light is studied with HPLC-ESI-MS, GC-MS and IC employed for the identification of intermediates formed during the dye photodegradation process. The degradation intermediates of both dyes in the initial steps are all hydroxylated derivatives, and degradation fragments in the final steps are dicarboxylic acids and their hydroxylated and esterified derivatives. Subsequently, the formation processes of these intermediates, as well as the degradation pathways of both sulfonated azo dyes, are demonstrated. Consequently, the photofading of both azo and hydrazone dyes are speculated to be induced by hydroxyl free radicals. Besides, this study has confirmed that HPLC-ESI-MS, GC-MS and IC techniques are well suited for monitoring the intermediates formed during the photofading of the two model dyes.
Footnotes
Declaration of conflicting interests
The authors declared no potential conflicts of interest with respect to the research, authorship and/or publication of this article.
Funding
The authors disclosed receipt of the following financial support for the research, authorship, and/or publication of this article: This work was supported by the Nature Science Foundation of the Jiangsu Higher Education Institutions of China (16KJB540002) and the Nantong Applied Research Program (GY12016031).