



Abstract
The high quality of cashmere contributes to the superior handle of luxury fabrics. However, there is little understanding of the subtle differences among cashmere samples that induce differentiation of the resulting soft luxury fabrics. In this study, we focused on developing an objective way to simulate the hand touch of an expert by applying low compression pressure and frictional force on a fabric. The softness of cashmere is characterized under low applied force, as are its compression and surface properties. The compression energy (WC) and displacement (Dmax) at a maximum pressure of 250 Pa can be used to differentiate among samples. Fibers with higher mean curvature have lower WC, indicating the effect of fiber slippage during compression. The mean coefficient of friction (MIU) shows a significant difference (p ≤ 0.05) among fine cashmere fibers. Softness as evaluated by the hand touch of an expert can be explained by both WC and MIU.
The quality of Mongolian cashmere is often judged visually and tactilely by experts. These evaluations can provide the first insight to identify very high-quality raw cashmere that can be used to produce high-end products. We are interested in this tactile judgment of experts to develop a new characterization method for the unique handle of cashmere. We asked 20 experts from companies in Mongolia the following question: what are the important points when evaluating the quality of raw cashmere assemblies by hand? Regarding quality, most experts emphasized the response from cashmere assemblies evoked by softness and bulkiness in the hands. Some experts commented on using the slippery feeling caused by fiber movement under a light touch to evaluate raw cashmere assemblies. According to how their fingers move, experts can judge both compression and slipperiness.
When evaluating the hand of a fabric, finger movement is very important for judging fine differences among samples. 1 Kawabata 1 described the primary hand, namely, “numeri” or “smoothness,” as follows: a mixed feeling coming from a smooth, limber and soft feeling. This feeling is imparted strongly to fabric woven from cashmere fibers. High-quality cashmere contributes to the superior handle of fabrics. Kawabata also showed that the numeri of a fabric is strongly related to the fabric surface friction, geometrical roughness and compression properties. 1 We reason that the unique hand perceived in cashmere fabric comes from this mixed feeling. The mixed perceptions obtained from the hands of fabrics have been studied to assess how they are affected by mean fiber diameter (MFD),2,3 fiber crimp4,5 and fabric blend ratio. 6
For fiber assemblies, there are many ways to characterize the quality of wool and cashmere fibers, such as through the series of quality specifications introduced by McGregor.7–13 He described the softness properties in terms of MFD, fiber curvature (FC) and resistance to compression (Rc). For merino wool, Rc is related to the wool grade, 14 but Rc is not a softness indicator for alpaca fibers. 15 McGregor 7 considered 101 samples from commercial lots collected from different sources around the world. The tendency is for the MFD of cashmere to increase slightly with decreasing Rc. The FC is also an important determinant of Rc.
The softness of wool fiber assemblies is indicated by their compression properties.16–19 As deduced from deviations in the diameter–handle relationship, differing resistance to compression can be detected for wool with a fiber diameter up to 10 µm. 16
In an earlier study, van Wyk 20 developed a theoretical relationship between the pressure applied to a random assembly of wool fibers and the volume of that assembly. There is a linear relationship between Rc and the number of crimps per unit length. Komori et al. modified van Wyk’s theory to include the degree of curliness of fibers in random assemblies, and simulated how the constituent fibers absorb load and deformation under compression. 21 Furthermore, Carnaby et al. found that the compressional modulus and the change in Poisson’s ratio during compression and recovery are dominated by the mechanical properties of and the directional distribution in a fiber assembly. 22
However, despite the aforementioned insights, there is as yet no objective way to detect the subtle differences among cashmere fiber assemblies. Expert judgment of cashmere tops includes their slippery feeling, and the numeri fabric hand is related to surface friction. However, no studies published to date have made objective measurements of surface properties for fiber assemblies such as tops. Consequently, fiber assemblies continue to be evaluated in the traditional way, namely, by experts. Objective and subjective measurements of fabric hand evaluation have been simultaneously reported to clarify the physical meanings.23–25 We reason that this is a meaningful technique for the practical assessment of cashmere tops.
We became interested in the softness and bulkiness of cashmere tops following our preliminary survey in Mongolia. Visual judgment is also important for differentiating among samples, but we do not take that aspect into account in the present study. The aim of this study is to develop a useful objective method for assessing the handle of fine cashmere assemblies, one that relates closely to the human tactile senses. In this study, low compression pressure and frictional force are used to simulate the hand touch of an expert.
Experimental details
Materials
Sample specifications

CV: coefficient of variance.
Measured using an optical fiber analyzer (OFDA2000; BSC Electronics Pty. Ltd, Australia).
The MFD, fiber length and FC are used to classify cashmere. According to the Mongolian National Cashmere standard (MNS 3683: 2007), 26 sample 1 is classified as being of grade I (MFD 15.51–16.8 µm, fiber length > 38.0 mm). This sample was collected from different goats of different ages and sorted in the primary stage processing, but we do not account for any age-related effects. However, for samples 2 and 3, we do consider age and breed, as well as MFD, fiber length and FC. Samples 2 and 3 were from three- and five-year-old cashmere goats, respectively, on nomadic farms that keep only those breeds/strains that are native to eastern Mongolia. A top sliver of fine wool (sample 4) was used for comparison purposes.
Subjective evaluation
A subjective evaluation was carried out to assess how the fiber samples felt to people holding them and to determine how these feelings relate to the physical properties of the fibers. Twenty participants (7 experts in woolen textiles and 13 students; 12 men and 8 women) from the Institute of Frontier Materials at Deakin University undertook the evaluation. We used Scheffe’s method of paired comparison with five levels, a modified method by Nakaya.
27
In this modified method, a participant compared all the combinations of pairs once, but the effect of order of comparison for sample pairs was not tested. Each participant held a 1 −g specimen in her/his hands and then described it using words such as stiffness/softness, roughness/smoothness, non-bulkiness/bulkiness and uncomfortable/comfortable on a five-point scale from −2 to +2. Each participant evaluated the samples by her/his preferred means for each descriptive category. Figure 1 shows the common way in which the participants handled the samples. The tests were conducted in a room in which the temperature was 20.0 ± 2℃ and the relative humidity was 50.0 ± 2%. Care was taken to ensure that the subjects’ hands were not sweaty. The samples were replaced by a fresh set after every five evaluations to ensure that identical samples were being assessed. During the tests, the participants were unaware of which samples they were handling.
Tactile evaluation of fiber samples.
The data were analyzed statistically according to a standard paired-comparison test. 27 The paired data were analyzed by analysis of variance (ANOVA) to find the significance levels of four factors, namely, the main effect (Sα), the combined effect of individual differences (Sα(k)), the combined effect of pairing (Sβ) and the error (Sɛ). The significance levels of these factors were calculated for each aforementioned descriptive category. The average values of the preferences for all participants are obtained as αi, where i is the index of the sample.
Compression measurement
All fiber samples were dried for 2 h in an oven at 70℃ and then placed in an air humidity chamber (IG400; Yamato Scientific Co., Ltd, Japan) for 6 h at 20℃ and 65% relative humidity. Five specimens from each sample were used for compression testing. Each specimen was placed into a cylindrical cell with a cross-sectional area of 10.23 cm
2
and set in a compression tester (KES-G5; Kato Tech. Co., Ltd, Japan). The initial fiber density was 0.01 g/cm3. The orientation of the fibers in the cell influences the compression properties, especially because of frictional slippage effects.
28
Within the cell, the fibers were aligned horizontally, as shown in Figure 2.
Illustration of an oriented-fiber unit cell.
We examined four maximum pressures (100, 150, 200 and 250 Pa) under a constant compression speed of 0.001 mm/s. We chose pressures lower than those used in standard compression tests to measure compression resistance. 29 Under these measuring conditions, the fibers are compressed slowly and allowed to move.
Compression–recovery curves with characteristic values are shown in Figure 3. We repeated a compression–recovery test three times consecutively for each sample because an expert typically feels a sample several times before making a decision. From each curve, we calculated the maximum displacement (Dmax), the compression energy (WC) to reach the maximum pressure (Pmax), the recovery energy (WC′) and the compression resilience (RC); RC is the percentage ratio of WC to WC′.
Compression–recovery curves for sample 3 with characteristic values.
Surface friction of fiber top
The surface properties were measured using a surface tester (KES-SE; Kato Tech. Co., Ltd). The contactor (1 × 1 cm) consists of 10 parallel piano wires (each wire 0.5 mm in diameter) to simulate human fingertips.
From each sample, 0.05 g of fiber top was taken randomly, placed in an area of 70 × 40 mm on a glass slide (76 × 52 mm) and covered with adhesive tape. The sample initial thickness ranged from 4.0 to 7.2 mm before the contactor was applied. The glass plate was clamped along both edges of the sample stage in the direction of the contactor motion. The contactor was placed on the surface of the fiber sample with an applied load of 0.1 N, and the sample stage was moved 30 mm (forward) and then return to the original position (backward) in one cycle at a speed of 1 mm/s, as shown in Figure 4.
Photographs of (a) surface tester, (b) contactor and (c) side cross-section of fiber top.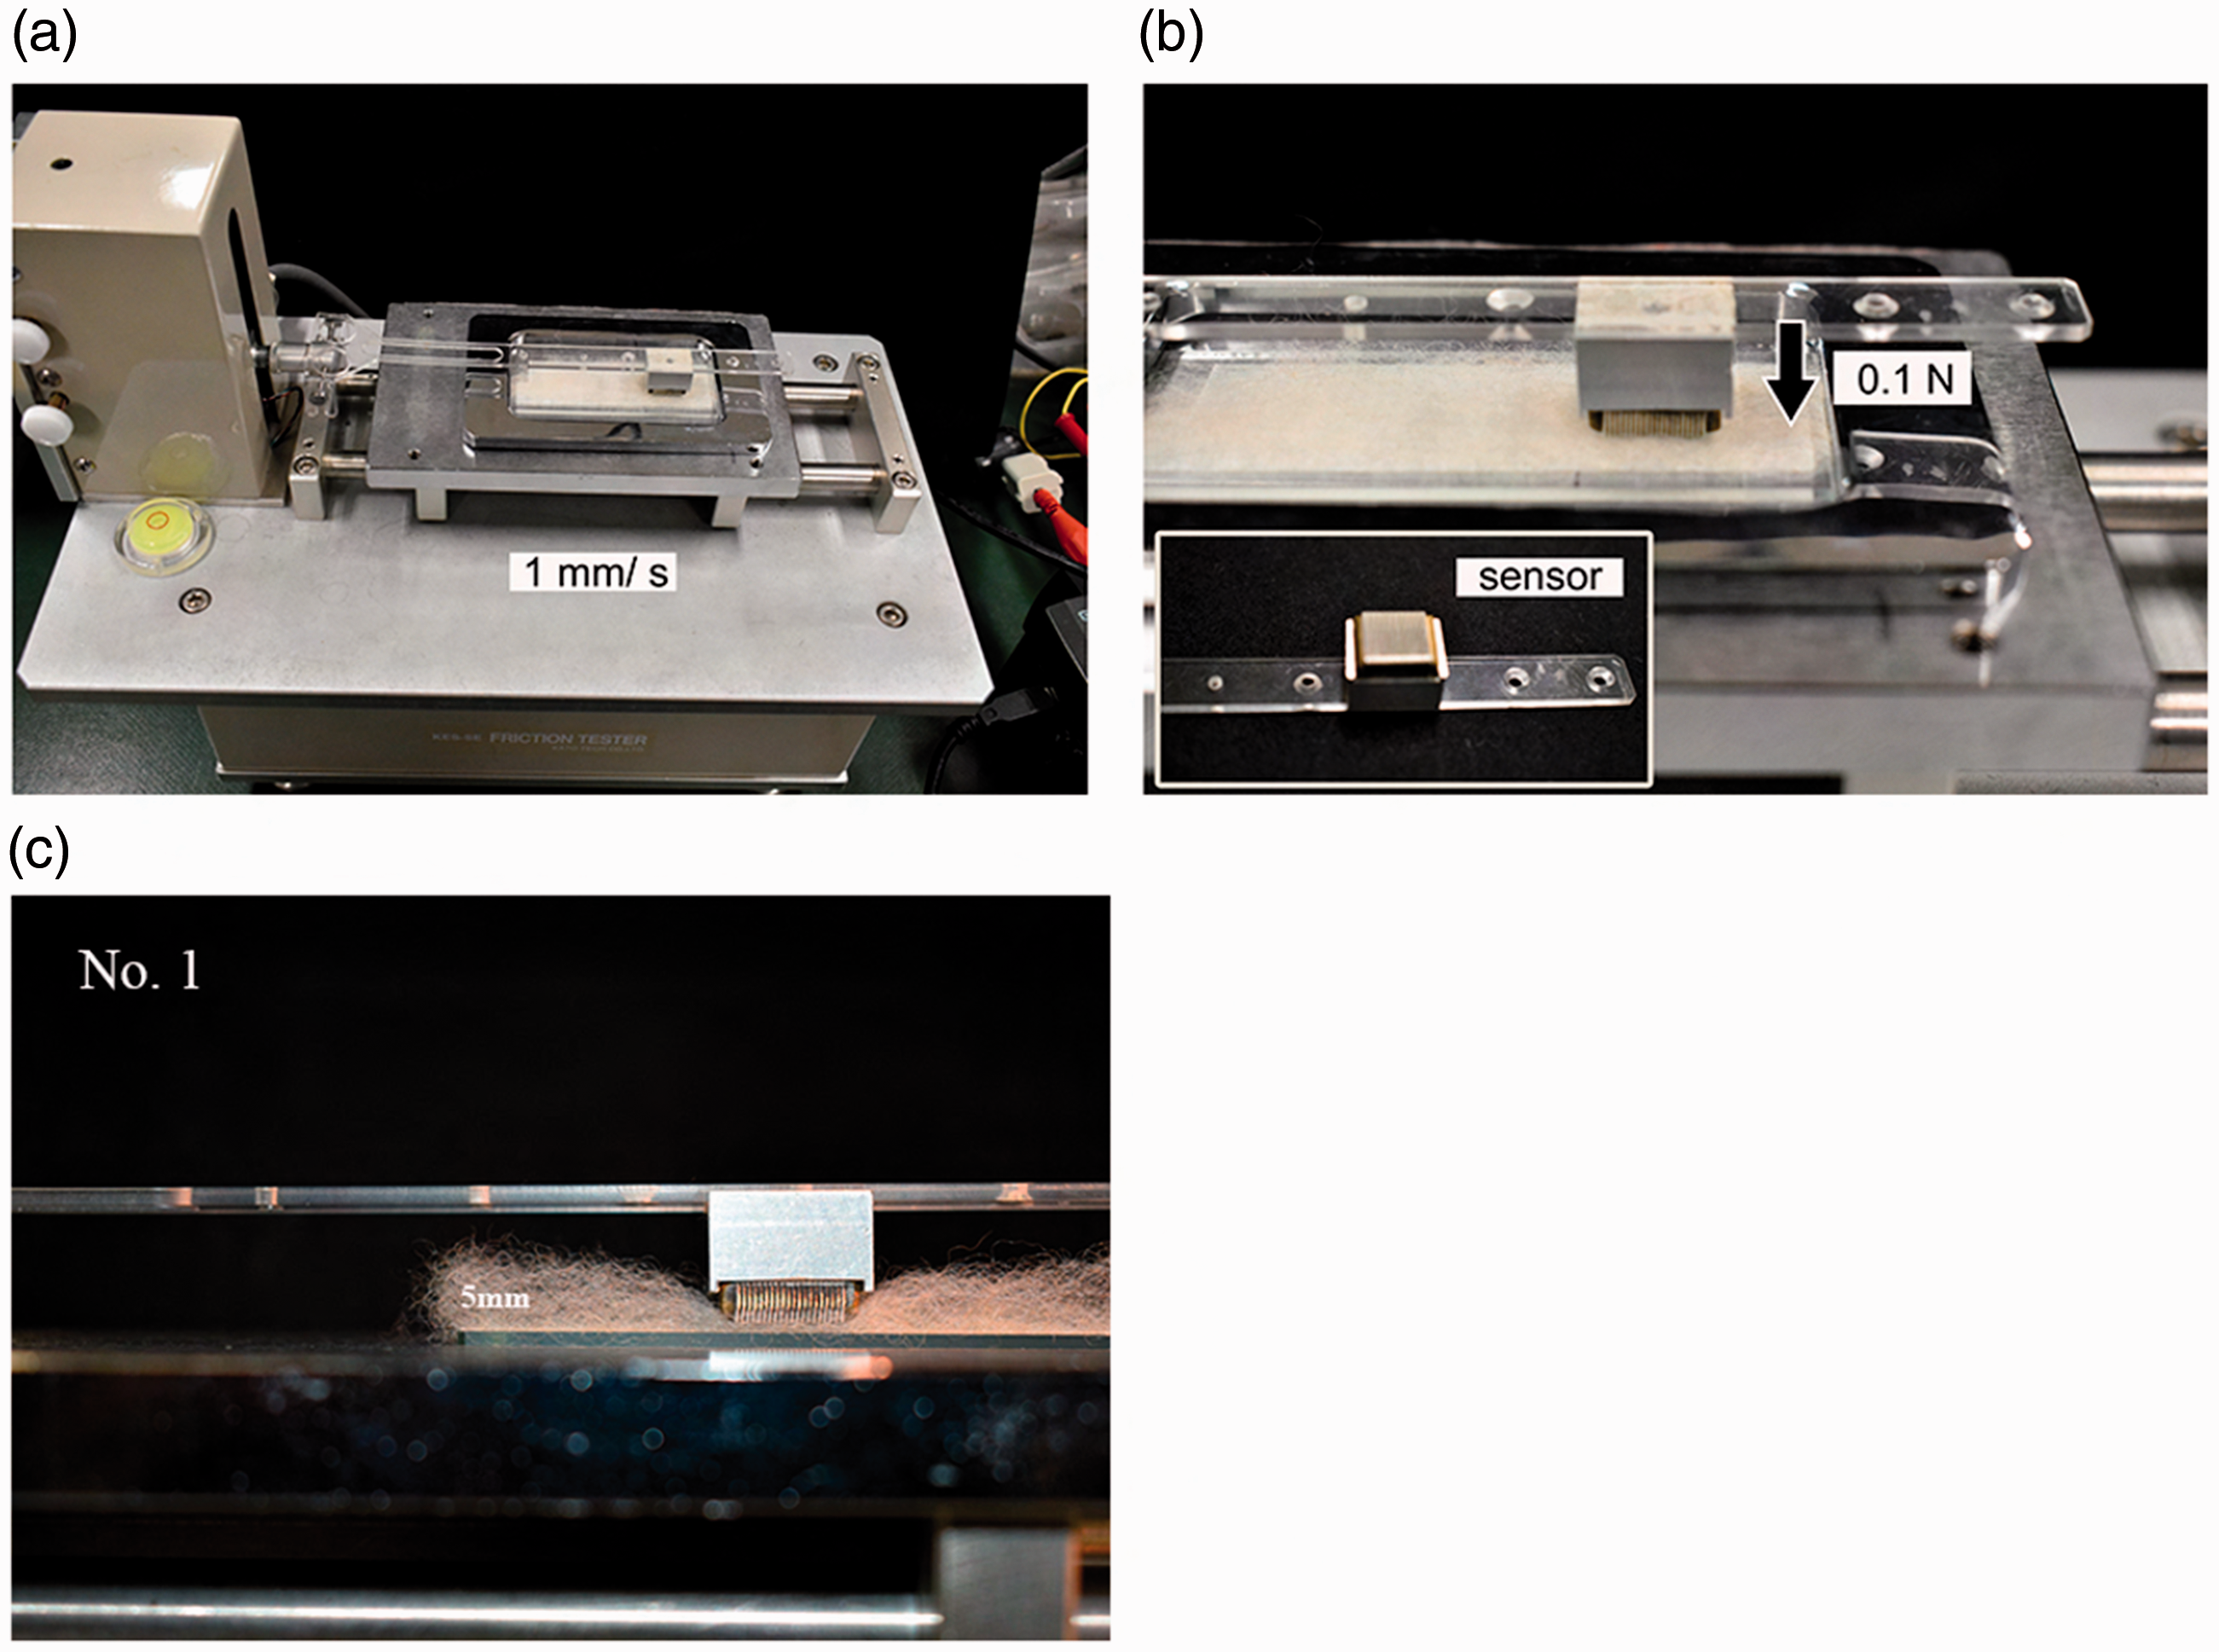
The standard load for a fabric is 0.5 N, 1 but we used 0.1 N for the fiber samples. In Figure 4(c), some of sample 1 is shown in a side cross-section. Fibers were aligned as the original top. The thickness decreased when the contactor was placed with the applied load of 0.1 N. Five test specimens from each sample were used for surface testing. The coefficient of friction µ was calculated from the measured frictional force F and normal load N using µ = F/N at sample displacement. The mean coefficient of friction (MIU) 1 was calculated as the mean value of µ for 20 mm intervals from 5 to 25 mm. We refer to the mean deviation of MIU as MMD. 1
Results and discussion
Subjective evaluation
From the ANOVA results, all values of average preference, that is, the main effect (Sα), were significant at the 0.01% level for stiffness/softness, roughness/smoothness, non-bulkiness/bulkiness and uncomfortable/comfortable. The average preference (αi) for each sample was then calculated using the data for all participants. The values of αi are plotted in the yard stick scales shown in Figure 5. Significant differences (p < 0.01) in stiffness/softness, roughness/smoothness, non-bulkiness/bulkiness and uncomfortable/comfortable were observed between cashmere (samples 1–3) and fine wool (sample 4).
Evaluated tactile preferences for softness, smoothness, bulkiness and comfort. ** indicates the 1% significance level.
Analysis of variance in tactile evaluation

Significant at the 0.01 level.
NS: not significant.
Compression properties
WC and Dmax
In Figure 6, the values of WC obtained from the first and second cycles are plotted against maximum pressure Pmax. The first compression cycle began with each sample having the same initial density (0.01 g/cm3), giving more space between fibers compared with the second cycle.
Compression energy (WC) versus maximum pressure (Pmax) for the first and second cycles.
In the first cycle of compression, WC differed among the samples at the lowest pressure of 100 Pa. In the second cycle, the initial density was higher because of fiber movement generated during the first cycle. Consequently, other than for sample 3, the WC values were lower than those from the first cycle. For both cycles, the inter-sample difference in WC was greatest for Pmax = 250 Pa. At each value of Pmax, sample 3 had the lowest compression energy of all the samples.
We chose the pressure of 250 Pa by considering WC and Dmax. In Figure 6, the inter-sample difference in WC is greatest for 250 Pa. In the case of Dmax, differences among samples are observed for both Pmax = 100 Pa and 250 Pa. Therefore, we chose the common pressure 250 Pa with which to characterize the samples.
Maximum displacement of each sample at different values of maximum pressure

Compression resilience (RC)
Compression resilience (RC) of each sample at different values of maximum pressure

Effects of fiber diameter, FC and fiber length
Compressional softness has been discussed in the literature in relation to fiber diameter, FC and fiber length.15,17–20 As given in Table 1, the MFD for the three cashmere samples ranges from 15.33 to 16.23 µm. In Figure 6, samples 2 (15.33 µm) and 3 (16.23 µm) show lower WC values than that of sample 1 (15.77 µm), which cannot be explained by the MFD alone.
In Figure 7, the values of WC obtained from the first and second cycles are plotted against the mean fiber curvature (MFC) of each sample. The effect of MFC on WC is higher in the first cycle than in the second cycle, especially for sample 1.
Compression energy (WC) versus mean fiber curvature for the first and second cycles.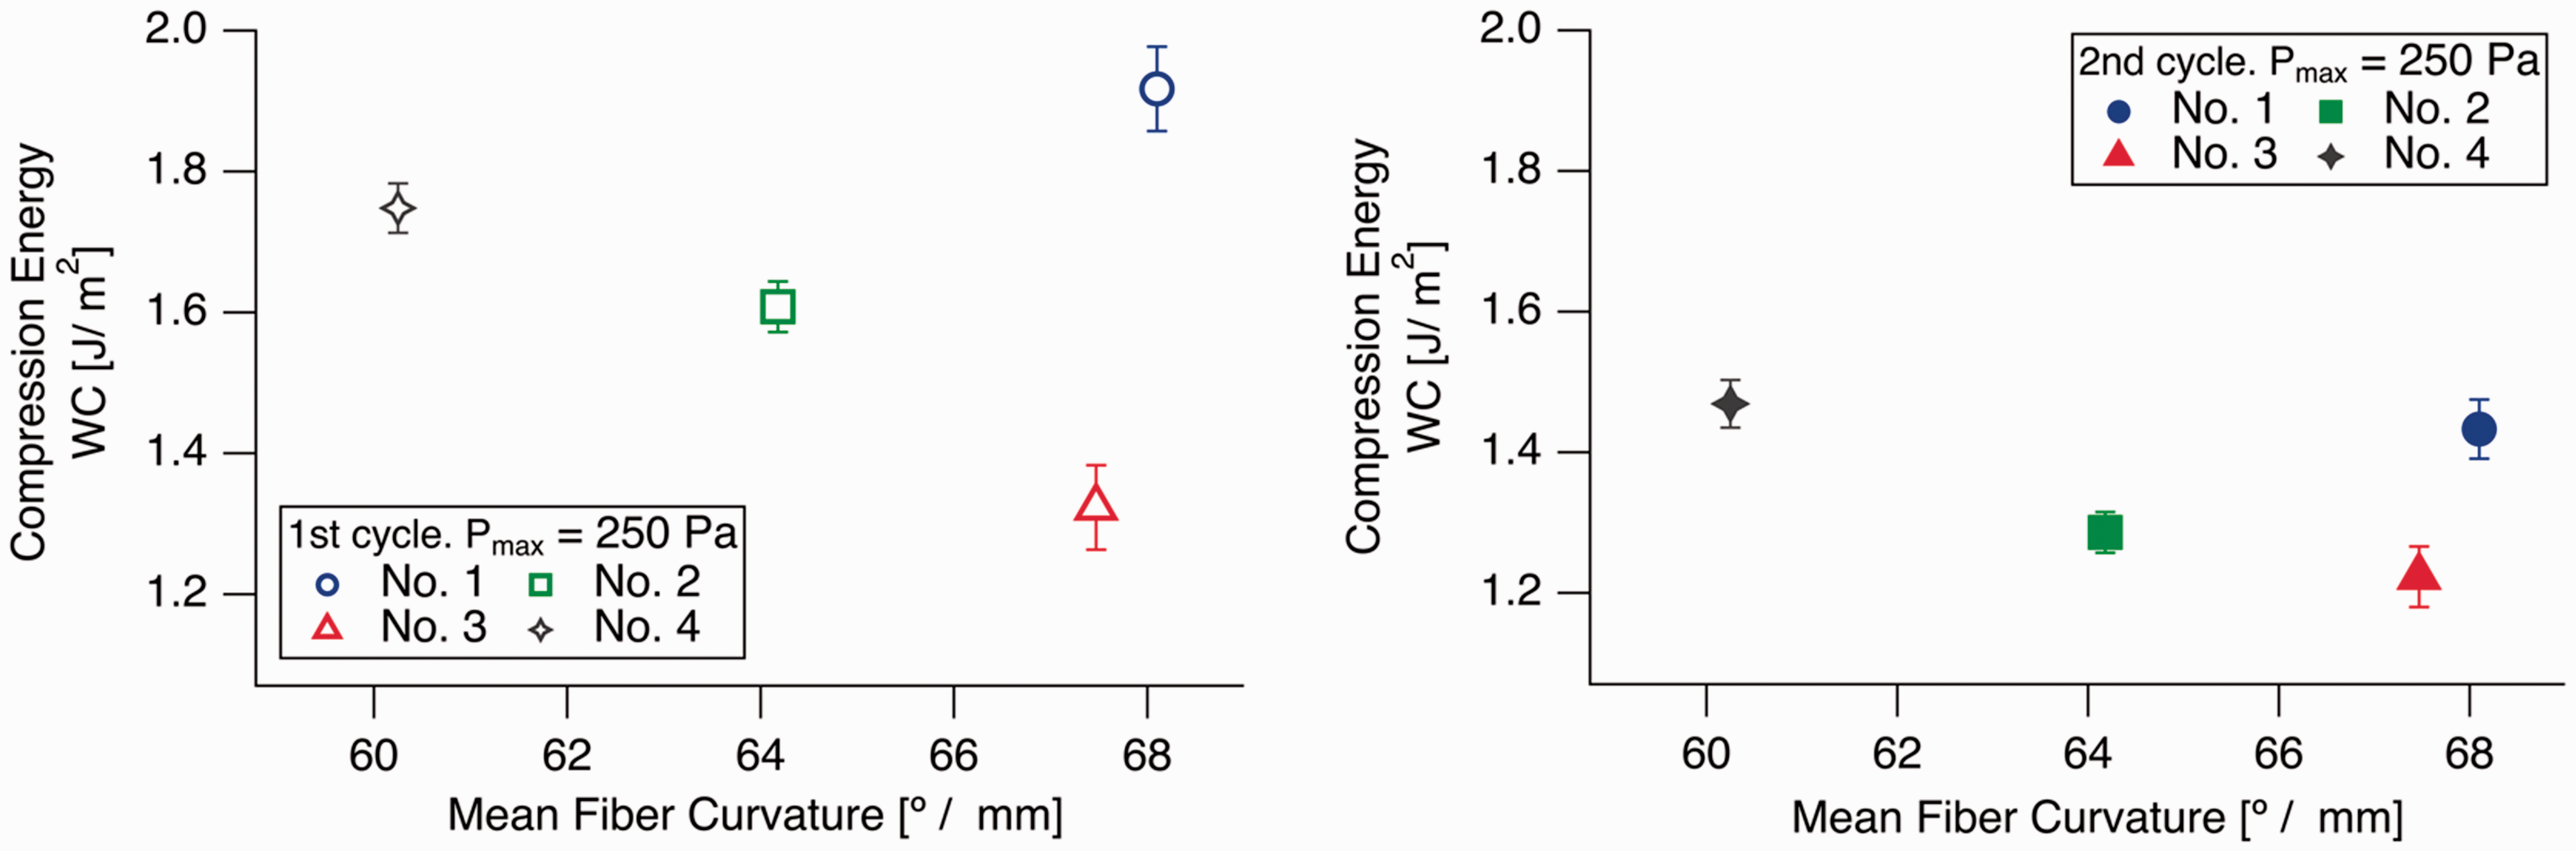
Referring to samples 4, 2 and 3, the WC values decreased with MFC (60.25, 64.18 and 67.47°/mm, respectively). The MFCs of samples 1 (68.10°/mm) and 3 (67.47°/mm) are very close, but the WC value for sample 1 is larger than that for sample 3. We investigated the geometrical shapes of the fibers closely to consider the degree of fiber movement during compression. Fibers from the tops were prepared in the same manner as that described in the section “Surface friction of fiber top.” Fibers were extracted and placed on glass plates in the same direction, as shown in Figure 8. Sample 4 (wool) clearly has a low degree of FC. By contrast, there are loops near the fiber root for cashmere samples 1 and 2 but not 3.
Photographs of fiber crimp shapes extracted from tops.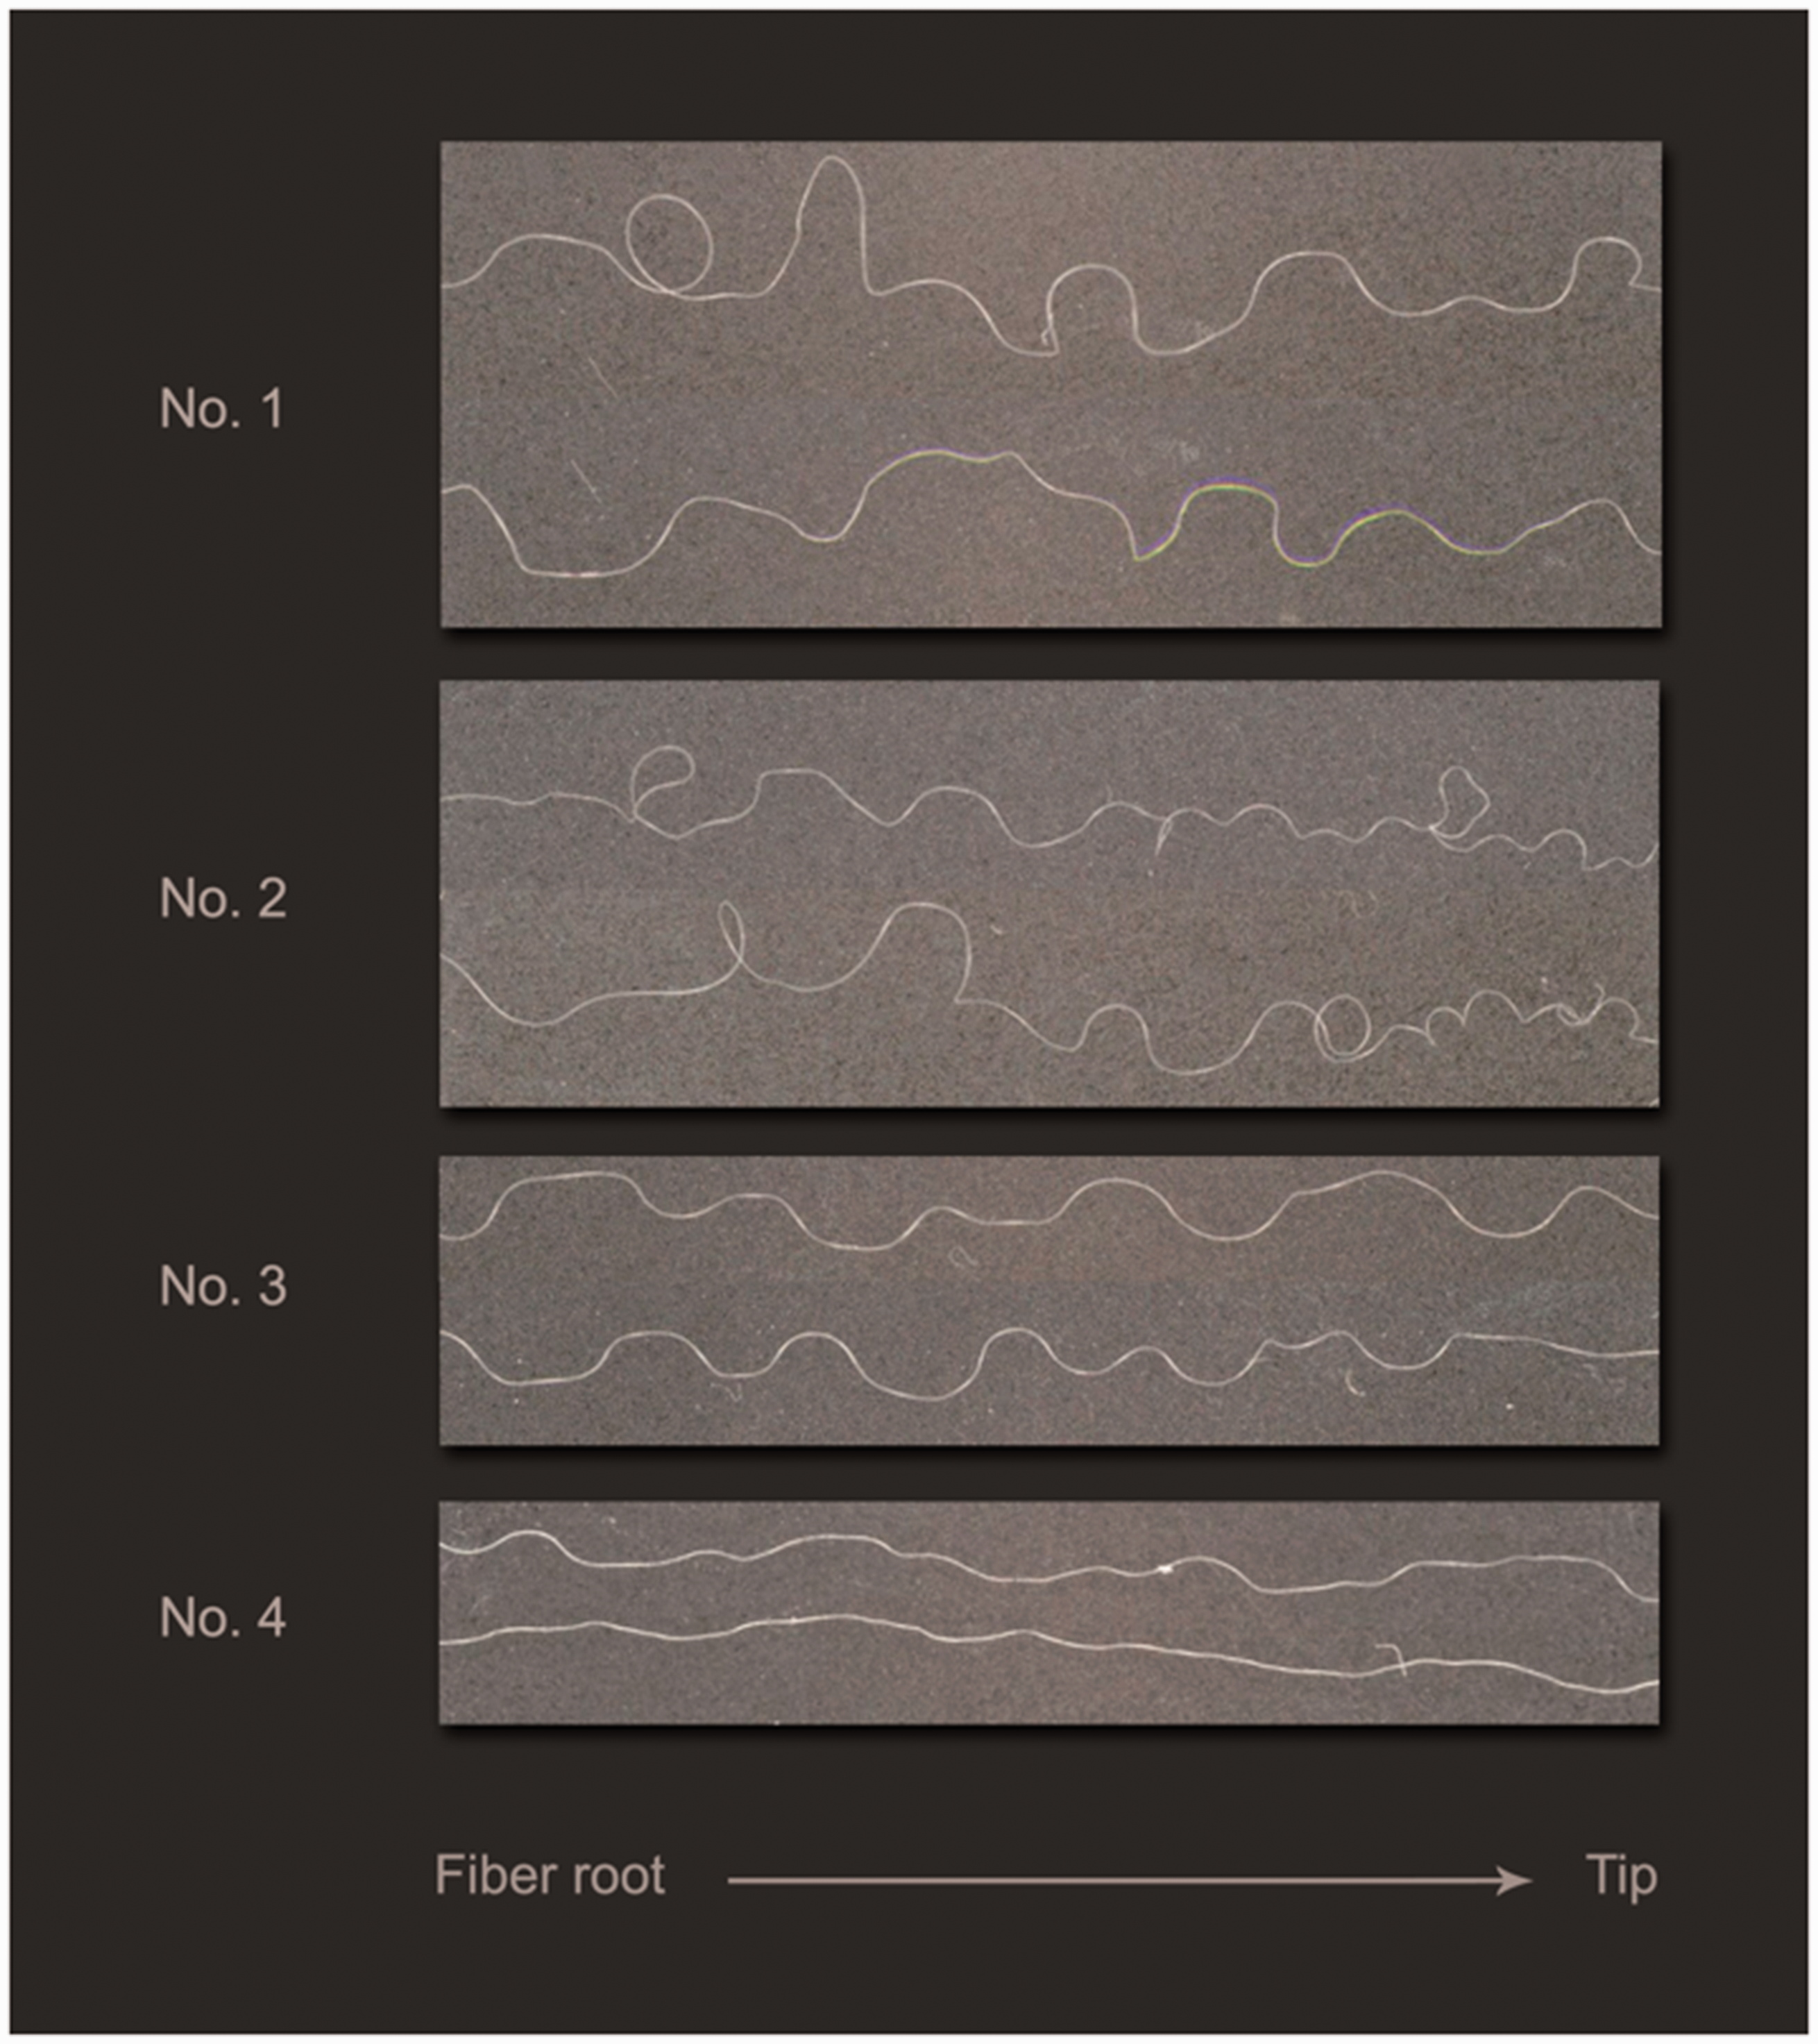
Fiber movement or slippage occurs when a fiber assembly is compressed and recovers. As given in Table 3, the change in Dmax between the first and second cycles for sample 1 is larger than that for sample 3. The fiber lengths of samples 1 and 3 are 44.4 and 40.4 mm, respectively. There was more resistance to slippage with sample 1 because there were more contact points, leading to less relative movement of fibers. This might be why the WC is higher for sample 1 than that for sample 3.
Surface properties
Smoothness and slipperiness might be characterized by the coefficient of friction µ, MIU and MMD. Figure 9 shows the changes in µ over the first 30 mm of displacement in the direction of the fiber scales. A static frictional force was generated when the contactor began moving, whereupon the dynamic coefficient of friction decreased with further movement. A periodic stick–slip pattern can be seen in the values of µ for sample 2, and for sample 1 µ increased after 20 mm of displacement. Localized sticking may be due to geometrical changes in the fiber surfaces. Theoretically, the total frictional resistance is the sum of the forces due to adhesion and deformation. The adhesion force must be small for fine cashmere fibers, but we must consider the deformation of soft fiber assemblies caused by moving the contactor.
Friction curve for each sample.
The average values of MIU and its significance between samples are shown in Figure 10 for both forward and backward directions. The MIU values in the forward direction were lower than those in the backward direction for all samples, with the most obvious difference being that for sample 4 (fine wool). Significant differences were confirmed between cashmere (samples 1–3) and fine wool (sample 4) in the two directions and among the cashmere samples (p ≤ 0.05) in the forward direction.
Values of mean coefficient of friction (MIU) obtained for both forward and backward contactor movement.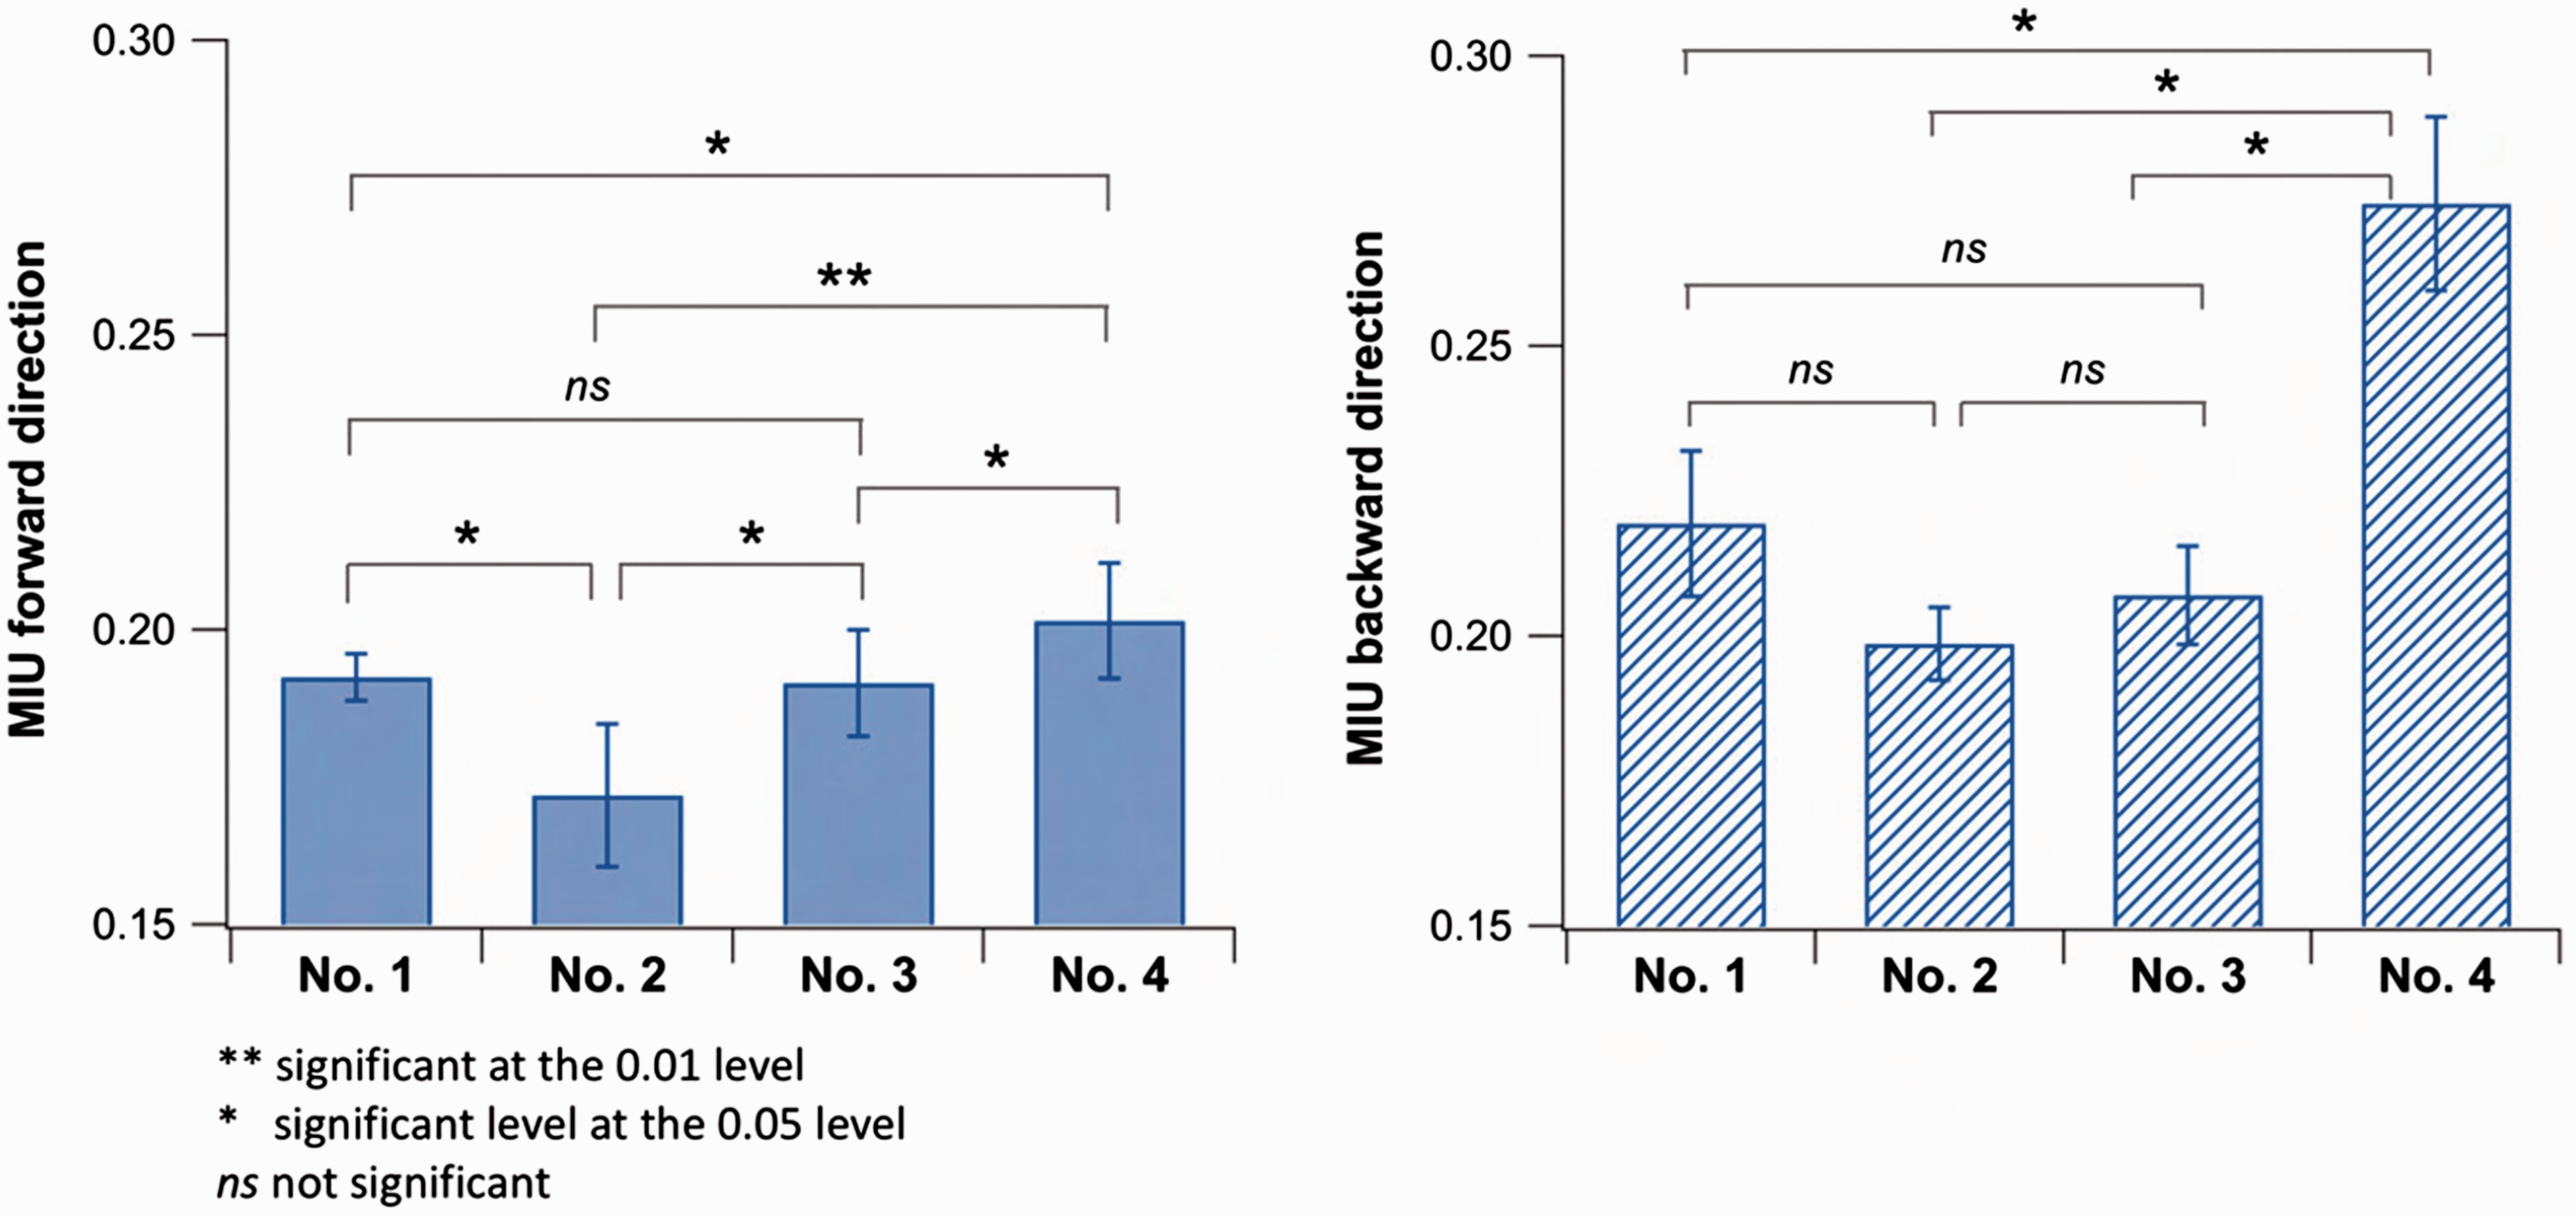
The lowest value of MIU in both directions was for sample 2, which might have been caused by the MFD and the lower degree of FC typical of smooth surfaces with a small adhesion force. In one measurement cycle, the difference in MIU values between the forward and backward directions might be influenced by a change in fiber assembly.
For the mean value of MMD, there was also a significant difference (p ≤ 0.01) between cashmere (samples 1–3) and fine wool (sample 4) in both directions. However, no significant difference was observed among the cashmere samples, except for samples 1 and 3 in the backward direction.
The existence of scales on the fiber surfaces was confirmed by scanning electron microscopy, as shown in Figure 11. Wool fibers have notably higher scales compared with cashmere, as reflected by the higher fiber friction. The MIU value of fine wool (sample 4) in the backward direction (Figure 10) was significantly larger than those of cashmere (samples 1–3) (p ≤ 0.05), and fine wool was rated as rougher and stiffer in the tactile evaluations. Furthermore, the MIU values reflect the differences among the cashmere samples.
Morphology of fiber surfaces.
Conclusions
This study focused on developing an objective way to simulate the manual touch of an expert by using low compression pressure and frictional force. Among the compression results, the values of WC and Dmax at Pmax = 250 Pa were suitable for differentiating among the samples. Samples that had higher MFC showed lower values of WC, indicating the effect of fiber slippage during compression. A top of longer aligned fibers has more contact points, thereby reducing fiber slippage. The MIU values in the forward direction reflected the differences among the samples. Consequently, instead of using hand touch, it might be possible to differentiate among the softness of fiber tops by using the values of compression and MIU in combination.
Footnotes
Acknowledgements
DN acknowledges the support of the Higher Engineering Education Development Scholar Program of the Mongolian Government (File No. M-JEED MON P-11). Special thanks goes to Gobi Co., Ltd and Snow Fields Co., Ltd in Mongolia, who provided the cashmere samples.
Declaration of conflicting interests
The authors declared no potential conflict of interest with respect to the research, authorship and/or publication of this article.
Funding
The authors received no financial support for the research, authorship, and/or publication of this article.