



Abstract
In allusion to the challenging issue of identifying fabric materials by frictional sounds, this study endeavors to prove the possibility of classifying fabric friction sounds into their material categories using discriminators built upon the Haar features. A total of 32 pieces of fabric falling into four material categories including cotton, wool, silk, and flax are put through a specialized apparatus to collect frictional sound signals. The Haar features on every scale and position of the acquired signal are extracted to establish a feature space. For each point in the feature space, a discriminator is built to approve all positive samples of a certain category and deny as many negative samples as possible. To relieve the heavy burden produced by the huge number of discriminators, progressive selection is performed on the discriminators to form a queue in which a discriminator is liable to fix some errors of the former. The outcome is a much-reduced version of the unordered discriminators with the same discriminability. The improved Haar feature is also investigated and is found to be capable of reducing the size of the discrimination queue, thus further improving the efficiency of the mechanism. It is also revealed that additional samples involved can help achieve a perfect accuracy. The discrimination mechanism advanced by this effort can provide a basis for identifying fabric materials by frictional sounds.
Although people have long noticed the scrooping sound of silk and invented scrooping agents to impart this property to other fiber materials,11-3 there are not as many studies directly probing scrooping or textile-frictional sounds. Among these endeavors are two routes that scholars followed in terms of research methods. One is to treat the frictional wave as a sort of mechanical motion that can be described by the slip-stick vibration equations. In this context, the mean slip velocity is extracted as an index of the wave 4 and the slip-stick process can be predicted by the equations. 5 But the mechanical vibration equations overly simplify the frictional signal and a massive amount of information is ignored with this method. In comparison, the Fourier spectra can represent much more data in the frictional signal. Thus, some scholars have built sound parameters upon a fast Fourier transform (FFT), studied the relation between the fabric frictional signal and its mechanical properties that are acquired with the Kawabata Evaluation System, and predicted certain mechanical properties according to the sound characteristics 6 or vice versa. 7 With sound parameters extracted from FFT, researchers have also investigated various types of fibers, 8 cross-sectional shapes, 9 yarn structures, weave structures, 10 and mechanical velocities 11 for their effects on frictional signals, studied the relationship between frictional signals and subject perceptions from questionnaire survey 12 or Zwicker’s psychoacoustic models, 13 and clustered the signals by autoregression. 14 However, the Fourier spectrum has its drawbacks as it can only reflect frequency information, ignoring phase data. Furthermore, the two methods mentioned above are only useful for measuring stationary signals and are not intended to deal with those that are non-stationary. Therefore, previous studies have taken from the frictional signal a relatively stable fragment as their research object, not covering the whole process of fabric friction. In this research, however, the Haar feature is set forth to characterize the complete signal of fabric friction, followed by progressive discriminators, and tries to divide them into certain categories. The discrimination of fabric frictional sounds has been conducted to see if the signals are separable according to their material category, and the extent to which they are, and to find ways to promote discrimination performance, providing a basis for identifying fabric materials by sounds.
Materials
Fabric preparation
Fabric configurations
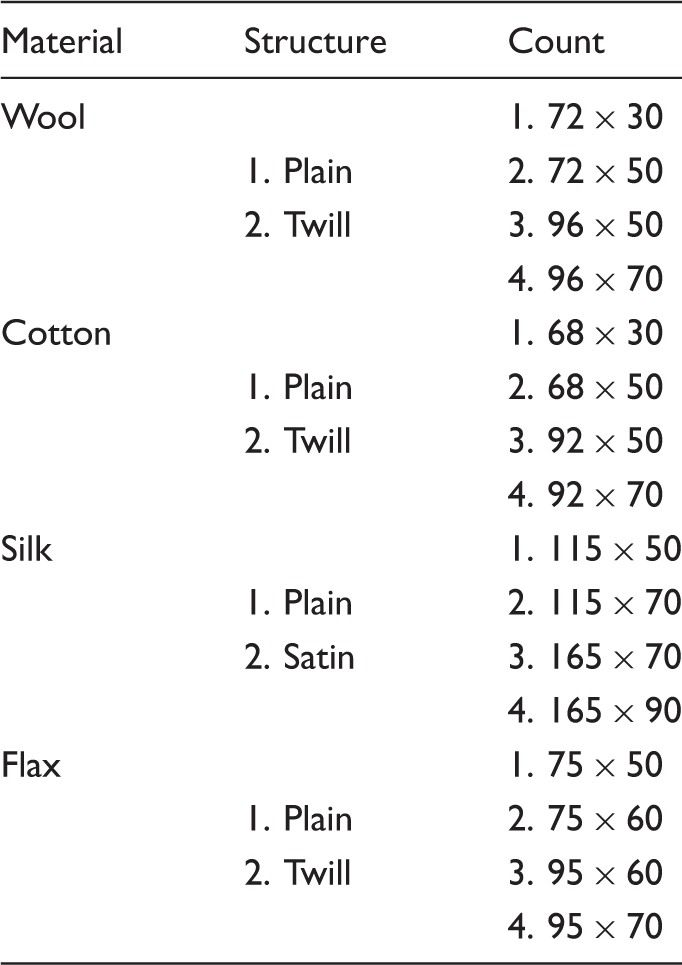
For each type of material, there are eight fabric samples with two kinds of weave structures and four kinds of warp/weft count. The initial letter of the material, the number of the structure, and the count are combined to designate a specific sample. For example, W11 refers to the wool fabric sample of plain structure and weave count 72 × 30, whereas C24 refers to the cotton fabric sample of twill and count 92 × 70.
Wave acquisition
A simple apparatus is made to capture the frictional signals, as demonstrated in Figure 1. A strip of sample fabric is fixed at one end and hooked by a tensiometer at the other. The fabric sample is protected from being creased by a pair of flat clamps at the two ends. A microphone is installed on the moving rod and connected to the computer. The microphone is horizontally 40 cm away from the fixed end of the fabric, and its height from the surface of the fabric can be adjusted by gears on the moving rod. Before acquisition, the microphone was wrapped with the same kind of fabric then and lowered to touch it to produce 5 N on the tensiometer and guarantee close contact between the microphone and the fabric. Next, the power was turned on and the starter motor allowed to drive the rod moving to the right, reaching the fixed end of fabric in 1 second. The friction wave generated in this short period is collected by the microphone with the sampling rate 8 KHZ and recorded as a waveform audio (WAV file) into the computer. Wave acquisition with this apparatus is conducted under a constant environment of 20 degrees Celsius and air humidity of 65%.
The instrument for friction wave acquisition.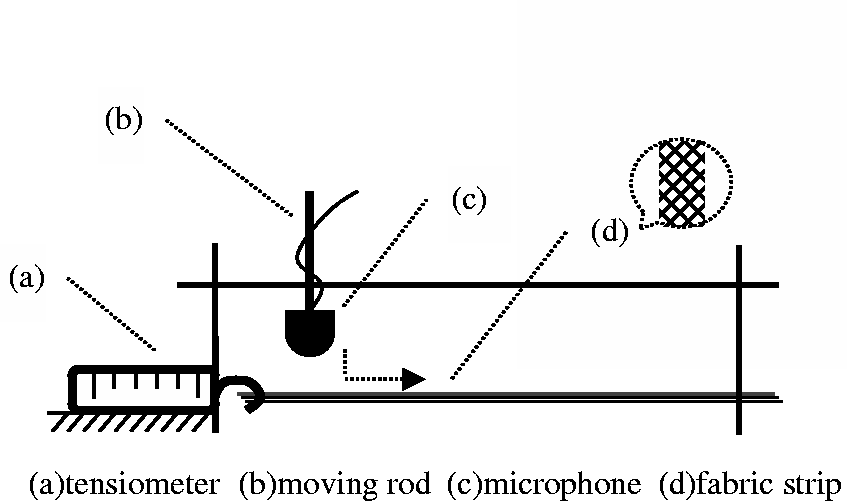
Typical sound signals acquired by the apparatus are exhibited in Figure 2. As shown in the figure, these signals are non-stationary and declining, in which situation the frequency domain analysis cannot work well. Therefore, instead of FFT, the Haar feature is employed to explore the signals in this study.
Fabric frictional sound signals. (a) Wool, plain weave, 72×30, (b) Cotton, twill weave, 68×30, (c) Silk, satin weave, 115×50 and (d) Flax, plain weave, 75×50.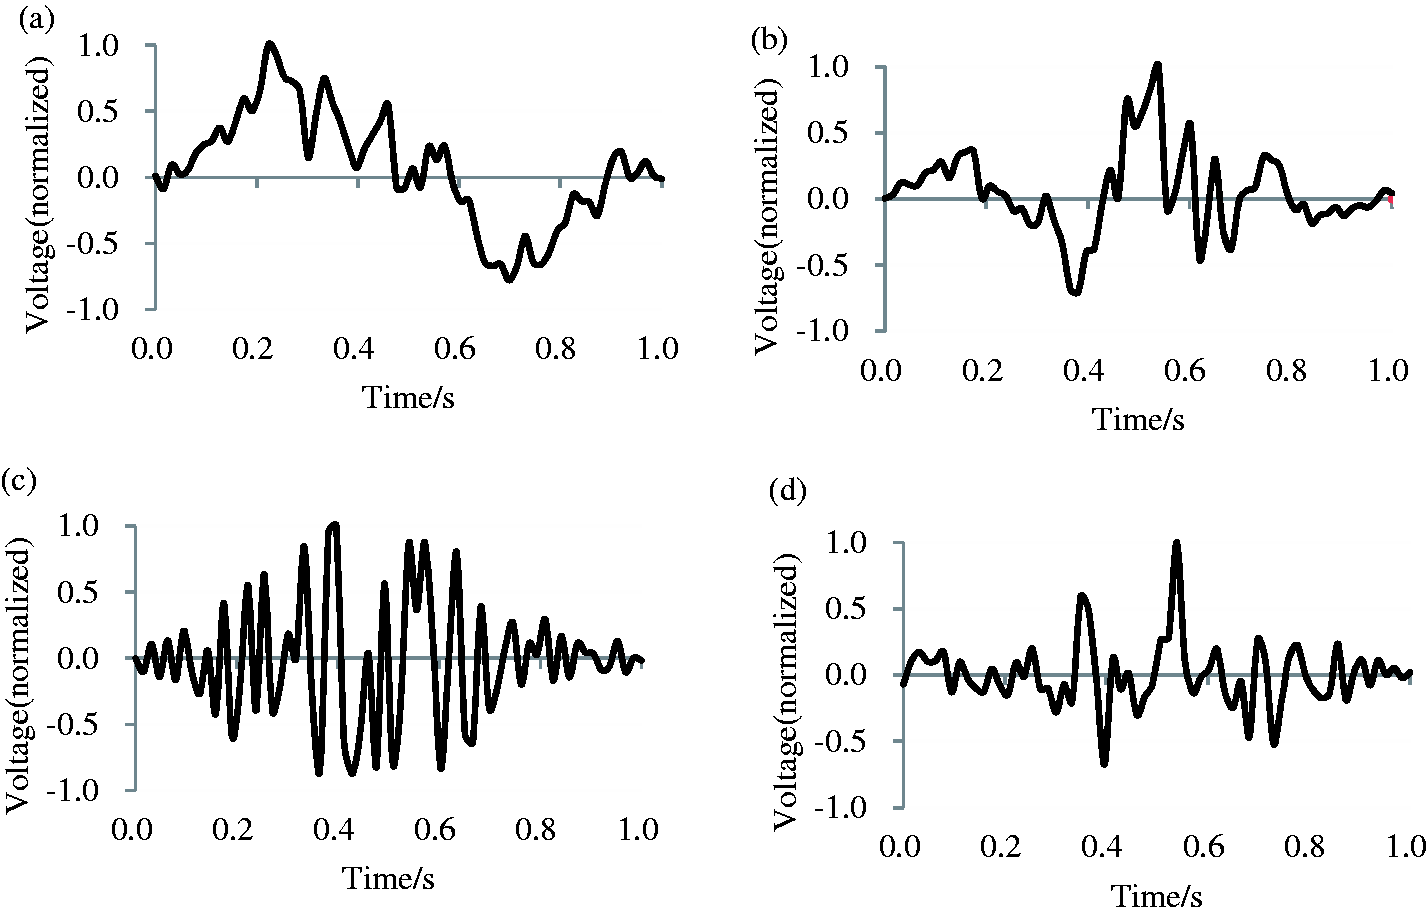
Methods
Haar feature space
The Haar feature is a basic tool for pattern recognition. The Haar feature (denoted as F) of a signal (denoted as V) is defined as a product of two vectors as follows:

In this equation,
This feature space can be visualized with grayscale mapping techniques. Taking s and p as vertical and horizontal coordinates separately, mapping values of all feature points into grayscale scope 0 ∼ 1, the visual representation of Haar feature space is illustrated in Figure 3.
Visualization of Haar feature space.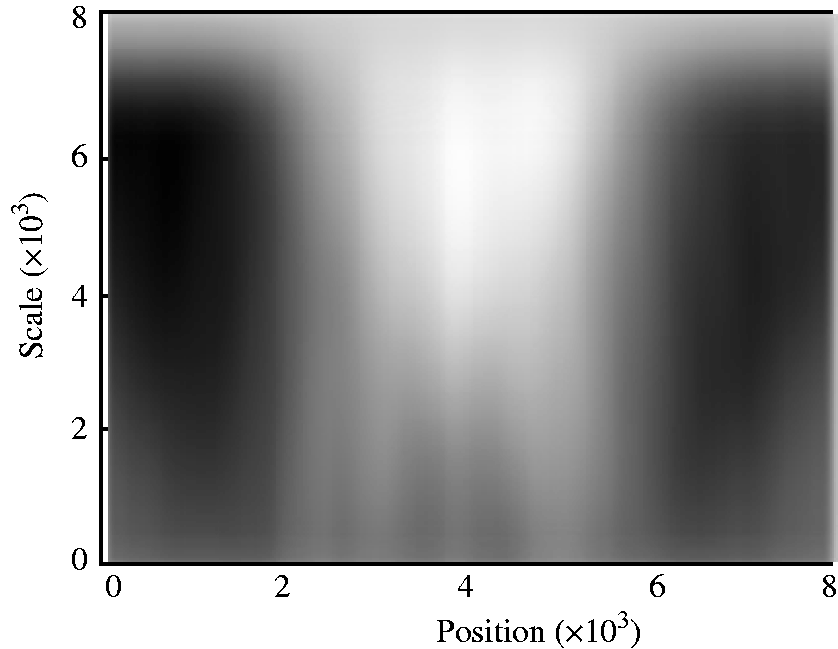
In Figure 3, bright spots represent the large values in the feature space whereas dark spots represent the small values. The Haar feature spaces for all signals in Figure 2 are provided in Figure 4.
The Haar feature spaces. (a) Wool, (b) Cotton, (c) Silk and (d) Flax.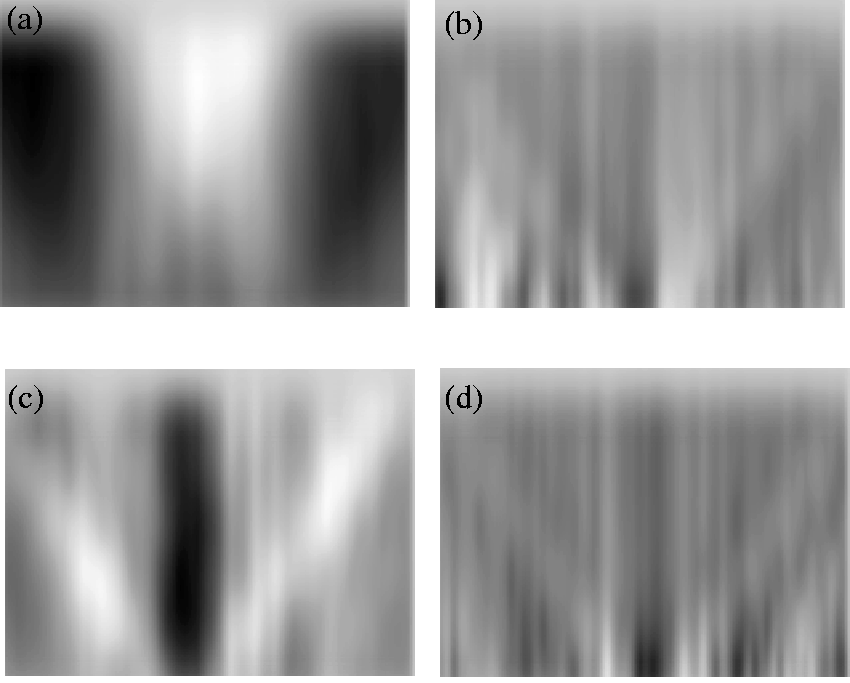
Building of discriminators
The Haar feature space defined by 
Here,
Thus, the key to a discriminator is ascertaining its threshold. In this study,
As mentioned above, eight fabric samples of wool, cotton, silk, and polyester are separately involved in this research. Any category of the four contains eight positive samples, with 24 negative ones falling beyond it. For example, when determining the threshold for D(1,2) of the wool category, feature values of F(1,2) for all 40 samples are indicated in Figure 5.
Determination of threshold for the discriminator.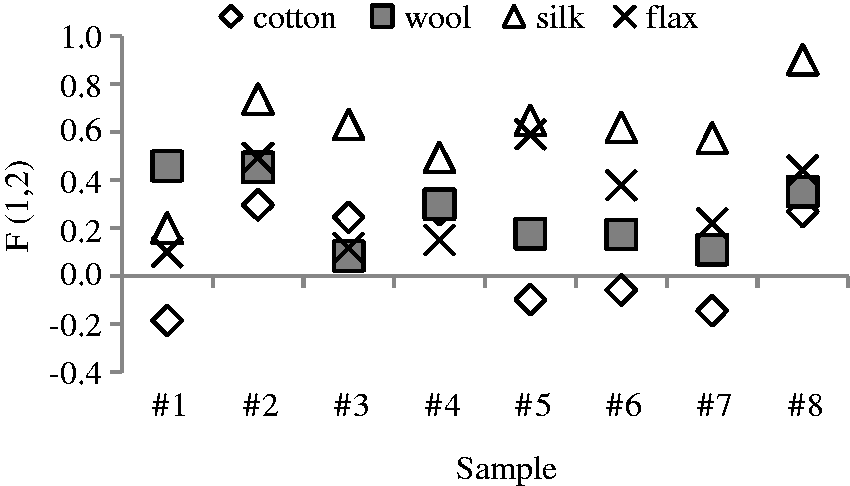
As seen, the ranges of feature values of the four types significantly overlap, making it impossible to carry out an effective division with one single threshold value. Given F(1,2) of wool samples covers 0.08–0.46, the threshold should be either 0.08 or 0.46 to identify all the positive samples (criterion 1). If 0.08 is adopted and samples with F(1,2) larger than or equal to 0.08 are regarded as positive, 20 negative samples will be misjudged. If 0.46 is adopted and samples with feature values smaller than or equal to 0.46 are regarded as positive, 15 negative specimens will be misjudged.
Therefore, the latter 0.46 should be chosen to meet criterion 2 and D (1,2) is thus determined as below:

Discriminators built this way are called “relaxed” or “weak”. They approve all positive samples and a certain number of negatives. Each of them has perfect accuracy on positives, but are extremely low on negatives. The role of a single discriminator is far from enough, but massive discriminators together can make a difference as each filters out certain negatives.
Overall, 64 million discriminators are built on the feature points in the Haar feature space. All positive samples could pass these discriminators, but the possibility of a negative sample passing all of them is tiny, as suggested in Figure 6.
Passing numbers of wool negative samples.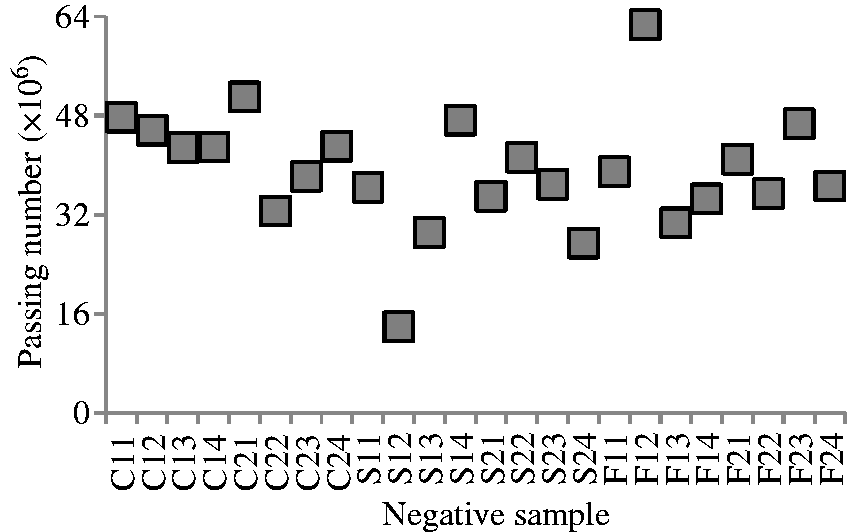
The number of discriminators that each negative sample of wool type passed are counted and marked in the figure. As shown, the passing numbers never exceed 64 million. Namely, no negative sample passes all discriminators, which means the 64 million discriminators together have a high precision on negatives.
Moreover, the passing numbers also indicate about 96% of wool negatives are declined by 80% of all discriminators, which implies there might be a large space for optimization.
Progressive discriminators
As mentioned, there are 64 million discriminators, which allow all positive samples and some negatives through. But these discriminators cannot be put into practice immediately as their huge numbers would lead to unacceptable heavy computation. So, a certain number of discriminators are selected to establish a discrimination queue in which positive samples pass along whereas negatives are declined as soon as possible.
A qualified discriminator in the queue must be capable of declining as many negatives as possible. Meanwhile, it must remedy some deficiency of the former discriminators, namely, fix some errors made by the last discriminator selection. To meet these requirements, a weight value is assigned to each negative sample of a certain type, and the value adjusted each time according to the results of discriminators to increase the weights of samples that have been falsely identified, making the selection process tendentious to the discriminators that can fill in the existing gaps. The main steps are below:
Step 1: Build all discriminators and assign an initial weight value 1.0 to each negative sample.
Step 2: For each discriminator, calculate a score for the sum of weights of negative samples that the discriminator declines.
Step 3: Select the discriminator with highest score (denoted as D(m)) and put it into the discrimination queue.
Step 4: Double the weights for the samples that have been misjudged by D(m), and go back to Step 2.
Steps 2–4 are repeated until a specific number of discriminators has been accumulated in the queue. These queued discriminators are called “progressive discriminators” as each of them improves the former in a progressive way.
By this means the discriminators of wool are filtered to build a queue of 40,000. The wool negatives handled in the queue are illustrated in Figure 7.
Queued passing numbers of wool negative samples.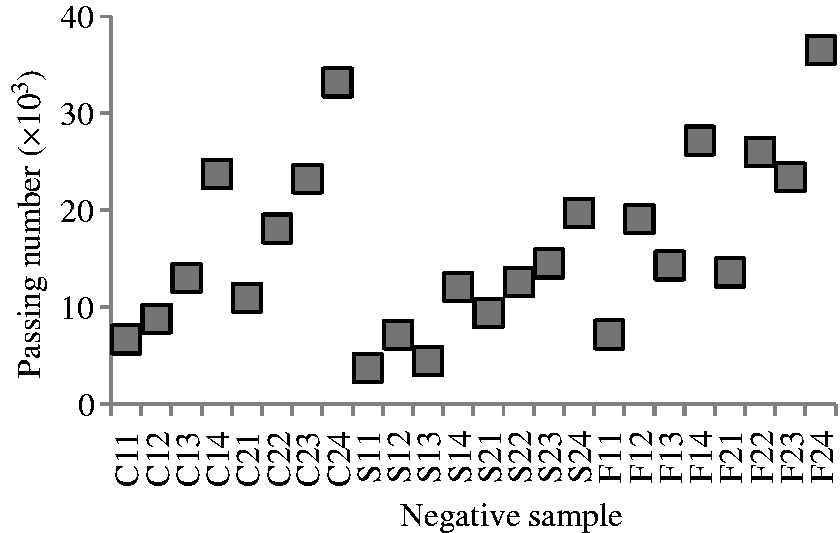
As shown, there is no negative sample passing through the queue that is composed of 40,000 sequential discriminators. From Figure 6 to Figure 7, the number of discriminators has been sharply reduced, although a perfect accuracy remains.
Next, discriminators are built and the queue set up for each type of the frictional signal. Then the size of the queue is increased by 5000 each time to find out the relation between the identified negatives and the number of progressive discriminators (Figure 8).
Identified negatives along the increasing number of progressive discriminators.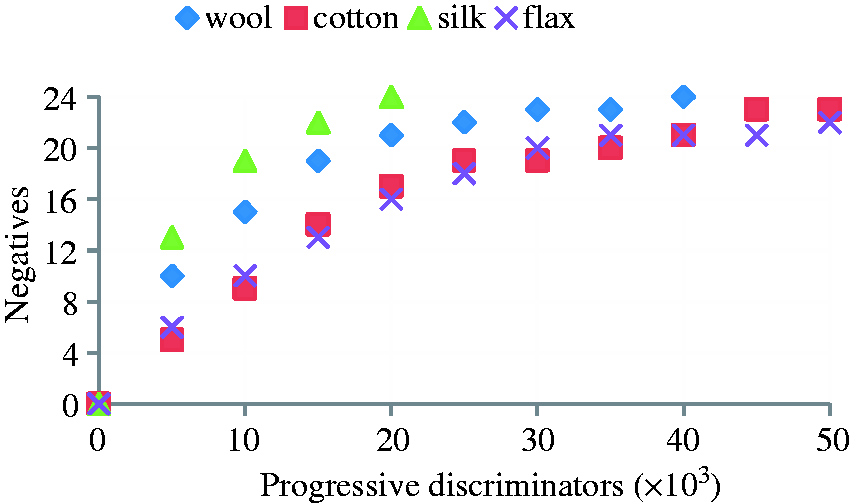
For wool, it takes 40,000 progressive discriminators to identify all the negatives. For silk, 20,000 progressive discriminators are capable of identifying all the negative samples. Overall, 45,000 progressive discriminators identify 23 cotton negatives and 50,000 progressive discriminators identify 22 flax negatives.
Results and discussion
Separability of data
The original data of frictional sound signals is handled with K-Means clustering to find out their separability under conventional manipulation. It is as shown in Figure 9.
The hierarchical tree of clustering.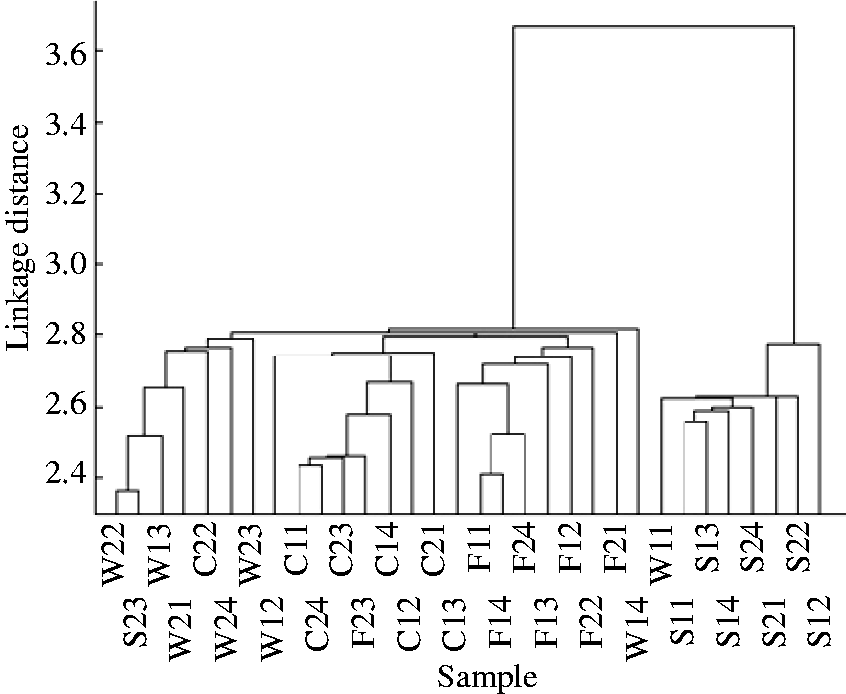
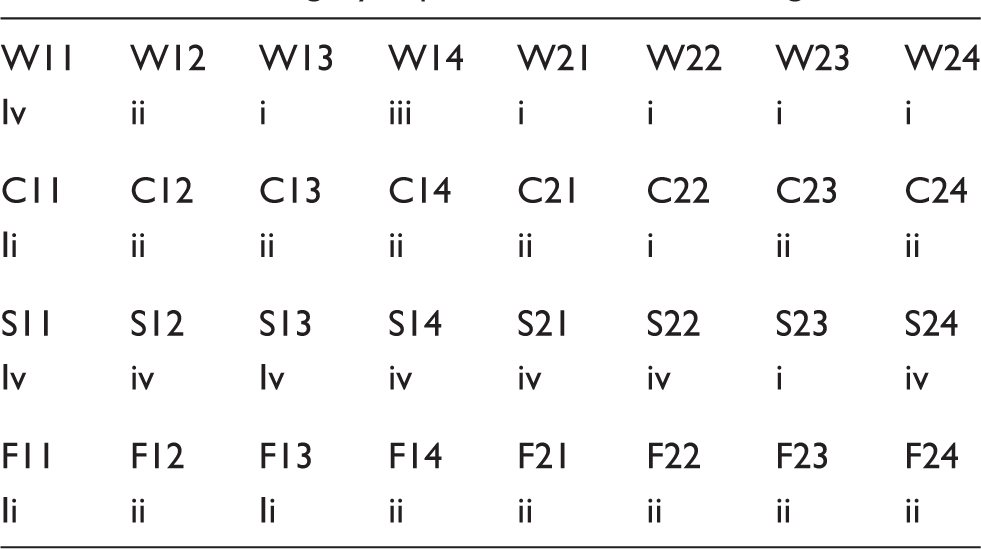
Four-category separation under clustering
Comparison of accuracy under clustering and progressive discriminators
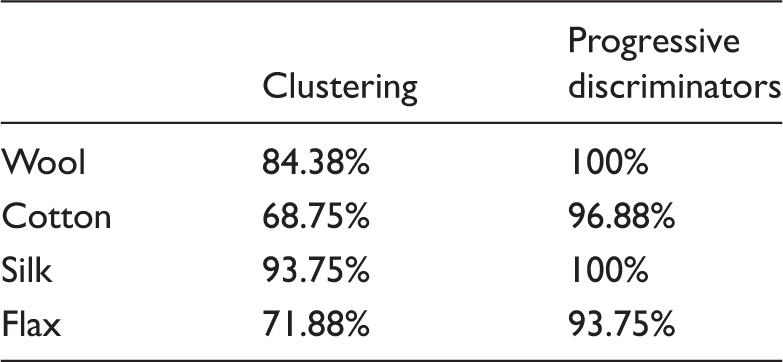
As shown in Table 2, the four-category separation under clustering is far from acceptable considering the true categories of the samples. The resulting accuracy of separation under the clustering and the progressive discriminators is listed below.
It is evident that the mechanism of progressive discriminators is superior to conventional clustering.
The improved Haar feature
In this study, the Haar features provide primary data for the discrimination mechanism. Furthermore, a kind of improved Haar feature is found to be capable of delivering more detailed data, thus differentiating the signals more efficiently. This improved Haar feature (denoted as F′) is calculated as a correlation coefficient between the intercept of the signal and the instance of the Haar wavelet.

Here, the function corrcoef represents the correlation coefficient. The improved Haar feature spaces corresponding to the conventional ones in Figure 4 are exhibited in Figure 10.
The improved Haar feature spaces. (a) Wool, (b) Cotton, (c) Silk and (d) Flax.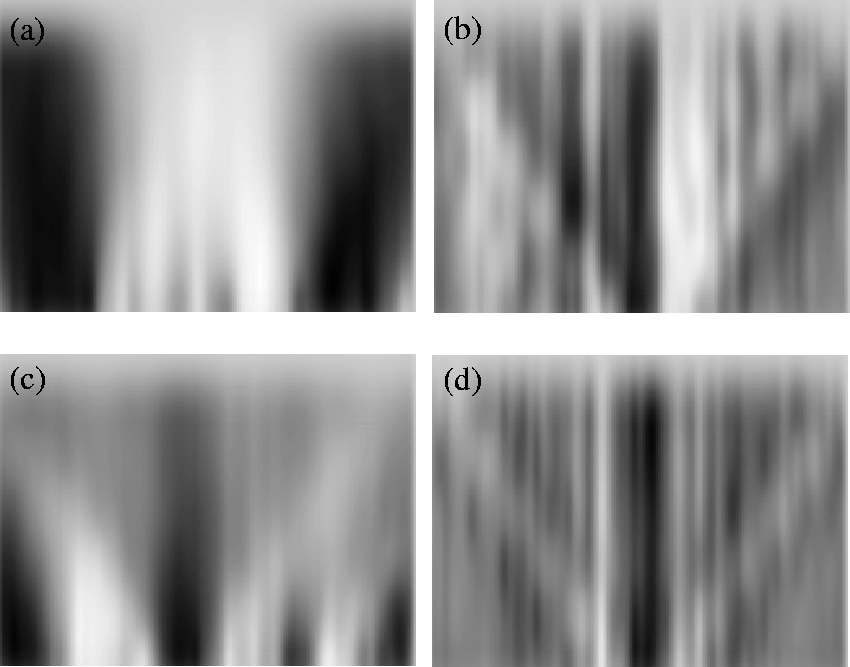
In comparison, the improved Haar feature spaces seem better at enhancing the details. It was found that the improved Haar features participating in progressive discriminators led to a reduced size of the queue, as shown in Figure 11.
Identified negatives with the improved Haar features.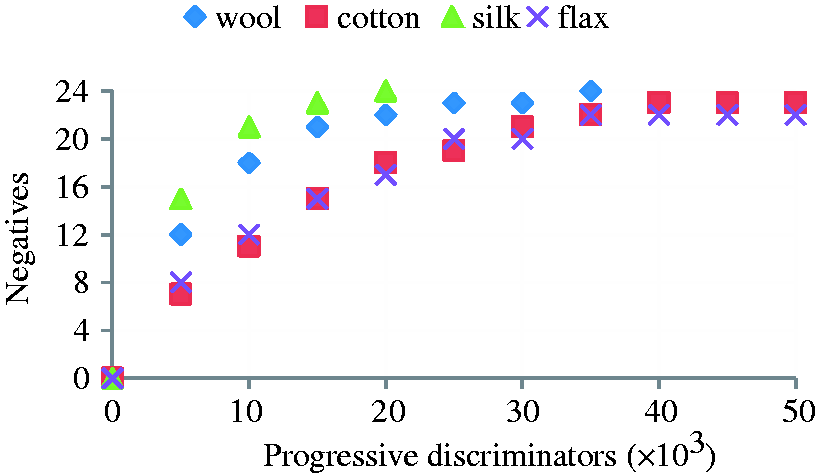
Compared with Figure 8, it is implied that involving the improved Haar feature does not help in improving the performance of discrimination. This is because the improved Haar feature is built upon the conventional version and does not provide additional but a condensed feature of the data. However, it is also suggested that the numbers of discriminators can be reduced with the improved version to promote the efficiency of discrimination.
With the improved Haar feature, 35,000 progressive discriminators, decreasing by 12.5% compared to the 40,000 discriminators indicated in Figure 8, can identify all the wool negatives. Now 40,000 discriminators identify 23 cotton negatives and 35,000 discriminators identify 22 flax negatives. Even for silk, whose discriminators are necessary to identify all negatives, still keeps 20,000; the discrimination ability of each size less than 20,000 has been promoted.
The enhanced discrimination
A discriminator is built for each point in the feature space. The threshold for the discriminator is determined in the way that all positive samples are allowed through and as many negative samples are declined as possible. While approving all the positives, a single discriminator has poor precision on the negatives. But a great many discriminators together can make a difference as they can gradually eliminate the negatives. A negative sample passing over millions of discriminators is rare.
The huge number of discriminators is inefficient as they introduce a heavy load on computation. Progressive discrimination has been put forward as a solution to select effective discriminators. By constantly adjusting the weights of the negatives, making the discriminator good at handling the last missed samples inclined to be selected, the number of discriminators is sharply reduced whereas the discrimination capacity remains.
However, the discriminators, whether queued or not, are not necessarily perfect. As indicated in Figure 8 and Figure 11, the 50,000 queued discriminators for each of cotton and flax fail to achieve perfect accuracy. In fact, the 64 million discriminators together could not reach 100% accuracy for these two categories because the eight samples are not sufficient to cover the exclusive features that distinguish the categories from each other. This can be solved by introducing more samples, as shown in Figure 12.
Improved discrimination ability with more samples.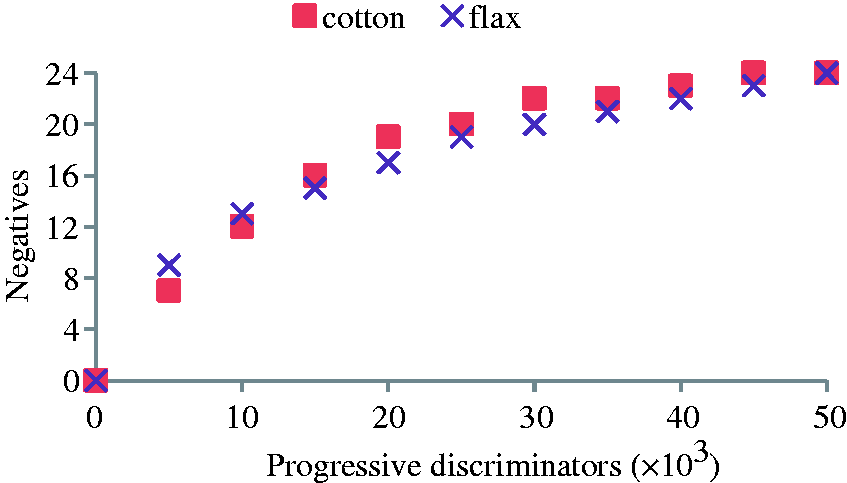
Eight more samples for cotton and flax are added separately; the two categories then can be clearly identified. In this situation, all cotton negatives can be denied by 45,000 progressive discriminators, and all flax negatives by 50,000 discriminators.
Effects of other factors
The main factors other than material involved are in the fabric count and the weave structure. It makes sense to reveal how these factors influence the discrimination performance. There are some clues to this issue suggested in Figure 7.
As observed, in all the negative wool samples, those with a low count are more likely to be declined at an early stage of the discrimination queue, whereas many of the high-count samples are declined at a later stage. In other words, the samples with a low count are easier to discriminate than those with a high count. Similarly, it is also suggested in Figure 7 that samples of plain weave are easier to examine than those of twill or satin weave.
To carry more conviction, the frequencies of low- and high-count samples distributed along the length of the queue are calculated respectively; the resulting histogram is shown in Figure 13.
The effect of fabric count on discrimination.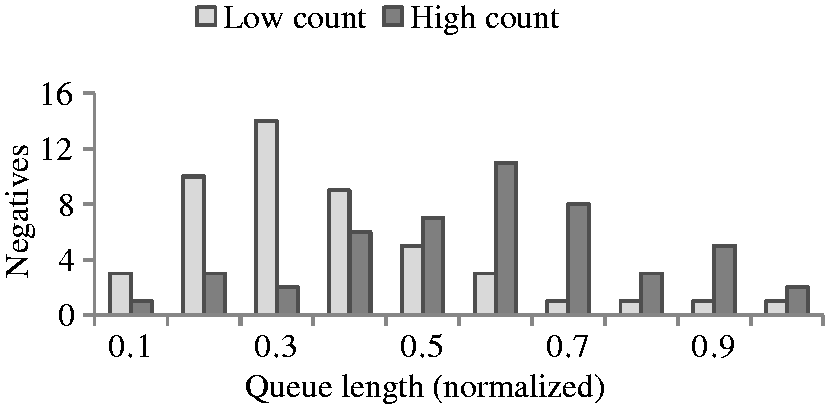
Here, the low-count samples refer to those of the first two count configurations in the material category, and the high-count ones refer to those of the last two. For each category there are 24 negatives: 12 low- and 12 high-count samples. Thus, there are 96 negatives of all four categories, including 48 low-count samples and 48 high.
As indicated in Figure 13, the low-count samples concentrate the distribution in 0.3, whereas the high-count ones are distributed mainly in 0.6. Thus, there is clear evidence that the fabrics of low count are easy to discriminate with this mechanism compared to those with a high count.
Likewise, the frequencies of different weave structures can also be calculated to uncover the effect of weave structure on discrimination, as illustrated in Figure 14.
The effect of weave structure on discrimination.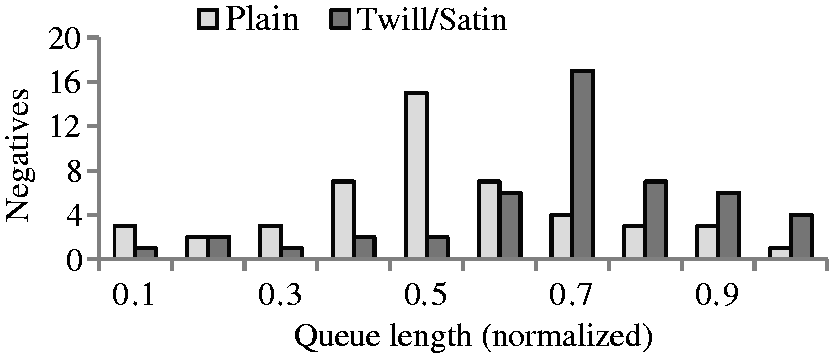
According to the figure, the plain weave samples concentrate in about 0.5, and the twill/satin samples are centered around 0.7. Therefore, the fabrics of plain weave are easier to discriminate than those of twill and satin weave.
Conclusion
This endeavor explores the classification of fabric’s frictional signals with discriminators built upon Haar features. The discriminators on the improved Haar features are more effective than those on the conventional version. The discrimination queue derived from progressive selection is neat and efficient compared to the unordered discriminators, which are complete but enormous in number. It was found that the fabric frictional signals in the form of Haar feature spaces are classifiable into their material categories, providing plenty of samples are involved. The findings of this study have proved that fabric frictional sounds are separable according to their material categories and can be expected to play an important role in the challenging issue of identifying fabric materials by their sounds.
Footnotes
Declaration of conflicting interests
The authors declared no potential conflicts of interest with respect to the research, authorship, and/or publication of this article.
Funding
The authors disclosed receipt of the following financial support for the research, authorship, and/or publication of this article: This work is supported by the Initiative Research Foundation of Shaoxing University (20185006), and the Scientific Research Foundation of Zhejiang Sci-Tech University (18012107-Y).