



Abstract
Fabric surface properties are significant in terms of fabric handle, sensorial comfort, aesthetic and performance properties. Yarn properties are among the most important parameters that affect fabric surface properties. Besides, fiber type, fiber properties and spinning technology etc. directly affect the physical, mechanical and performance properties of yarns as well as fabric surface properties. In the scope of this study, effects of fiber type (raw material), fiber fineness and fiber length on the surface properties of fabrics were investigated. Also, properties of yarns were measured and their effects on fabric surface properties were analyzed. For this purpose, unevenness, optical unevenness, imperfections, structural properties (diameter, density, roughness and shape), hairiness and frictional properties of yarns were measured, and relationships between abrasion resistance, pilling and frictional properties of knitted fabrics were examined. Regression models were developed in order to predict fabric surface properties from yarn characteristics. Based on comprehensive data analysis, it was concluded that variation in yarn friction and yarn hairiness explains approximately 80–85% of fabric-to-fabric and fabric-to-skin (gazelle skin) friction coefficients. Furthermore, positive correlations between yarn hairiness and weight loss, and yarn hairiness and thickness change after abrasion test, were observed. Additionally, a new parameter, the optical contact index (OCI), based on an image analysis method, was suggested to determine the surface properties and roughness of fabrics. Relationships between the OCI and other tested fabric surface properties were statistically analyzed. Statistical analyses showed that high correlations exist between the new parameter and fabric friction and abrasion resistance at the 0.05 significance level.
Keywords
Fabric surface properties are crucial, because they are directly related to many properties of fabrics. As it is known, surfaces of fabrics are not completely smooth. They have regular and irregular roughness depending on both yarn characteristics and fabric properties. Yarn properties such as unevenness, hairiness, friction, roughness, shape, diameter, density, spinning technology and the raw material, and fabric properties such as fabric type and knitting structure, are the most important parameters that should be taken into consideration during the analysis of fabric surface properties. In recent years, with the increasing importance of comfort perception and fabric handle, many researchers have been dealing with the analysis of fabric surface properties.1–13 Moreover, image analysis methods have been used to determine different properties of yarns and fabrics. Objective evaluation of fabric surface properties is an area where image analysis methods are used.14–20
Ajayi and Elder 1 compared the relationship between yarn-to-yarn (YY) and fabric-to-fabric friction. They concluded that the coefficients of friction of fabrics are greater than those of their component yarns, and that yarns with higher frictional properties yield fabrics whose frictional properties are also higher. In another study, Ajayi and Elder 2 examined the relationships between fabric friction, handle and compression. The results showed that higher fabric compression causes larger difference between static- and kinetic-friction forces. Rankumar et al. 3 examined the influence of structural variables on the frictional properties of 1 × 1 rib-knitted cotton fabrics. The results indicated that both the loop length and the yarn linear density influence the fabric-to-fabric frictional properties; they defined a new frictional constant (K) and established an empirical relationship between the K and structural variables. Bertaux et al. 7 investigated the relationship between friction and the tactile properties of woven and knitted fabrics, and found high correlations between friction and tactile properties for knitted fabrics. They emphasized that other parameters such as hairiness, bending, unit weight and thickness play important roles in these relationships. Xu et al. 13 developed a new profilometer to assess fabric smoothness appearance by using laser triangulation and image processing techniques. They found that there is a high correlation between the results of subjective tests and parameters obtained from the new profilometer. Ravandi and Ghane 14 analyzed fundamental factors affecting fabric surface protrusion. The results indicated that the protruding yarn density is strongly influenced by the associated yarn-yarn interaction at the crossing points and yarn spacing. They stated that there is high correlation between the normal load, yarn spacing and protruding yarn density. Semmani et al. 19 focused on measuring the roughness of weft-knitted fabrics using a non-contact method. The results obtained from the image analysis were compared with mean absolute deviation of surface roughness (SMD) values measured by the Kawabata method. They found strong and negative correlation between fabric roughness values measured by the two different methods. Moezzi et al. 20 analyzed the effect of unevenness of weft yarns on asperities on surfaces of woven fabrics by the image analysis method. It is concluded that an increasing amount of irregularity and <50% thick places cause an increase in the count of asperities on fabric surface. In addition, the relationship between the parameter angular power spectrum, defined by the image analysis method and <50% thick places, was found to be fairly strong.
This study aimed to analyze fabric surface properties and the effects of yarn characteristics on surface properties. For this purpose, single jersey and interlock fabrics were systematically produced from natural, regenerated and synthetic yarns. Yarn properties and fabric surface properties were measured by some objective test methods. Regression models were developed to predict fabric surface properties from yarn properties. Furthermore, the surface properties of fabrics were analyzed by using image analysis, and correlations between the parameter obtained from image analysis method and other tested fabric surface properties were statistically analyzed.
Materials and methods
Materials
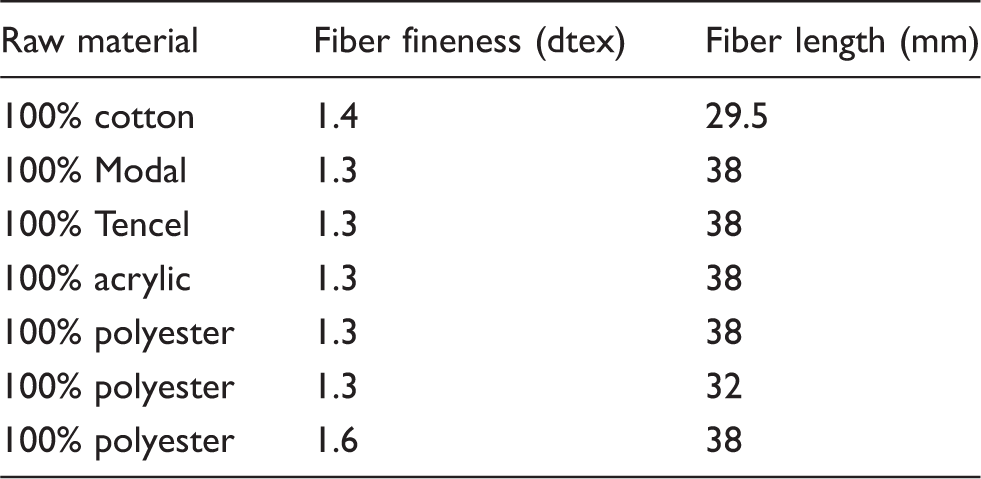
Structural properties of raw materials
Structural properties of fabrics
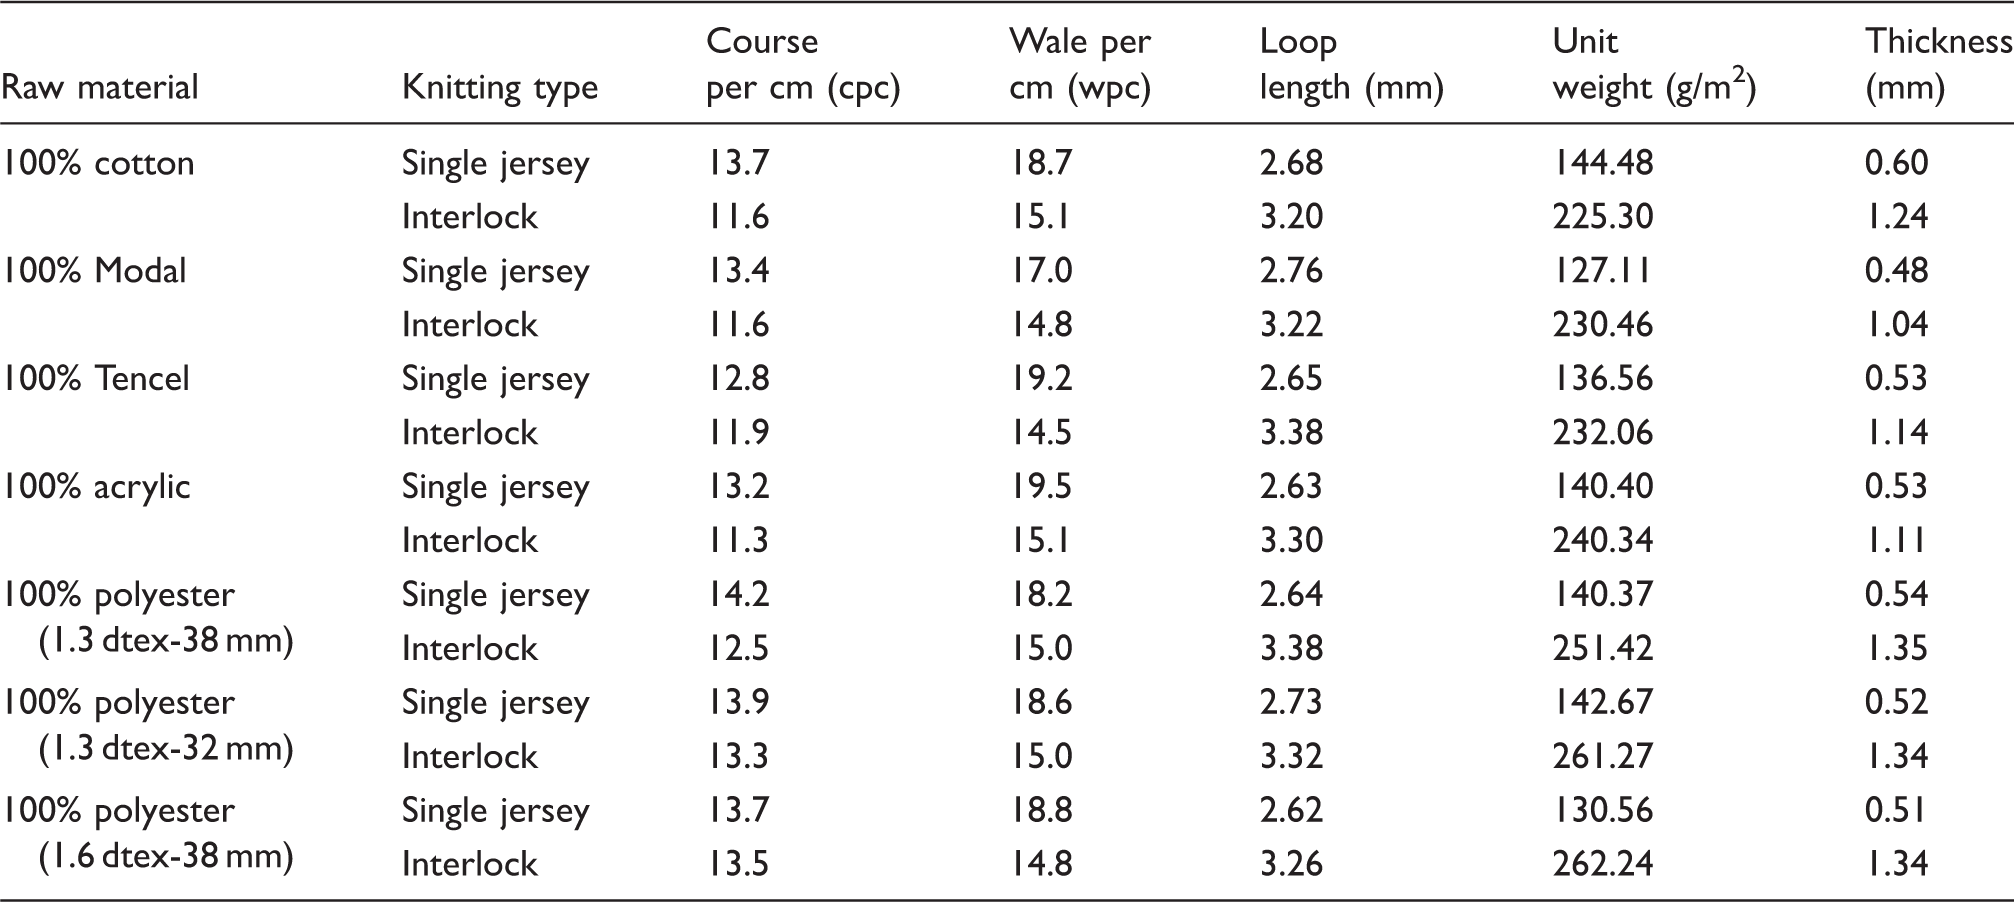
In order to avoid any change in the surface properties of yarns and fabrics, treatments (such as waxing, bleaching or dyeing) were not applied to yarns or fabrics before and during their production.
Methods
Measurement of yarn properties
The unevenness, optical unevenness, imperfections and other structural properties (diameter, density, roughness and shape) of yarns were measured by an Uster Tester 5 S800 considering ASTM (American Society for Testing and Materials) D1425/D1425M-14. 21 Yarn hairiness properties were measured by an Uster Tester 5 S800 (UT5) and an Uster Zweigle Hairiness Tester 5 (UZHT5), with 5 cN pretension considering ASTM D5647-07. 22 The hairiness value obtained from the UT5 is called H and the hairiness values obtained from UZHT5 are called S3 and S1 + 2. While the H value represents the total length of protruding hairs per centimeter, the S3 value is the sum of all protruding fibers ≥3 mm (cumulative) and S1+2 value is the total amount of the fibers <3 mm.23,24
Measurement of YY, yarn-to-metal (YM) and yarn-to-ceramic (YC) friction were performed according to ASTM D3108/D3108M-1325 and ASTM D3412/D3412M-1326 by Lawson Hemphill CTT, and the Capstan method was used for all surfaces. In this study, the YY, YM and YC tests were performed by using 5 cN input tension, which is within the specified range for knitted fabrics27,28 and is also equal to pretension in UZHT5.
Measurement of fabric properties
Friction attachment, which is adaptable to a tensile tester, was used for the measurements of fabric-to-fabric and fabric-to-skin friction. During the fabric friction measurements, five test specimens were tested both in wale and course directions. Face sides of specimens were tested with a speed of 50 mm/min for 3 minutes test duration. Normal load was selected as 1.2 g/cm2, and kinetic and static friction coefficients (µk and µs) were calculated by using frictional forces. For fabric-to-material friction tests, gazelle skin was used as material. The average roughness value (Ra) of gazelle skin was measured as 23.44 µm by an Ambios XP-2 high resolution surface profilemeter. The average roughness value of gazelle skin is within the roughness value range for human skin, as specified by Derler and Gerhardt. 29
Abrasion resistance and pilling tendency tests were performed by a James H. Heal Nu-Martindale Abrasion and Pilling Tester. Five fresh specimens were tested for both abrasion resistance and pilling tests. The weight losses (mg) and changes of thickness (mm) of the samples were calculated at the end of 15000 cycles to measure the abrasion resistance of the fabrics considering ISO 12947-3:1998. 30 Pilling tendencies of fabrics were determined in accordance with ISO 12945-2:2002. 31 In this method, ratings for samples tested were determined by comparing standard photographs. In this standard, a 1–5 rating scale is used, where ‘5’ indicates that there is no visible change and ‘1’ indicates intensive pilling on the whole surface of the fabric.
In this study, an image analysis method was also used to examine roughness and surface properties of the fabrics. Images of fabrics were captured by a digital camera integrated to a microscope (Olympus BX43) with a 10× magnifying lens. The image capturing system and steps of image analysis are shown in Figure 1. Figure 1(a) shows the captured image of fabric without a light source. In the second step, images were captured with a light source-emitting stationary light-emitting diode light beam (Figure 1(b)) to obtain more detailed surface images appropriate for digital processing. These images were converted into gray-level images (Figure 1(c)) and binary images (Figure 1(d)), respectively, by using the Matlab image processing toolbox. The aim of this process was to determine asperities of the fabric surface. Asperities cause roughness and occur contact points. A new parameter called the optical contact index (OCI), which is based on the image analysis method, was suggested to determine the surface properties of fabrics within the context of study. OCI was calculated by using a suitable threshold value, which is the same for all images. The value of the pixels higher than the defined threshold value was converted into white pixels and lower ones were converted into black pixels using the Otsu method.
32
In binary images, white pixels represented contact points (asperities) and black pixels represented non-contact points. Finally, the OCI (%) was calculated as the ratio of white pixels to the total pixels of the image.
33
Image capturing system and steps for determining the optical contact index by image analysis.
Results and discussion
Yarn properties
Structural properties, hairiness and friction coefficient values of yarns*

SDs are given in parentheses.
Capstan method was used for yarn friction tests on all surfaces.
As a result of the statistical analyses, it is concluded that the effect of the raw material is statistically significant for hairiness and the structural and frictional properties of yarns. When the capacitive and optical unevenness values of yarns with the same fiber fineness (1.3 dtex) and same cut length (38 mm) are examined, it is seen that polyester yarns have the highest values and Tencel yarns have the lowest values. When Uster statistics are examined, polyester yarns have higher values for the capacitive irregularity values of yarns produced from fibers having the same fineness and length. Since all raw materials have the same linear density (1.3 dtex), the measured values are different from each other even though the calculated theoretical limit irregularity values of all yarns are the same (CVlim% = 8.06). The reason is that yarn irregularity is also influenced by other fiber properties such as friction, bending and static electricity, as well as fiber length and strength.34,35 Acrylic yarns have the highest diameter values while Tencel yarns have the lowest. Acrylic yarns have the minimum density (g/cm3) and roughness (CV FS %-CV for fine structure of the yarn surface) values. The shape (roundness) values of tested yarns are close to each other and these values range from 0.84–0.86. For both hairiness devices, the highest hairiness values were measured for Tencel yarns and the lowest for polyester yarns. It is seen that the highest sH (SD of hairiness) values belong to acrylic yarns and the lowest sH values belong to polyester yarns, and it is observed that polyester yarns have the lowest YM and YC, and the highest YY, friction coefficient values.
ANOVA (analysis of variance) results showed that the effects of fiber fineness and length are statistically significant for all properties of polyester yarns. It is possible to say that yarns produced from thinner and longer fibers have lower unevenness, roughness, hairiness and friction values, in accordance with earlier studies.36–41 While the highest capacitive unevenness values belong to 1.6 dtex-38 mm polyester yarns, the highest optical unevenness, roughness, yarn hairiness, and YY and YM friction values belong to polyester yarns produced from 1.3 dtex-32 mm.
Surface properties of fabrics
Fabric-to-fabric and fabric-to-skin friction coefficients
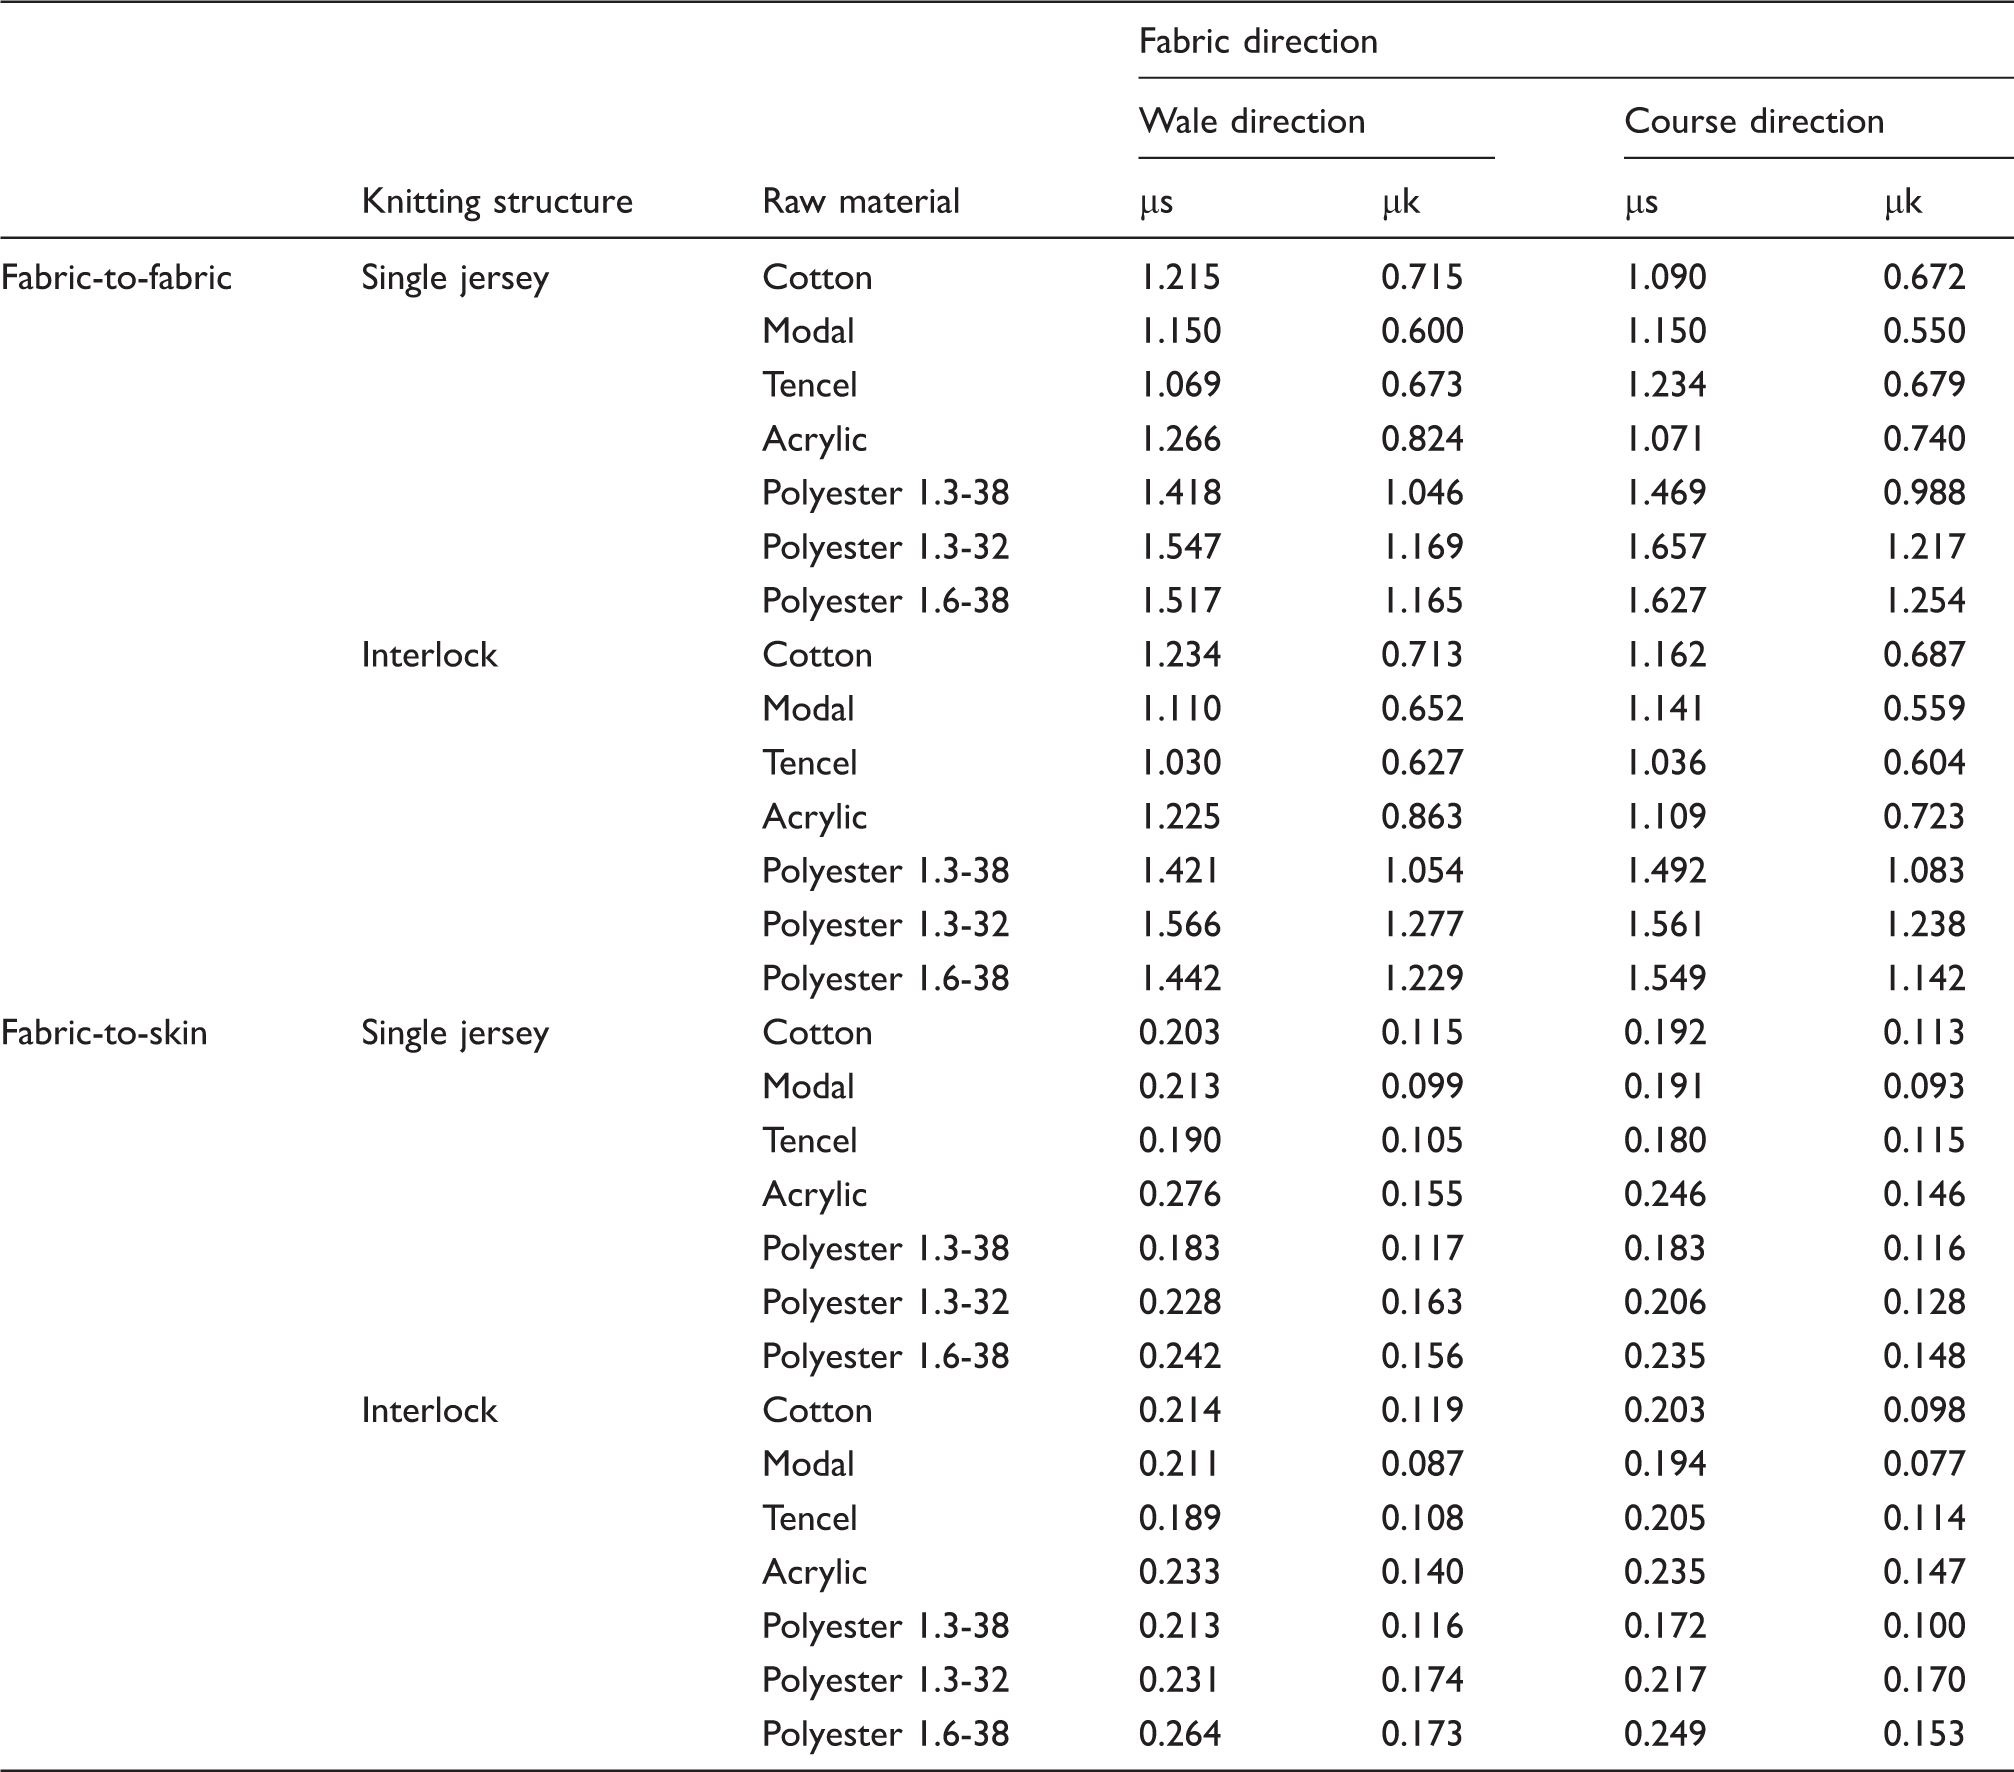
Fabric-to-fabric static friction coefficients range from 1.03–1.49, while values of fabric-to-fabric kinetic friction coefficients range from 0.60–1.05 for the single jersey and interlock-knitted fabrics produced by ring-spun yarns made of the same linear density (1.3 dtex) and fiber length (38 mm) (Table 4).
When the effect of raw material is examined, it is seen that 100% polyester fabrics have the highest fabric-to-fabric kinetic and static friction coefficients for both knitting structures. In addition, it is remarkable that values of kinetic friction coefficients for fabrics with the same raw materials and different knitting structures are very close to each other, and that the results are parallel for both knitting structures. Values of fabric-to-fabric static friction coefficients range from 1.09–1.23 and values of fabric-to-fabric kinetic friction coefficients range from 0.67–0.72 for 100% cotton fabrics, which were used as a reference. Values of fabric-to-skin static friction coefficients of polyester, acrylic, Tencel and Modal fabrics range from 0.17–0.28, while values of fabric-to-skin kinetic friction coefficients range from 0.08–0.15 (Table 4). Values of static and kinetic friction coefficients for 100% cotton fabrics are between 0.19–0.21 and 0.10–0.12, respectively. When the results are examined, it is seen that fabric-to-fabric friction test results are generally parallel to YY friction test results, and that fabric-to-skin friction test results are in line with YM friction test results. A higher variation in fabric friction can be explained by the fact that the behavior of yarns in the fabric structure differs from the behavior of single yarns. It is thought that the yarn intersections that occur during the fabric formation may influence the fabric friction results. This situation is observed more clearly because of the fabric interaction during the fabric-to-fabric friction. The reason for getting lower fabric-to-skin friction coefficients than fabric-to-fabric friction coefficients could be the fairly low roughness value of the gazelle skin surface used as material. Literature shows that rubber, polymeric materials and wood etc. are used as material in fabric-to-material friction tests and results vary over a large scale.42–47 Moreover, results show that 100% acrylic fabrics have the highest kinetic friction coefficients while 100% Modal fabrics have the lowest for both directions (wale and course) and both structures (single jersey and interlock). Fabric-to-fabric and fabric-to-skin static and kinetic friction coefficient values and 95% confidence interval plots of knitted fabrics are given in Figure 2 and Figure 3. Results showed that the effect of raw material is statistically significant for fabric-to-fabric and fabric-to-skin friction (p < 0.05). In addition, it is observed that fabrics made of synthetic yarns have the highest values, whereas fabrics made of regenerated yarns have the lowest values for both knitting structures and frictional surfaces.
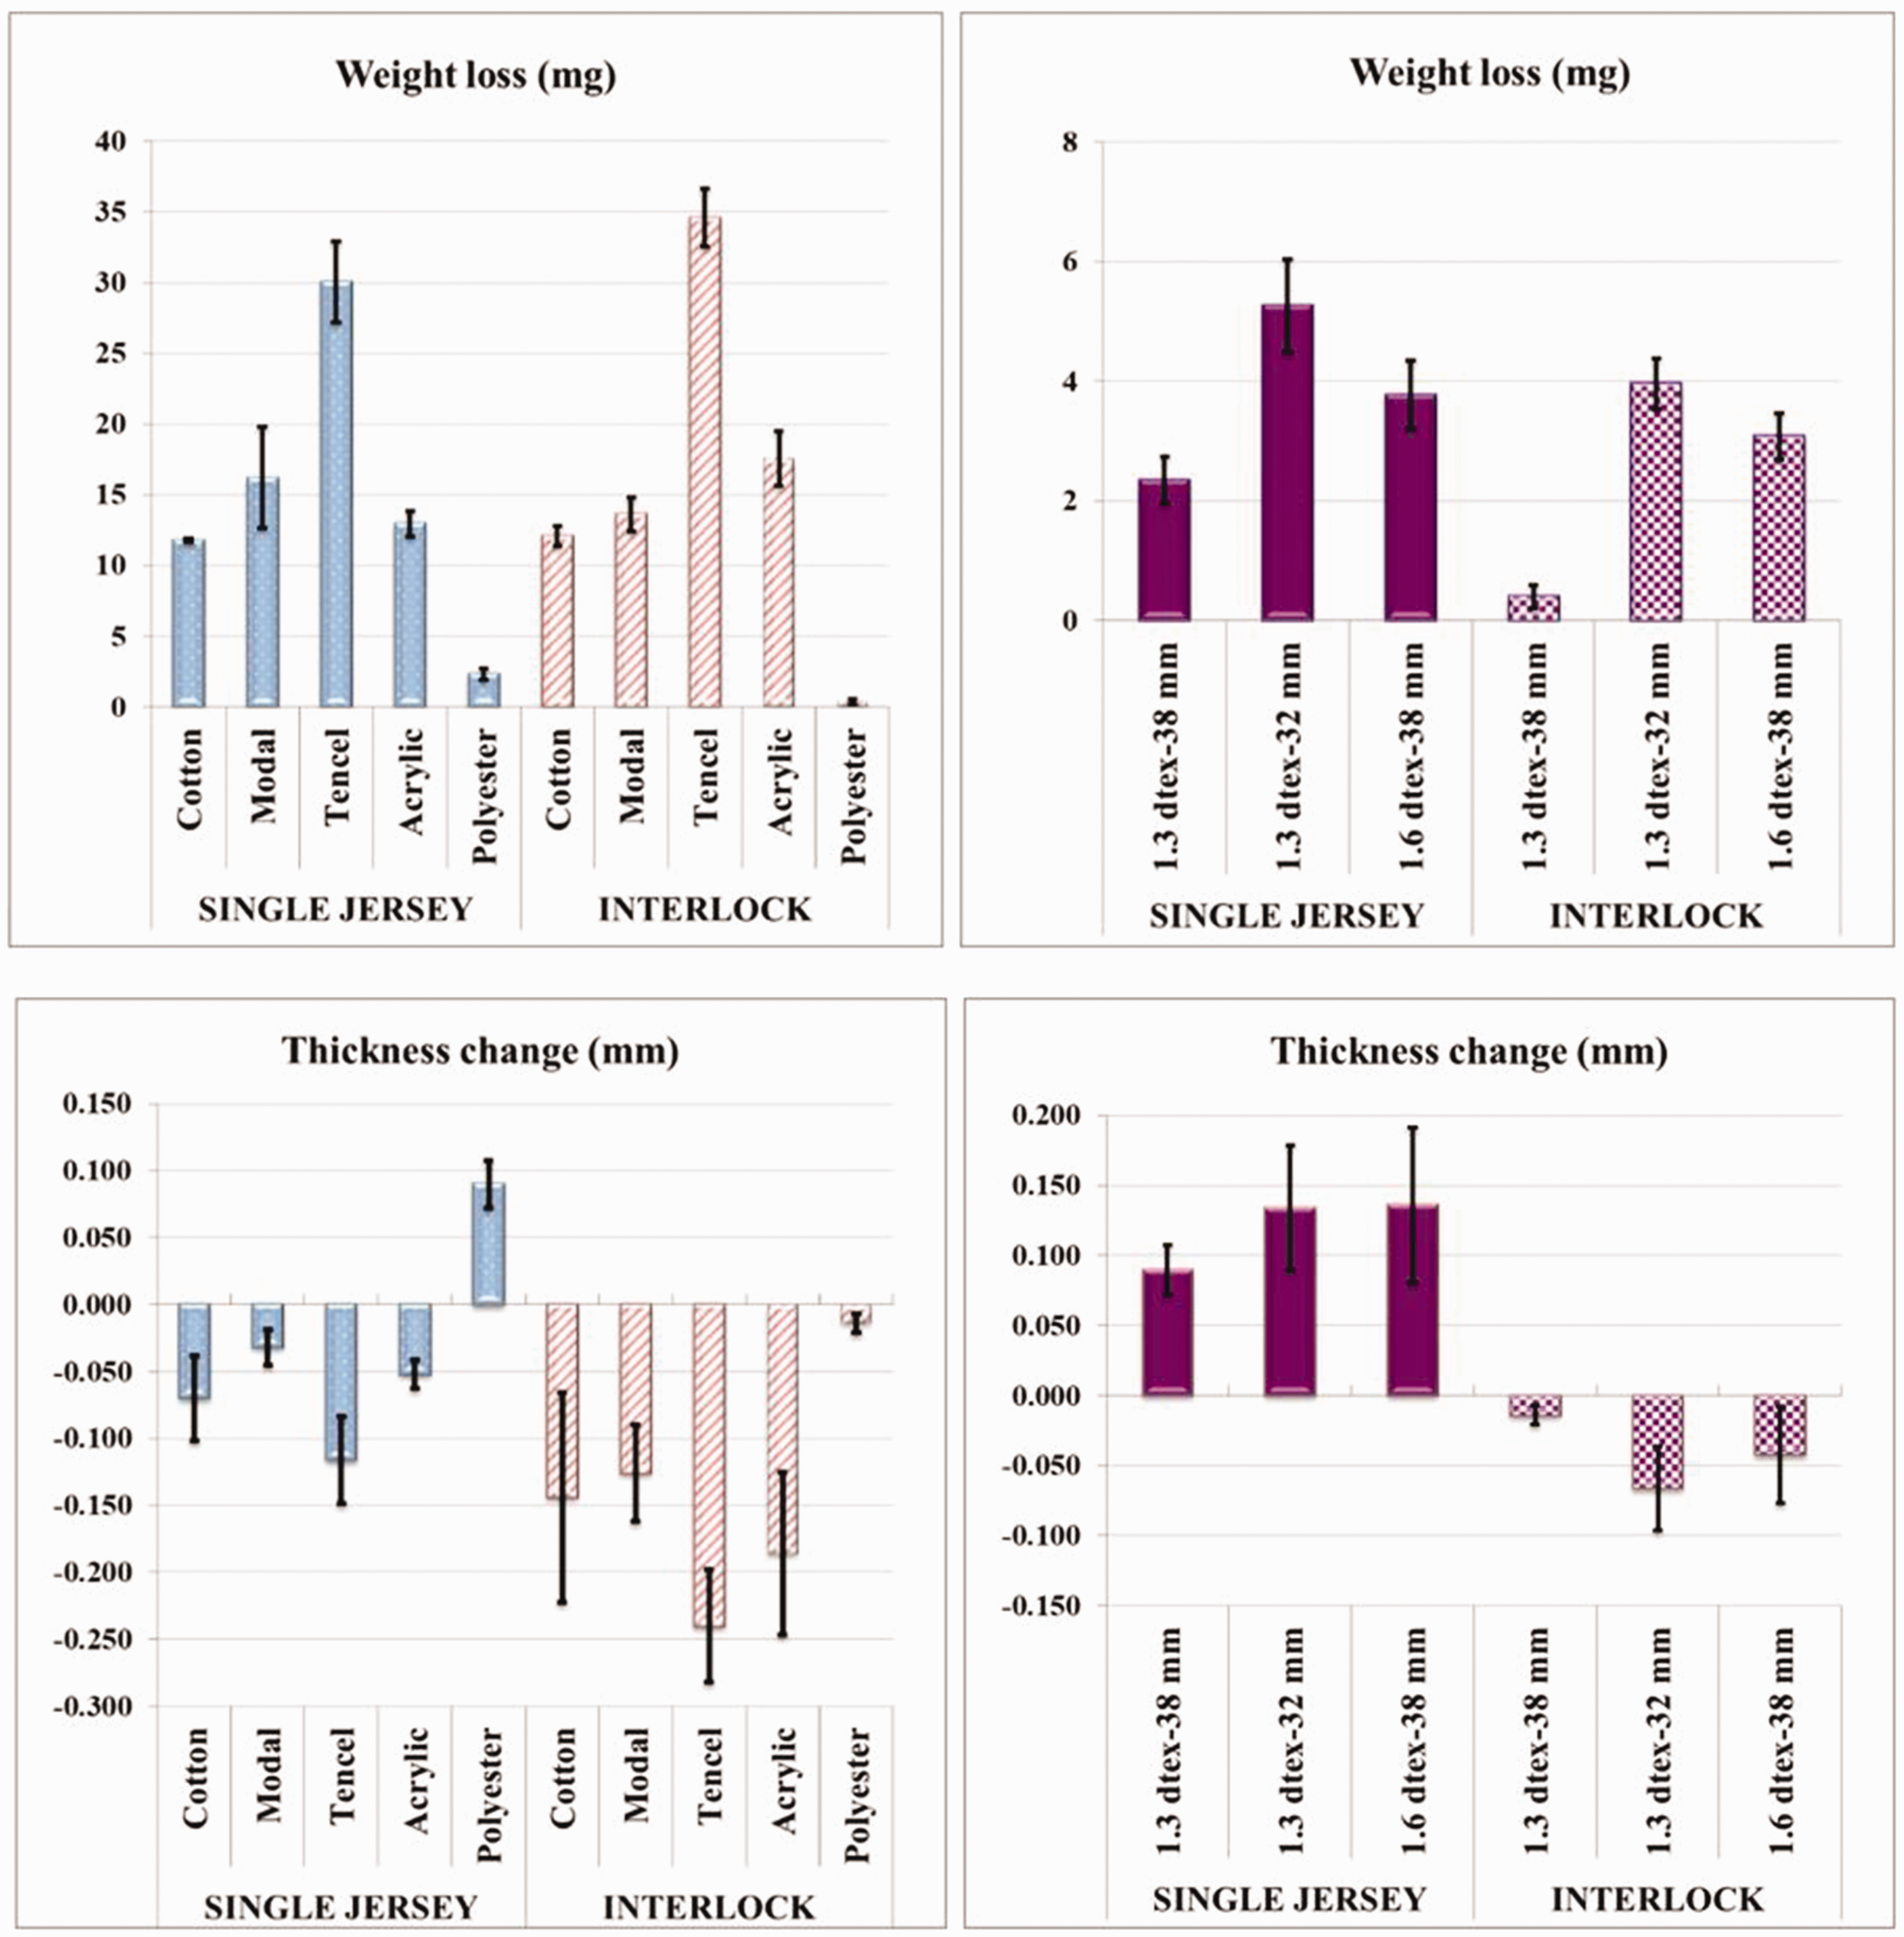
Coefficients of fabric-to-fabric friction and 95% confidence intervals. Coefficients of fabric-to-skin friction and 95% confidence intervals. Weight loss (mg) and thickness change (mm) values, and 95% confidence interval. Minus values indicate a decrease in thickness.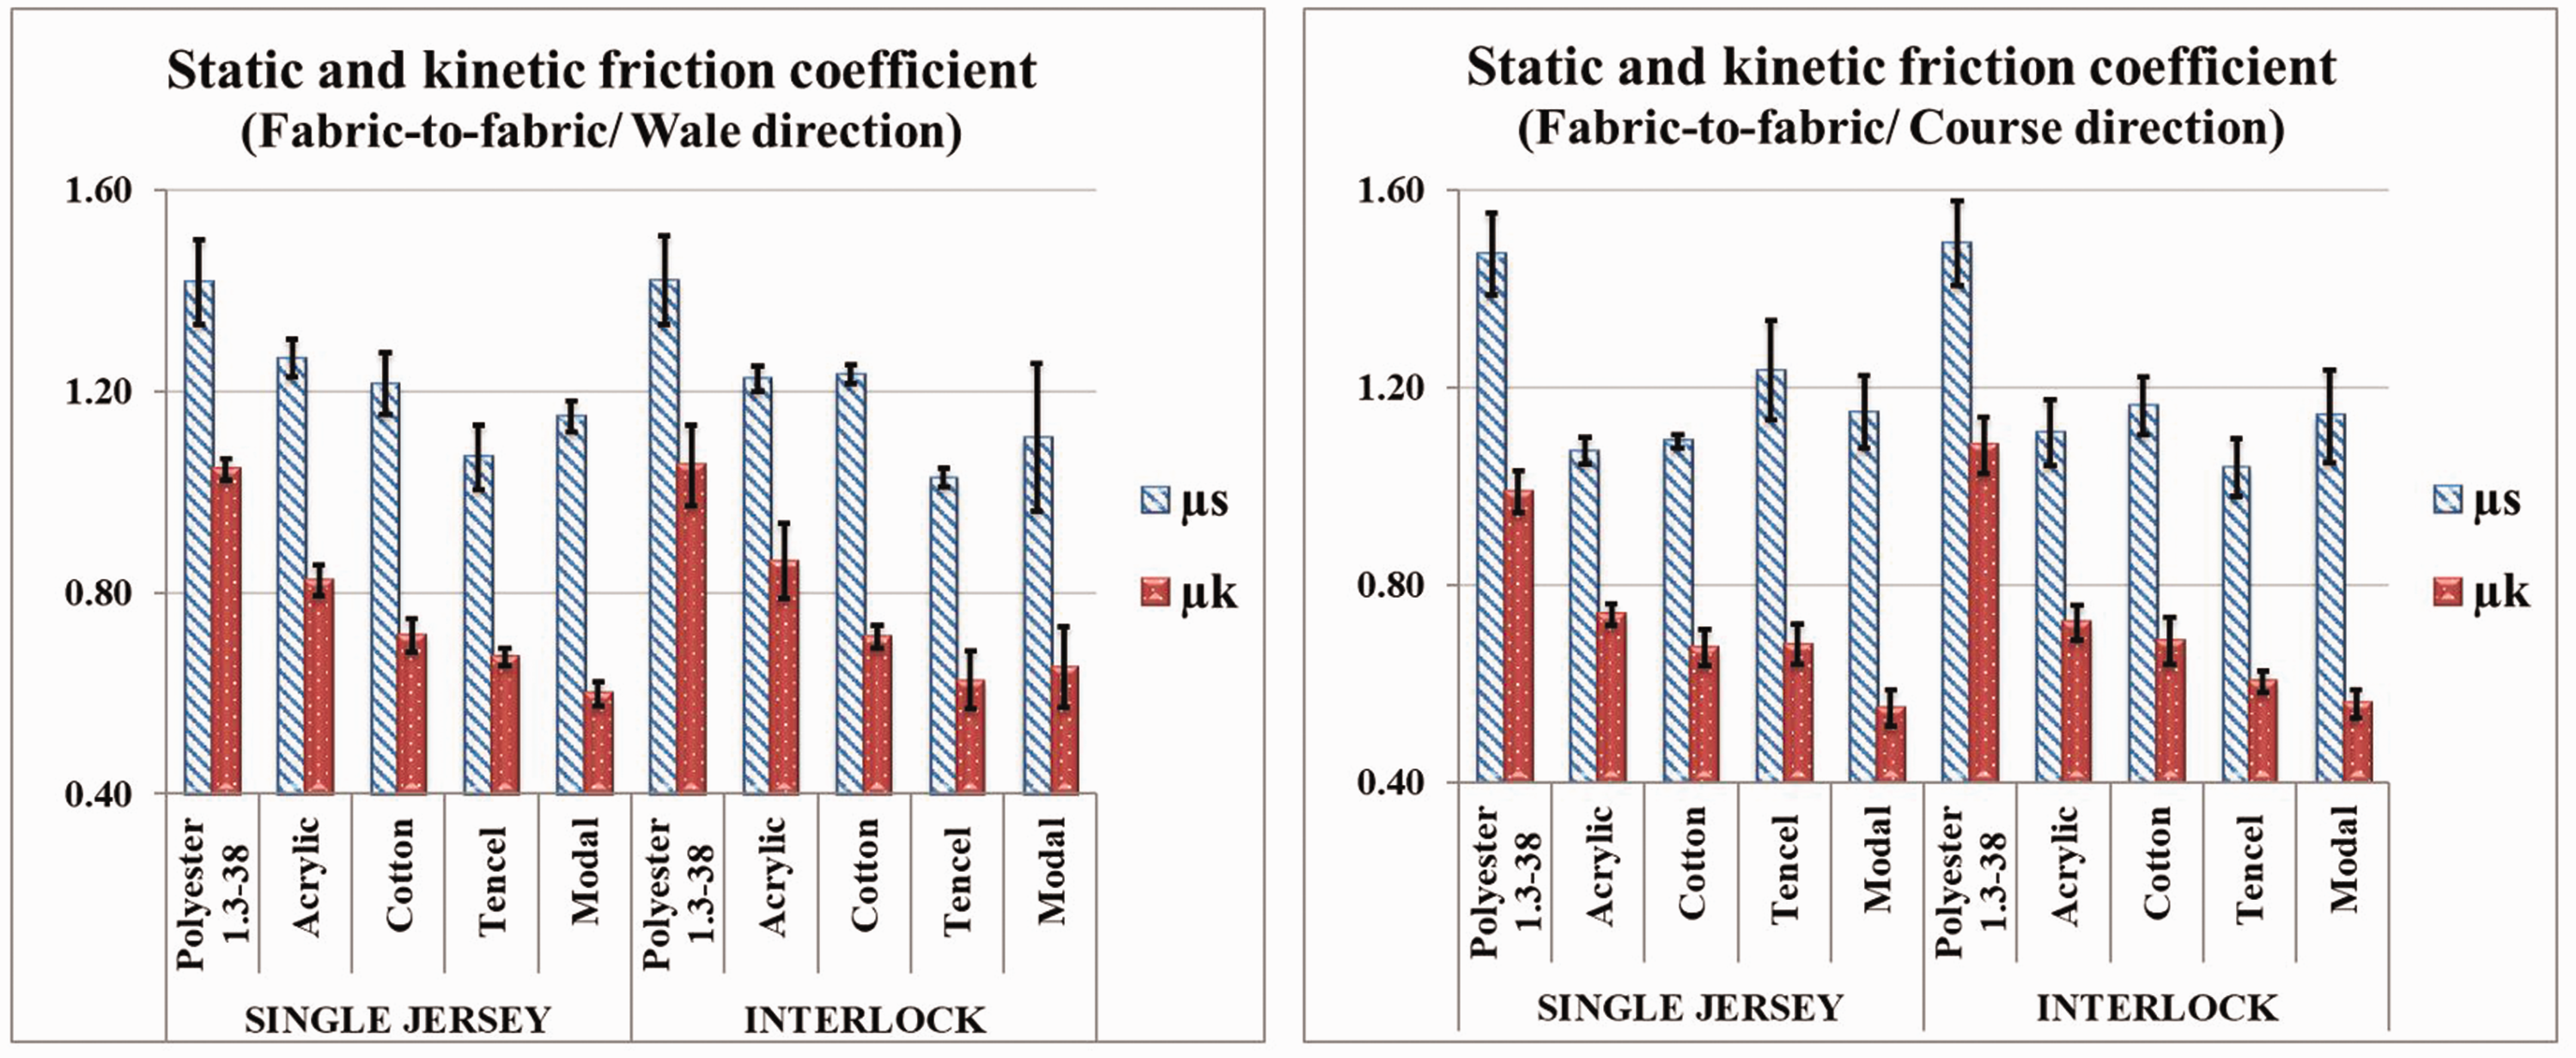

Results showed that the fabric-to-fabric kinetic friction coefficients vary between 0.99 and 1.28, while the fabric-to-skin kinetic friction coefficients vary between 0.10 and 0.17 for polyester fabrics with different fiber lengths and fiber fineness. As in the case of yarn friction, the lowest values for fabric friction belong to fabrics containing polyester fibers of 1.3 dtex-38 mm. Statistical analyses showed that fiber fineness and fiber length have statistically significant effects on both fabric-to-fabric and fabric-to-skin friction (p < 0.05).
The abrasion resistance of fabrics is not only one of the most important surface properties, but is also crucial for fabric performance. Abrasion affects the appearance of the fabric by creating some physical changes and it also triggers significant loss of fabric strength. In this study, the weight loss (mg) and fabric thickness change (mm) after 15000 cycles of abrasion resistance testing were evaluated. ANOVA results showed that the effects of raw materials are statistically significant for both weight loss and fabric thickness change values for both of the knitting structures (p < 0.05). Weight loss (mg), thickness change (mm) values and 95% confidence interval graphs are given in Figure 4. The 100% Tencel fabrics have the highest weight loss values, whereas 100% polyester fabrics have the lowest for both knitting structures. A possible reason for this situation could be the higher tenacity of polyester fibers. Moreover, the more hairy structure of Tencel yarns could be the reason for the higher weight loss of fabrics made of these yarns. The change in fabric thickness after the abrasion test was the highest for 100% Tencel and the lowest for 100% polyester for both single jersey and interlock fabrics. In polyester fabrics, a small number of fibers is removed from the surface due to the high abrasion resistance, therefore the fabric thickness has slightly changed. In the fabrics produced from Tencel yarns, due to high yarn hairiness, more fibers are removed from the fabric structure and the change in thickness is greater. When the weight loss and thickness change values of the fabrics produced from polyester fibers with different linear densities and fiber lengths are examined, the lowest values belong to fabrics produced from 1.3 dtex-38 mm polyester fibers for both fabric structures, and the effect of fiber fineness and fiber length is statistically significant (p < 0.05).
Pilling ratings of the fabrics

In the scope of this study, the term OCI was defined via the analysis of fabric surface images and was suggested to objectively determine fabric surface roughness properties. In Figure 5, binary images of fabrics having different OCI values are shown. OCI mean values of fabrics are given in Table 6. As seen in Table 6, Tencel fabrics have the highest OCI values while polyester fabrics have the lowest for both knitting structures. The ANOVA results showed that differences between the OCI values of the fabrics produced by yarns made of the same fiber fineness and lengths are statistically significant for both knitting structures (p < 0.05). For polyester fabrics, fiber length has a statistically significant effect on OCI values (p < 0.05) and the highest OCI values belong to fabrics that is made of 1.3 dtex-32 mm fibers for both knitting structures.
Binary images of fabrics with different optical contact index values. Optical contact index mean values of the fabrics and p values of analysis of variance

Pearson correlation coefficients of optical contact index values and measured surface properties of fabrics
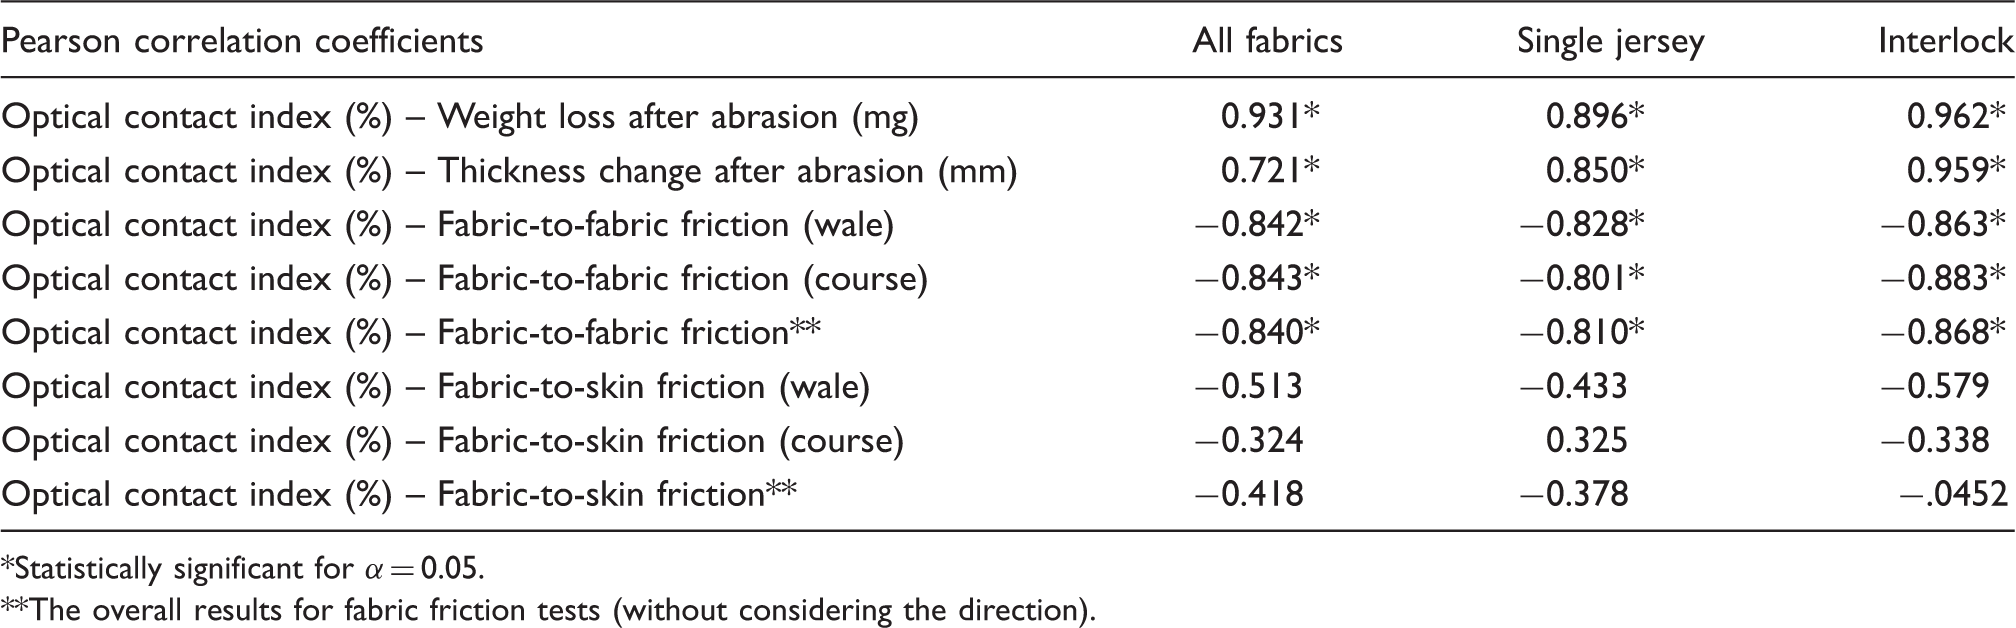
Statistically significant for α = 0.05.
The overall results for fabric friction tests (without considering the direction).
The relationship between the OCI parameter and the abrasion resistance of fabrics and fabric-to-fabric kinetic friction values are shown in Figure 6 and Figure 7. There is strong positive correlation between the OCI and weight loss values after 15000 turn abrasion testing for single jersey and interlock fabrics. However, negative correlation was found between OCI and fabric-to-fabric kinetic friction values for wale and course directions, and for both knitting structures. The negative relationship between the OCI values and the fabric-to-fabric friction coefficient can be explained by the number of stick-slip movements and the contact area formed during the friction tests. As the OCI values increase, the contact area (surface area) increases and the number of stick-slips that occur during friction tests under low loads decreases (Figure 5). With the increase of the contact area, the load per unit surface (normal load, gf/mm2) will decrease and therefore a reduction in the coefficient of friction will occur. OCI values represent the protruding regions (asperities) on the fabric surface. When an evaluation is made in terms of abrasion, these regions cause weight loss with mechanical effect under the applied loads. For this reason, there is a positive and strong relationship between weight loss values and OCI values.
Relationships between optical contact index and other surface properties for single jersey fabrics. Relationships between optical contact index and other surface properties for interlock fabrics.

Effect of yarn characteristics on fabric surface properties
Dependent variables and abbreviations
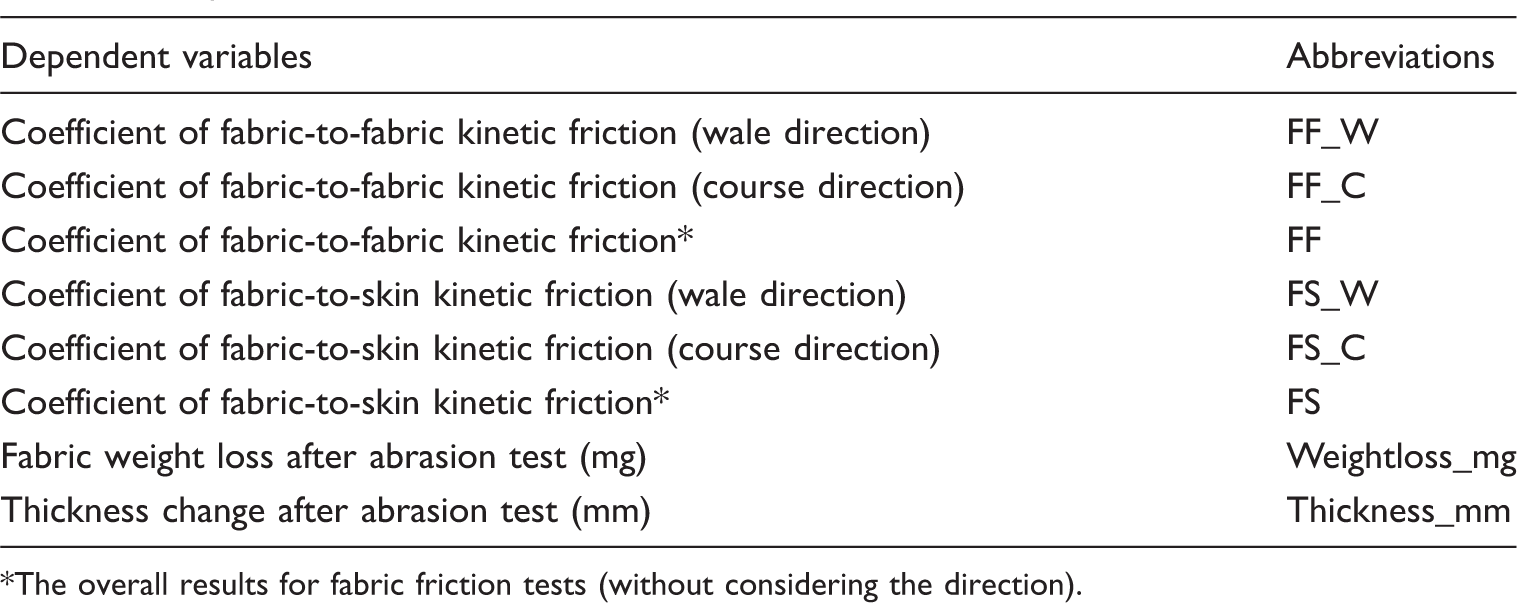
The overall results for fabric friction tests (without considering the direction).
Coefficients of determination for fabric-to-fabric kinetic friction (wale direction)
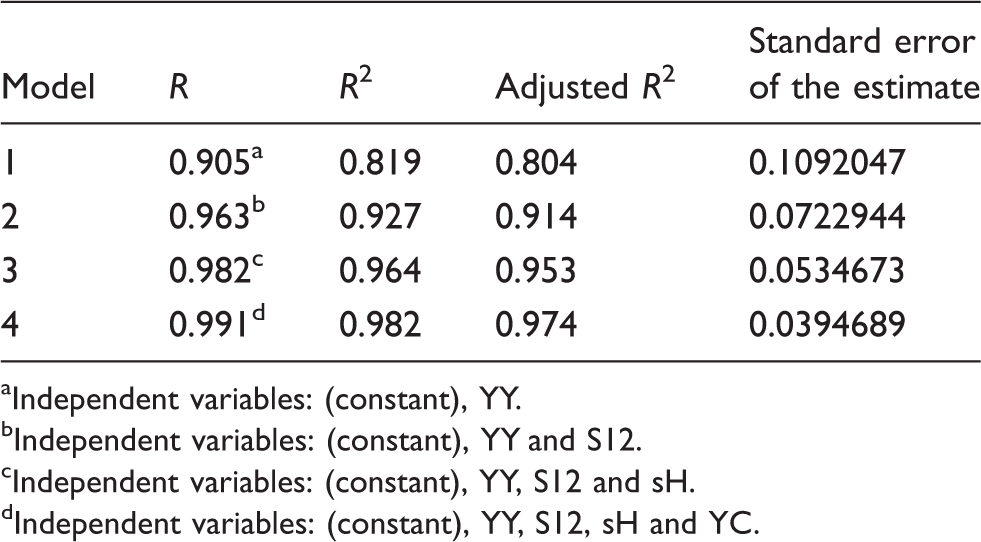
Independent variables: (constant), YY.
Independent variables: (constant), YY and S12.
Independent variables: (constant), YY, S12 and sH.
Independent variables: (constant), YY, S12, sH and YC.
It is seen that 80.4% of the fabric-to-fabric friction coefficient (wale direction) can be explained by only the YY friction coefficient (Table 9). This ratio increases up to 97.4% by adding hairiness caused by short fibers (S12), sH and the YC friction coefficient as independent variables into the regression models. The regression equation for model 4 is given in equation (1).


Coefficients of determination for fabric-to-fabric kinetic friction (course direction)
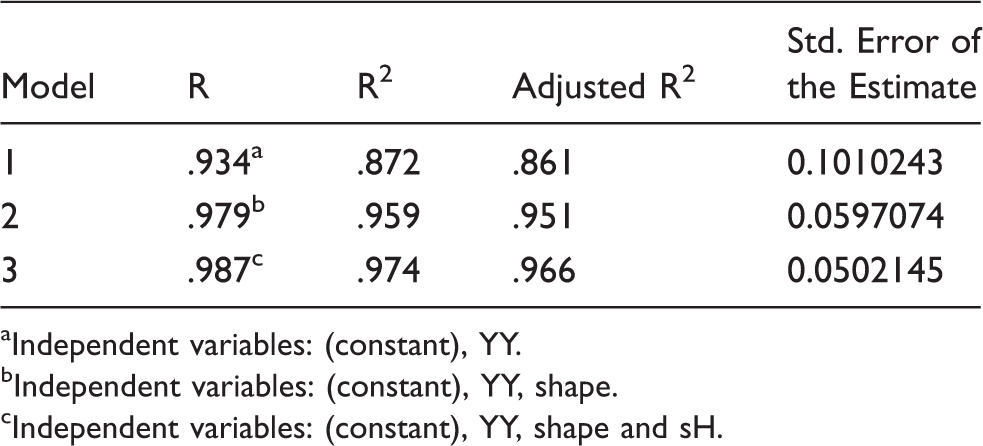
Independent variables: (constant), YY.
Independent variables: (constant), YY, shape.
Independent variables: (constant), YY, shape and sH.


Coefficients of determination for fabric-to-skin kinetic friction (wale direction)

Independent variables: (constant), Thin50.
Independent variables: (constant), Thin50 and Neps200.
Coefficients of determination for fabric-to-skin kinetic friction (course direction)

Independent variables: (Constant),sH
Independent variables: (Constant), sH and YM
Regression models of fabric friction coefficient
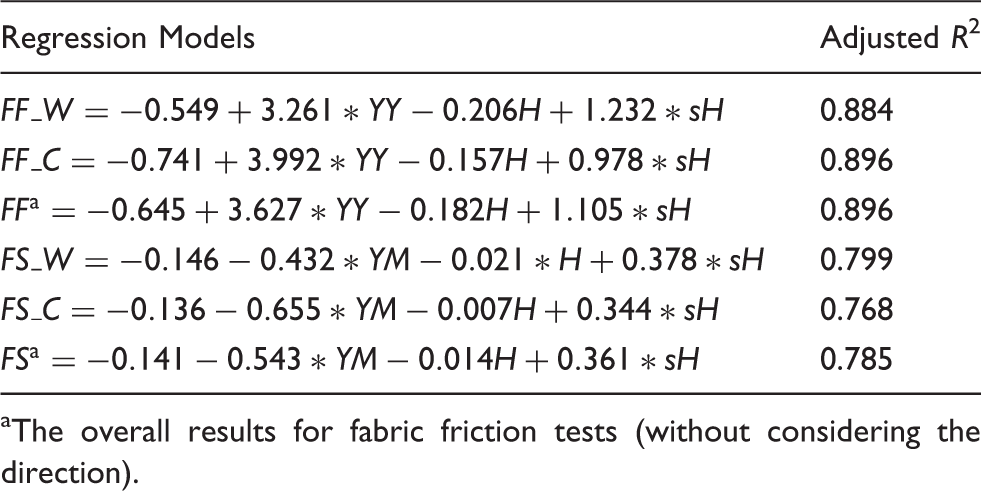
The overall results for fabric friction tests (without considering the direction).

Coefficients of determination for weight losses after abrasion

Independent variables: (constant), YY.
Conclusions
In this study, the surface properties of single jersey and interlock-knitted fabrics produced by natural (cotton), regenerated (Modal and Tencel) and synthetic (polyester and acrylic) ring yarns, and the effects of fiber and yarn characteristics on these properties, were investigated. Unevenness, optical unevenness, imperfections, structural properties (diameter, density, roughness and shape), hairiness and frictional properties of the yarns, as well as abrasion resistance, pilling and frictional properties of the fabrics, were analyzed. It is seen that the effects of raw materials and the structural properties of fibers (linear density and length) are statistically significant for fabric surface properties (p < 0.05). Our results show that polyester fabrics have the highest and Modal fabrics have the lowest fabric-to-fabric friction, and acrylic fabrics have the highest and Tencel and Modal fabrics have the lowest fabric-to-skin friction for both knitting structures and both directions. Tencel fabrics have the highest and polyester fabrics have the lowest weight loss (mg) values among the fabrics produced by yarns made of same the fiber linear density (1.3 dtex) and length (38 mm). For polyester fabrics in which the effect of fiber fineness and length is investigated, the lowest fabric-to-fabric friction, fabric-to-skin friction, weight loss and thickness change values belong to fabrics produced from thinner (1.3 dtex) and longer (38 mm) polyester fibers. When a comparison is made in terms of pilling tendency, it is observed that the pilling tendencies of the fabrics produced by yarns made of fibers with the same linear densities and fiber lengths are pretty high, and that they are close to each other. In the scope of this study, correlation analysis and regression models were used to analyze the effects of yarn characteristics on fabric surface properties, and to predict fabric surface properties from yarn characteristics. It is seen that there is a high positive correlation between YY friction and fabric-to-fabric friction for both knitting structures and both directions. Furthermore, there is a positive correlation between thickness change after abrasion resistance testing and the yarn hairiness (S3) value. When the regression models were analyzed, the obtained results demonstrated that variation in frictional and hairiness properties of yarns could explain approximately 80–85% of fabric-to-fabric and fabric-to-skin friction. These correlation analysis results and regression models may be helpful for further studies on the prediction of surface properties of fabrics, which are very important in terms of fabric handle and sensorial comfort properties.
In addition to the experimental studies within the content of study, a new parameter based on image analysis was also suggested to objectively determine the fabric surface roughness. The new parameter, called the OCI, was calculated to determine the contact area. Relationships between this new parameter and certain fabric surface properties (abrasion resistance and friction coefficient) were also analyzed statistically. Correlation analyses showed that there are strong correlations between the OCI and these fabric surface properties at the 0.05 significance level. For this reason, it is considered that the proposed method could be used for the objective evaluation of fabric surface properties through fabric images, and that it may help save time, cost and labor.
Footnotes
Acknowledgements
Thanks to TÜBİTAK (The Scientific and Technological Research Council of Turkey-2211 National Doctorate Scholarship Program) and Kipaş Holding A.Ş. for their contributions to the study.
Declaration of conflicting interests
The authors declared no potential conflicts of interest with respect to the research, authorship and/or publication of this article.
Funding
The authors received no financial support for the research, authorship and/or publication of this article.