



Abstract
The objective of this study is to analyze the characteristics of frictional sounds and to determine correlations between sound parameters and mechanical properties of fabrics classically used for protective garments. The set of samples includes six fabrics whose surface was previously worn out at different degrees using a Martindale abrasion tester. The frictional sounds were obtained by a device reproducing the friction engendered under arm during walking and were recorded and analyzed using Fast Fourier Transform (FFT) analysis. In addition, the mechanical properties of samples were measured using the Kawabata Evaluation System. The FFT spectra of fabrics showed different shapes and different noise levels according to the degree of wear. Several correlations between sound parameters and mechanical properties were highlighted. It was shown that the garment’s wear increases the sound level of rustling sounds.
The sound quality improvement of structures is essential to fulfill consumers’ needs for sensory comfort. Indeed, sounds are especially generated by the friction under arms or between legs while walking or moving. Thus, the physical parameters of the noise generated by friction need to be understood in order to analyze or reduce the total sound level.
Friction is a significant physical phenomenon that has been studied for a long time.1,2 When two fabrics rub against each other, both textile surfaces interact at macroscopic and microscopic scales. During friction, the vibration of fibers in the material create a friction sound. These friction sounds can be pleasant or expected, like for example the rustling sound of silk, or uncomfortable like the sound of waterproof garments. 3
Recent studies have aimed to analyze the friction sounds generated by two fabrics rubbing together,4,5 and to study relationships between the mechanical properties and sound parameters of fabrics. 6 It has been shown that fabric friction is influenced by several parameters, such as the type of fibers 7 or the surface roughness. 8
However, in these studies the movement of friction does not match the movement of the arm during walking. In this extent, a novel approach was performed to simulate the real condition, which will be explained in two steps below.
In specific frameworks such as the military field, it is essential to reduce the friction sound in order to improve the acoustic stealth of soldiers’ uniforms. 9 However, a literature review revealed some work on visual stealth but not enough in terms of acoustic stealth. In addition, for garments, the wear due to washing and use has to be considered, as low mechanical stresses and repeated frictions will gradually modify the surface of the fabric.
The main purpose of this study is therefore to analyze the effect of the wearing process on the acoustic properties of frictional sound. In addition, relationships between mechanical properties and sound parameters will also be investigated through statistic methods.
The first step was to analyze the fabric noise generated by friction under the arms. For this purpose, a device was designed to reproduce the movement of the arm during walking or running. Moreover, it is also designed to record the generated frictional sounds. 10 All of the experimental conditions were fixed, but the repeatability of the experience has not been proven yet.
The second step focused on the frictional sound analysis and on the instrumental identification of the acoustic signature of frictional sounds. The influence of the weave pattern of unbleached cotton on the sound properties was analyzed as well as the correlation between some mechanical properties and the total sound level of the friction noise. 11 The mechanical properties represent the surface condition and the compression of fabrics. They were measured by the Kawabata Evaluation System (KES). 12
Material and methods
Samples
Characteristics of the fabric

In order to study the influence of wearing, six samples were obtained from the material. A Martindale abrasion tester was used to wear out the specimens at different states of wear.
13
The Martindale abrasion tester subjects a circular specimen to a defined load and rubs it against another fabric in a translational movement tracing a Lissajous figure (Figure 1). This movement causes repeated frictions between the two fabrics. The sample is subject to abrasive wear for a predetermined number of abrasive cycles (one abrasive cycle is the compound of 16 rubs).
Lissajous curve.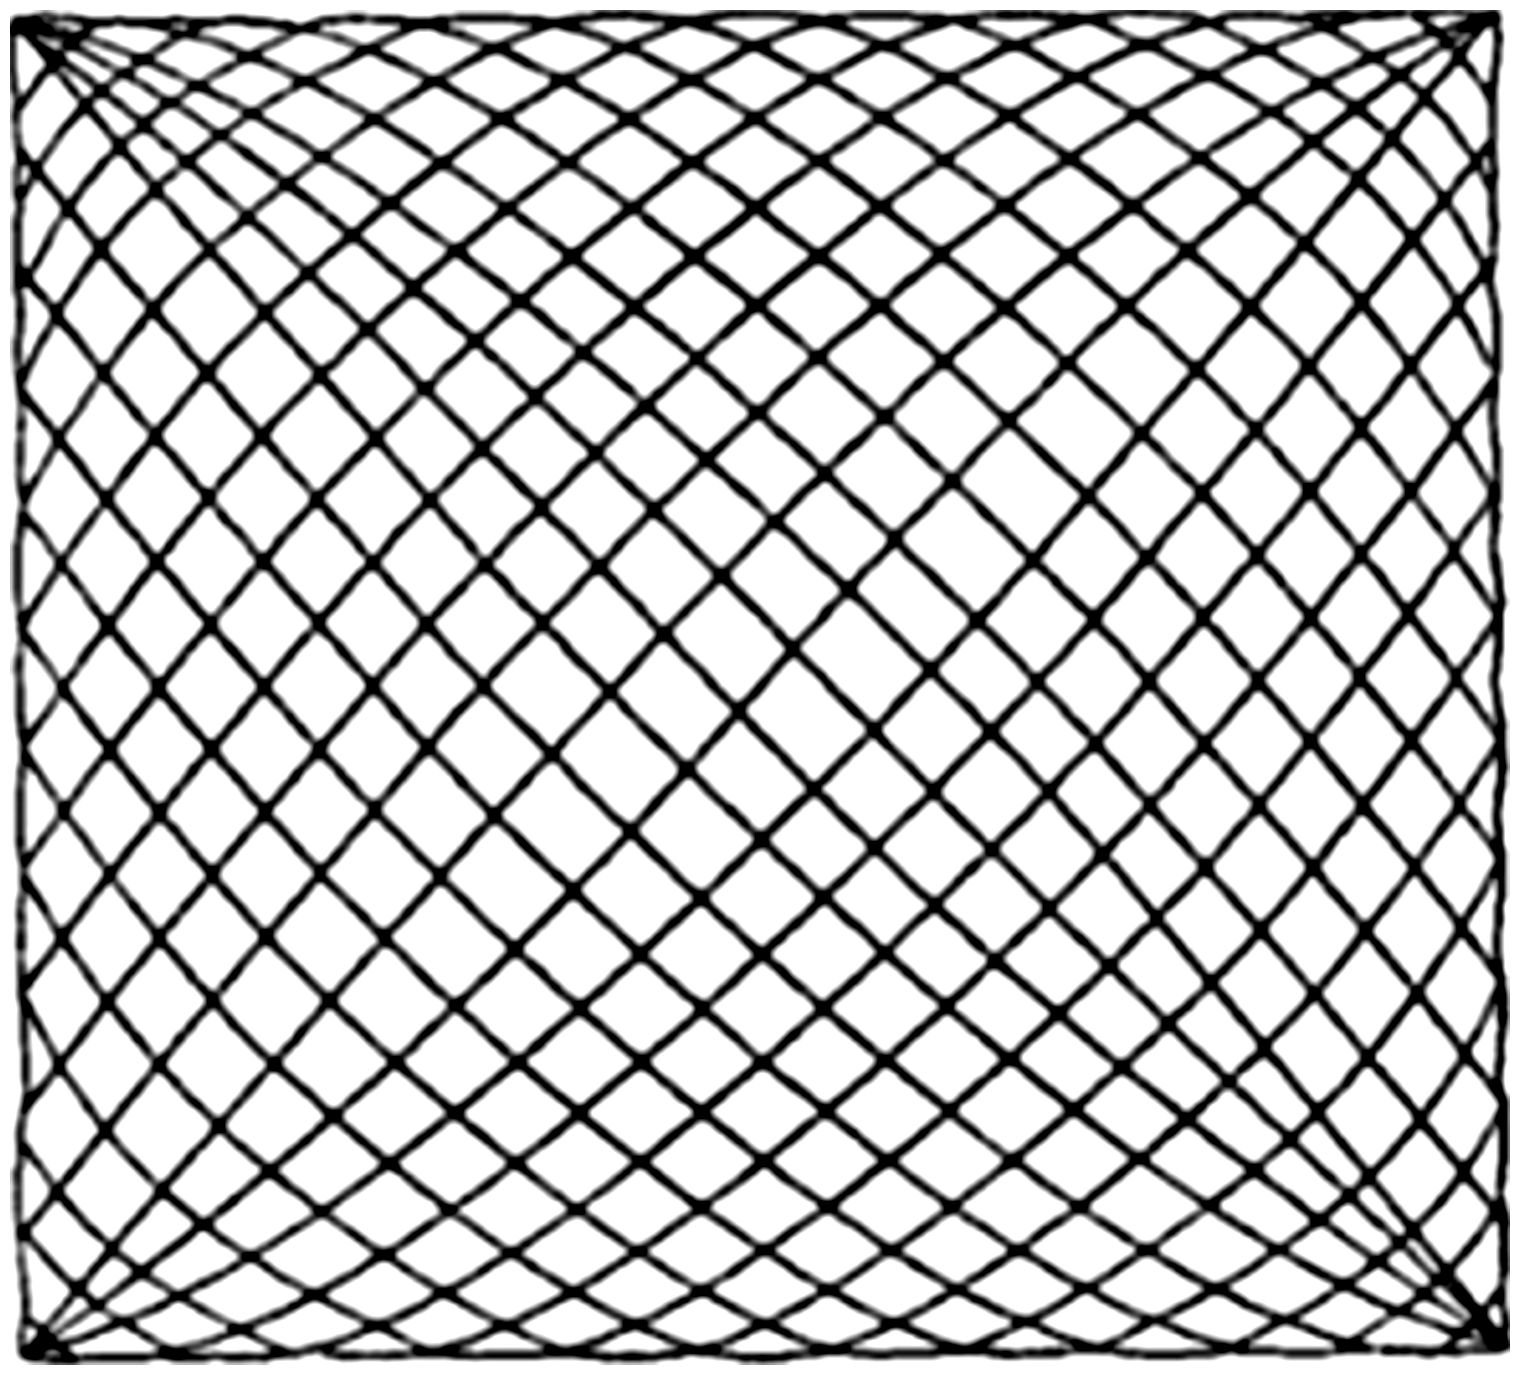
In general, it can be assumed that a soldier makes about 10,000 steps per day and thus so many frictions. As the Martindale realizes an accelerated wear of the fabric, the range number of abrasive cycles studied has been arbitrarily fixed from 0 to 25,000 cycles.
Two types of tests were conducted: acoustic measurements of the friction sound and measurements of the fabric properties thanks to the KES-FB, 11 limited to compression and surface characterizations in accordance with Yosouf. 14
Measurements of mechanical properties
Thanks to the measurement of the compression properties, five parameters are obtained: the compression linearity (LC); the compression energy (WC); the compression resilience (RC), the thickness at a 0.5 gf/cm2 pressure (T0); and the thickness at a 50 gf/cm2 pressure (TM).
For the surface properties, three parameters are obtained: the friction coefficient (MIU); the mean deviation of friction coefficient (MMD); and the geometric roughness (SMD).
All tests were performed in the standard atmosphere for textile testing (65 ± 4% relative humidity and 20 ± 2℃). 15 Samples were conditioned for 24 hours before being tested.
In order to study the consistency of the results, a coefficient of variation CV% is used (Equation (1)). When the coefficient of variation is less than 10%, the values obtained are considered as statistically acceptable. In addition, to evaluate the estimation accuracy of a statistical parameter, an experimental level of probability (LPE) can be defined by Equations (2) and (3)



For each parameter measured with the KES, 40 measures were performed in order to have CV% less than 10% and LPE less than 5%.
Acoustic measurement
The motion device
To evaluate the intensity and the nature of the sound generated when two similar fabrics rub together, a device developed by Yosouf et al. 11 in a previous study was used. It is composed of a mechanism reproducing the human arm motion when a person is walking and a system to record the friction sound. An acoustic isolation made of polyurethane foam is placed around the recording system to avoid any external perturbation.
A microphone, Brüel & Kjaer ½ inch type (4190), is used to detect friction noise of the fabric specimen. The sound recording is performed using a Sony recorder type (PCM-M10) connected to a Brüel & Kjaer type (2606 amplifier). The microphone was calibrated at 515 mV/Pa. 16
In the anechoic booth (Figure 2), one sample is fixed and the other one is mobile. The fixed sample is placed above a silicone surface that reproduces the human skin. The mechanical parts of the motion simulator, the recorder and the amplifier parts were placed outside the anechoic booth.
Anechoic booth.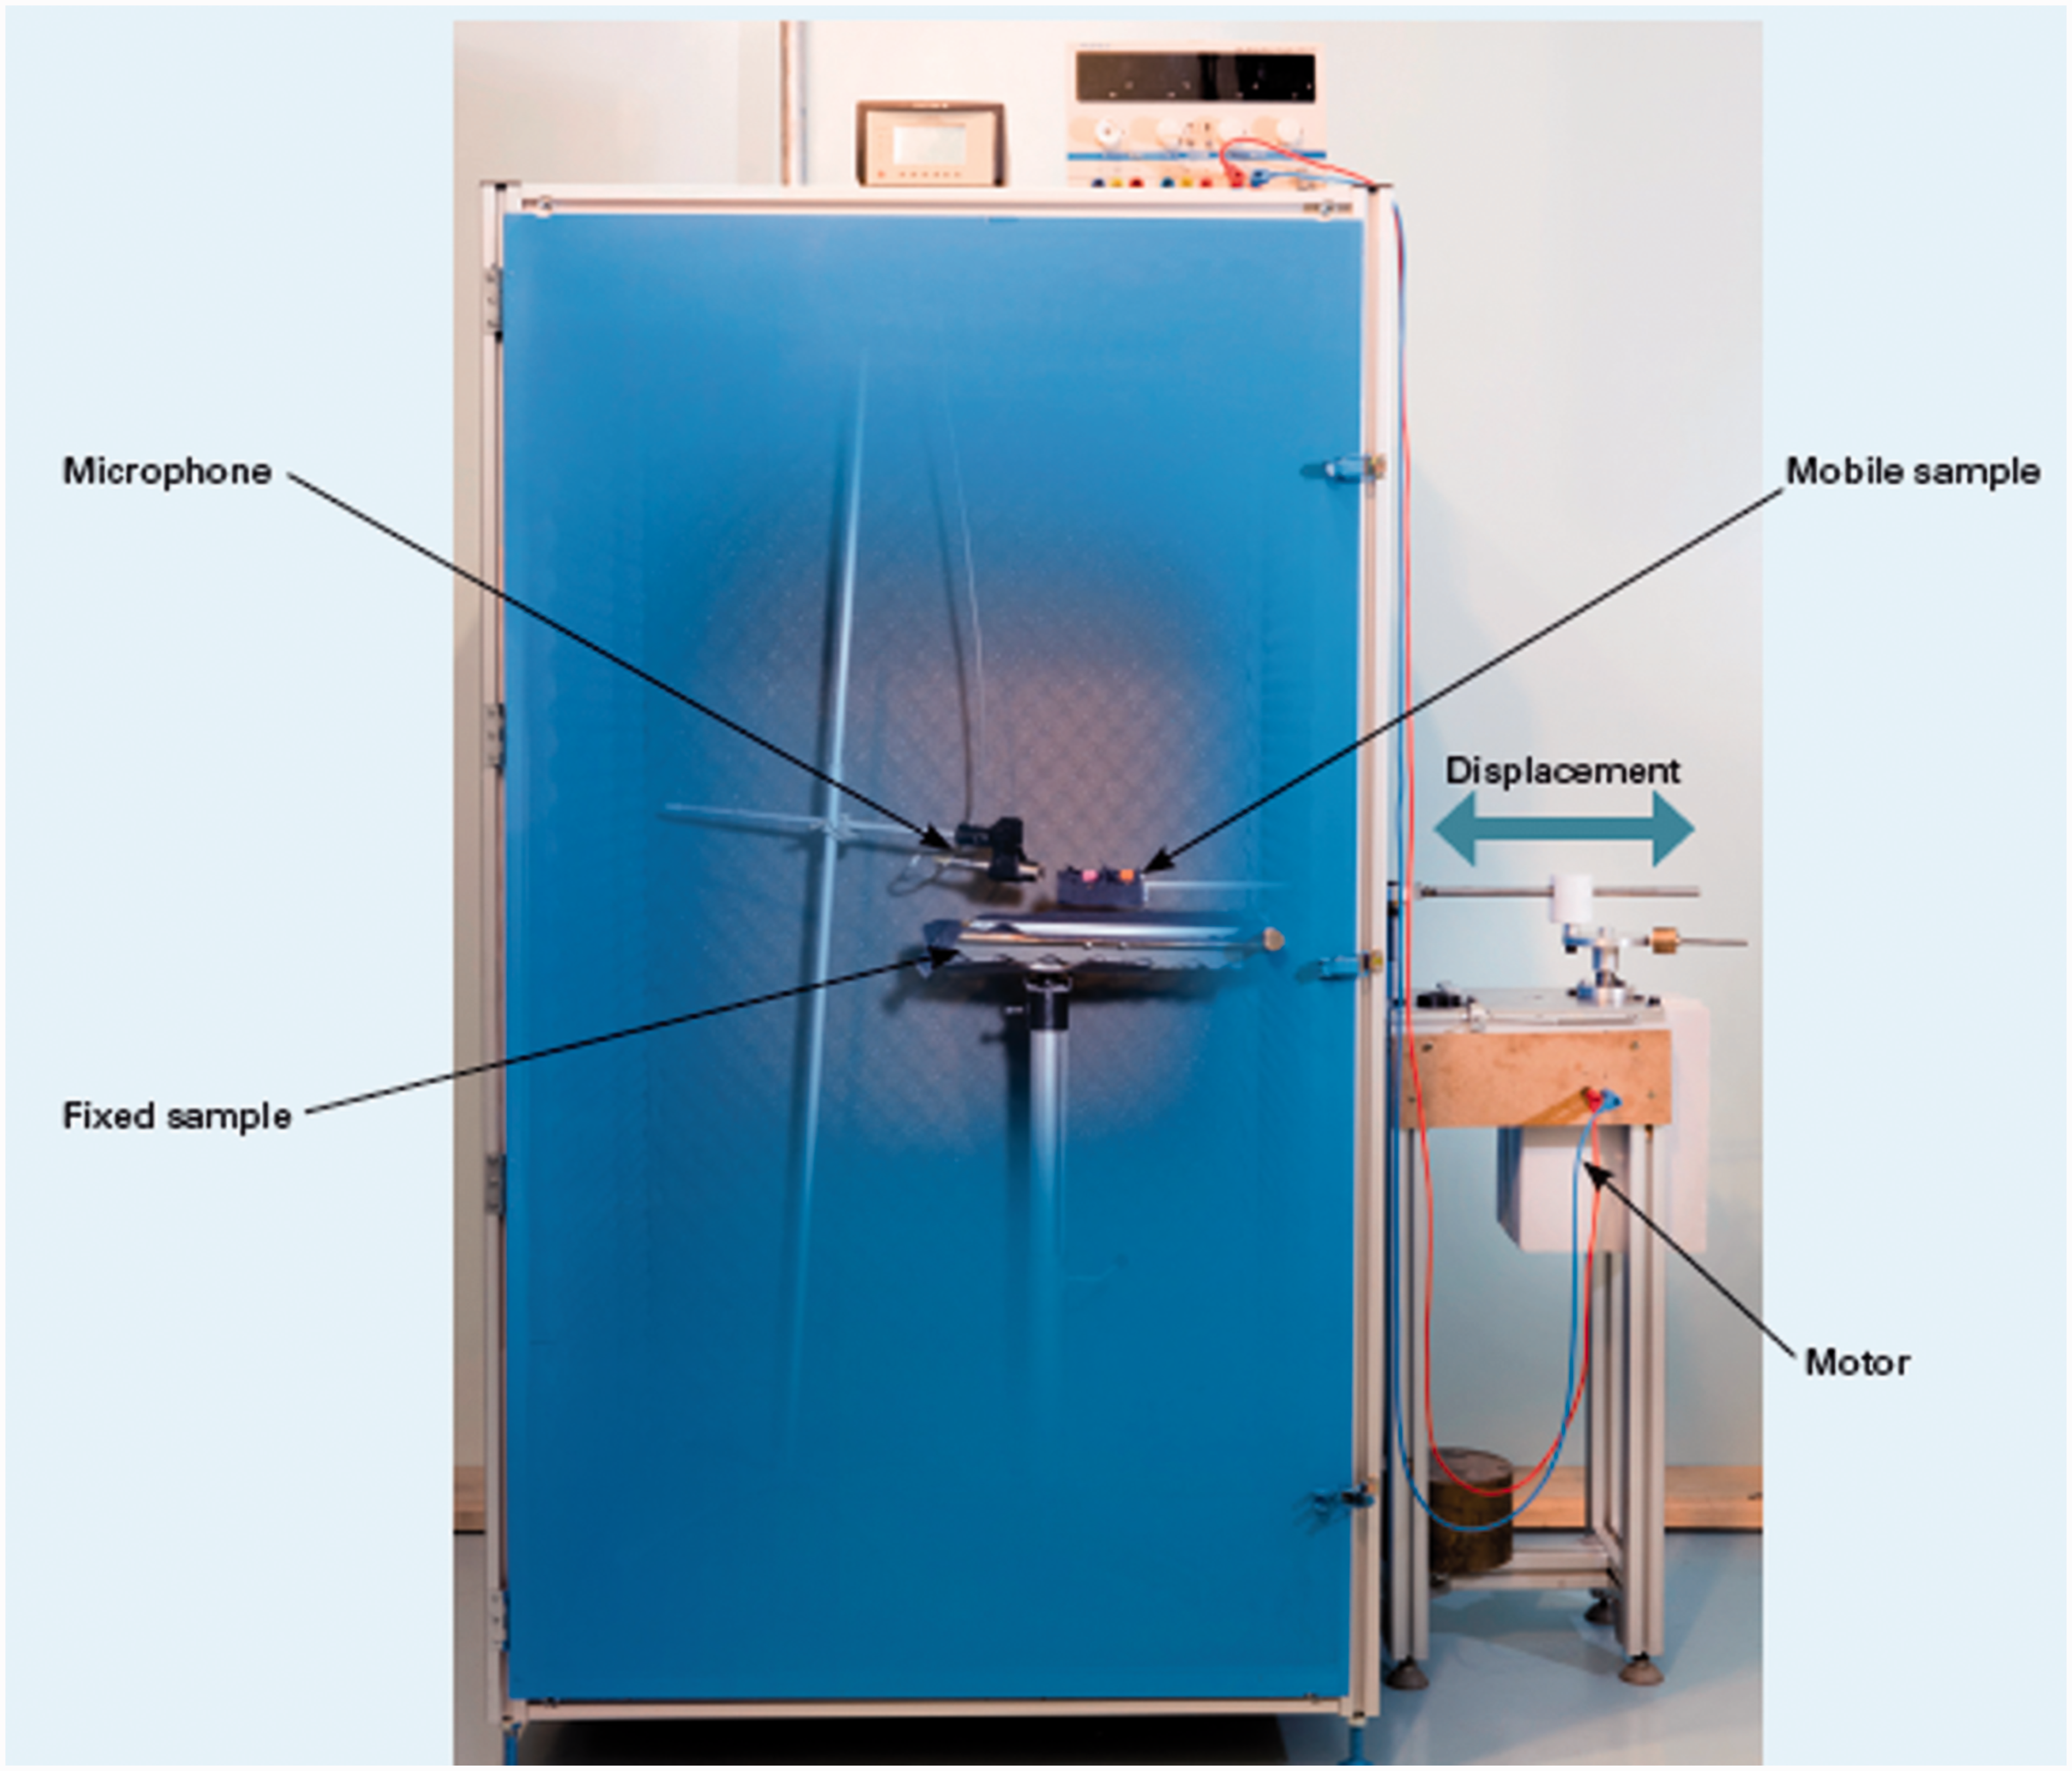
The duration of tests was around 20 seconds and some parameters, which were experimentally fixed according to human arm movement measured on volunteers, 11 are constant, such as the speed or the motion arm movement angle of scanning. The pressure is also fixed and controlled by a FlexiForce type A401 sensor with a circular sensing area of 25.4 mm in diameter and thickness of 0.21 mm. 14
For our experiments, the fixed parameters are the mechanical arm speed (0.56 m/s), the friction surface (90 cm2) and the pressure between the two samples (1.67 kPa).
Signal processing
The processing of the sound is performed in three steps (Figure 3).
Signal processing.
Firstly, as the movement of the mechanical arm is periodic, only 2–3 seconds of the recording can be selected using the Audacity® software. Secondly, a high pass filter processes the signal. This filter allows one to reduce the background noise of the device.
Finally, the filtered sound signals are processed through Fast Fourier Transform (FFT) anlysis, which allows one to estimate the third octave band from 20 Hz to 20 kHz. Several parameters are obtained, such as the noise level, the spectrum, the frequency range and the frequency of the amplitude maximum.
Example of one spectrum
After the signal processing, a spectrum, the noise level as a function of frequencies, is obtained. One example is presented in Figure 4.
A typical spectrum.
According to the figure, the sound emitted by the engine is in the low frequency range (20–300 Hz) so for the results on acoustic friction the low frequency level will not be taken into account.
From this spectrum, the main peak frequency, the total noise level in dB calculated with Equation (4) and the frequency range can be extracted

In this equation, Li represents the sound level of each band i of the spectrum from 20 Hz to 20 kHz.
Results and discussion
Repeatability of the experiment
The first step of this study was to examine the repeatability of our experiment in order to obtain reliability of the results.
For this purpose, three samples of the same fabric were used. The sampling plan is presented in Figure 5. For each sample, 15 acoustic measures were made over several days.
Sampling plan.
The spectra of sample 1 measurements are represented in Figure 6. The curves are close, but to objectively compare all the spectra a correlation coefficient has been calculated (see Equation (5))
Spectra of the 15 measurements (sample 1).

Correlation coefficient between measure 1 and measure i

According to Figure 6 and Table 2 the minimum correlation coefficient is 0.939, allowing us to state that the repeatability of the experiment is sufficient.
The same analysis has been conducted for samples 2 and 3. The average spectrum for each of them is presented in Figure 7.
Average spectra of the samples.
According to the Figure 7, the three spectra are strongly similar as the peaks of amplitude can be found with the same frequencies. As previously mentioned, a correlation coefficient has been calculated between the three spectra.
The correlation coefficients between the average spectra are superior to 98%. Therefore, the similarity between the curves is large and the method is repeatable.
Influence of the wear: acoustic study
Figure 8 represents the evolution of the total noise level according to the fabric ageing. According to the obtained results, three domains can be observed. The total noise level decreases in the range of 5000 to 20000 cycles ( which is the second domain ) wheras it increases in the first one. Finally, in the last zone, the total noise level reaches a stable value.
Evolution of the total noise level according to the degree of wear of samples.
In the first two areas, two linear correlations have been found between the total noise level and the number of abrasive cycles, that is, the degree of wear of the specimens (Figures 9 and 10).
Evolution of the total noise level according to the degree of wear from 0 to 5000 abrasive cycles. Evolution of the total noise level according to the degree of wear from 5000 to 20,000 abrasive cycles.
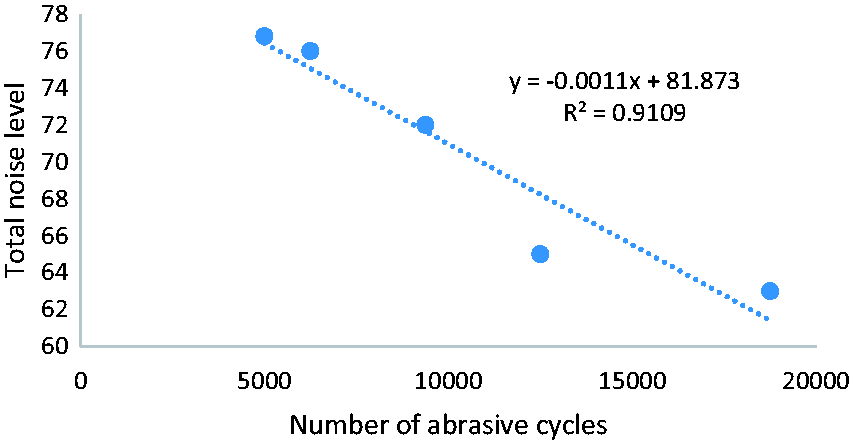
Each domain can be analyzed separately. The results of the first domain (from 0 to 5000 abrasive cycles) will be detailed first.
Analysis from 0 to 5000 cycles
For each sample, the frictional sounds were recorded; the spectra are represented in Figure 11.
Spectra of the six degrees of wear.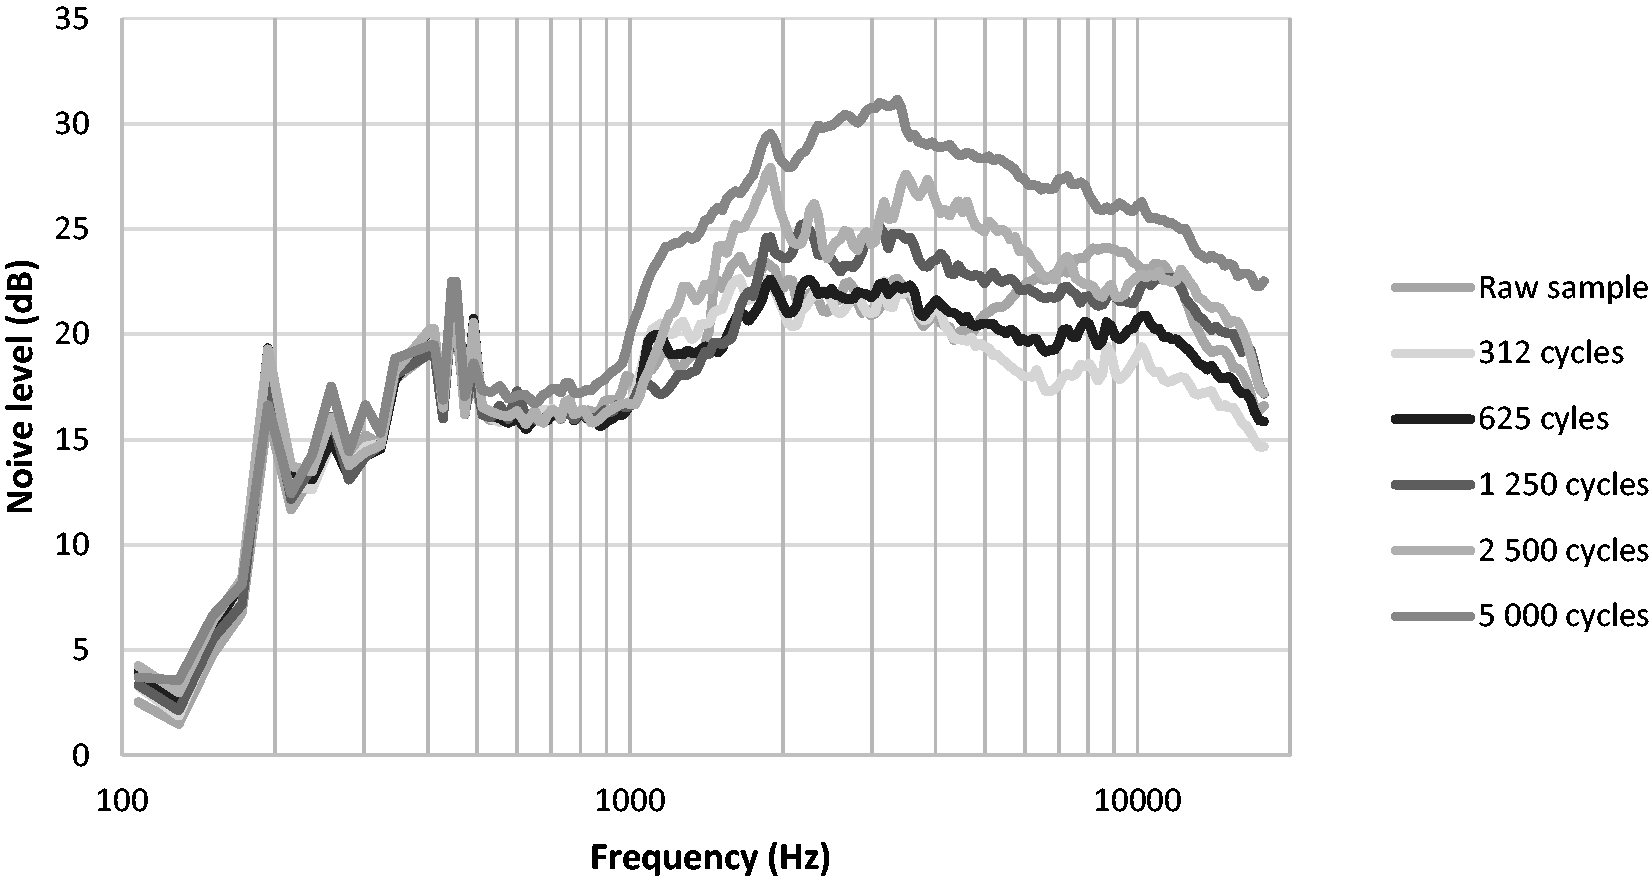
From 1 kHz all the spectra present similar shapes. The peaks of amplitudes are located at the same frequencies but their intensity is different. Indeed, the more the fabric is worn out the more the noise level will increase. The main peak of amplitude is situated at 2 kHz.
Furthermore, the spectra of the raw sample is different from others, especially at high frequencies, where a wide peak of amplitude is observed. This peak is induced by a drastic change in fabric characteristics. We can assume that this peak characterizes the coating of the fabric and is not a characteristic of the fabric itself.
Visual analysis
Degradation of the fabric surface
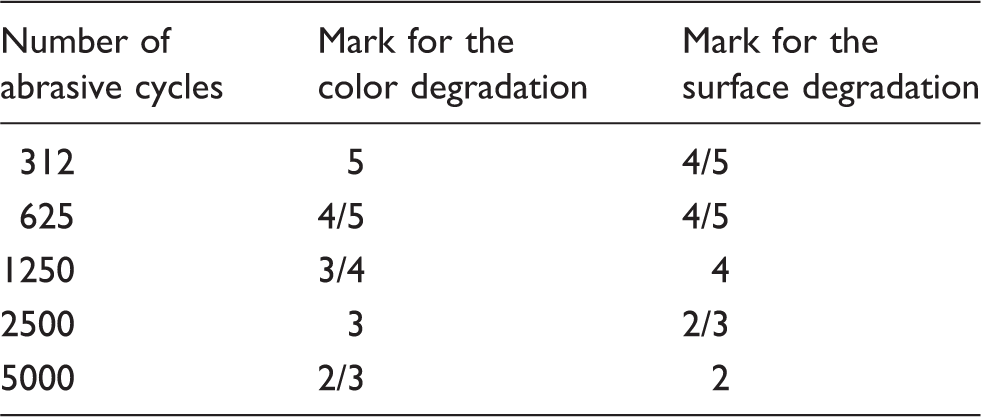
According to Table 3, it is clear that the fabric will continue to wear out with the increase of the number of abrasive cycles.Thus, it is possible to observe some modifications of surface states and a degradation of the color. At first, the withdrawal of the surface coating by the friction can be observed then the number of free fibers on the fabric surface will increase and, finally, the surface will become smooth.
All these differences have shown that the fabric surface underwent some changes, which will induce some variations in the Kawabata parameters.
Kawabata Evaluation System
Samples properties (the values between parenthesis represent the experimental level of probability)
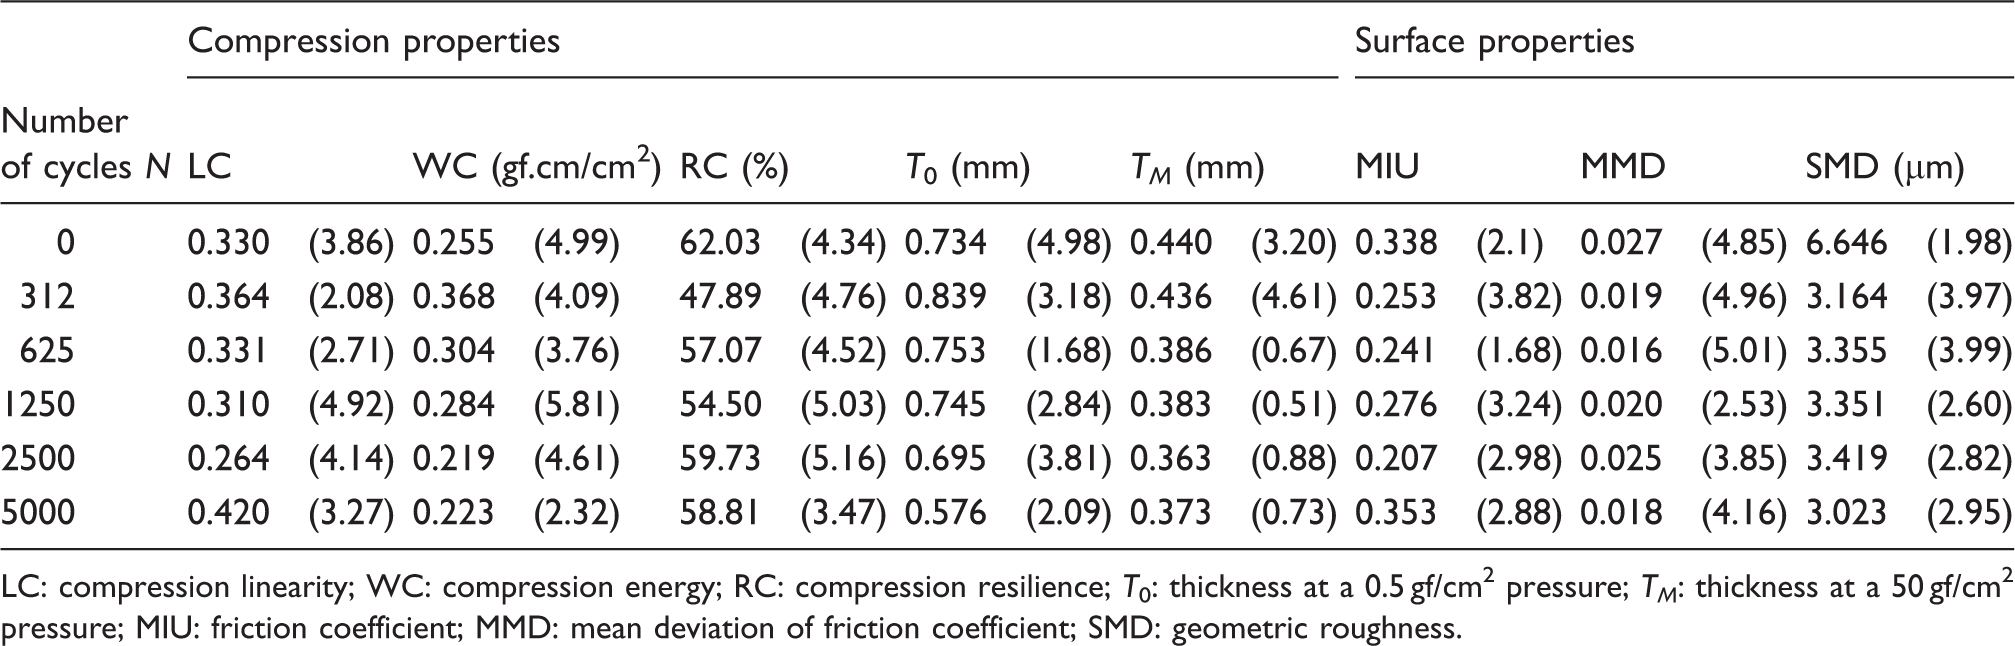
LC: compression linearity; WC: compression energy; RC: compression resilience; T0: thickness at a 0.5 gf/cm2 pressure; TM: thickness at a 50 gf/cm2 pressure; MIU: friction coefficient; MMD: mean deviation of friction coefficient; SMD: geometric roughness.
The measured parameters are LC, WC, RC, thickness at a 0.5 gf/cm2 pressure (T0), thickness at a 50 gf/cm2 pressure (TM), MIU, MMD and SMD.
It can be observed from the obtained data that the fabric ageing has an obvious influence on these parameters. For example, the thickness of the fabric decreases when worn out as well, and the MIU is also different for each sample. These variations can be explained by the number of free fibers at the fabric surface.
Relationship between mechanical and sound properties
Among the statistical tools that are available to analyze the possible relationships between two sets of data, Principal Component Analysis (PCA) was chosen.
A PCA allows one to determine qualitatively the existing correlations between the acoustic parameters, the surface parameters and the compression parameters of the fabric. The results of the PCA for the range 0–5000 abrasive cycles are represented in Figure 12.
Principal Component Analysis from 0 to 5000 abrasive cycles. SMD: geometric roughness; TM: thickness at a 50 gf/cm2 pressure; TO: thickness at a 0.5 gf/cm2 pressure; WC: compression energy; LC: compression linearity; N: number of abrasive cycles; Lg: total sound level; MIU: friction coefficient; RC: compression resilience; MMD: mean deviation of friction coefficient; F: frequency of the maximum.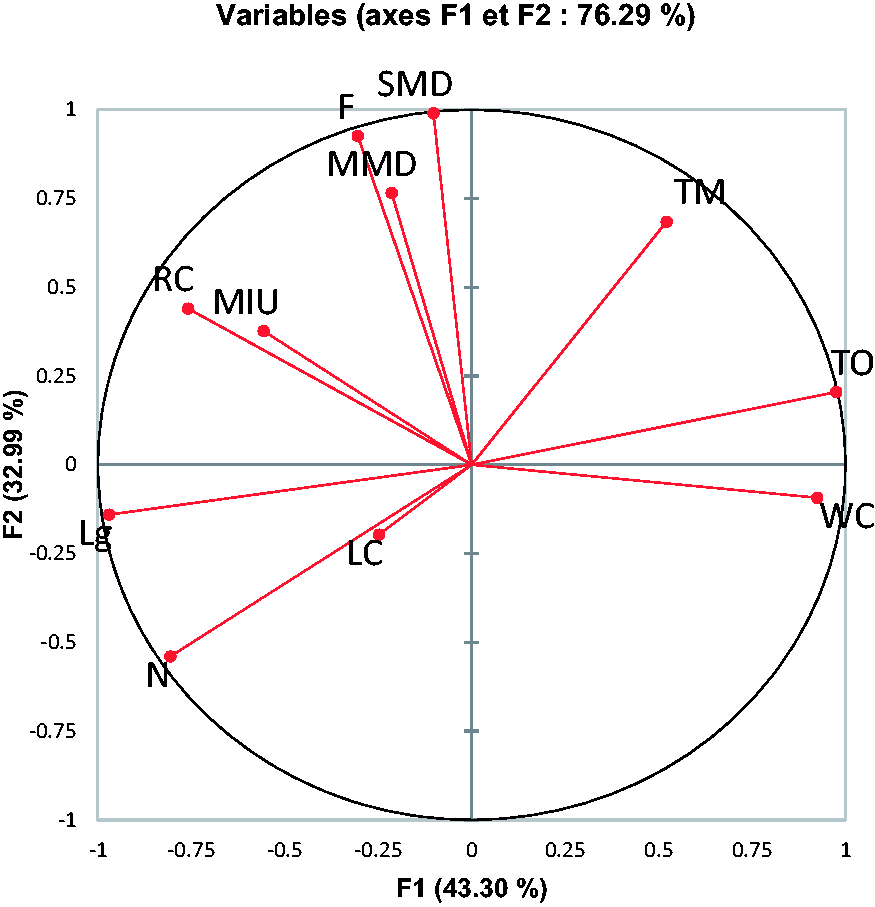
The parameters are the number of abrasive cycles (N), total sound level (Lg), frequency of the maximum (F), LC, WC, RC, thickness at a 0.5 gf/cm2 pressure (T0), thickness at a 50 gf/cm2 pressure (TM), MIU, MMD and SMD.
Matrix of the Pearson’s correlation coefficient between parameters

N: number of abrasive cycles; Lg: total sound level; F: frequency of the maximum; LC: compression linearity; WC: compression energy; RC: compression resilience; T0: thickness at a 0.5 gf/cm2 pressure; TM: thickness at a 50 gf/cm2 pressure; MIU: friction coefficient; MMD: mean deviation of friction coefficient; SMD: geometric roughness.
According to these results, some positive and negative correlations can be established between the acoustic and mechanical parameters from the Figure 12.
The variable Lg is correlated to the number of abrasive cycles N, and with this increase the number of free fibers on the fabric surface increases too. Therefore, there are more contact points between the two fabrics when they rub against each other and the total sound level is higher. The total sound level and the number of abrasive cycles are anti-correlated to compression properties (WC and T0). The fabric thickness will decrease with the increase of the number of abrasive cycle because some material will be gradually removed from the fabric surface.
Regarding the peak frequency, F is correlated with surface properties (MMD and SMD). Indeed, the wear of the textile surface will cause a change in surface condition and thus the roughness, which is consistent with a change of acoustic signature.
Analysis from 5000 to 20,000 cycles
Correlations between the various parameters can be studied for the range from 5000 to 20,000 abrasive cycles. Figure 13 presents the results of the PCA.
Principal Component Analysis from 5000 to 20,000 abrasive cycles. MMD: mean deviation of friction coefficient; To: thickness at a 0.5 gf/cm2 pressure; WC: compression energy; Lg: total sound level; SMD: geometric roughness; F: frequency of the maximum; TM: thickness at a 50 gf/cm2 pressure; RC: compression resilience; LC: compression linearity; N: number of abrasive cycles; MIU: friction coefficient.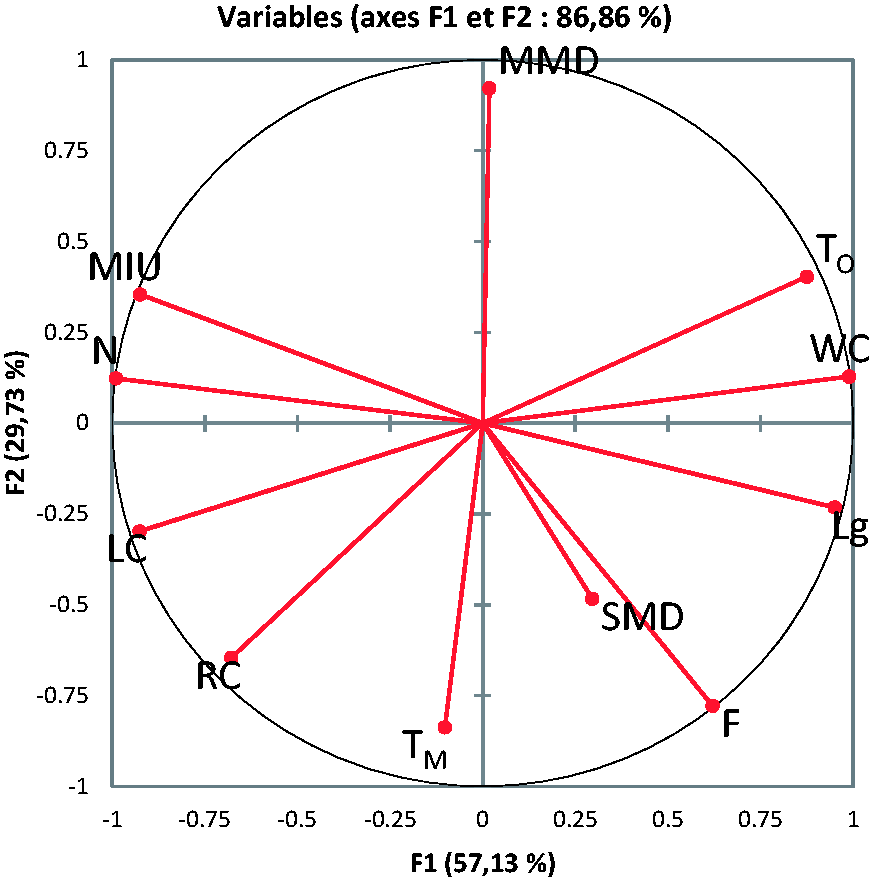
Matrix of the Pearson’s correlation coefficient between parameters

N: number of abrasive cycles; Lg: total sound level; F: frequency of the maximum; LC: compression linearity; WC: compression energy; RC: compression resilience; T0: thickness at a 0.5 gf/cm2 pressure; TM: thickness at a 50 gf/cm2 pressure; MIU: friction coefficient; MMD: mean deviation of friction coefficient; SMD: geometric roughness.
According to these results, the correlations are different from the previous study. We have seen that in this domain (from 5000 to 20,000 cycles), the total noise level decreases so Lg is anti-correlated with the number of abrasive cycles. There is also a negative correlation between Lg and the MIU, because for this number of cycles the fabric surface becomes smoother. Indeed, the free fibers have been removed by abrasion, so there are fewer frictions between the fabrics and the total sound level decreases. In addition, the variable Lg is correlated to compression properties (T0 and WC).
From the comparison between Figures 12 and 13, we can conclude that the total sound level is strongly correlated to compression properties, whereas the peak frequency is more linked to surface properties. Within the two ranges of cycles, the correlations are different. However, the correlations between the number of cycles N and the compression parameters T0 and WC are still negative because wear of the fabric inevitably induces a decrease in thickness.
The abrasion performed by the Martindale tester generates at first the formation of pillings on fabric surfaces. Then, the removal of pillings was observed with the increase of abrasive cycles. After 10,000 cycles the thickness of the fabric reached a stable value (0.576 mm), which represents a reduction of thickness of about 22%. In addition, a decrease of the fabric surface roughness has been observed as in the studies by Akgun 18 and Castellar et al. 19 However, this paper focuses on compression and surface properties but some studies have also shown a link between shear or bending properties and friction sounds. 8
In addition, there are some experimental devices 8 that also allow fabric-to-fabric frictions. It is generally a translational movement, whereas the device used in this study has a scanning movement similar to arm movement.
Conclusion
Previous studies have shown the link between mechanical properties and friction sounds, whereas this paper describes the frictional sound generated by the friction between the arms and torso.
The aim was to analyze the influence of the wearing process on the friction sound generated by the movement of the arm during walking. This study concerns a military application, precisely the uniforms of soldiers. It is the relationships between the properties of friction sounds and mechanical parameters of the fabrics that interest us.
For that purpose, two type of measurements were performed: sound analysis using a device reproducing the human arm motion, and surface and compression properties thanks to the KES.
We firstly enhanced the reliability of the acoustic measurements by verifying their repeatability. Then, we studied the influence of the wearing on the surface state and on friction sounds. We also looked for correlations between some sound parameters and the parameters measured with the KES.
Concerning the study on the wearing influence, three domains of degree of wear were determined. We found that the degree of wear of samples has a strong influence on the total noise level of frictional sound. Indeed, initially the total noise level increases then decreases and finally it tends to stabilize.
For the first two domains where the total noise level changes, we were able to highlight different correlations between the acoustic parameters characterizing the noises of friction and the parameters of compression and surface of the material. The total sound level is strongly correlated with the compression properties, whereas the peak frequency is more linked to surface properties.
The follow-up study is to conduct a same analysis on other types of fabric by adding a different final coating or by changing the yarn properties. The wearing of the garment is also generated by a repeated washing process so this could also be an additional study.
Footnotes
Declaration of conflicting interests
The authors declared no potential conflicts of interest with respect to the research, authorship and/or publication of this article.
Funding
The authors received no financial support for the research, authorship and/or publication of this article.