
Abstract
An air layer enclosed at the interface was largely responsible for the insulation results of multilayer fabrics obtained from experiments. In this study, a three-dimensional finite element method model, in which the air layer enclosed at the interface of multilayer fabrics was ignored, was developed to calculate the fabric thermal resistance, and the result obtained from the fabric model was independent of the air. A Thermolab II Tester KES-F7 was also used to measure the thermal resistance of fabrics, and the experimental results were influenced by the air layer. By comparing the simulation and experimental result, the air layer thermal resistance was determined, and then an estimating equation, which can be used to estimate the fabric and air layer thermal resistance for multilayer fabrics, was proposed. The results suggested that the surface roughness of fabrics was strongly related to the air layer thermal resistance, with a linear relationship between them. Moreover, for multiple layers stacked by different fabrics, the air layer thermal resistance at the interface was mainly decided by the fabric with the rougher surface. An estimating equation was also developed to predict the thermal resistance of multilayer fabrics and good correlation between predicted and experimental values was observed.
Fabric contains a large fraction of air, which is largely responsible for its thermal insulation property. A number of studies have been done to investigate the thermal insulation of fabrics with a single layer1–6 and multilayers7–9 The thermal insulation properties are associated with the fiber type, 10 yarn fineness, 11 weave structure,12,13 and fabric thickness. 14 Among all the parameters, fabrics thickness influenced thermal insulation the most. This is because the large fabric thickness has more chance to contain the air in the fabric.
For a single fabric, a linear relation between the thermal insulation and thickness has been reported.15,16 An empirical equation, which gives an accurate estimate of the fabric thermal insulation, was derived from its thickness and thermal resistance. However, Morris 17 pointed out that this relation held only when the thicknesses was lower than 0.055 inch. Meanwhile, in Baxter and Cassie's 18 work, the thermal insulation had a linear relationship up to the thickness of 0.395 inch. For multilayer fabrics, a thin layer of air could be enclosed between fabrics, resulting in an apparent increase in the measured thermal insulation. 19 This is more obvious in the case when fabrics with rough surfaces are layered. It was found that for the fabrics with the smooth surface, accurate estimates of the insulation could be obtained by adding values of the individual fabrics. Meanwhile, if fabrics have a rough surface, the insulation of multilayer fabrics must be measured directly. 7 According to Tian et al.'s study, 20 the stacking sequence of fabric layers was an important factor for the thermal response, and the fabric contacting the hot heat source was the key layer that affected the result.
In the previous measurement of fabric thermal insulation, the fabrics were placed between a hot and a cold plate to generate a temperature difference between the fabric top and bottom surfaces.21,22 Then the heat flow transferred from the high temperature to the low temperature, and the thermal conductivity and resistances were obtained as parameters to describe the insulation results. However, the fabric surface is irregular and the air layer can be enclosed not only between fabrics, but also between fabrics and plates. Therefore, the insulation obtained from the experiment includes the insulation of fabrics, air layers between fabrics, and between the fabric and the metal plate.
Recently, multilayer textiles with very complex structures using advanced materials have been produced by developed textile manufacturing equipment. These textiles are very porous and the air layer between fabric layers was largely responsible for the insulation results obtained from experiments. This study proposes a three-dimensional (3D) finite element method (FEM) model to calculate the thermal resistance of fabric. In this model, the air layer enclosed at the interface was ignored and, thus, the thermal resistance calculated from the model was independent of the air. The thermal resistance of fabric was also measured experimentally by a Thermolab II Tester KES-F7, and it was influenced by the air layer. By comparing the results from the simulation and experiment, the air layer thermal resistance was determined. Then an estimating equation, from which the fabric and air layer thermal resistance can be obtained, was developed. The relationship between the surface roughness and air layer thermal resistance was studied. In addition, the thermal resistances of multilayer fabrics were also predicted by this equation, and then they were compared with the measured value from the experiment to verify the equation. The results can be useful for designing multilayer fabrics with the required thermal properties.
Procedure
Figure 1 shows the procedure for obtaining the air layer thermal resistance (R
a
) and fabric resistance (R
f
) by a combination of simulation and experiment. Firstly, a 3D heterogeneous FEM model was developed to calculate the fabric thermal resistance. In the 3D model, the air layer was ignored and the thermal resistance from the model was independent of the air. Then the thermal resistance of a fabric was also measured experimentally by the Thermolab II Tester KES-F7. In the experiment, the air layer was enclosed at the interface and the result from the experiment was influenced by the air. By comparing the results from the simulation and experiment, the air layer thermal resistance was determined.
Procedure for obtaining the fabric resistance and air layer thermal resistance.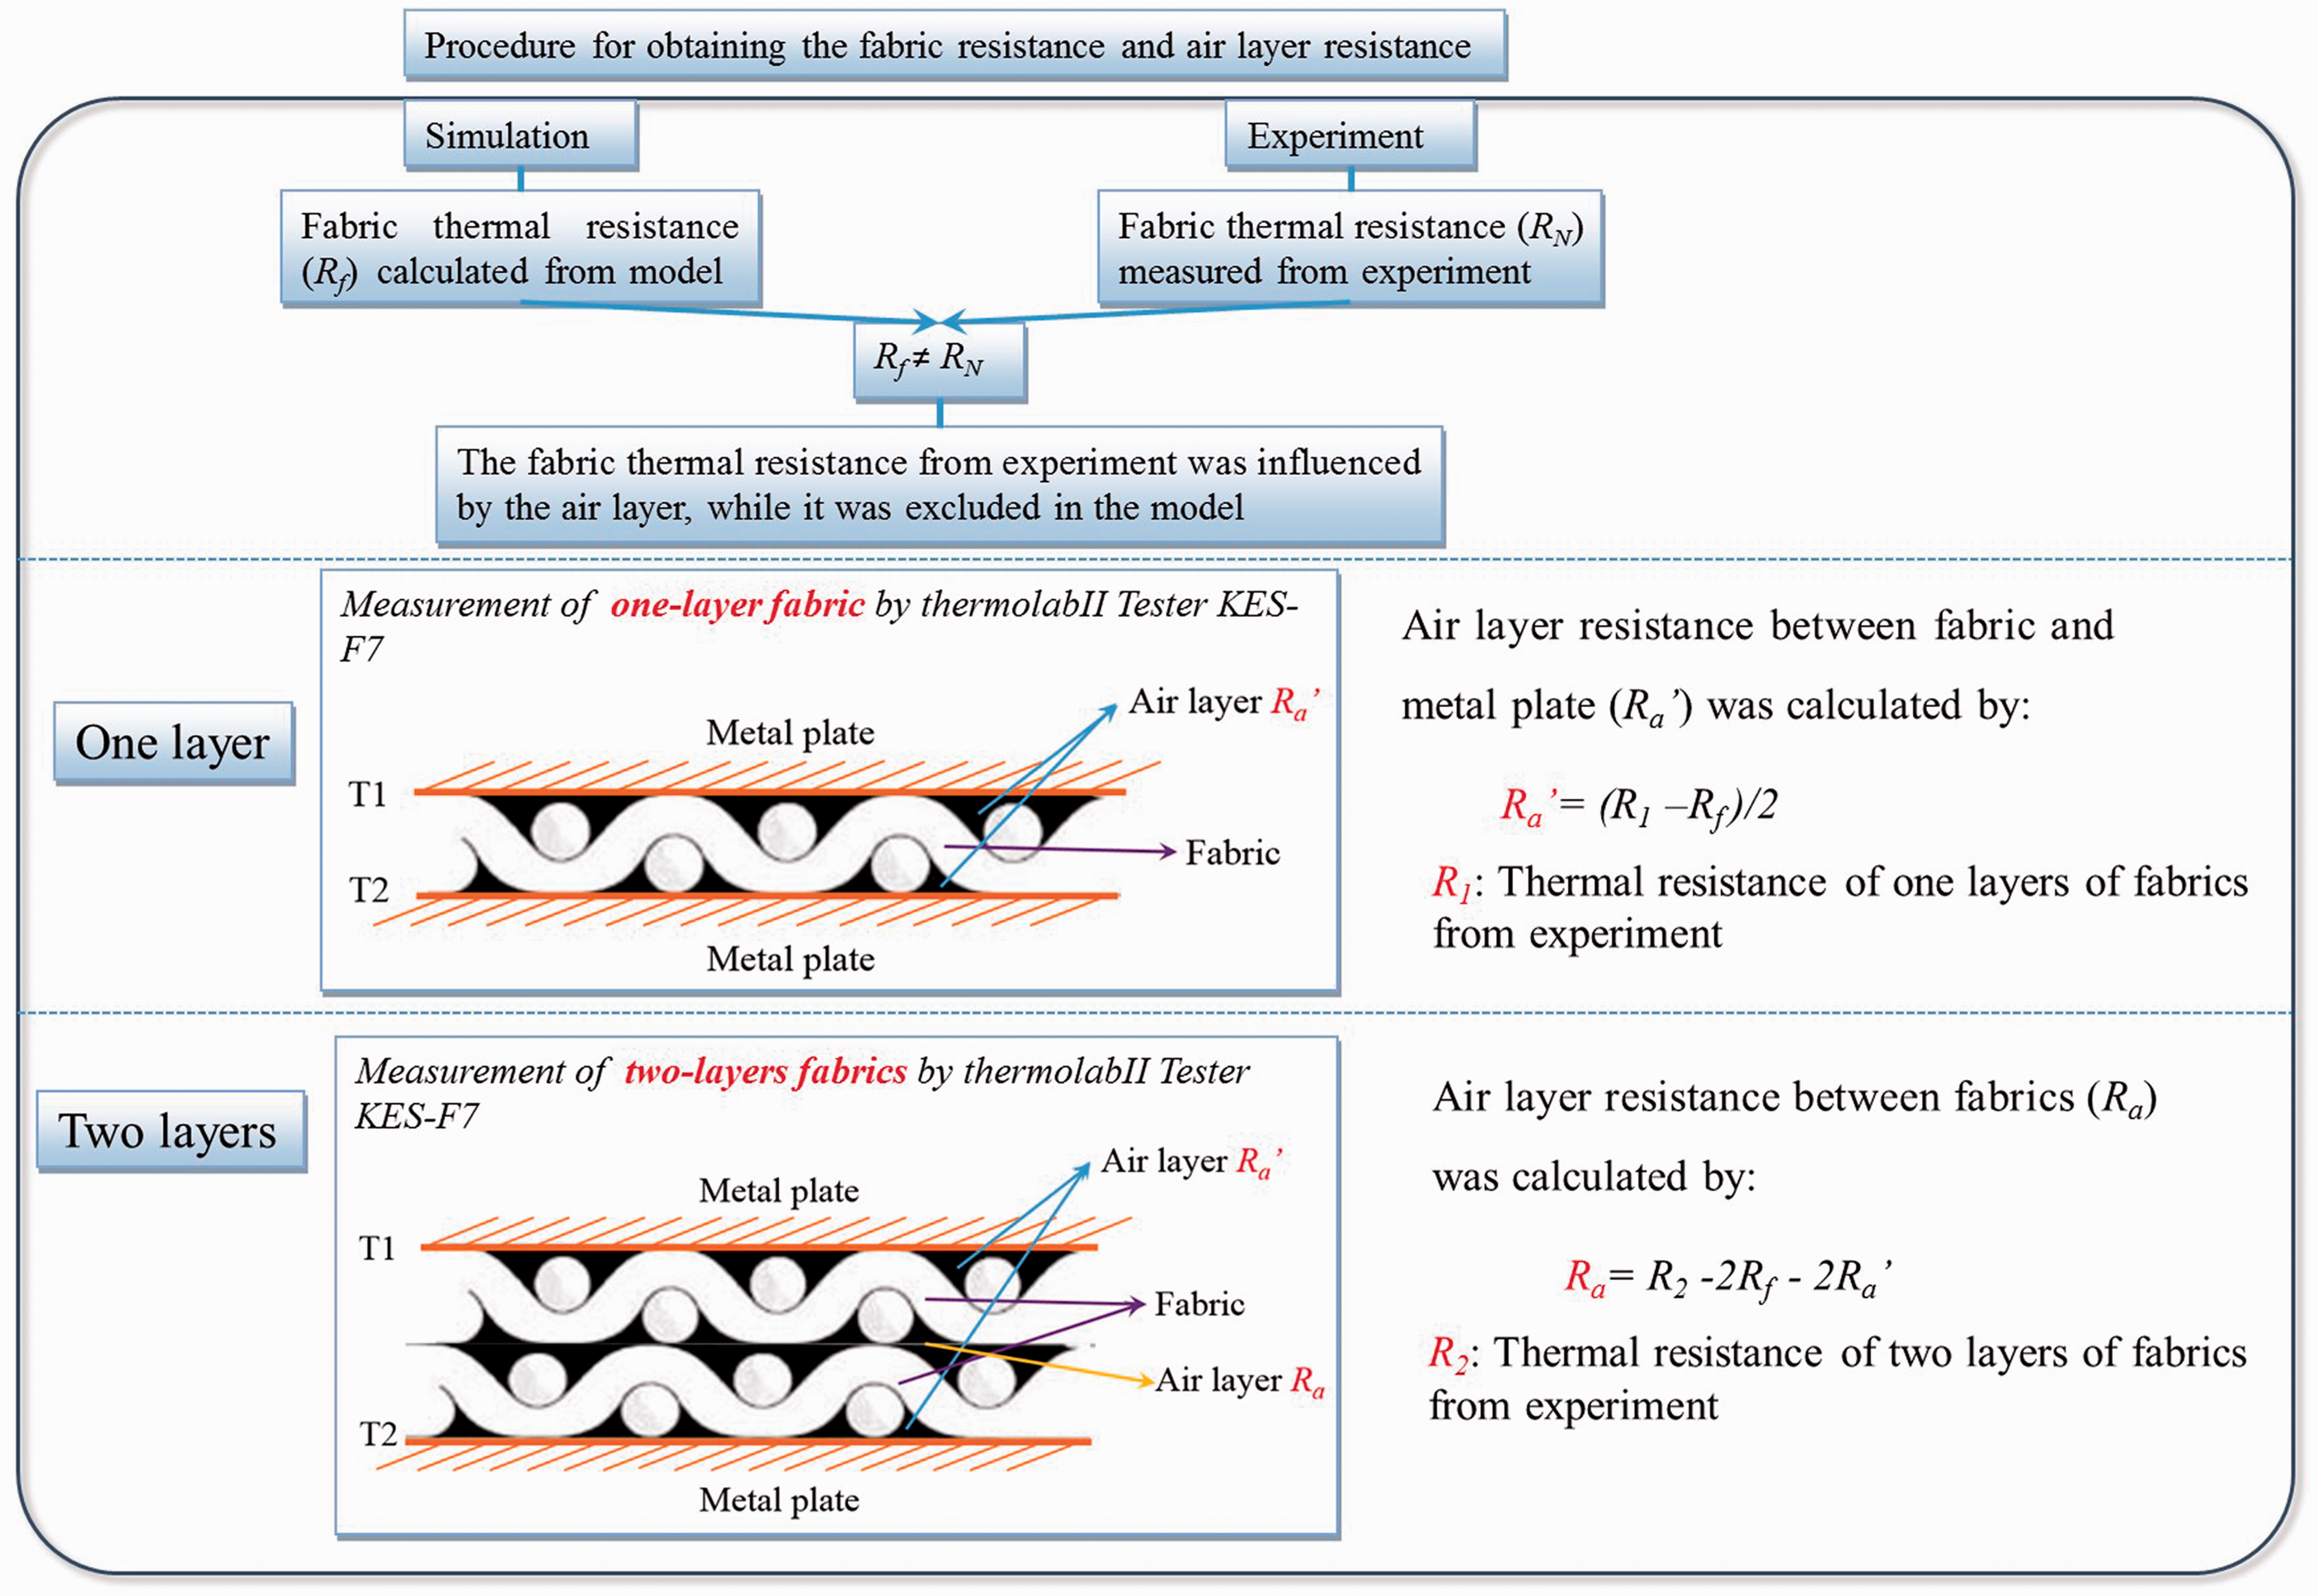
Fabric thermal resistance calculated from the 3D heterogeneous FEM model
A 3D FEM model was developed in nonlinear analysis FEM code (Marc) for the heat transfer analyses inside the fabrics. In this model, the heat transfer along the longitudinal and transverse directions of yarn were treated independently. Moreover, the different heat-transferring rates in the warp and weft yarns were considered. Heat transfer also occurs in the contacting surface between the warp and weft yarns. Direct contact with the yarn intersection was assumed in this model due to the difficulty of measuring the contact heat transfer coefficient. A plain weave of four warp and four weft yarns formed the unit cell, which was then repeated to produce a plain weave pattern, as shown in Figure 2(a). A 3D microscope (VR-3100, Keyence Corp., Japan) was used to observe the 3D structure of the fabric. The fabric thickness, yarn diameter, and weave density of the fabric were also measured. These parameters were used to construct the 3D heterogeneous model. Three samples (Sample #1, #2, and #4) with plain weave were used in the simulation, as shown in Table 1. The material constants used in the model were the thermal conductivity of the yarn, specific heat, and mass density. These samples were also used in our previous work
23
and significantly different heat-transferring behaviors and equilibrium temperature distributions in the cross-section were observed. In this study, the 3D heterogeneous FEM models were employed to simulate the thermal resistance of these samples.
(a) Unit cell of the three-dimensional (3D) heterogeneous finite element method (FEM) model. (b) Measurement of thermal resistance by the 3D heterogeneous FEM model. Material constants of samples used in the model Values of longitudinal thermal conductivity of yarns are obtained from Hearle and Morton
24
and Dyneema Properties.
25
Values of the transverse thermal conductivity of yarns are obtained by the experiment.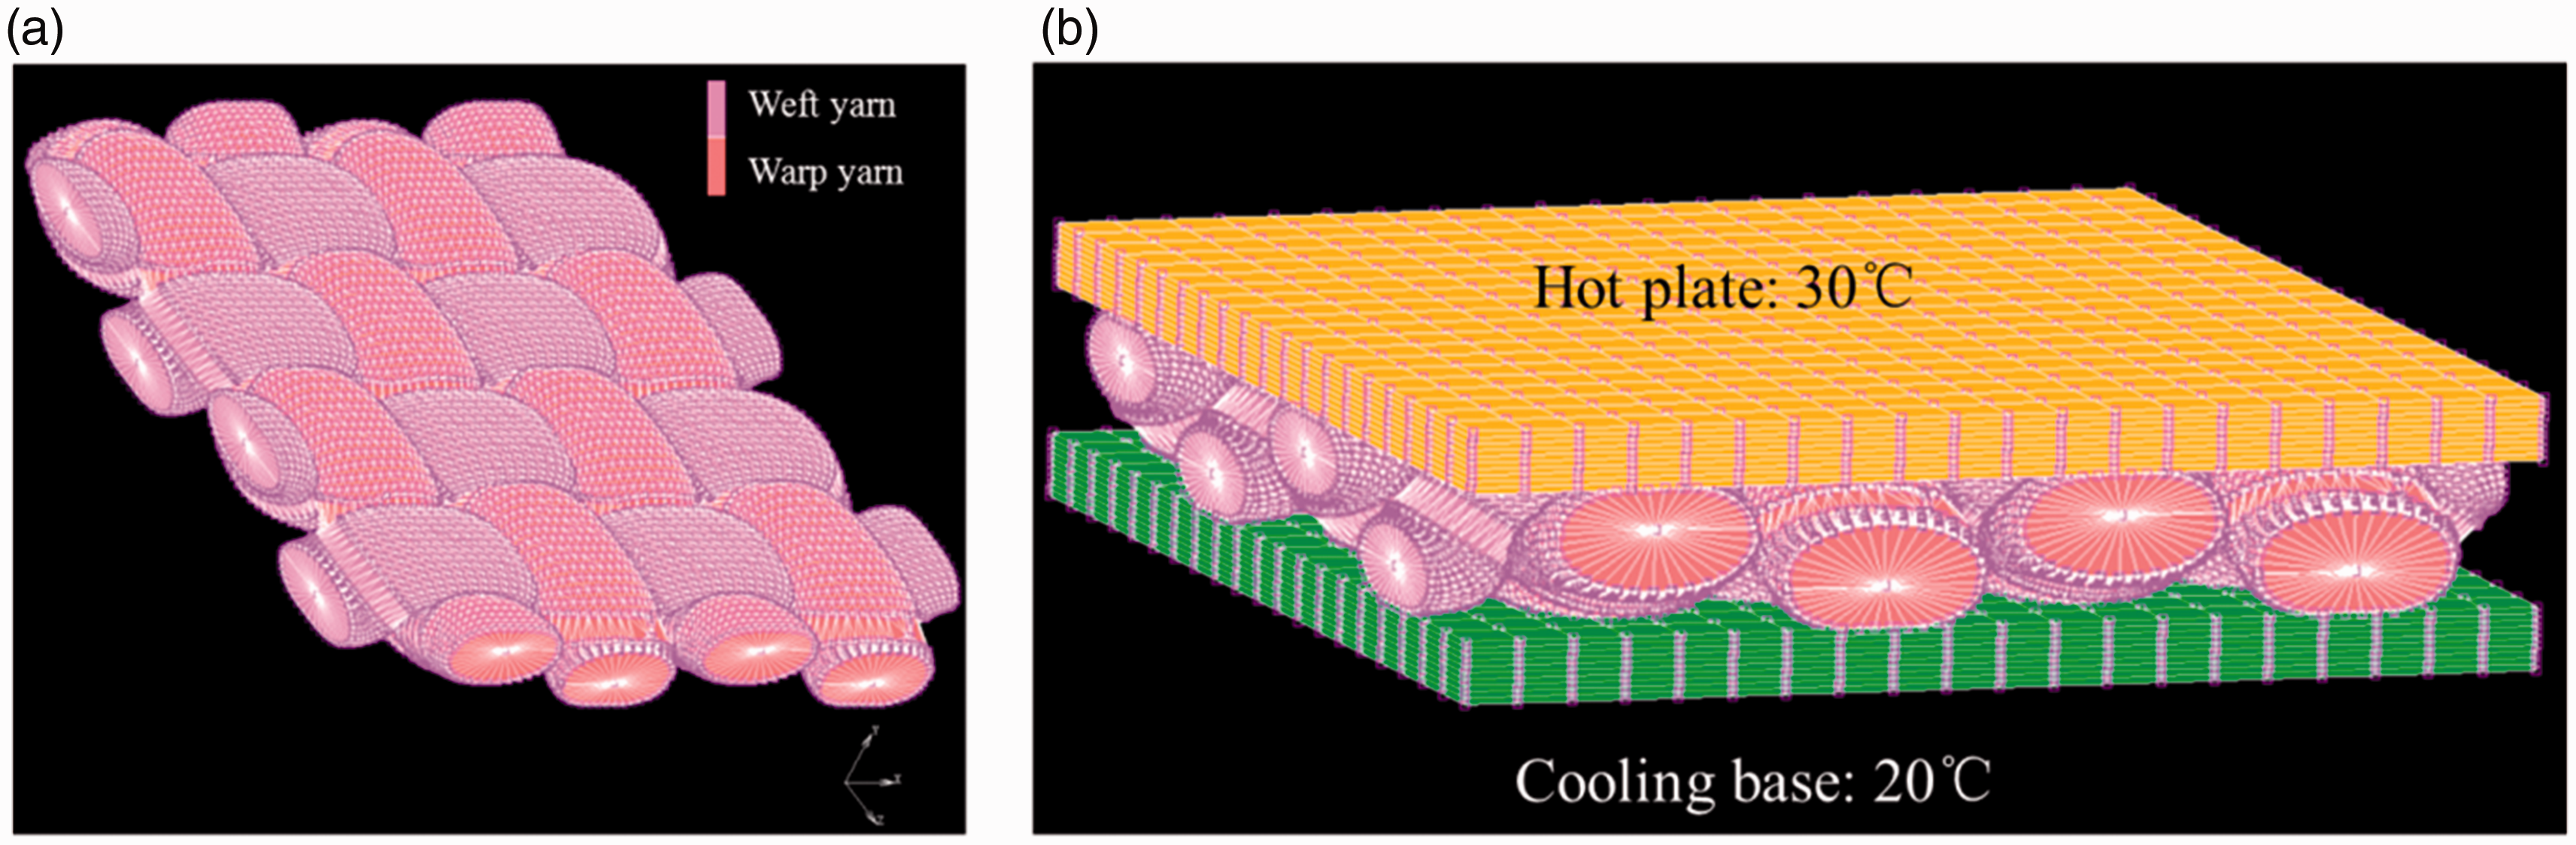

In Figure 2(b), the fabric model was placed between a cooling base (20℃) and a hot plate (30℃), which were set to different temperatures as boundary conductions. The heat flow from the hot plate at the equilibrium state was used to calculate the fabric thermal resistance. The fabric surface is irregular and there are many contact and non-contact areas between the fabric and the cooling base as well as between the fabric and the hot plate. In this model, the air layer in the non-contact area was ignored. Therefore, the thermal resistance of the fabric calculated from the model was not influenced by the convection, which was caused by the penetration of air through the fabric. 26 Moreover, the radiation occurring between the fibers and in the entrapped air was also ignored due to the small temperature difference. 27
Fabric thermal resistance measured from the experiment
Figure 1 (one-layer case) shows a schematic illustration of the Thermolab II Tester KES-F7 to experimentally determine the fabric thermal resistance. During the measurement, the fabric was stacked between the hot plate and cold plate, which held at 30℃ and 20℃, respectively. A force was applied to the hot plate to produce a pressure of 4600 Pa in the fabrics, because the heat flow is affected apparently by the thickness, which decreases with the increase of pressure and becomes almost constant at 4600 Pa.
The fabric thermal resistance (R) is given by
14

The air layer thermal resistance calculated using a combination of simulation and experiment
Equations to calculate the air layer thermal resistance (R
a
and 
For two-layer fabrics, there are two air layers between the fabric and the metal plate and one air layer between the fabric and fabric, as shown in Figure 1 (two-layer case). By measuring the thermal resistance of two-layer fabrics (R2) experimentally, the air layer thermal resistance between fabrics (R
a
) was calculated by

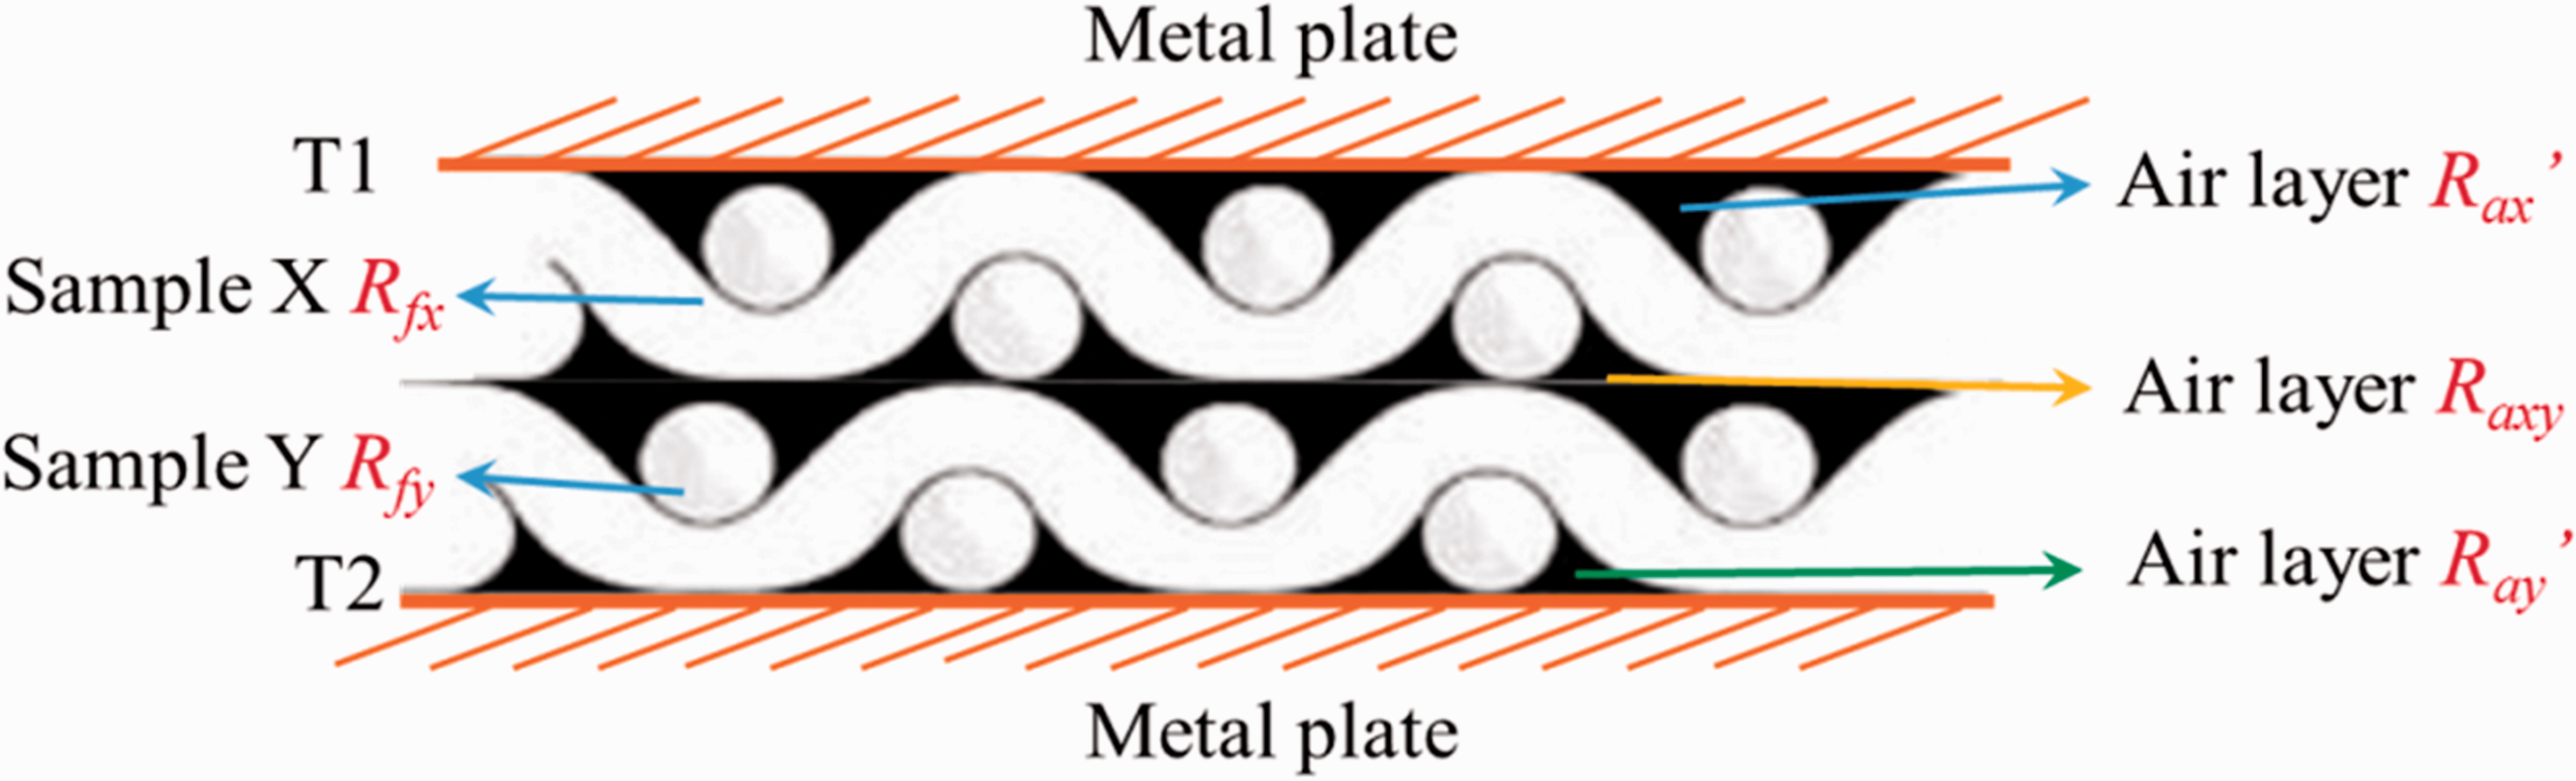
For two-layer fabrics stacked by different fabrics (Sample x and Sample y, as shown in Figure 3), the air layer thermal resistance between them (R
axy
) is given by
Thermal resistance of two-layer fabric stacked by different fabrics.
Result and discussion
and R
a
obtained by the simulation method
Figure 4 shows the air layer thermal resistance Air layer thermal resistance between the fabric and the metal plate (Ra), as well as between the fabric and fabric (
For multilayer fabrics, the thermal resistance measured from the experiment consists of several fabric resistances and air layer thermal resistances, as shown in Figure 5. The total thermal resistance (R
N
) is given by
The thermal resistance of multilayer fabric.

Then Equation (5) was converted into Equation (6) due to the equality of R
a
and 
In this equation, R N is the total thermal resistance of multilayer fabrics (N layers), which can be measured from the experiment. R f and R a are two unknown values. If we measure the thermal resistance of fabrics with different layers (for example, two and three layers), R f and R a can be calculated from Equation (6). Therefore, Equation (6) provides a convenient method to estimate the fabric and air layer thermal resistance of multilayer fabrics based on the experimental results.
Comparison of fabric and air layer thermal resistance obtained from the simulation and Equation (6)
To verify the correctness of Equation (6), the fabric resistance (R
f
) obtained from the simulation was compared with that calculated from the Equation (6), as shown in Figure 6. The correlation coefficient between the values obtained from the simulation and Equation (6) was as high as 0.995. The good agreement indicated that this estimating equation can also obtain the fabric resistance correctly. Figure 7 shows the air layer thermal resistance obtained by Equations (2) and (6), respectively, where only slight differences were observed between the two sets. In Equation (2), the fabric resistance from the simulation was required for the calculation of the air layer thermal resistance, while for Equation (6), the air layer thermal resistance was calculated only from the experimental result.
Comparison of fabric thermal resistance from simulation and Equation (6). Comparison of air layer thermal resistance from Equations (2) and (6).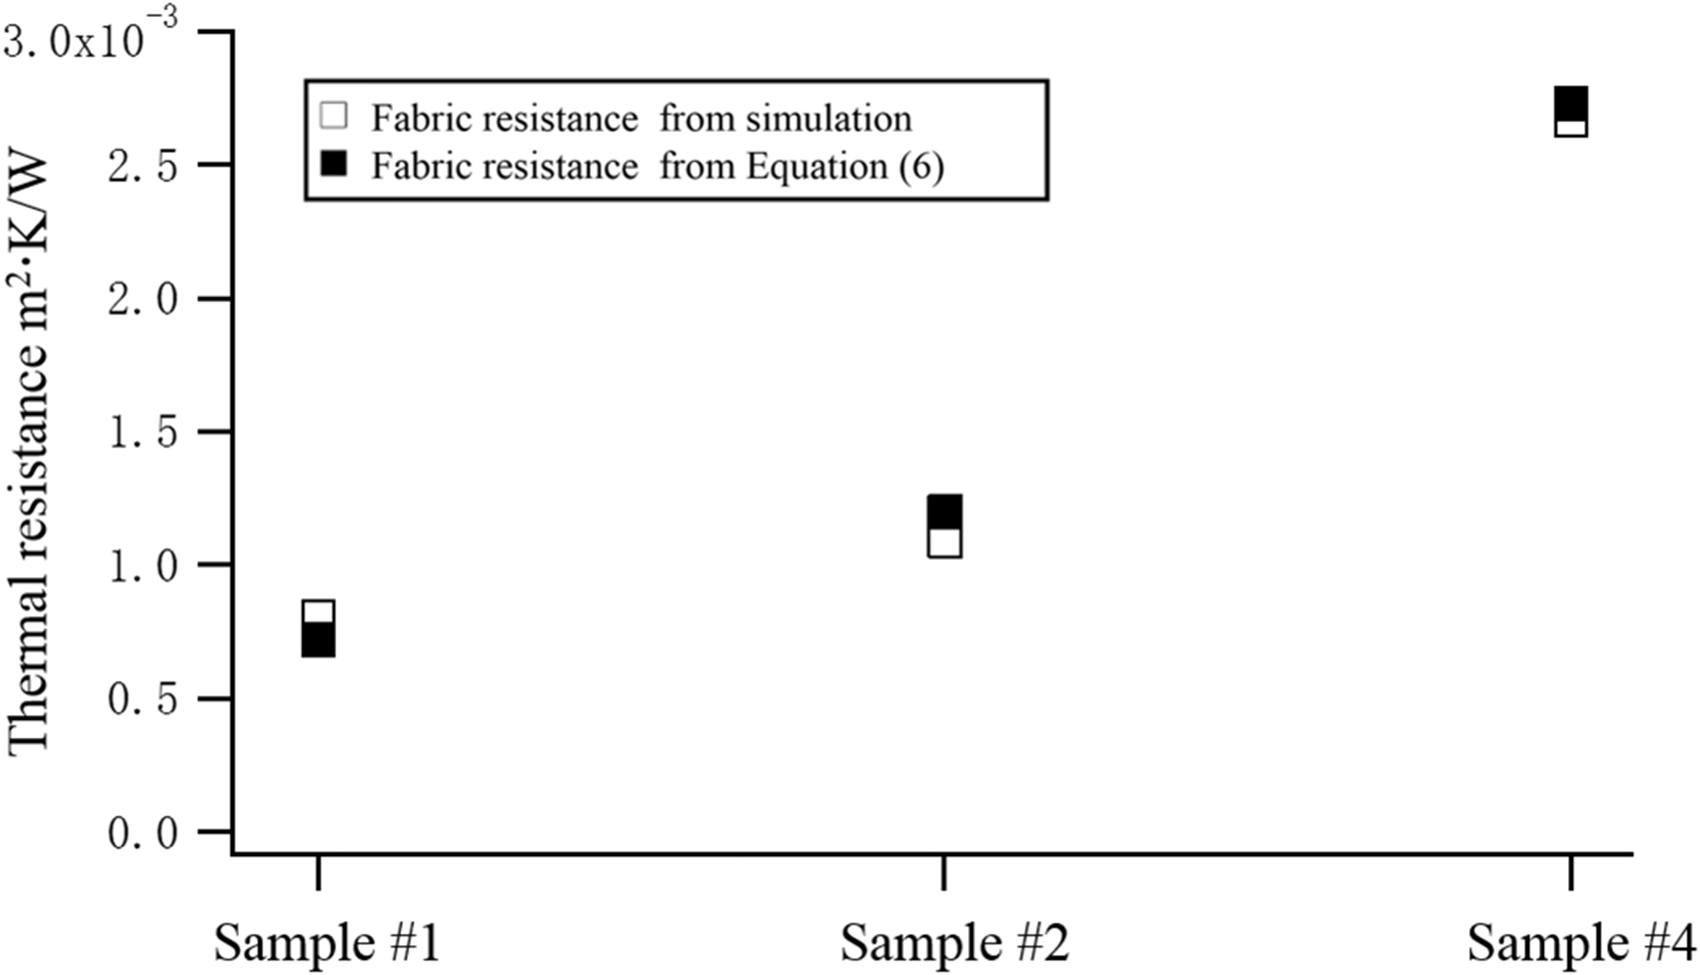

Relationship between the air layer thermal resistance and surface roughness

Fabric and air layer thermal resistance of samples calculated from Equation (6)
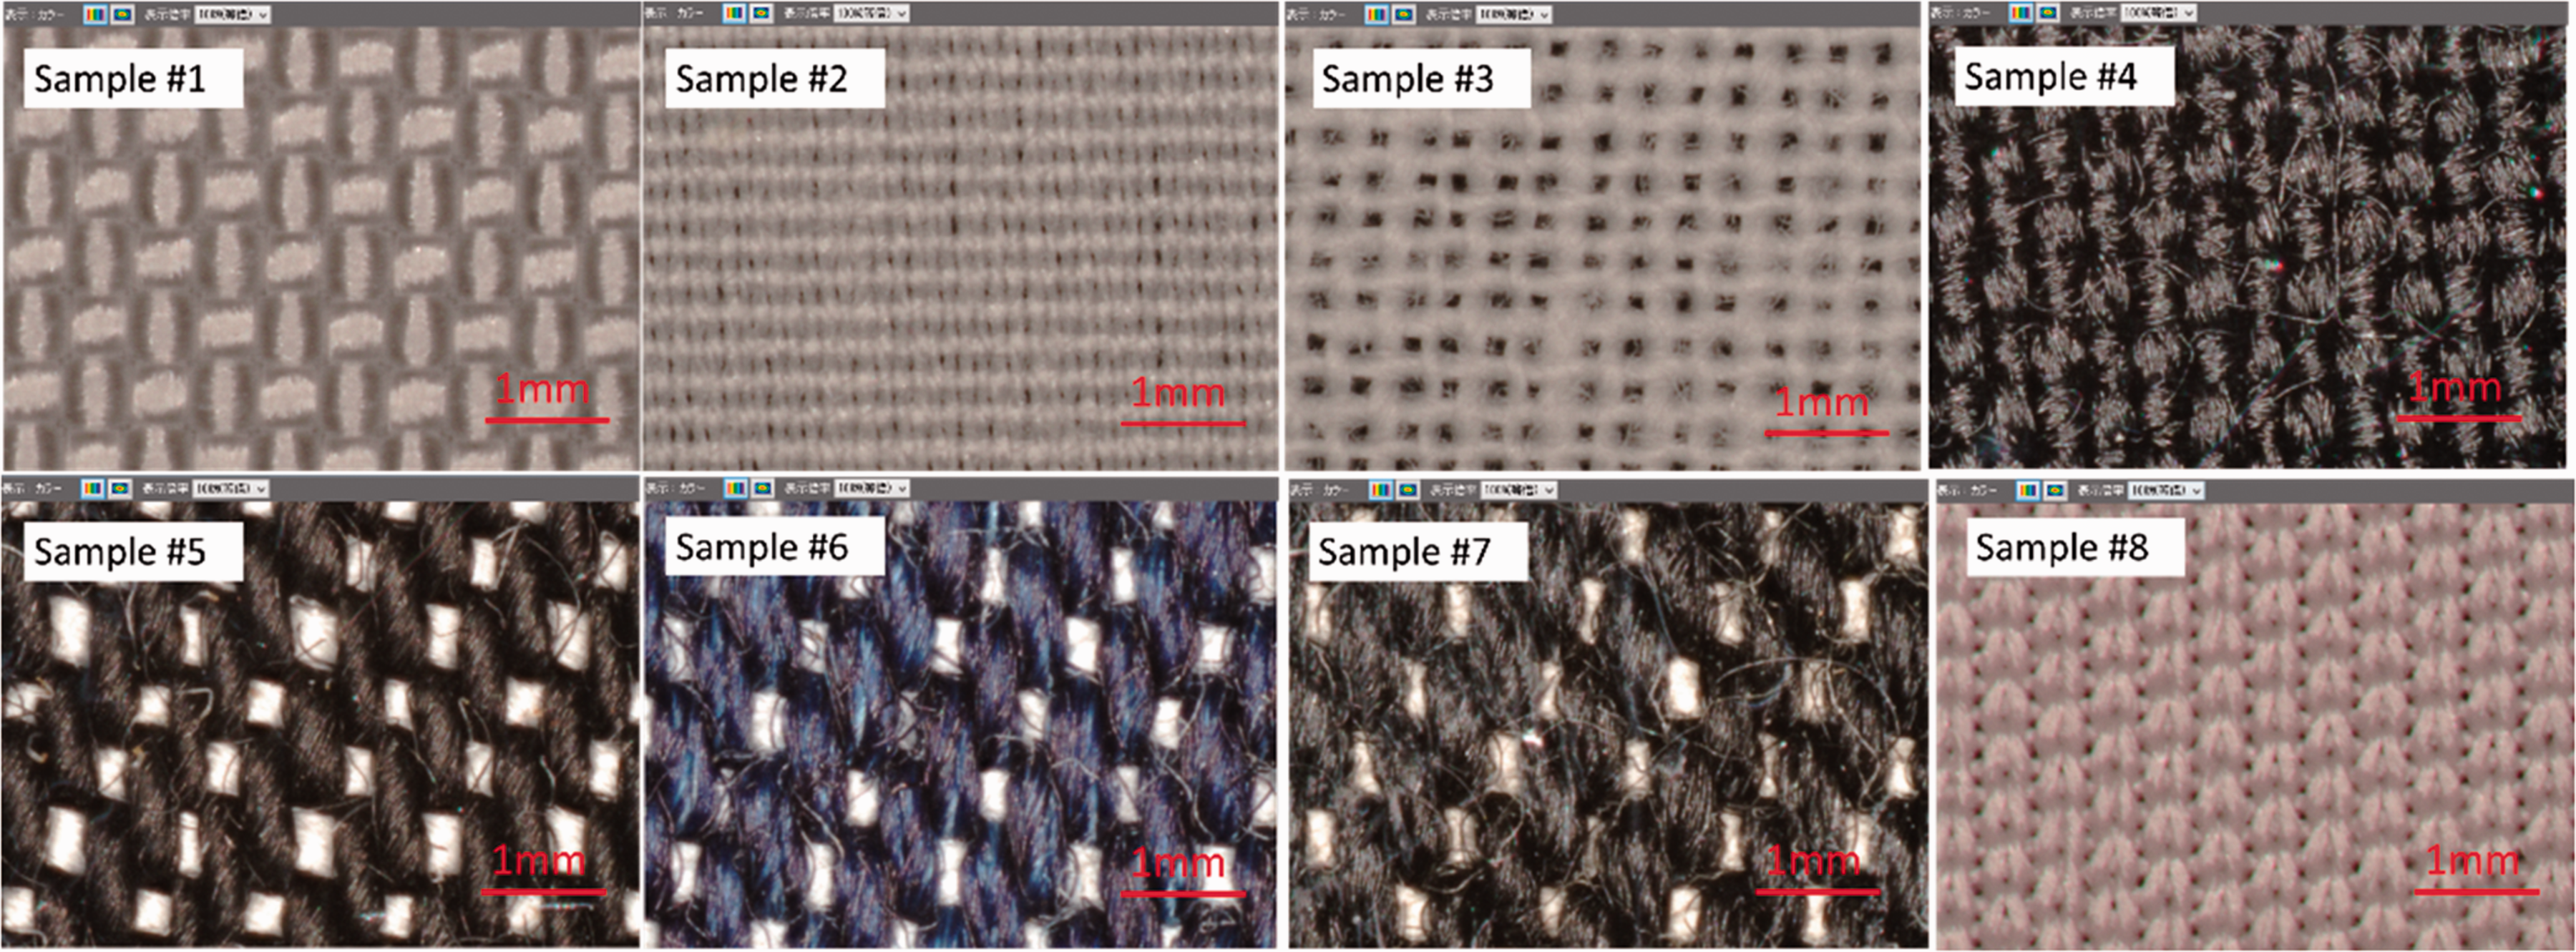
Surface micrographs of the samples.

Surface micrographs of Sample #5 measured by the three-dimensional microscope: (a) three-dimensional surface structure; (b) height distribution on the surface. (Color online only.)
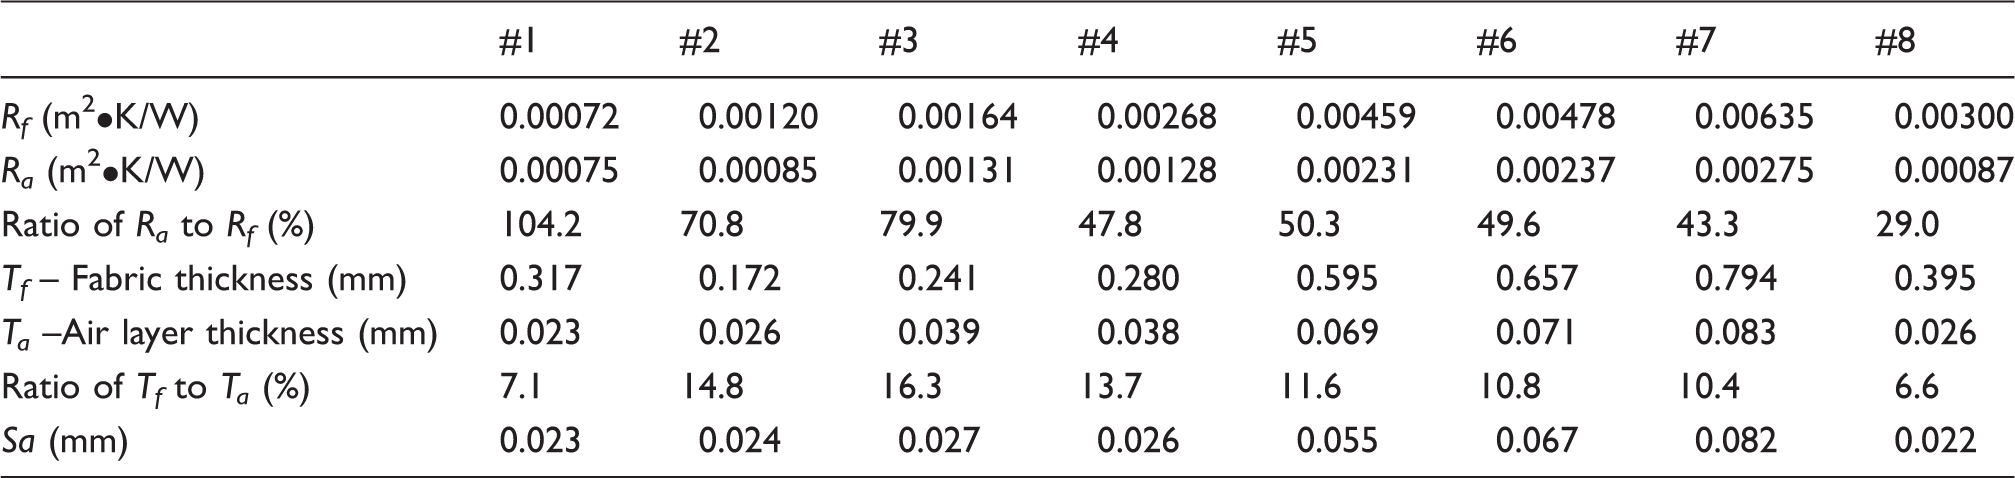
Sa is an absolute value that represents the difference in height of each point compared to the arithmetical mean of the surface. When the surface is rough, the difference in the height of each point becomes large and the value of Sa increases. Table 2 shows the value of Sa of each fabric. Samples #1, #2, and #8 show the smoothest surface and lowest value of Sa among the samples. Therefore, the air layer enclosed on the surface is thin and the obtained R
a
was low. Samples #3 and #4 also show low values of Sa, while they have a medium value of R
a
, if compared with other samples. For Sample #3, the low weave density meant that enough air was enclosed between fabrics, resulting in an increment of the air layer thermal resistance. For Sample #4, there were many projecting fibers on the surface, which made the fabric fluffy. These projecting fibers influenced the height distribution recorded by the 3D microscope, as shown in Figure 10. For the fabric with fibers on the surface, the difference in the height of each point became smaller, if compared with that without projecting fibers. Therefore, the projecting fibers decreased the obtained value of Sa. However, the projecting fibers may not contact with the surface very well and the air still exists between the fabric surface and the projecting fibers. This may account for the observed increase in the air layer thermal resistance. For Samples #5, #6, and #7, high air layer thermal resistance was observed, which was due to the twill weave structure and rough surface of these samples.
Height distribution of the surface without projecting fibers (a) and with projecting fibers (b).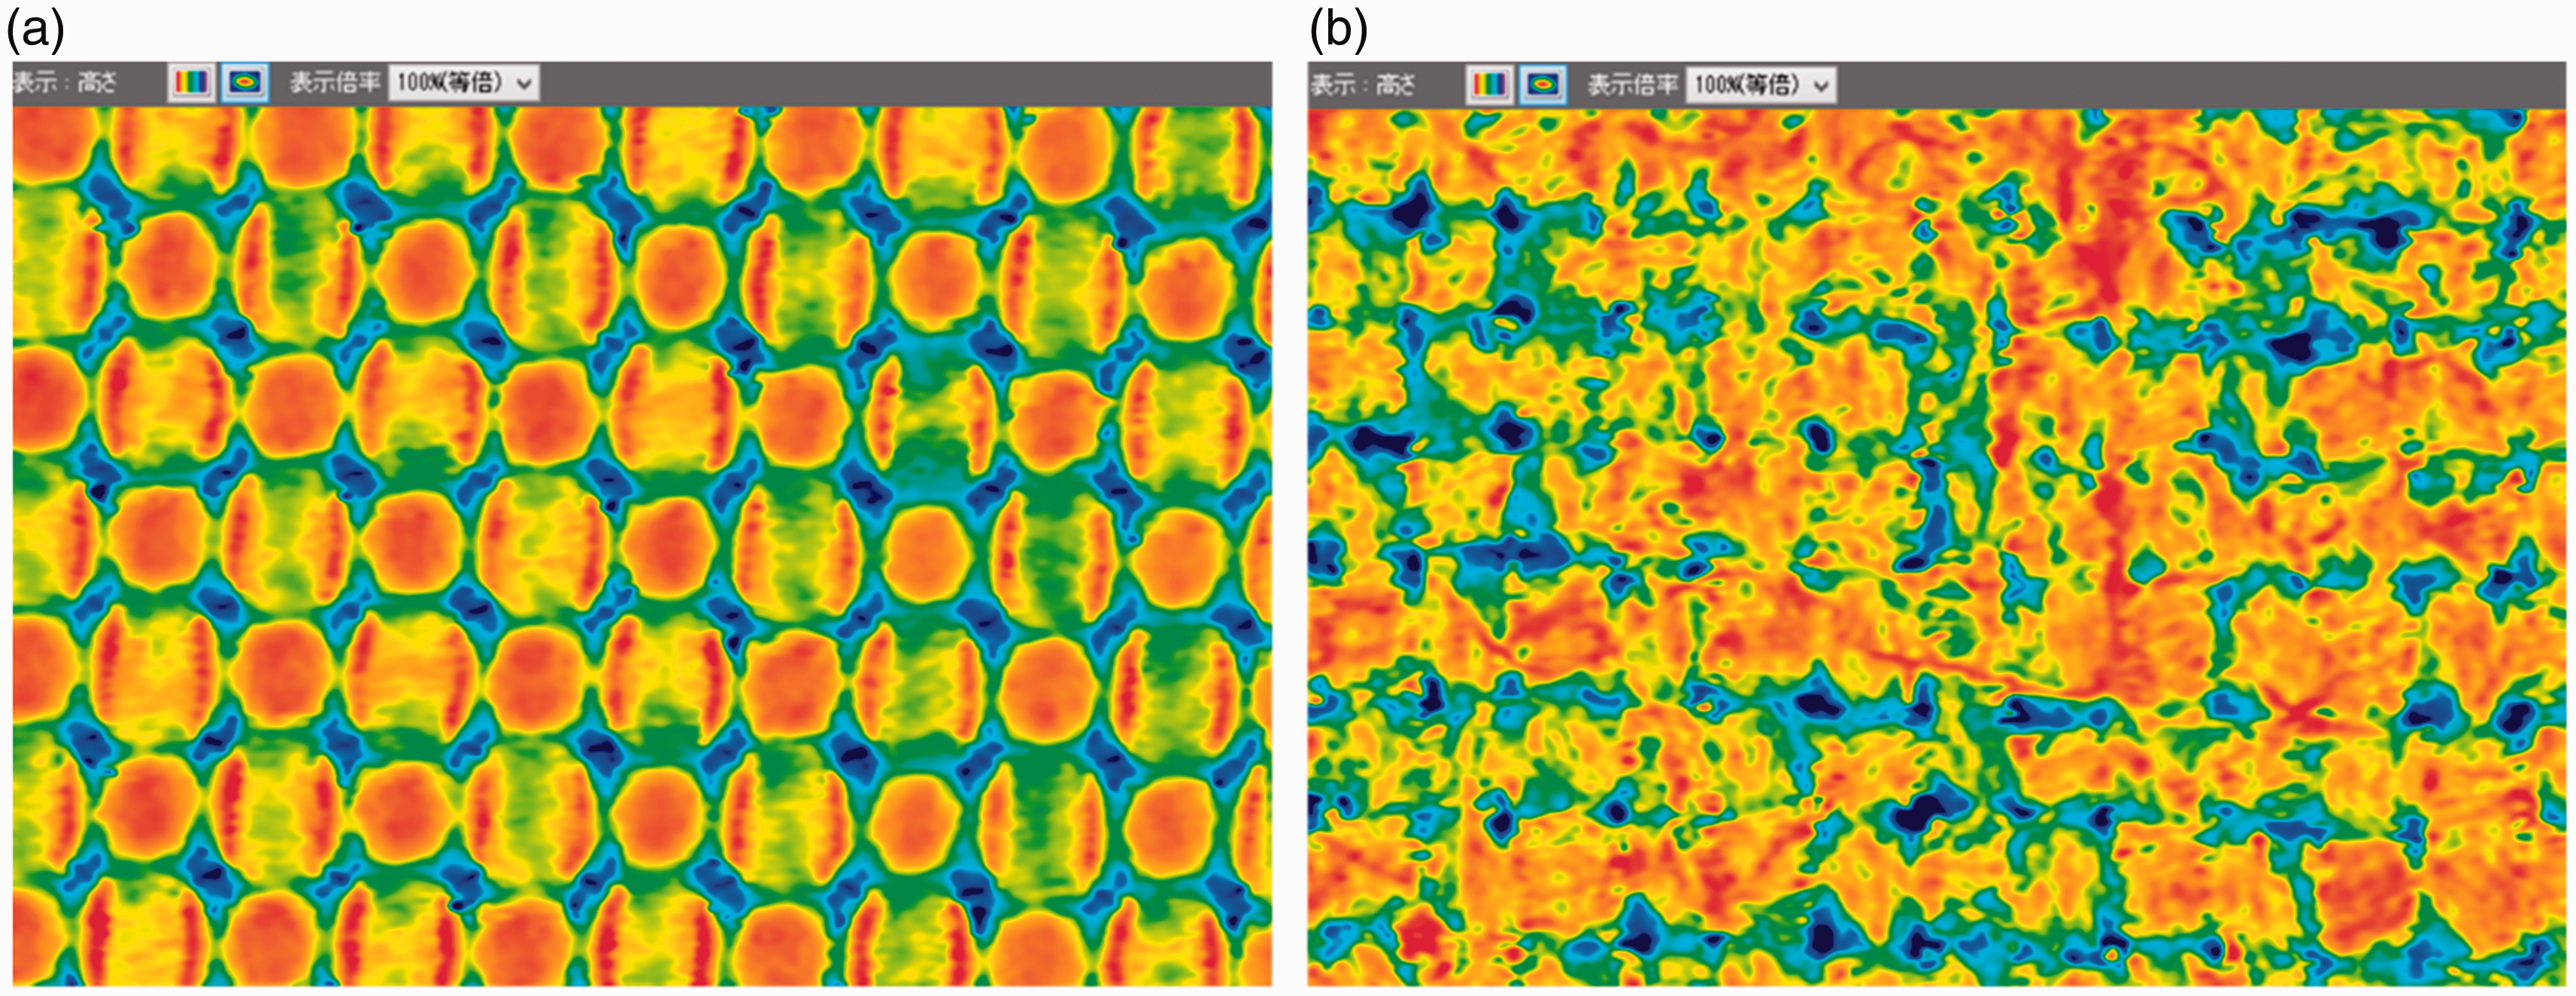
The surface roughness (Sa) is plotted against the air layer thermal resistance (R
a
) in Figure 11. The correlation coefficient between Sa and R
a
was calculated and it was 0.932, which suggested that the air layer thermal resistance was strongly related to the surface roughness. Moreover, the value of R
a
increases with the surface roughness for all samples, and a linear relationship was found when Sa ranged from 0.022 to 0.082 (mm).
Dependence of the air layer thermal resistance on surface roughness.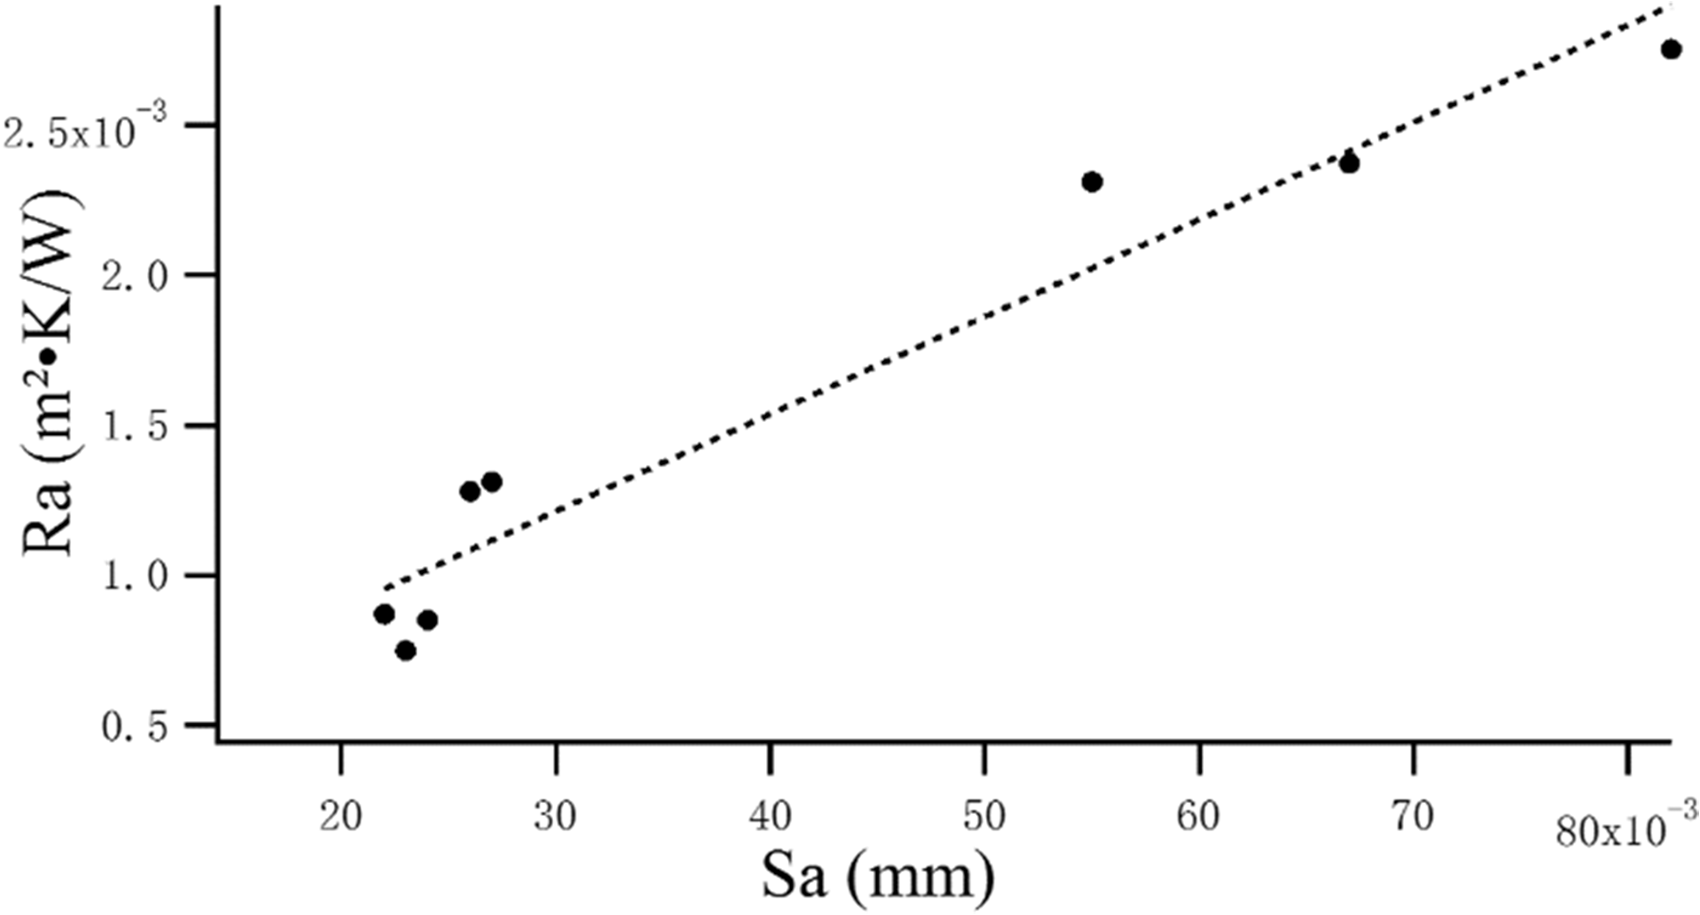
Table 2 also shows the ratio of the air layer thermal resistance (R a ) to the fabric resistance (R f ), which ranged from 29% to 104.2%. This result indicated that the enclosed air layers at the interface played an important role in enhancing the thermal insulation of the fabrics. Moreover, the average thicknesses of the air layer (T a ) between fabrics were also calculated, and it ranged from 6.6% to 14.8% of the fabric thickness (T f ).
The air layer thermal resistance between different fabrics
For multiple layers stacked by different fabrics, the interface between layers was related to the surface roughness of both fabrics and, therefore, the air enclosed at the interface varied. Figure 12 shows the air layer thermal resistances (as marked by circles) between some different fabrics. The values between the same fabrics were also plotted, as marked by squares. The results suggested that when two fabrics had close values of air layer thermal resistance, the air layer thermal resistance between them tends to be the mean value of the individual values. For example, the air layer thermal resistances enclosed on Samples #2 (Ra22) and #4 (Ra44) were 0.00085 and 0.00128 (m2K/W), respectively. The value (Ra24) between them was calculated as 0.00107 (m2K/W), which was close to the mean value of these two samples. This indicated that when two fabrics have similar surface roughness, the air layer thermal resistance between them was decided by both fabrics. However, when two fabrics had significantly different values of air layer thermal resistance from each other, the air layer thermal resistance between them was close to the larger value of the two fabrics. For example, the air layer thermal resistances enclosed on Samples #2 (Ra22) and #5 (Ra55) were 0.00085 and 0.00231 (m2K/W), respectively. The air layer thermal resistance (Ra25) between them was calculated as 0.00209 (m2K/W), which was close to the value of Sample #5. This indicated that when two fabrics had the different surface roughness, the air layer thermal resistance between them was mainly decided by the fabric with the rougher surface. This result gives support to our estimating Equation (6), such that it was possible to assume the air layer thermal resistance between the fabric and fabric (R
a
) has the same value as that between the fabric and the metal plate ( Air layer thermal resistances between different fabrics.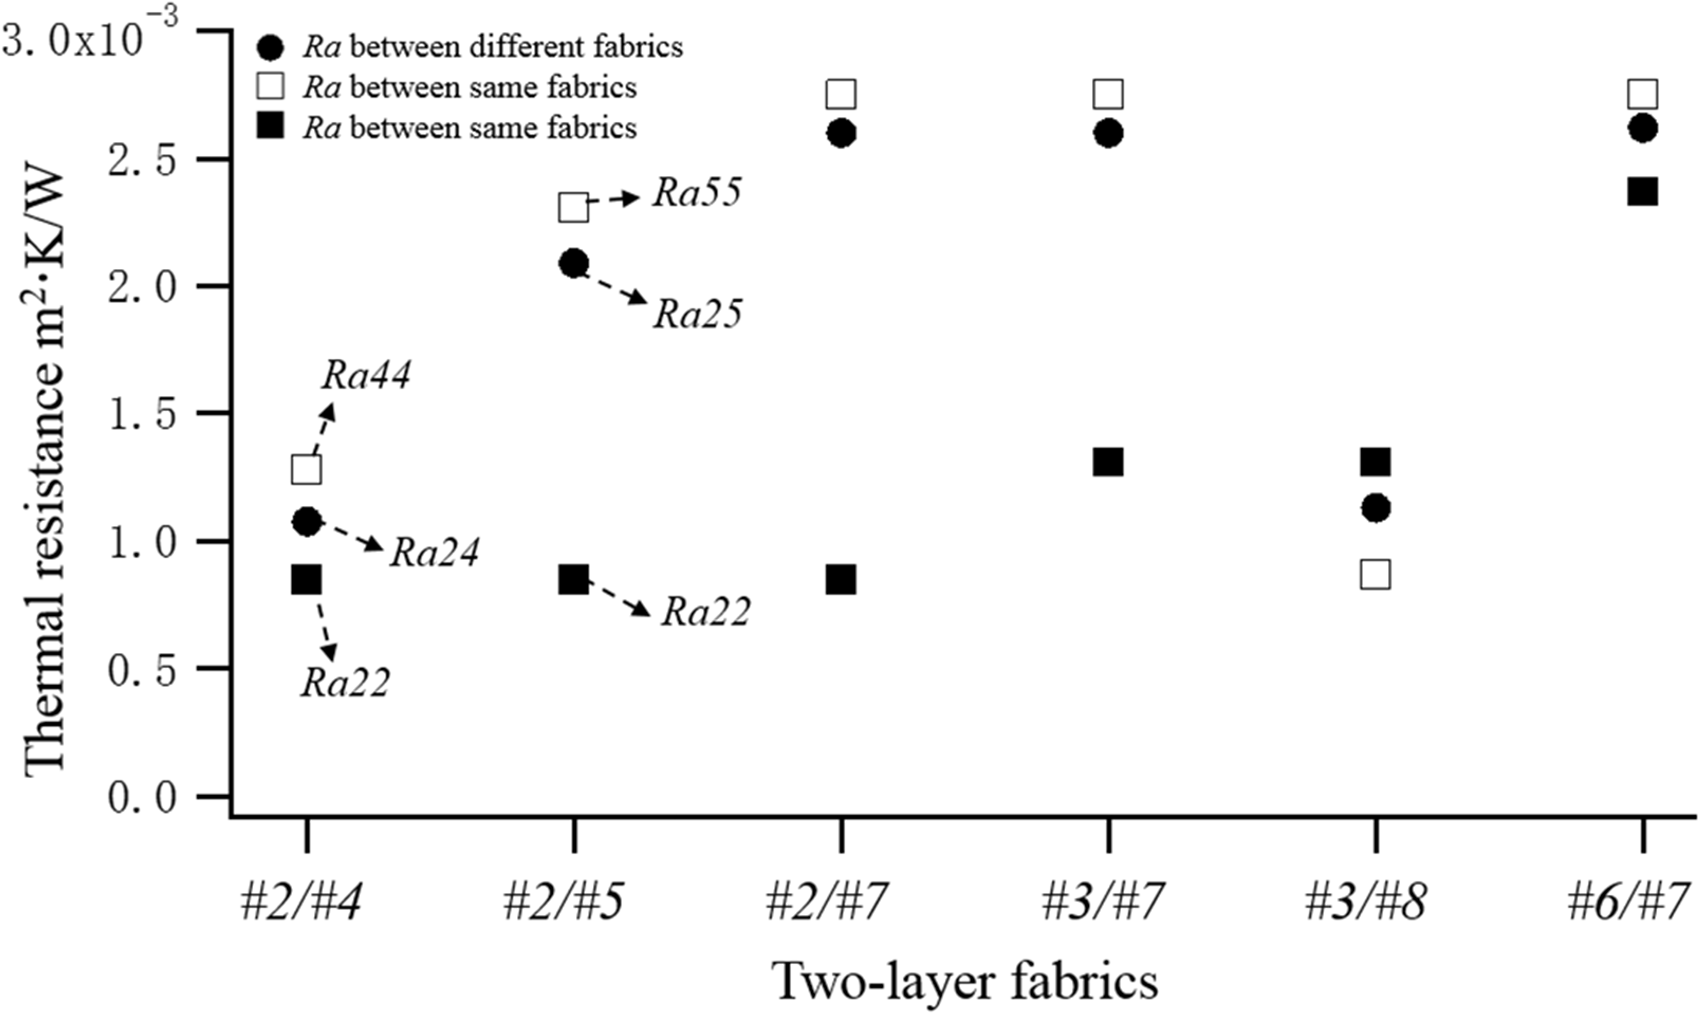
Thermal resistance of multilayer fabrics predicted by the estimating equation
When the R
f
and R
a
values of the fabric were obtained, Equation (6) can also be used to predict the total resistance of multilayer fabric (with different layers). Figure 13 shows the thermal resistance of multilayer fabrics (R
N
) obtained by adding the values of the individual fabrics measured in the experiment and calculated by Equation (6). The added values were consistently larger than the measuring and estimating values. The significant difference suggested that we cannot predict the resistance of multilayer fabrics by adding the values of individual fabrics. This was because the surface of the fabric was rough and the air layer between fabrics influenced the result. Only slight differences between the values from the estimating equation and measurement were observed in all the eight samples. The average difference ratio between the two sets was calculated as 1.2(%). The good agreement between the two sets of results confirmed the validity of the estimating equation, and it was possible to predict the resistance of multilayer fabrics by this equation. In addition, the values from the estimating equation were slightly higher than the experimental values when there were more layers of fabrics. This was because in the experiment, the heat loss from the edges became more significant as the total thickness increased,
23
whereas in the estimation, such heat loss was ignored.
Thermal resistance of multilayer fabrics obtained by adding the values for the individual fabrics, measured in the experiment and calculated by the equation.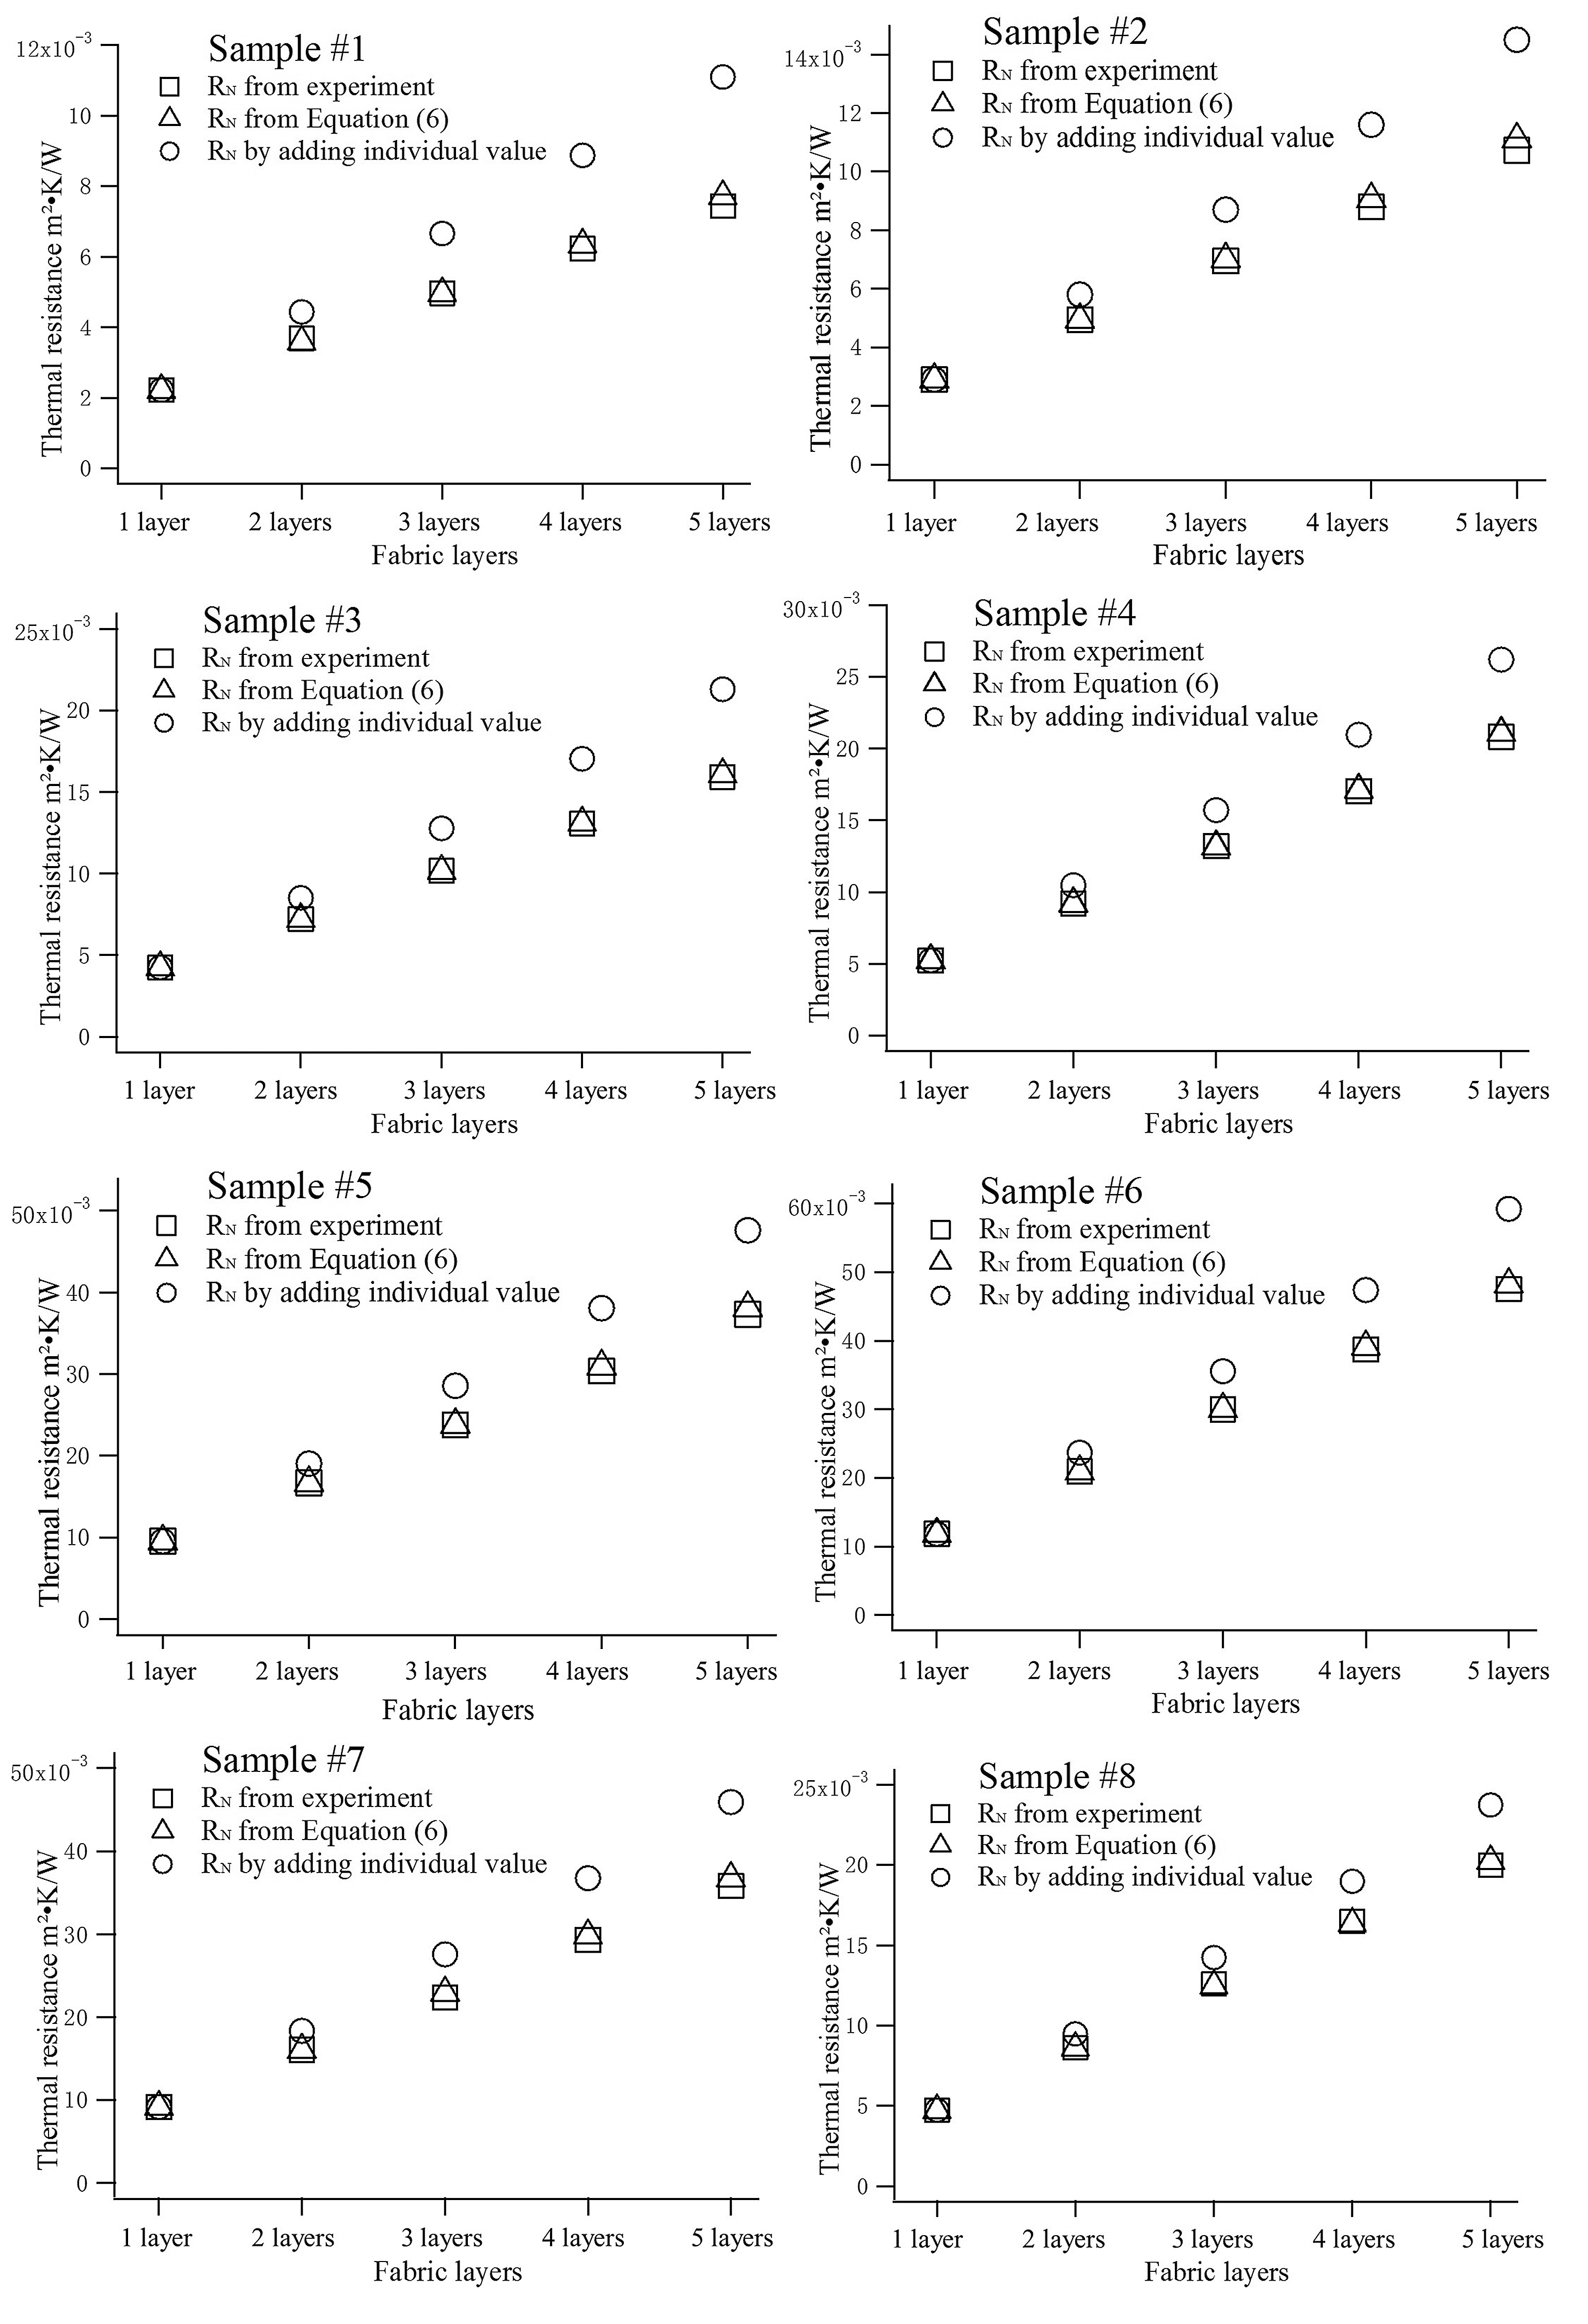
Conclusion
A 3D homogeneous model was constructed in this study and it was used to calculate the thermal resistance of fabrics. In this model, the air layer between the fabric and metal plate was ignored and the result obtained from the simulation was independent of the air. The Thermolab II Tester KES-F7 was also used to measure the thermal resistance of fabrics. During the measurement, an air layer existed at the interface of multilayer fabrics. Therefore, the result obtained from the experiment was influenced by the air layer. By comparing the thermal resistance from the simulation and experiment, the air layer thermal resistance was determined. Then the equation from which the fabric and air layer thermal resistance can be obtained was developed. The advantage of this equation was that the fabric and air layer thermal resistance can be calculated only based on the result from experiment, and the simulation results were not required.
The main results are as follows.
The surface roughness of fabrics was strongly related to the air layer thermal resistance, and a linear relationship was observed. For multiple layers stacked by different fabrics, the air layer thermal resistance between them was mainly decided by the fabric with the rougher surface. In addition, the projecting fibers on the surface can make the fabric fluffy and increase the air layer thermal resistance. According to the results obtained from the estimating equation, the ratio of the air layer thermal resistance to the fabric resistance ranged from 29% to 104.2%, which indicated that the enclosed air layers played an important role in enhancing the thermal insulation of fabrics. The total resistance of multilayer fabrics was also predicted in this study. The values were compared with the experimental results and good correlation between them was observed. The slight difference between them was caused by heat loss from the edges in the experiment.
Footnotes
Declaration of conflicting interests
The authors declared no potential conflicts of interest with respect to the research, authorship, and/or publication of this article.
Funding
The authors disclosed receipt of the following financial support for the research, authorship, and/or publication of this article: The authors wish to acknowledge the National Natural Science Foundation of China (No.51673036).