
Abstract
This paper aims to predict the hand values (HVs) and total hand values (THVs) of functional fabrics by applying the fuzzy logic model (FLM) and artificial neural network (ANN) model. Functional fabrics were evaluated by trained panels employing subjective evaluation scenarios. Firstly, the FLM was applied to predict the HV from finishing parameters; then, the FLM and ANN model were applied to predict the THV from the HV. The estimation of the FLM on the HV was efficient, as demonstrated by the root mean square error (RMSE) and relative mean percentage error (RMPE); low values were recorded, except those bipolar descriptors whose values are within the lowermost extreme values on the fuzzy model. However, the prediction performance of the FLM and ANN model on THV was effective, where RMSE values of ∼0.21 and ∼0.13 were obtained, respectively; both values were within the variations of the experiment. The RMPE values for both models were less than 10%, indicating that both models are robust, effective, and could be utilized in predicting the THVs of the functional fabrics with very good accuracy. These findings can be judiciously utilized for the selection of suitable engineering specifications and finishing parameters of functional fabrics to attain defined tactile comfort properties, as both models were validated using real data obtained by the subjective evaluation of functional fabrics.
Quality control, product inspection, the set up of product specification details, and determining the market value of functional clothing goods should consider the tactile comfort properties besides other comfort dimensions. The quality of fabric can be judged by means of the reaction obtained from the sense of touch/handle. Fabric hand can be defined as people's sensory response toward the combined properties of physical, physiological, psychological, and social reactions toward fabric. Alternatively, it can be defined as people's response toward roughness, smoothness, hardness, etc., while the total hand value (THV), which is the major component of the quality of the fabric, 1 is the perception of the human beings to the total comfortableness or the reverse side of the fabric during wearing. The tactile perceptions of the textile can be ranked by trained panels in order to suit the quality needs of the consumer or to obtain manufacturing parameters, as claimed by Pense. 2 During attaining tactile perceptions with human skin, the various combinations of design factors could be provided on the basis of the contact mechanics of the functional textile fabrics with human skin in order to get functional fabric products with the best quality and wearability.
For tactile comfort evaluation, a textile product could be judged using subjective (human panel) or objective (instrumental measurement) means or combinations of these two methods. Tactile sensory evaluation, which centers on subjective assessment, has been applied for grading the tactile comfort of textile materials by employing a defined set of human panels.3–7 The sensory evaluation has been achieved by choosing textile material surface property descriptors, such as rough, smooth, soft, and other attributes. However, subjective evaluation gives only qualitative data unless analyzed by statistical methods. 8 Furthermore, measuring the low-stress mechanical properties of textile products is also possible using Kawabata evaluation system (KES) 9 and fabric assurance by simple testing (FAST) 10 methods. The obtained data set using these instruments can be correlated with subjective evaluations of tactile comfort (handle).
Some statistical applications, such as principal component analysis (PCA), have been utilized to optimize and examine the sensory properties.11,12 PCA has been used to reduce the big data provided by panels with negligible information loss. Moreover, statistical techniques, such as the regression model,13,14 Weber–Fechner law, 15 and Steven's power law, 16 have been utilized to analyze tactile perception. However, there are a few limitations on these statistical techniques based on the report by Zeng et al. 17 The above-mentioned classical computing techniques depend on a great number of data points or they are unable to solve complex relations.
Most recently, many scholars have been employed the fuzzy logic model (FLM) and artificial neural network (ANN) model to predict the hand values (HVs) of textile materials.11,18–23 Intelligent prediction systems have the potential to change the subjective evaluation methods to analyzable data sets. Furthermore, these methods are more effective, simple, and suitable for HV prediction. The use of fuzzy logic for the prediction of the tactile property of textile products is widely increasing, starting from the its introduction by Zadeh. 24 The knowledge-based information has been utilized to understand the existing situation in the fuzzy logic approach. 22 The effect of textile finishing on textile hand can be predicted using a fuzzy logic system. 25
Fuzzy logic applies logical operators and the ‘if–then’ rules to establish the qualitative association between variables.
26
The fuzzy logic system is another paradigm shift that extends the crisp set concept to a set that permits an object that can belong partially to a set, called a fuzzy set. This means an object in a fuzzy set may not necessarily to be a member of a set. For example, letting U be a scope of objects x, a fuzzy set A is defined by the set of unions as follows:

The scope U is named as the universe of discourse, and a function μA(x) represents the membership function (MF).
In this paper, we extend the application of FLM and ANN tools from ordinary to functional fabrics. The FLM and ANN model were applied for the prediction of THV from the sensory attributes (HVs) of functional fabrics, which were rated by trained panels. Furthermore, the HVs of the functional fabrics were predicted from numerous finishing parameters, such as inkjet printing, three-dimensional (3D) printing, screen printing, coating, and knitting, utilizing an input data and the HV using an output data using fuzzy logic.
Experimental details
Materials
Production details and surface properties of functional fabrics

K/S: color space; SR: surface resistance; PET: polyester fabric; EM: electromagnetic shielding; ELD: electroluminescence device; EEG: electroencephalogram; ECG: electrocardiogram; UV: ultraviolet; 3D: three-dimensional.
Methods
Sensory evaluation
The sensory and overall hand performance tests for the functional fabrics were carried out by trained panels using visual subjective evaluation (VSE) and blind subjective evaluation (BSE) scenarios. Ten panelists, aged between 23 and 54, from GA Technical University of Iasi (Romania) with a textile background, were recruited based on their voluntariness and experience. The panelists were brainstormed about the bipolar attributes, rating scale, handling system, rating methods, and evaluation protocols based on AATCC evaluation procedure 5-2011. Defined criterions of sensory bipolar attributes of HVs, such as warm–cool (WC), itchy–silky (IS), sticky–slippery (SS), rough–smooth (RS), hard–soft (HS), thick–thin (TT), non-compressible–compressible (NCC), non-stretchable–stretchable (NSS), heavy–light (HL), and stiff–flexible (SF), were used to evaluate the HVs. A box with two holes was provided for BSE, while the panelists were kindly requested to squeeze, touch, and move back and forth their hands to rate the given samples. The panelists were asked first to differentiate among the two bipolar attributes (for instance, whether the fabric feels warm or cold), then they were invited to rate (for instance, if they rate warm, then they were asked to give numbers from 0 to 4; if they rate cold, they were asked to rate from 6 to 10; on the other hand, if they rate in between warm and cold, the facilitator provided scale 5, based on the definition of the scales mentioned below).
Attributes and scales for total hand value (THV) evaluation
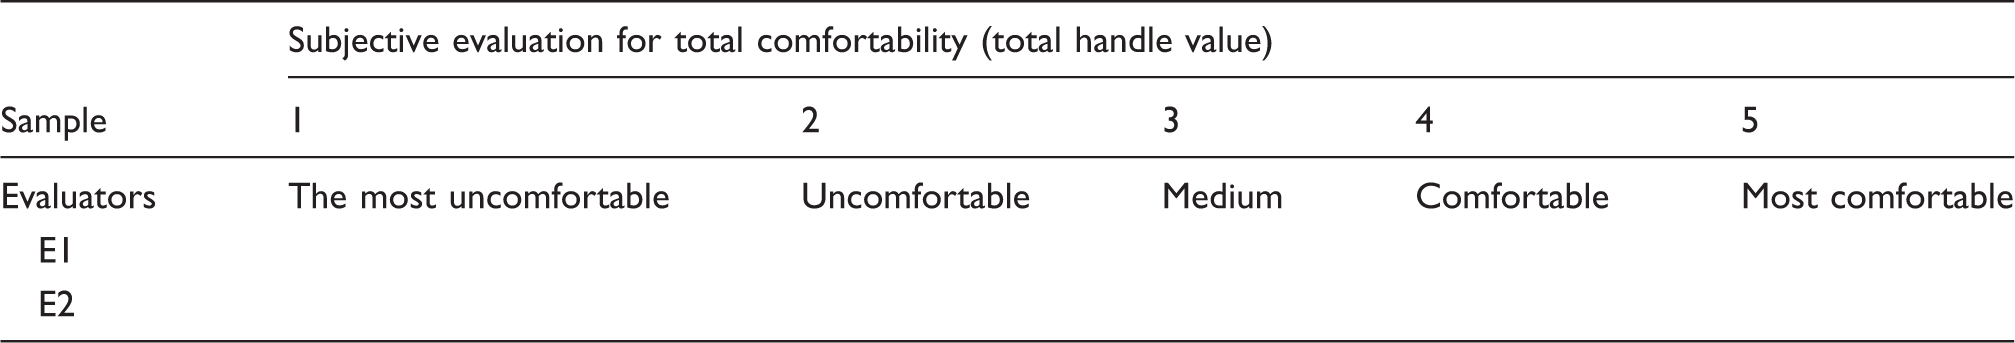
Figure 1 shows the overall structure of this article. The coating and inkjet printing parameters were included as an example to indicate how the FLM prediction uses a data source for HV estimation.
An illustration showing (a) conductive solution preparation, (b) the making of conductive samples using coating and inkjet printing, applying various parameters, and (c) subjective evaluation by 10 trained panelists (e.g. rough–smooth bipolar descriptors). The various finishing parameters and optimized (F1 and F2) rated hand values (HV
y
) using principal component analysis (PCA) were utilized to obtain predicted hand values (HV
p
) using the fuzzy logic model (FLM). Then the HV
y
values were employed to predict the total hand value (THV) using the artificial neural network model and FLM, where the Pearson correlation coefficient (Pearson's r) was applied to choose the significant HV
y
values for THV prediction. HV: hand value; PEDOT-PSS: poly(3,4-ethylenedioxythiophene) polystyrene sulfonate.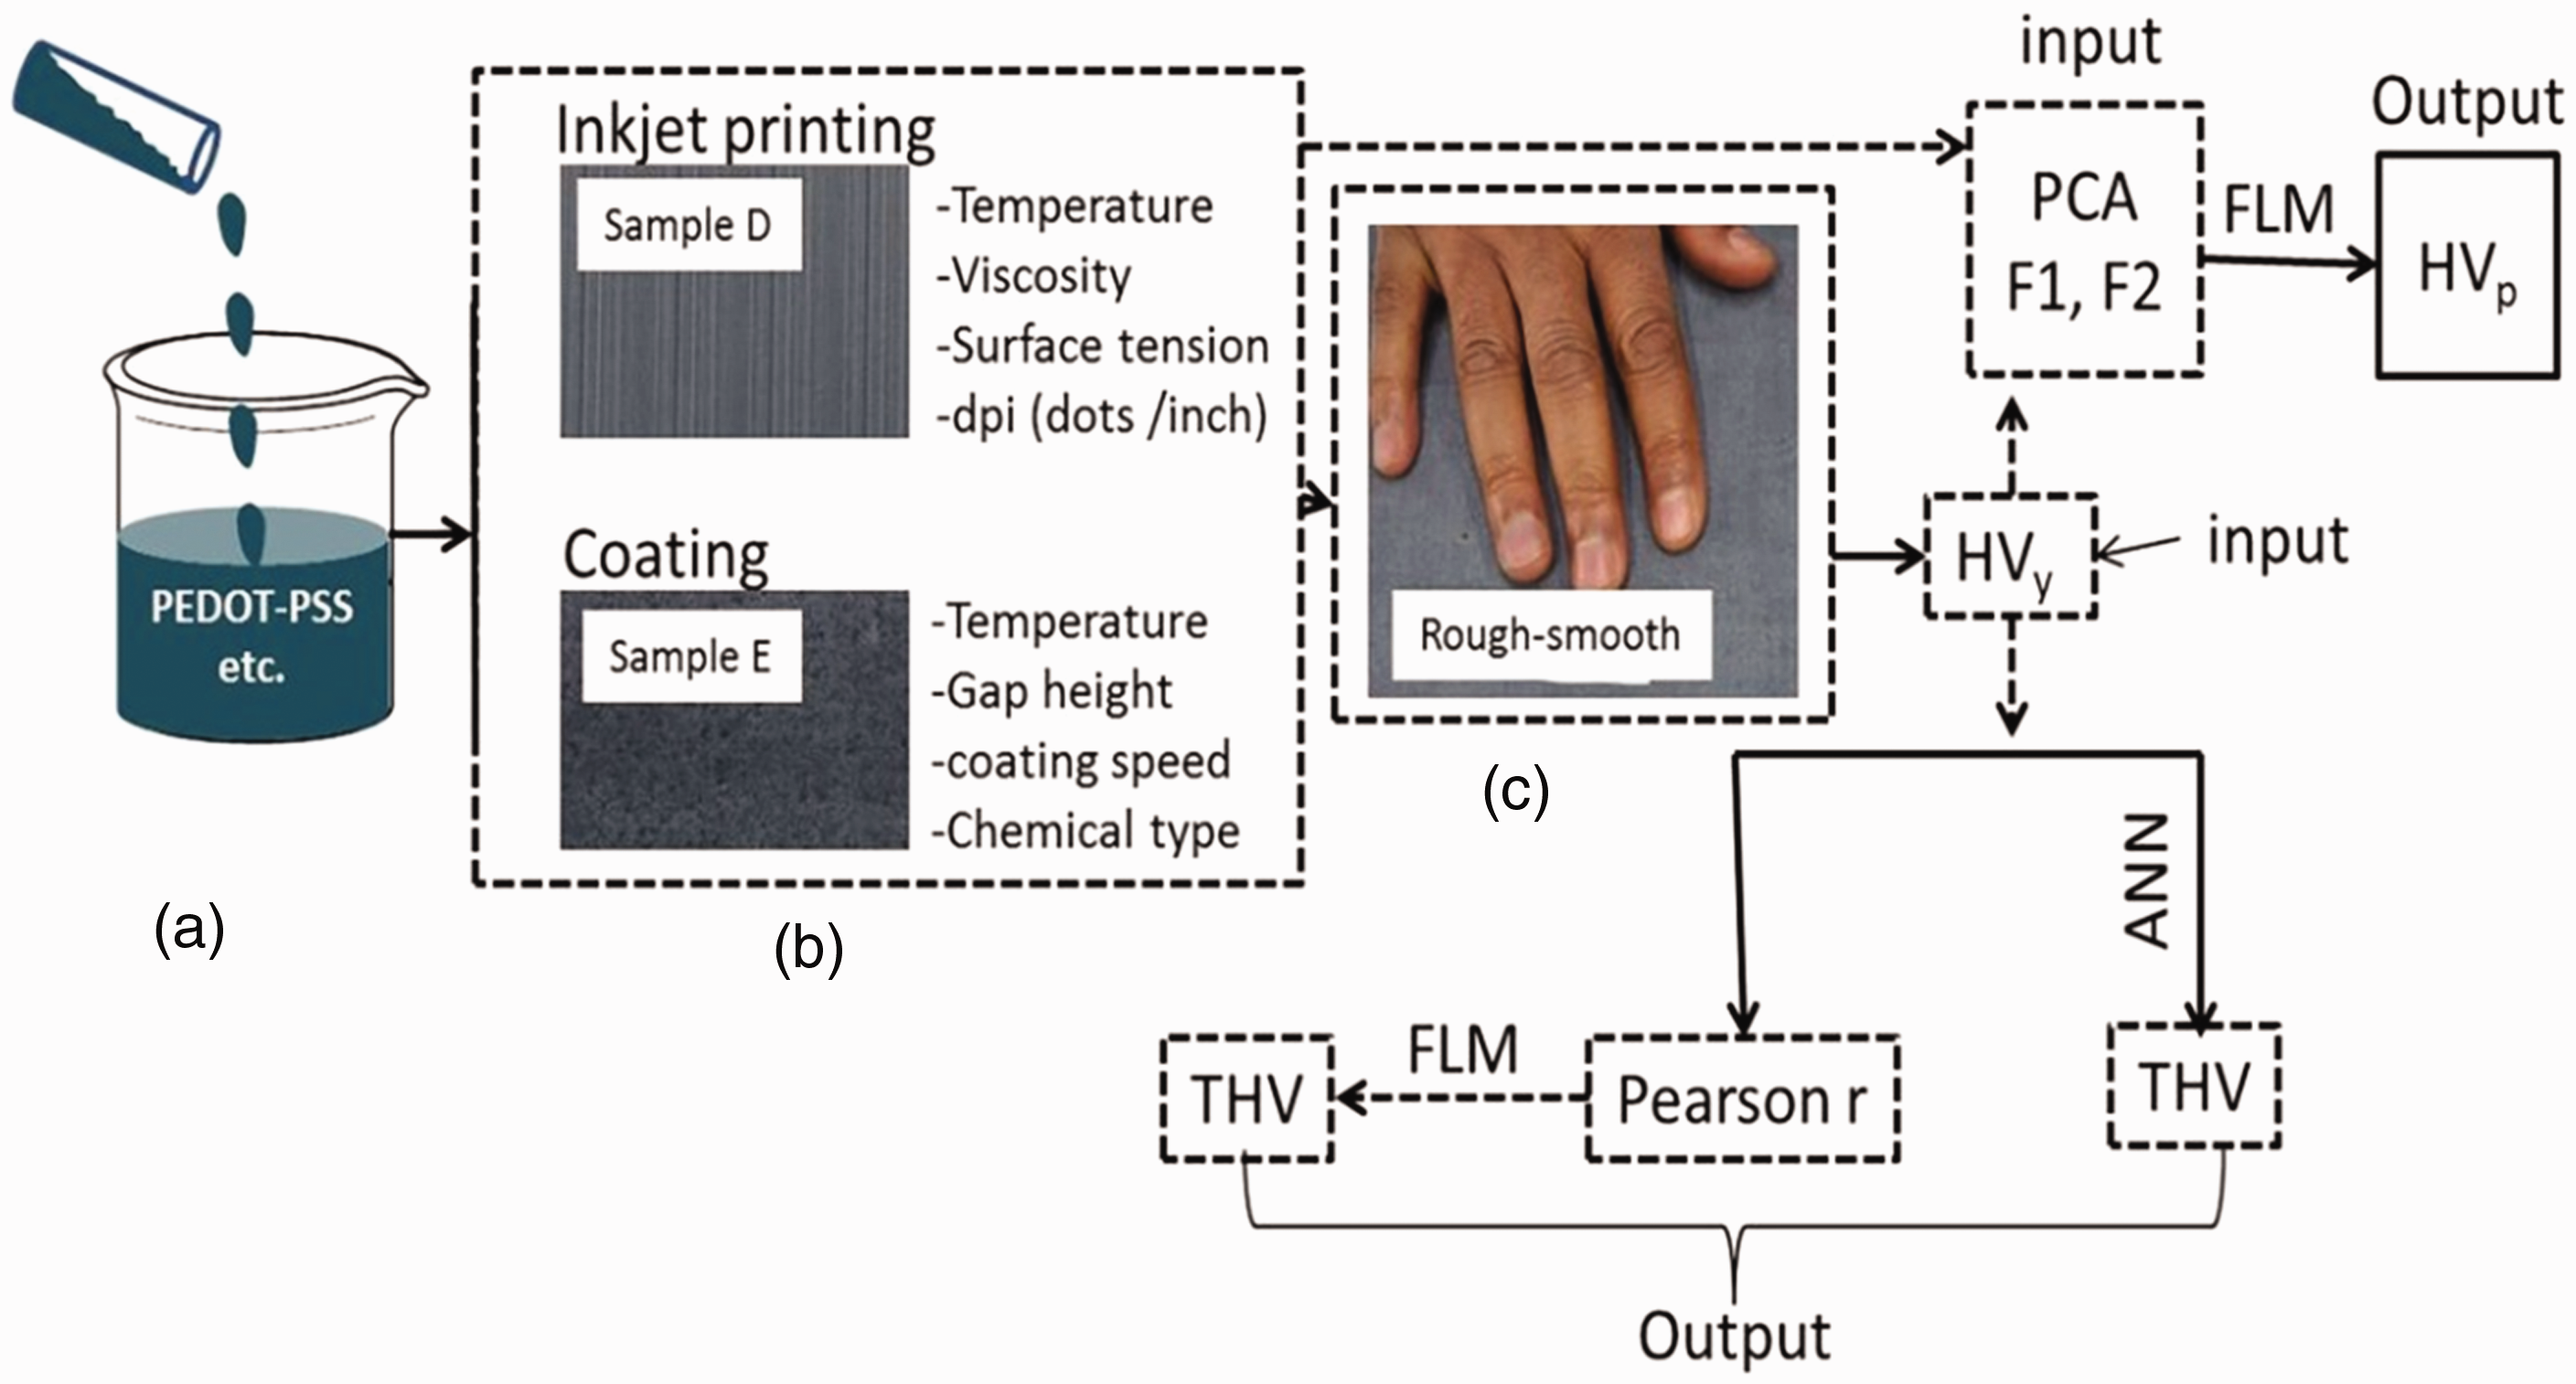
Fuzzy logic modeling
The theoretical aspects of the fuzzy sets have been defined and explained well by various textbooks, including Klir and Yuan
27
and Zimmermann.
28
The fuzzy sets are an extension of crisp sets in which variables are right or wrong, short or long, and 0 or 1. However, in fuzzy logic theory, a fuzzy set covers a partial MF that varies from 0 to 1 to describe uncertainty for classes that do not have clearly defined boundaries. A MF for each fuzzy set can be generated, which is a typical representation that converts the input, in this case, HV, from 0 to 1 to quantitative values, called ‘fuzzification.’ For this paper, the Mamdani technique
29
was applied to convert the qualitative data set into an interpretable one. Furthermore, the trapezoidal MFs were chosen for demonstration. The trapezoidal MF can be defined by four parameters {a, b, c, d} as follows using min max

The parameters with Trapezoidal membership functions (MFs).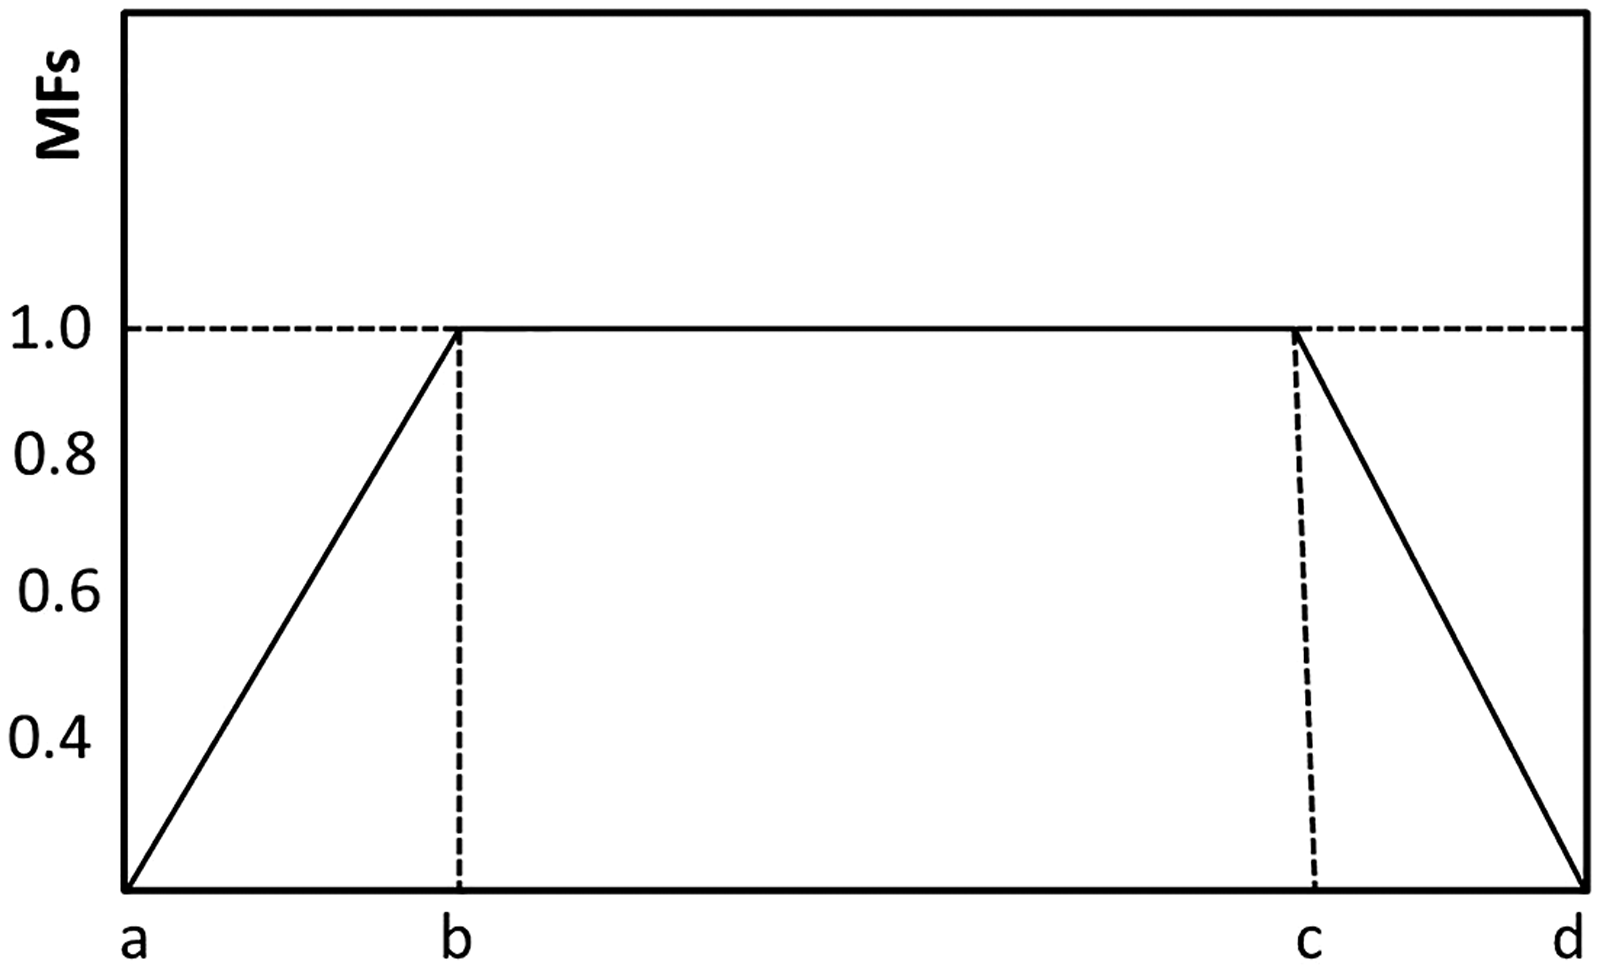
We choose the trapezoidal MF as it applies a simple formula and has worthy computational efficiency, contains four parameters, and is used extensively in real-time implementations. In addition, a straight line MF has the advantage of simplicity.
Then fuzzy rules were established using phonological terms, which provide a quantitative representation of fuzzy input and output data sets. Mamdani rules, ‘if–then,’ were established by utilizing two input variables (HVs) to describe the single output (THV). Mamdani rules were established as follows

Artificial neural network
The ANN has been applied to predict the subjective comfort of technical textiles.22,31 THVs for each fabric were predicted using an ANN by applying the feed-forward backpropagation algorithm (FFBP) method following the rules in Wong et al. 22 and Luo et al., 32 and the mean square error (MSE) was utilized to evaluate the prediction performance. Gradient descent with momentum and adaptive learning rate training with 1 × 10³ epochs was employed. The depiction of the ANN function was performed with max-fail of 1 × 10³. The ratings of WC, IS, etc., given by a panel are considered as input vectors and the overall hand (THV) results given by panelists were taken as the target values. The sample values were equivalent to the input values that were implemented to predict the target values. The network was trained in MATLAB®. Similarly, network simulation was carried out to predict the sample data. In this study, we chose the FFBP structure for our simulation architecture. Since the ANN is flexible and an arbitrary number of input variables are possible,21,33 10 fabric hand properties were fed into the input layer. Then they propagate via the hidden layer to reach the output layer. Furthermore, based on the internal and external information that flows in the network, the ANN is an adaptive system and changes its structure during the learning phase. 34
Selecting significant HVs for THV prediction
Selected hand value for total hand value prediction using fuzzy logic modeling

WC: warm–cool; HL: heavy–light; HS: hard–soft; RS: rough–smooth; IS: itchy–silky; NSS: non-stretchable–stretchable; SF: stiff–flexible; SS: sticky–slippery; TT: thick–thin.
As shown in Table 3, the correlations between the bipolar descriptors to each fabric sample are different. It is worth mentioning that each fabric sample has different surface properties due to the exploitation of various finishing parameters, such as temperature, chemical concentration, methods of applications, and much more. That is why each fabric sample possesses different correlations results.
For example, let y be the actual output THV given by the panels, p be the predicted value using fuzzy logic, and z = (z1, z2, z3) are the bipolar descriptors (input values) chosen by Pearson correlation, respectively. Then, from N fabric samples, we get n output predicted data denoted by P = (p1, p2…, P n ), n actual output data denoted by y = (y1, y2…, y n ), and Z = (z1, z2…, z n ) input data points. Our goal to this section was to choose the most significant bipolar descriptors so that our prediction performance could be superior. After selecting the relevant HVs, THVs were predicted from the HVs using the FLM. In the future, a large number of functional fabrics can be produced so that a large data set can be used to predict the tactile comfort of the functional fabric and an adaptive neuro-fuzzy inference system (ANFIS) can be used to effectively predict the subjective data.
Results and discussion
The subjective evaluation provides imprecise data describing the functional fabric hand. Hence, its interpretation with respect to quantifiable data should be exploited. In this paper, we have considered the subjective evaluation results of functional fabrics prearranged by panels as input data to predict the overall handle of functional clothing and get computable data by applying the FLM and ANN model. Clothing comfort is a complex process that depends on various psychological sensory perceptions. The psychological perception, on the other hand, is dependent on various factors, such as gender, age, know-how, physical location, and professional background. Even with these differences, the level of agreement between the panelists was within an acceptable level; the calculated Pearson correlations between the panels were up to 0.96; ∼73% of correlations were high linear correlations (0.7 ≤ r ≤ 1.0), ∼24% of correlations were significant linear correlations (0.4 ≤ r ≤ 0.7), and only ∼2% were low correlations (r ≤ 0.4); no correlations existed with zero values. Individual sensitivities of the fabric handle properties, such as WC, IS, HS, RS, and others, are quite diverse. In order to narrow down these dissimilarities, we utilized the FLM and ANN model to quantify the comfort of functional fabrics.
This study indicates the prospect of predicting the HVs and the THVs of functional fabrics using the FLM and ANN model. Both models showed an effective means of predicting the comfort of functional fabrics where their performances were assured by calculating the MSE, relative mean percentage error (RMPE), and STDV. The resultant data may perhaps be utilized for checking the quality of the functional fabrics produced by similar procedures with respect to tactile comfort.
Prediction of HV from finishing parameters
The mean and standard deviation results of hand values as rated by panelists
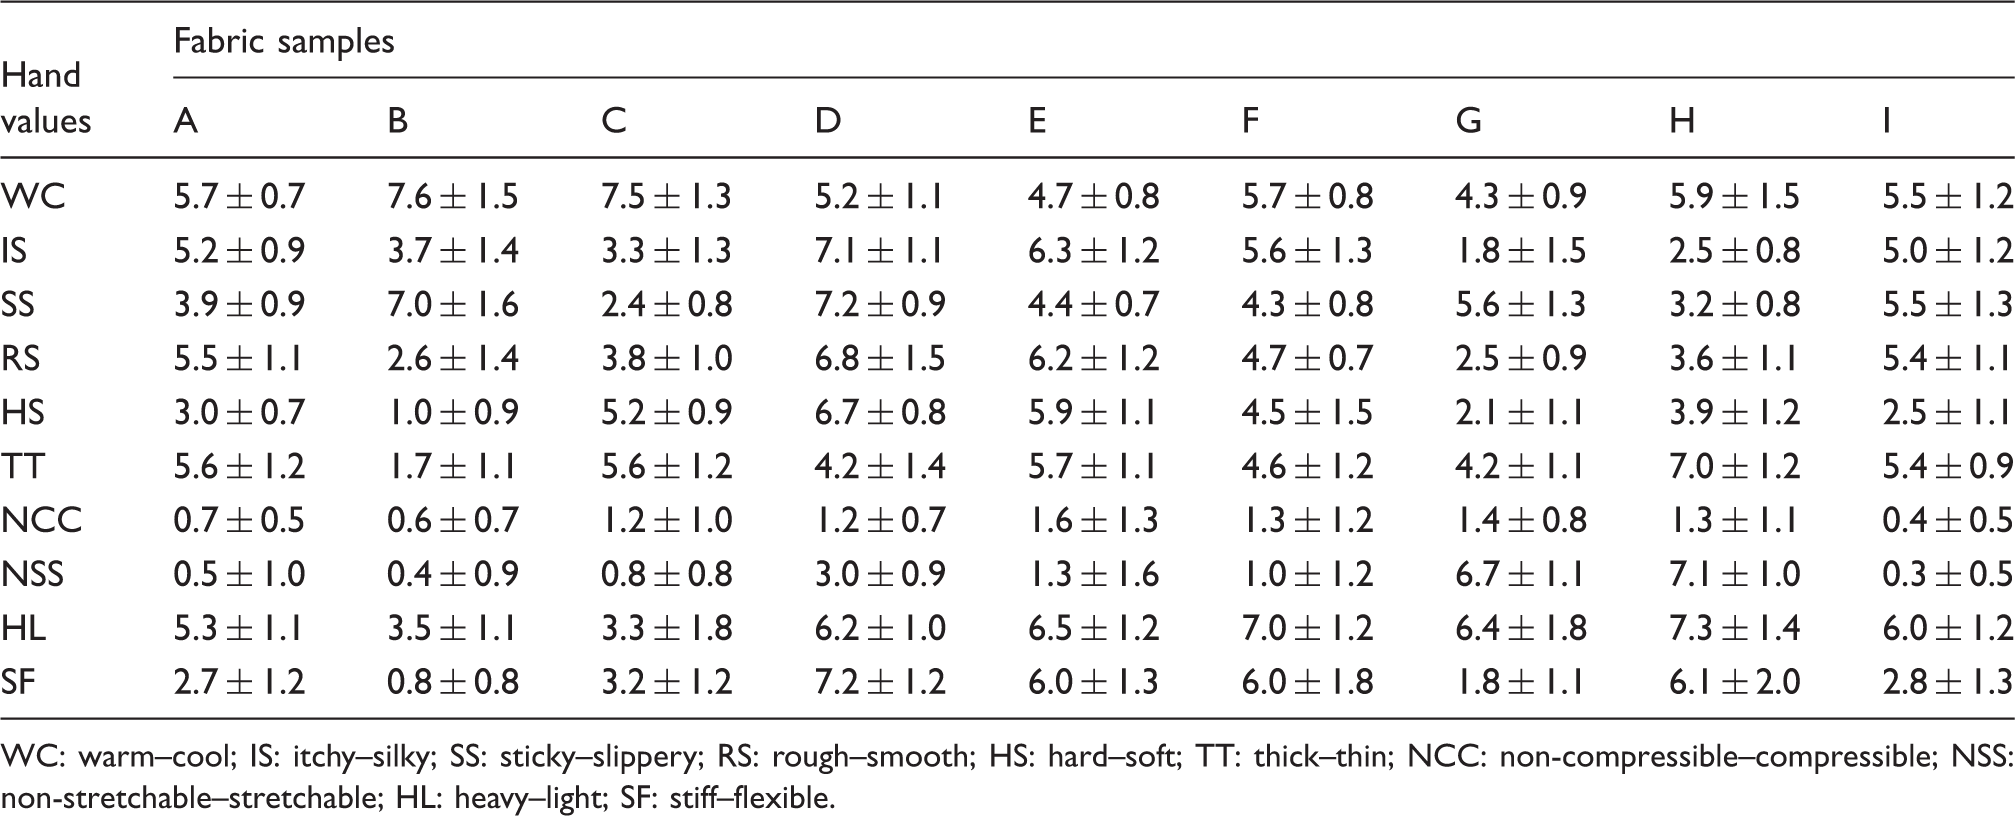
WC: warm–cool; IS: itchy–silky; SS: sticky–slippery; RS: rough–smooth; HS: hard–soft; TT: thick–thin; NCC: non-compressible–compressible; NSS: non-stretchable–stretchable; HL: heavy–light; SF: stiff–flexible.
The optimized input data sets for warm–cool using the fuzzy logic model
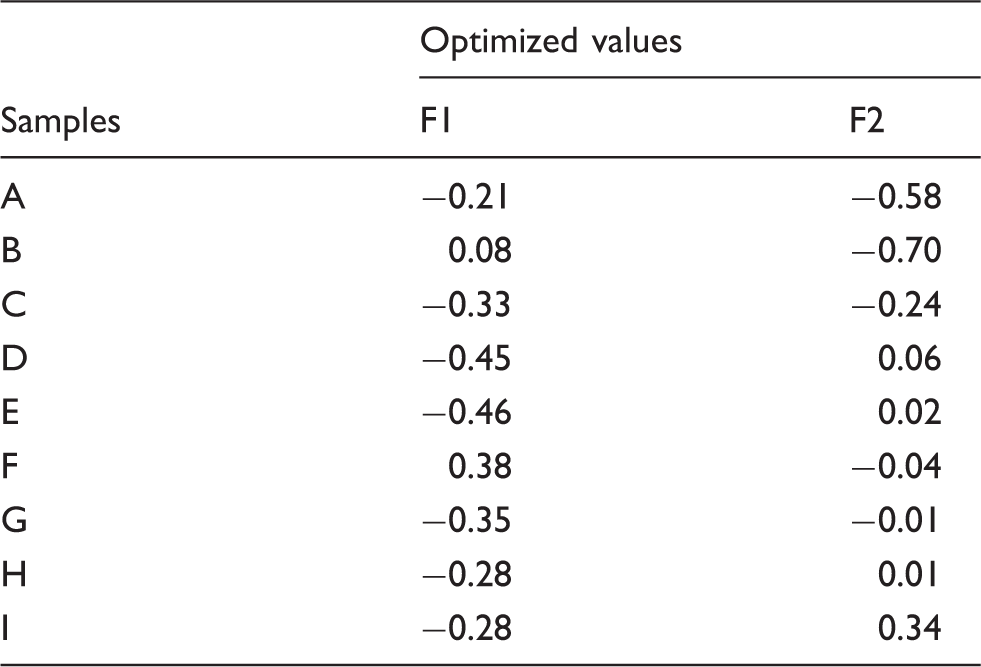
R studio software was used to compute PCA. Based on the PCA rules, those principal components having at least ∼1.0 standard deviation must be considered for further computation. However, in this paper, we only utilized two principal components for ease of applying fuzzy logic. It is very clear that as the number of principal components increased, the performance of prediction was enhanced. For this work, the eigenvalues were calculated from the standard deviations and then variances were computed from the eigenvalues. For instance, for the WC attribute, the computed variance for the F1 and F2 components was ∼60% to explain the data set.
For the HV, each attribute was predicted utilizing Mamdani fuzzy logic rules and the trapezoidal MF; for instance, for fabric A, and for the WC attribute, the results are displayed in Figure 3.
Fuzzy logic model (FLM) predictions of fabric A for the warm–cool (WC) attribute. The FLM was applied for sample A with the WC bipolar descriptor for demonstrations. All the samples and bipolar descriptors follow similar procedures. The inputs are the reduced variables using principal component analysis while the output is the hand value (HV) of the sample provided by human subjects.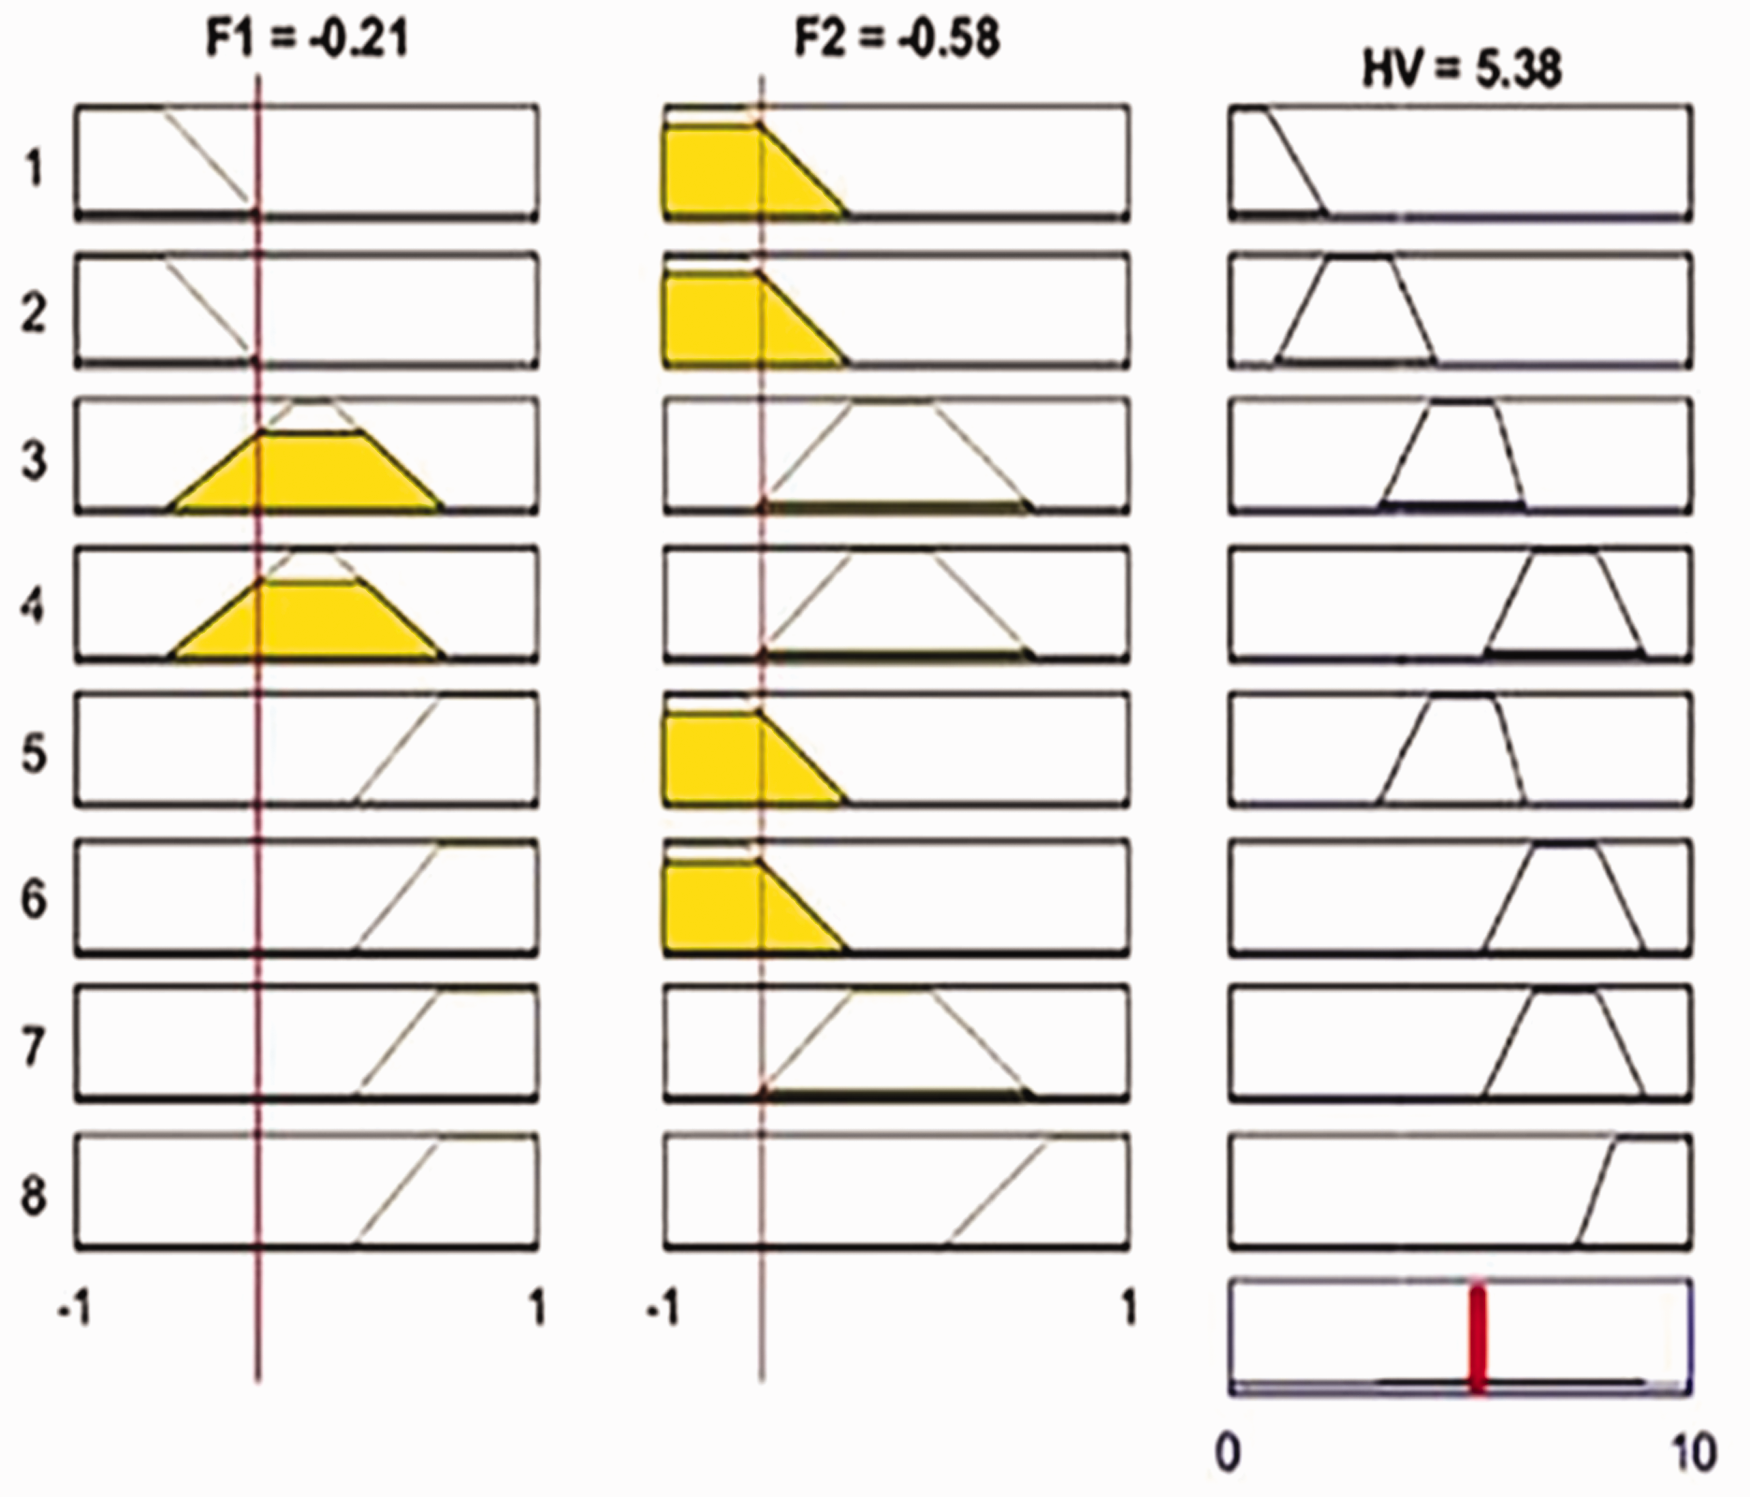
Mamdani rules were carefully designed based on the information obtained in the course of sensory perception during subjective evaluation of each attribute on the overall quality (THV) of the textile fabric that a greater number of panelists agreed upon. Hence, optimized PCA values were converted into three fuzzy MFs, small, medium, and big, and the fuzzy subsets were scaled between –1 and +1. 11 The output HV scaled from 0 to 10 was converted into five fuzzy subsets: very small, small, medium, big, and very big and, finally, the fuzzy rules were constructed for each bipolar attribute. Five fuzzy sets were selected as it was easier for the rule construction for the inclusive number of fuzzy sets.
The fuzzy rules are as follows:
if (F1 is small) and (F2 is small) then (HV is very small); if (F1 is small) and (F2 is small) then (HV is small); if (F1 is medium) and (F2 is medium) then (HV is medium); if (F1 is medium) and (F2 is medium) then (HV is big); if (F1 is big) and (F2 is small) then (HV1 is medium); if (F1 is big) and (F2 is small) then (HV is big); if (F1 is big) and (F2 is medium) then (HV is big); if (F1 is big) and (F2 is big) then (HV is very big).
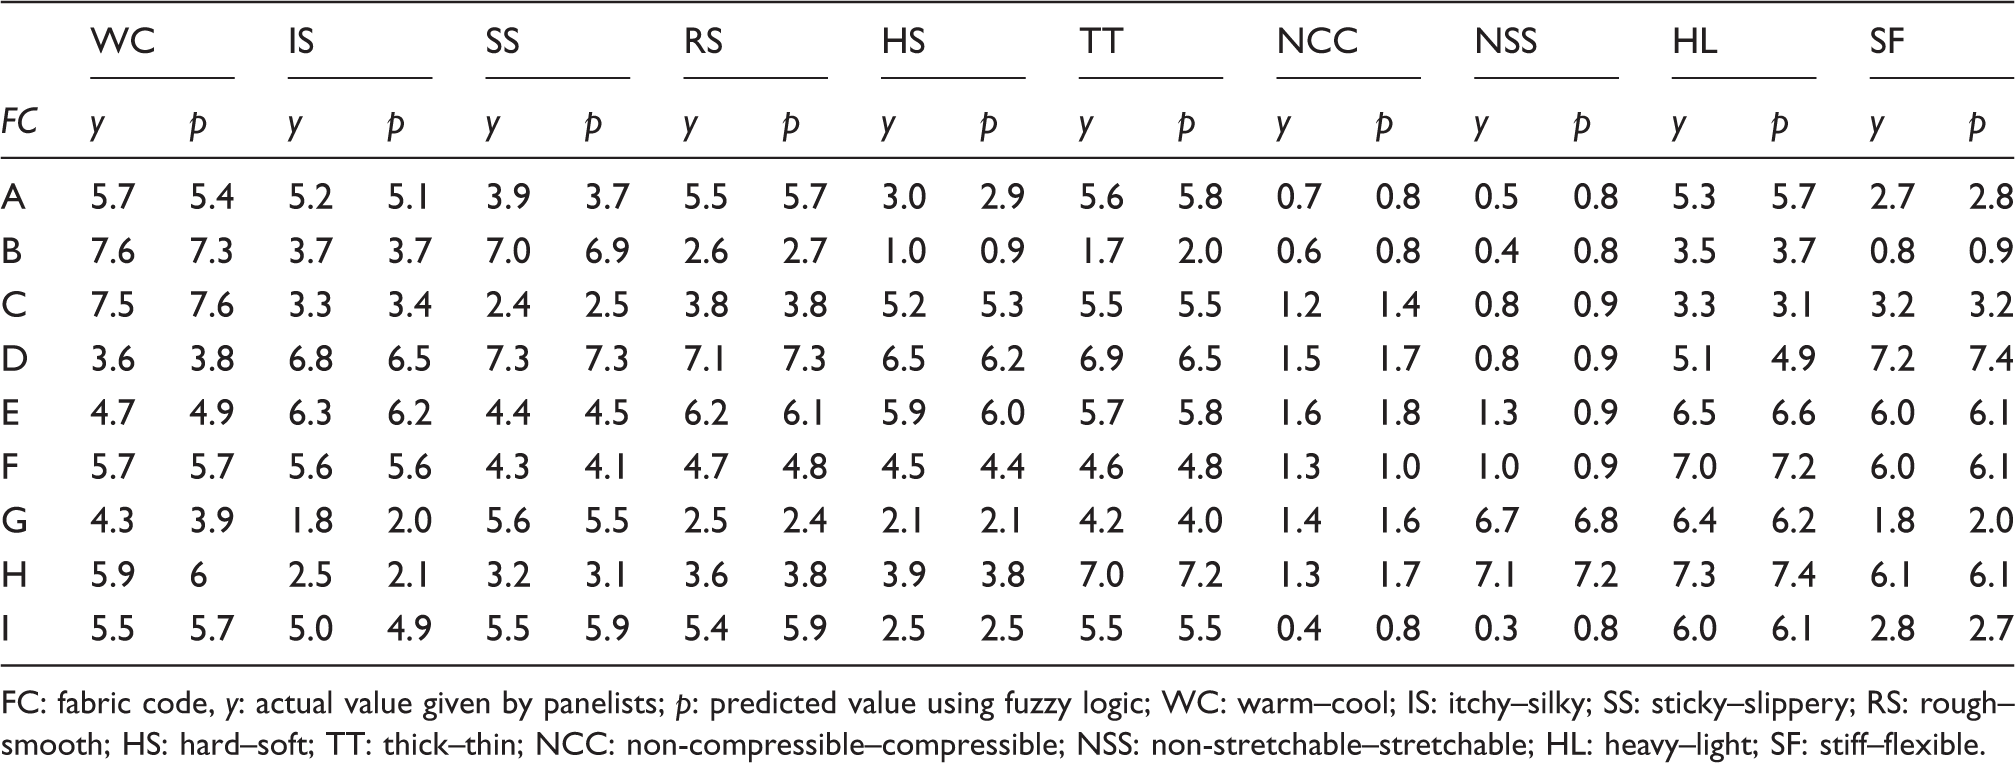
Figure 4 shows the correlation of the HVs with the optimized PCA values. Then, all of the mentioned values (Table 6) are obtained by applying the fuzzy logic rules for each fabric and each bipolar descriptor.
Fuzzy logic model distribution of fabric A (warm–cool) showing (a) and (b) two-dimensional and (c) three-dimensional surface plots between the reduced input and the output hand value (HV). The surface plot indicates the non-linear relationships between the input and output data sets. Hand value prediction using fuzzy logic from functional finishing parameters FC: fabric code, y: actual value given by panelists; p: predicted value using fuzzy logic; WC: warm–cool; IS: itchy–silky; SS: sticky–slippery; RS: rough–smooth; HS: hard–soft; TT: thick–thin; NCC: non-compressible–compressible; NSS: non-stretchable–stretchable; HL: heavy–light; SF: stiff–flexible.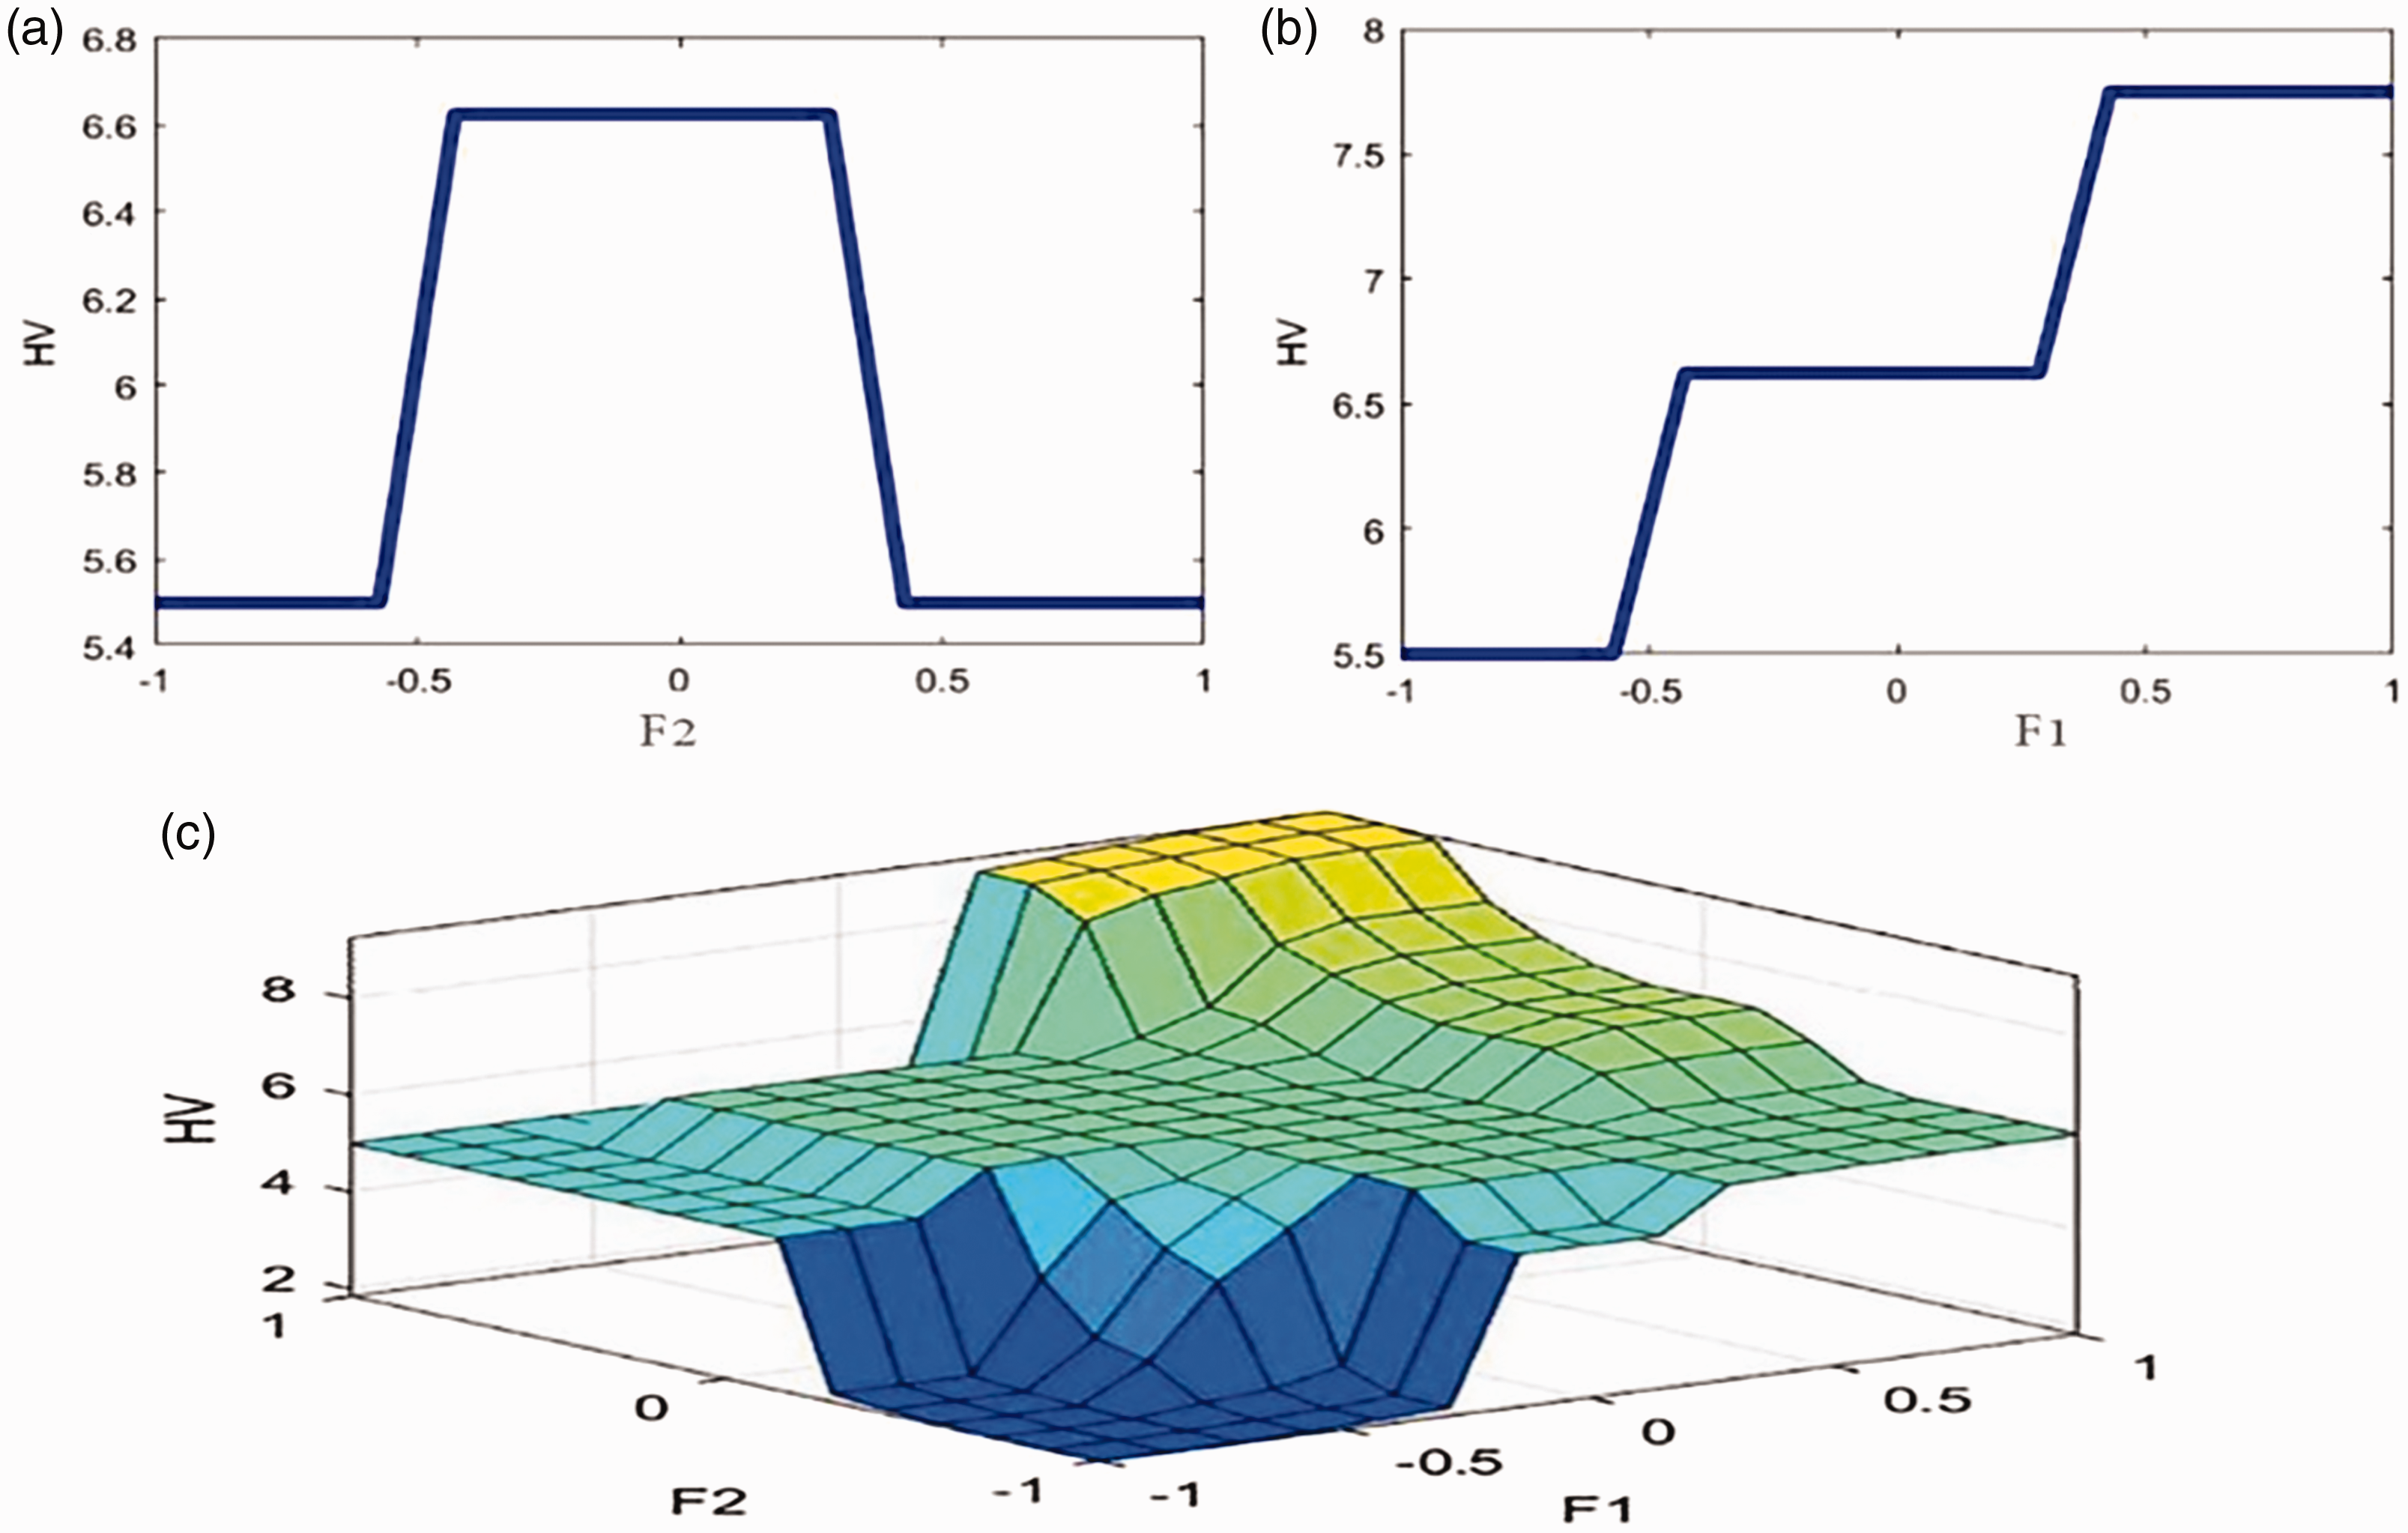
From the FLM results, we can explain that the relationship between F1 (obtained by PCA) and HV is proportional, and the peak HV was achieved when the F1 values were between 0.5 and 1. However, the relationship between F2 and HV is not clearly defined. HV became maximum when F2 was between –0.5 and +0.5 and minimum otherwise. Accordingly, fuzzy logic was employed to predict the HVs of each smart and functional fabric for each attribute.
Thus, the prediction performance of the fuzzy model on NCC and on NSS bipolar descriptors was poor (RMPE > 10%). Hence, it was sometimes difficult to establish the fuzzy rules when the HVs were within the lowest extreme values using a FLM. However, the fuzzy model has a good performance in predicting the HVs of the functional fabrics from finishing parameters, except for two bipolar descriptors (NCC and NSS). Furthermore, the root mean square error (RMSE) and STDEV values have nearly equal values, which are the variation of the actual evaluation.
Prediction performance of fuzzy logic for HVs
In order to evaluate the predicting capability of the fuzzy logic on the HV using finishing parameters, the MSE was calculated according to
11


Summary of prediction results using the fuzzy logic model
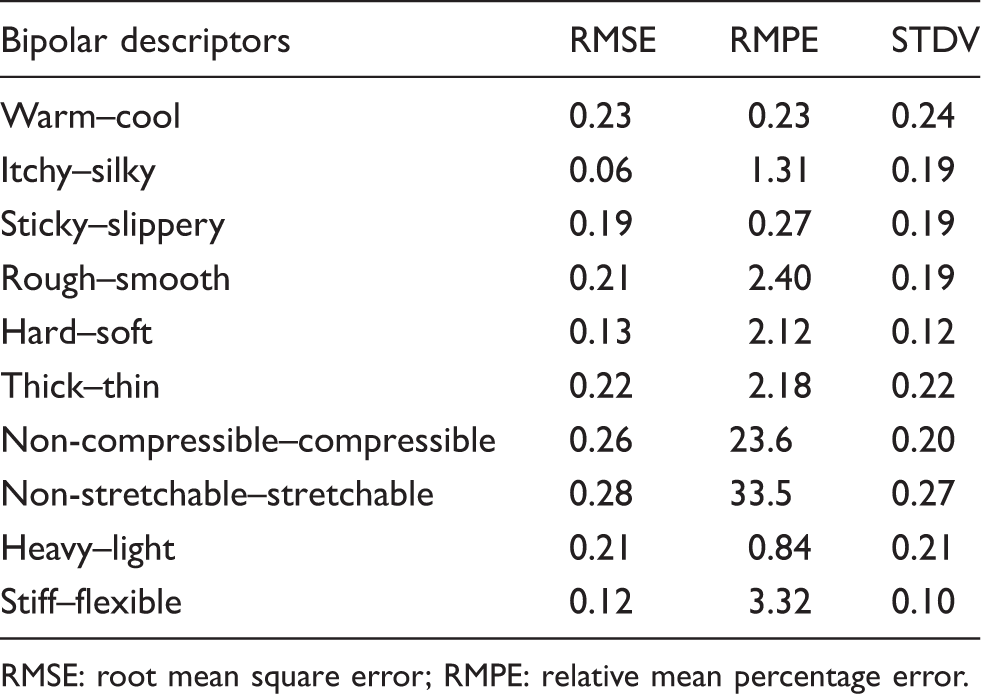
RMSE: root mean square error; RMPE: relative mean percentage error.
Prediction of THV from HVs using the FLM
In a similar way, the FLM was applied to predict the THVs using the actual HVs given by the panelists as input parameters. Figure 5 shows the prediction of the THV of fabric ‘A’ using the most significant three attributes (WC, HL, and HS), which were selected based on the Pearson correlation results. The inputs are the results of the HVs mentioned in Table 4.
Prediction of total hand value (THV) using hand values (HVs) for fabric A using the fuzzy logic model. The THV was predicted using the three most significant bipolar attributes (HVs) and the selection was supported by Pearson correlation analysis. The demonstration was made only for sample A and all the samples followed similar procedures to predict the THVs from the HVs. WC: warm–cool; HL: heavy–light; HS: hard–soft.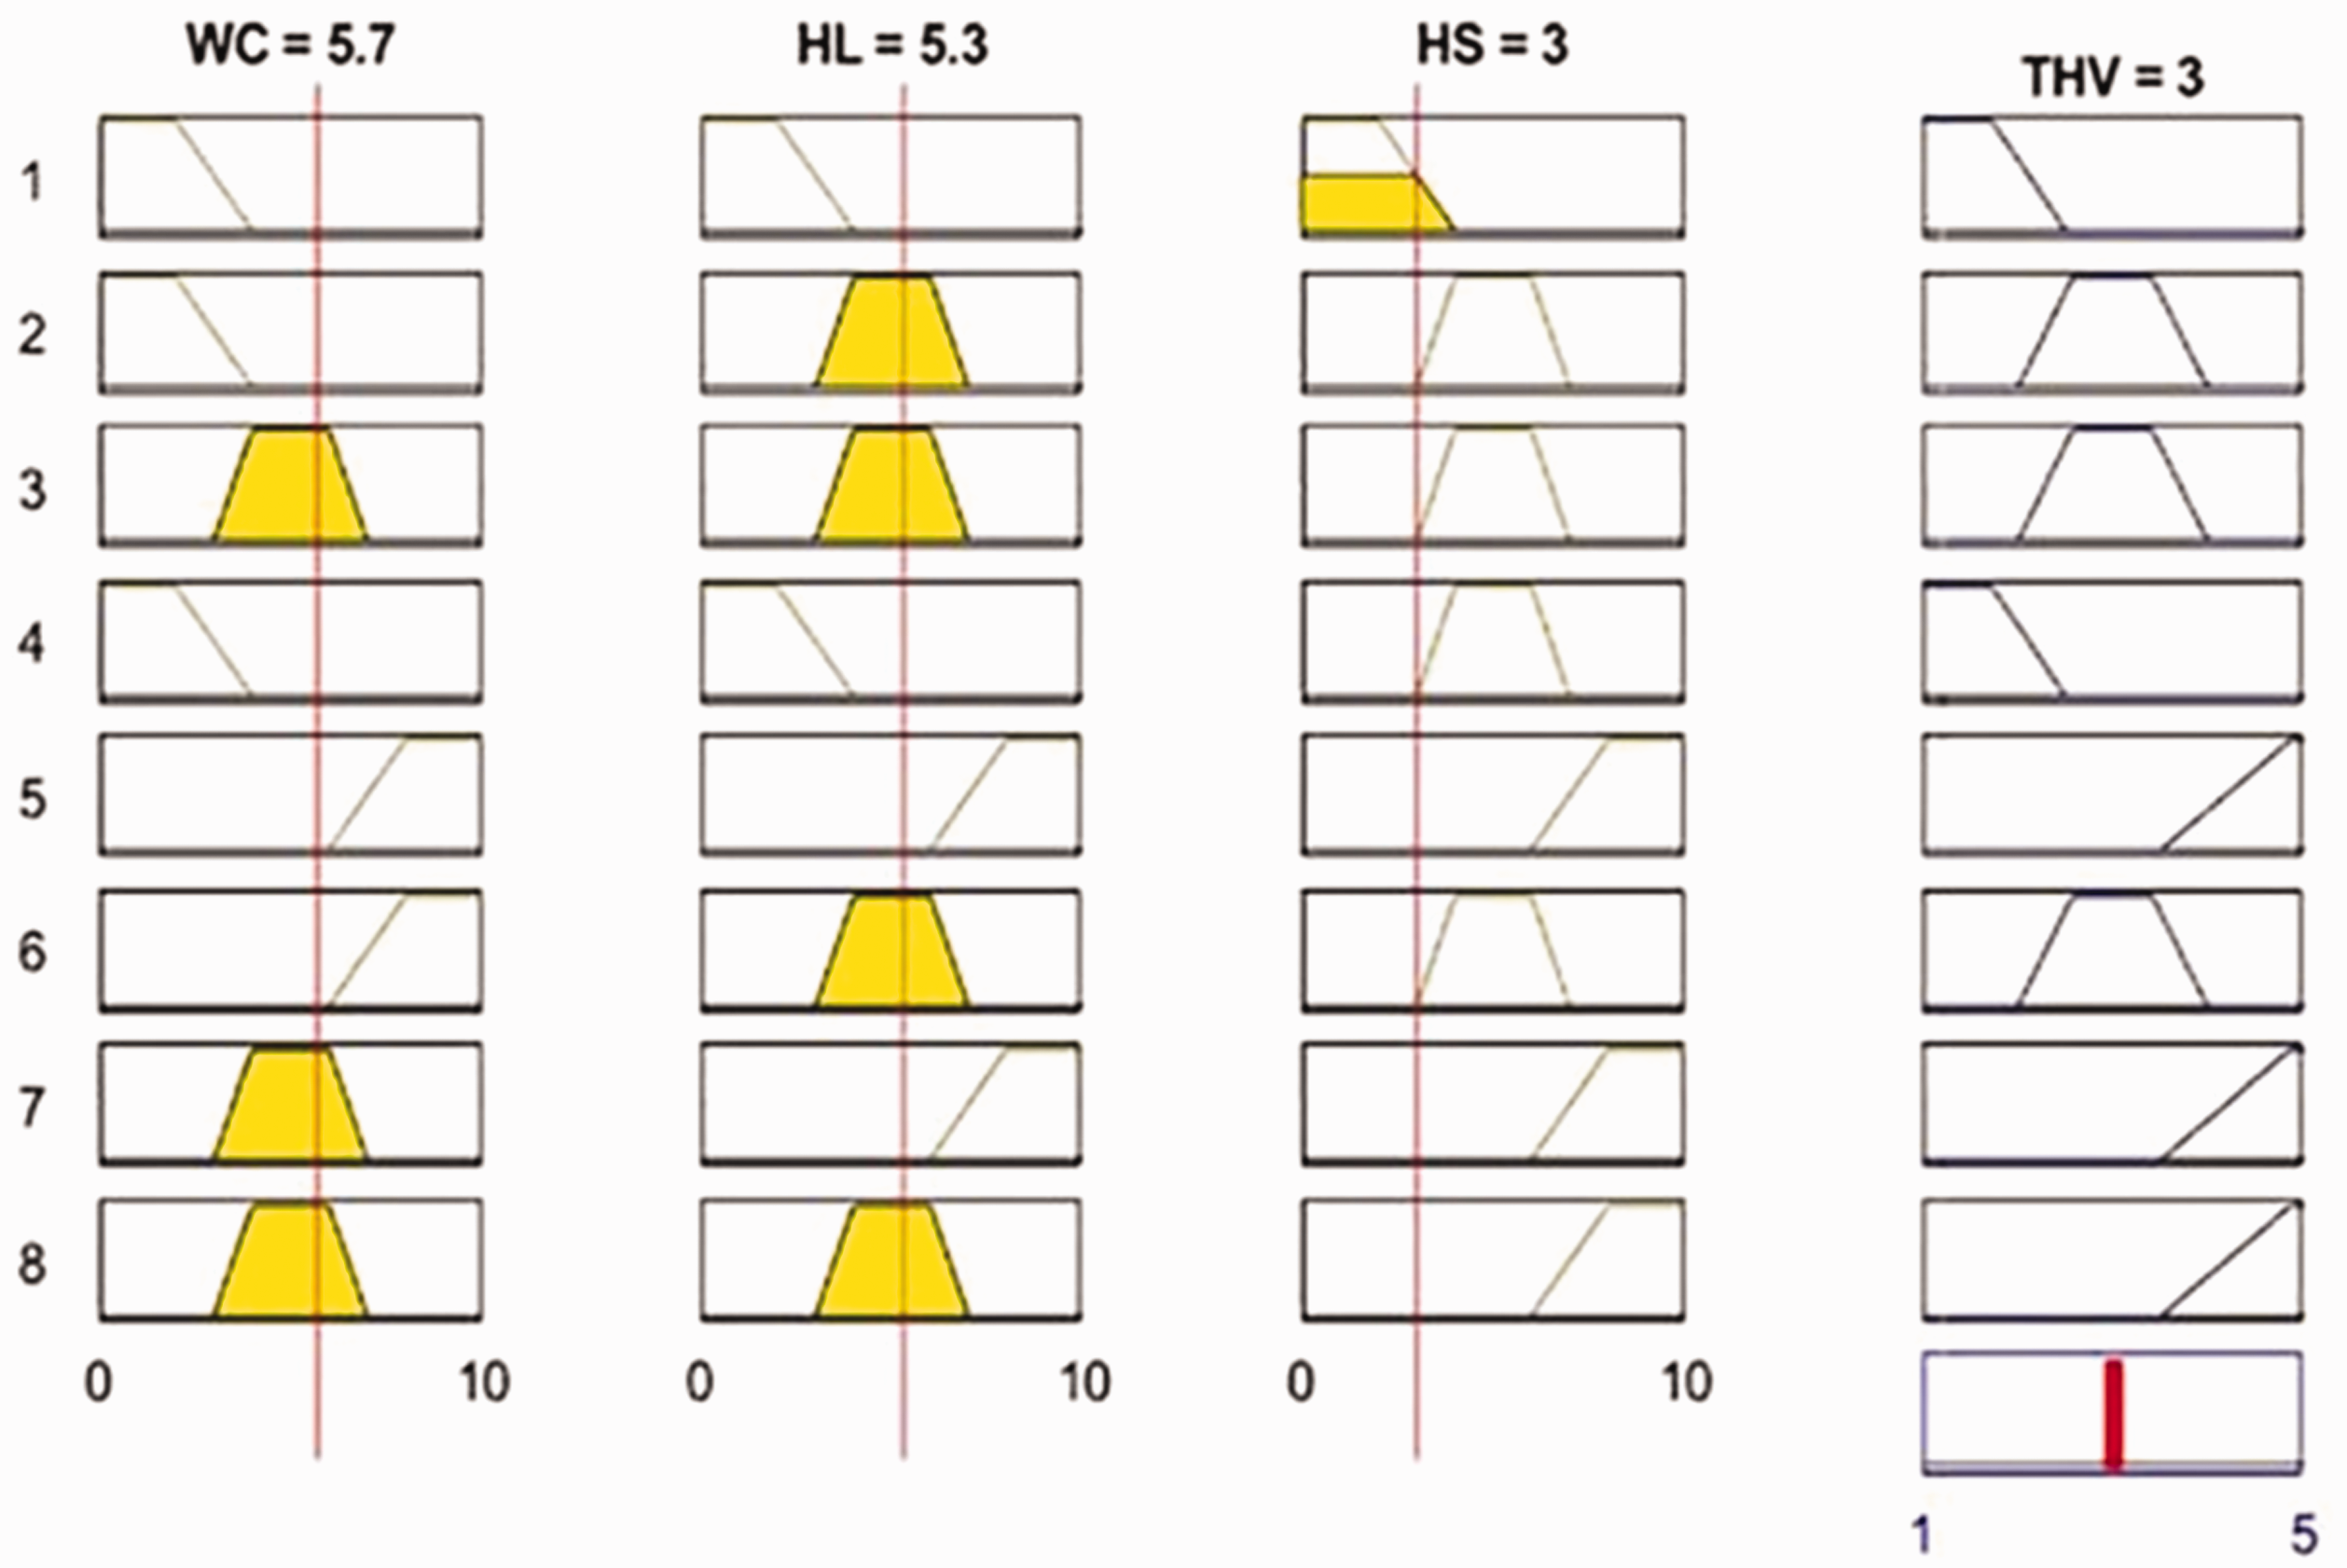
Total hand value prediction from HV using fuzzy logic (p1) and artificial neural network (p2) models
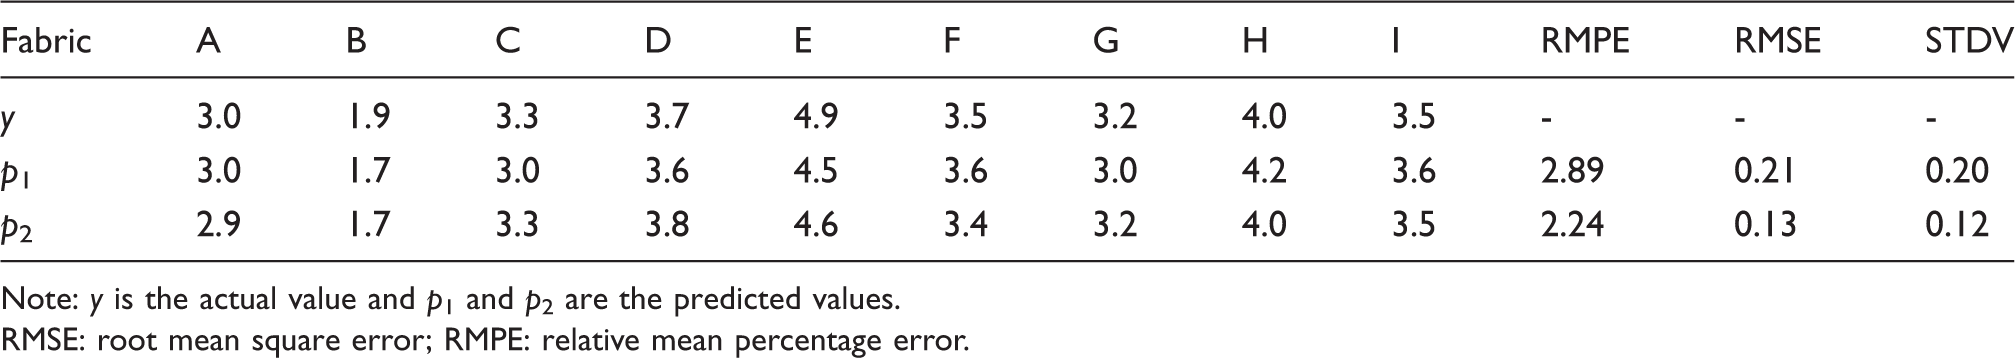
Note: y is the actual value and p1 and p2 are the predicted values.
RMSE: root mean square error; RMPE: relative mean percentage error.
The fuzzy rules are as follows:
if (WC is warm) and (HL is heavy) and (HS is hard) then (THV is non-comfortable); if (WC is warm) and (HL is medium) and (HS is medium) then (THV is medium); if (WC is medium) and (HL is medium) and (HS is medium) then (THV is medium); if (WC is warm) and (HL is heavy) and (HS is medium) then (THV is non-comfortable); if (WC is cool) and (HL is light) and (HS is soft) then (THV is comfortable); if (WC is cool) and (HL is medium) and (HS is medium) then (THV is medium); if (WC is medium) and (HL is light) and (HS is soft) then (THV is comfortable); if (WC is medium) and (HL is medium) and (HS is soft) then (THV is comfortable).
Using FLMs, the THVs were predicted using the HVs provided by 10 human trained panelists. As showed in Table 8, the fuzzy model effectively predicted the THV by utilizing three HVs, as the calculated RMPE (2.89%) is less than 10%. The RMSE is 0.21 and hence the accuracy of the prediction of the FLM was acceptable and has almost an equivalent value at the variation of the experiment (STDV).
Prediction of THV from HVs using the ANN model
The THVs were predicted with the ANN model using the FFBP and a performance function of the MSE. We chose this method because the training algorithm subtracts the training output from the target value to get the error signal. It then adjusts the weights and biases in the input and hidden layers to reduce the error. Gradient descent with momentum and adaptive learning rate training was performed. The data were divided into the input values (the HVs given by the panelists – the average values were used), the target values (the THVs given by panelists – the average values were used), and the sample values (similar to the input values). In order to have a sufficient number of input variables, the data obtained by the BSE method were exploited in addition to the VSE data. The training was performed with ‘nntool’ (neural network toolbox) using matlab2017b. The first layer is the input layer; the hidden layer represents the fuzzy subsets of the input and the second output layer represents the fuzzy subsets of the output; the last layer represents the single output. Figure 6 displays a feed-forward backpropagation type of ANN. The arrow vector from the input variable nodes binds the ANN lines together into a bus to each of N nodes (N is the number of hidden layers) in the hidden layer.
Feed-forward backpropagation artificial neural network (ANN) model showing the details of ANN with inputs, bias (b), weights (w), hidden layers, the output layer, and the final output.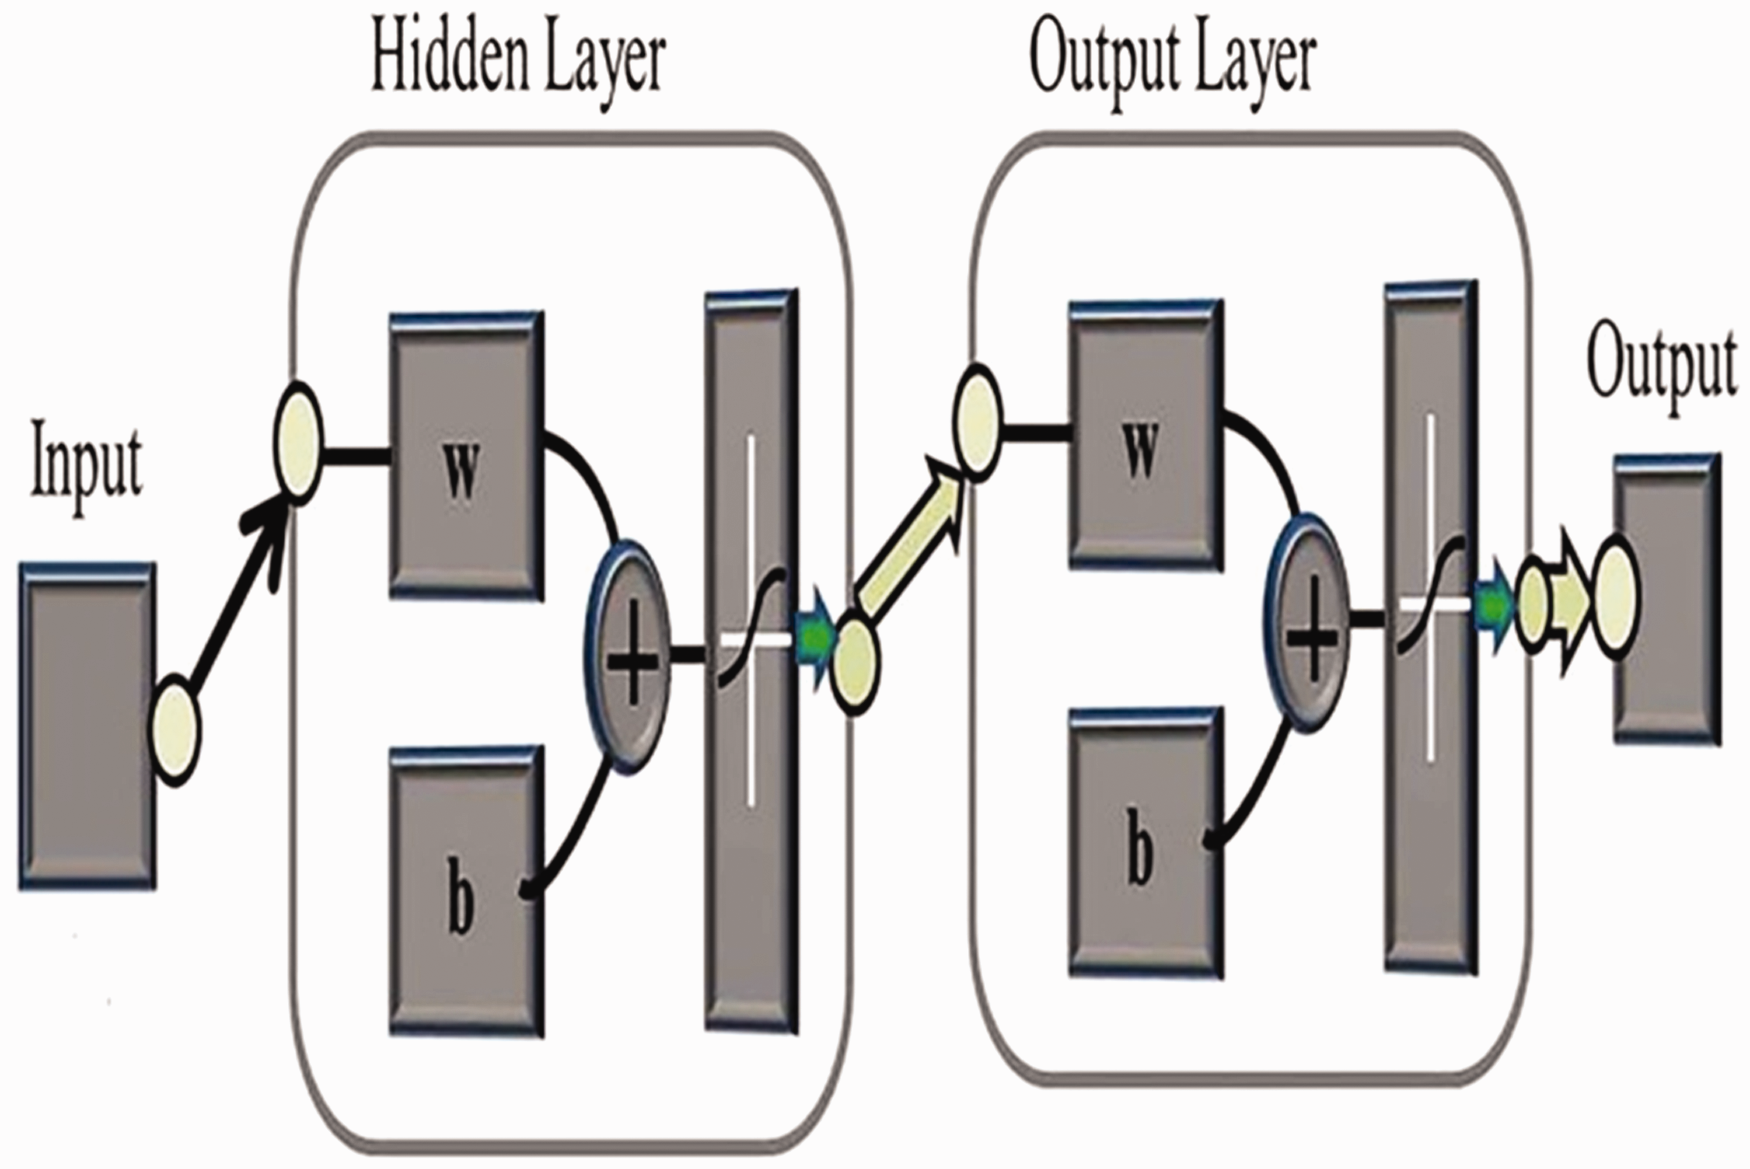
For the hidden and the output layers, a weight was allocated to each line. The weights were adjusted to train the ANN to match the input with assigned target values. To get the output nodes, the weighted vectors are summed and put via a sigmoid (S-shaped) threshold function to go to the last output values from the given sample values in the hidden layer. The training was performed until the ANN outputs a close approximation to the target values; that is, until a sufficiently minimum MSE value obtained. The training was performed using nntool using MATLAB software. After creating the nntool pop-up window using MATLAB, the input and the target data were imported. Then, the ANN was trained at 10,000 training epochs and 0.01 functions. After training was completed, testing, performance evaluation, and simulation were performed against the target value.
The ANN was trained until a sufficiently low value of MSE was recorded and thus the regression line was drawn accordingly. The results are shown in Figure 7.
Regression line result based on artificial neural network (ANN) training. The regression line and the highest R values in training indicate that the data sets were well-trained using an ANN. In addition, the highest R values in validation and testing showing the ANN was well validated and perfectly tested to predict the comfort of functional fabric.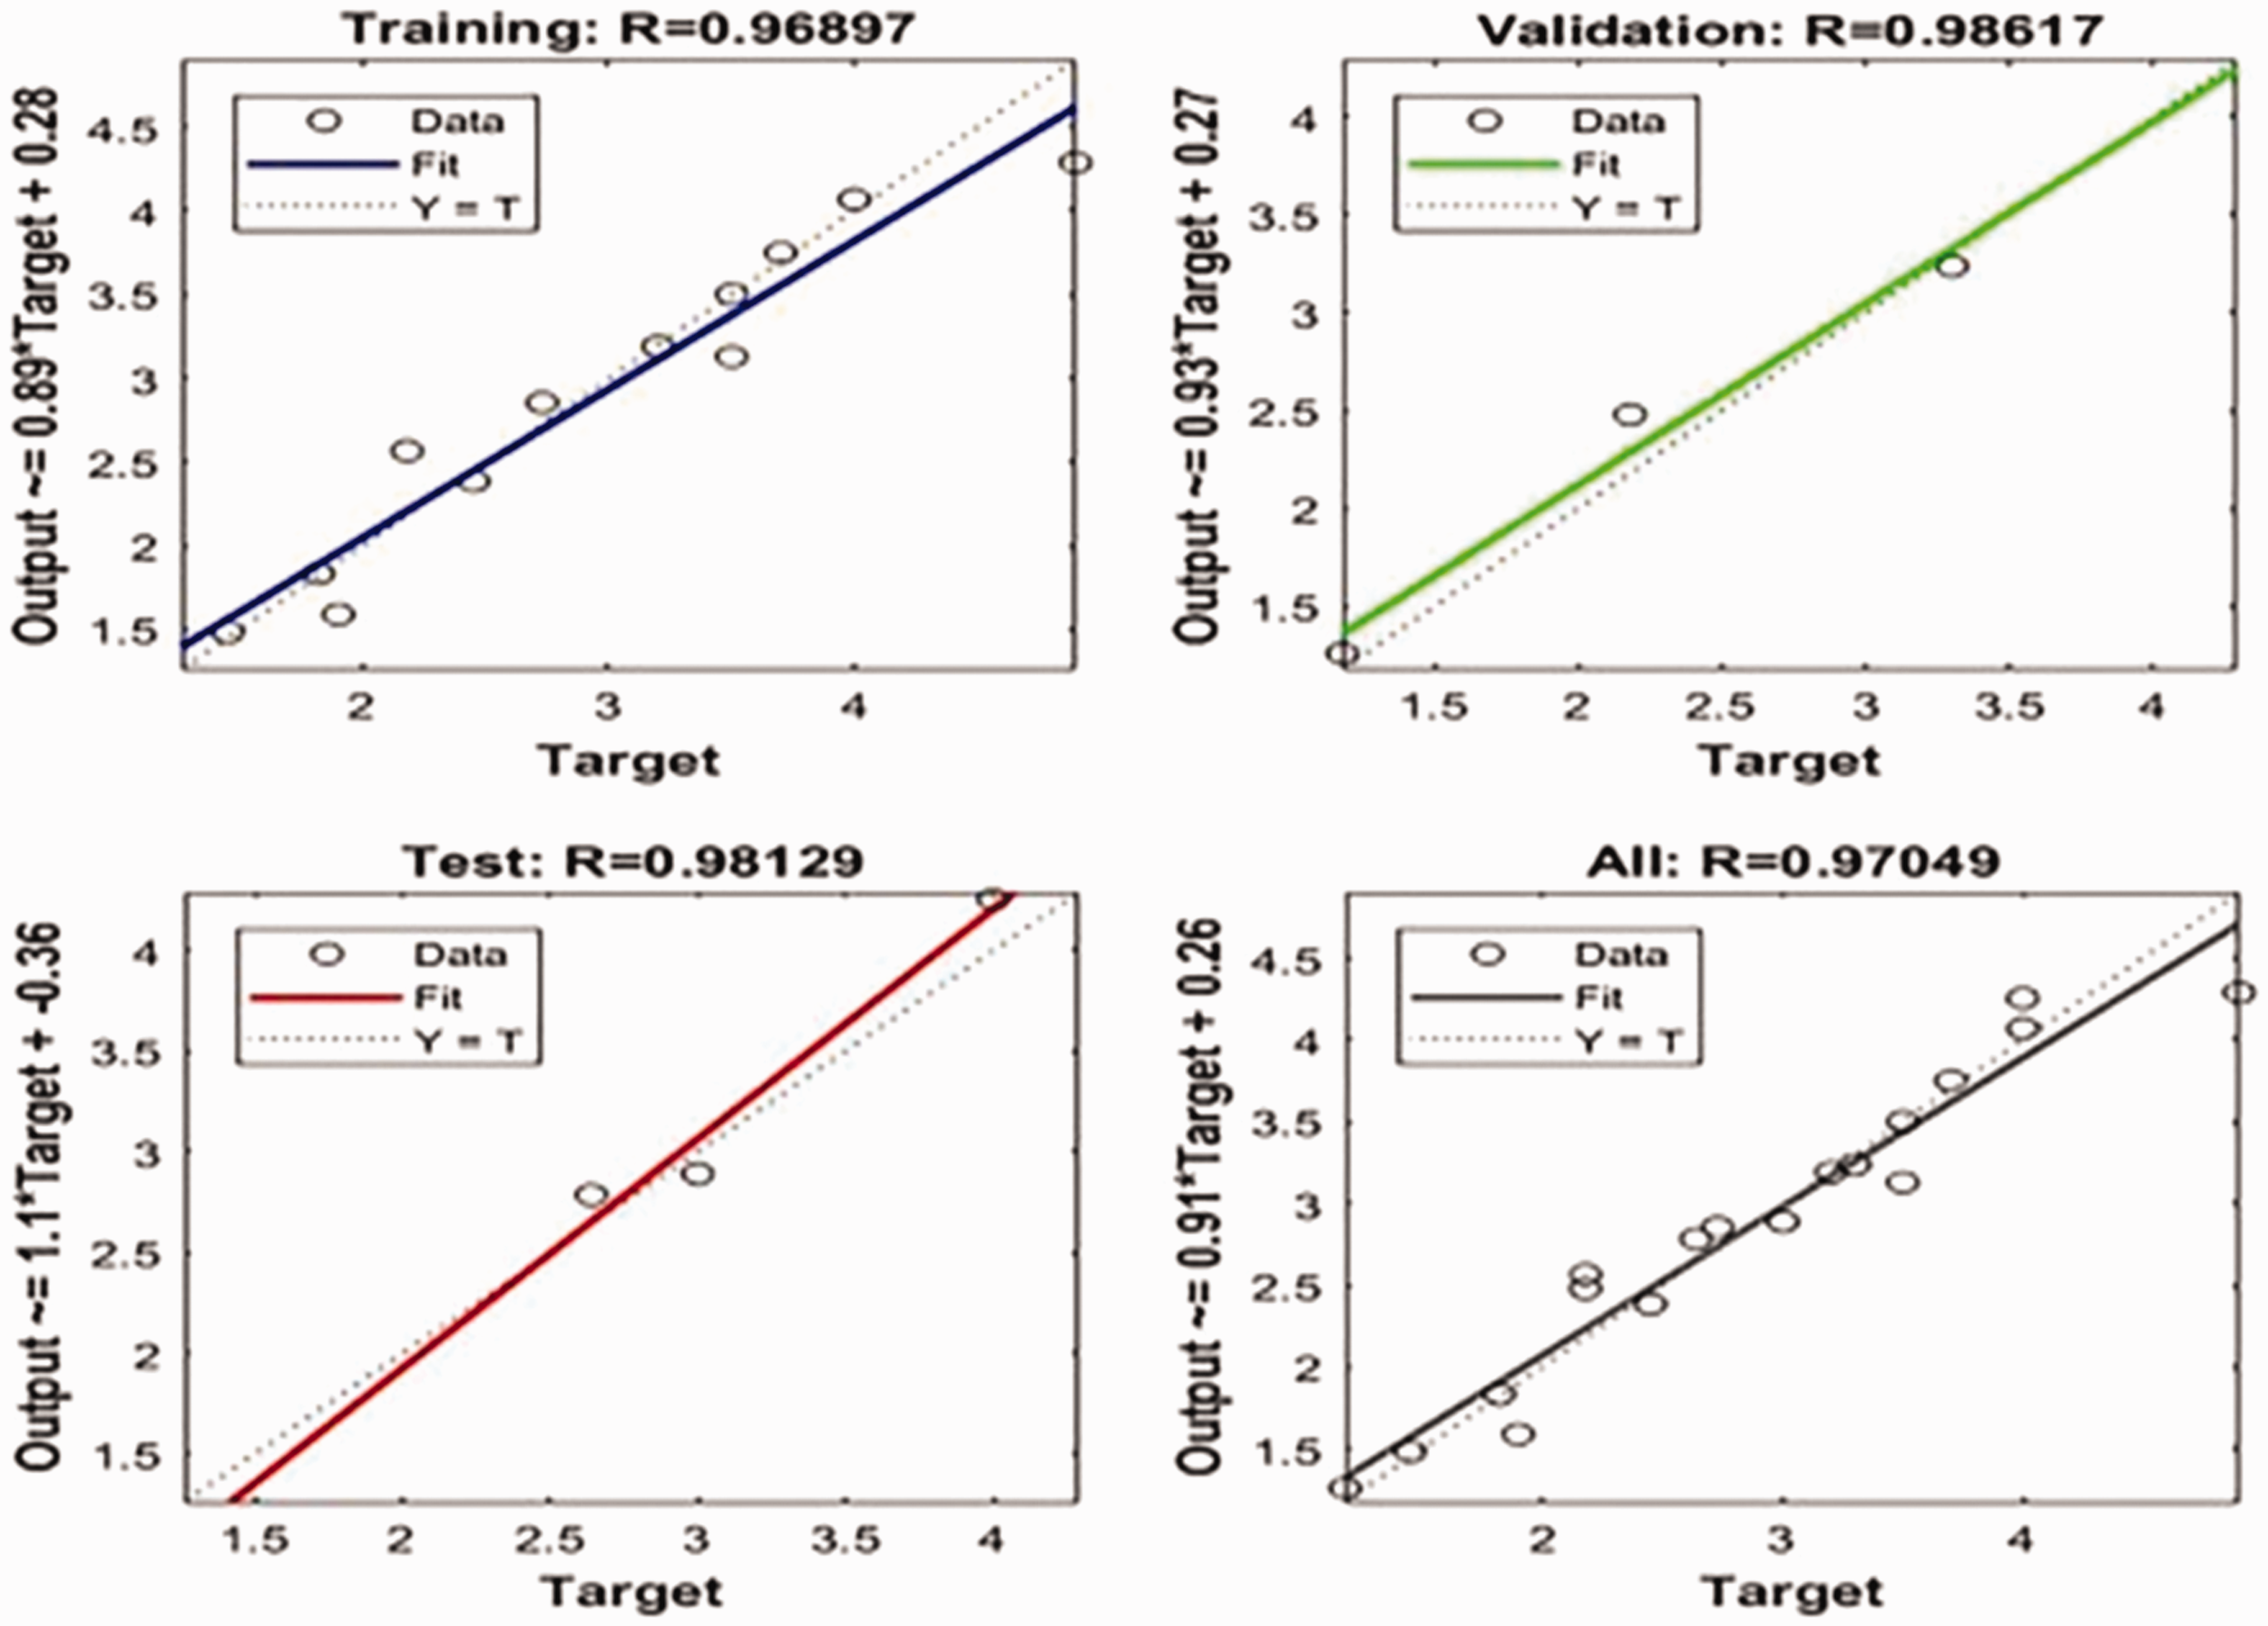
A simple ANN was employed and this ANN decreases the input variables (bipolar descriptors) first into a set of input weight vectors and then centers the hidden layers for each weight function and finally keeps the output value. From Table 8, it is possible to observe that the prediction performance of the ANN is quite efficient in most cases. In spite of fewer input variables being used, the results are comparable and even better than the data obtained by Jeguirim et al. 11 using an ANN. The obtained RMPE value using the ANN is below 10% (2.24%), and hence provides superior prediction performance. In addition, the RMPE value is less than that obtained by the FLM. Therefore, the prediction performance of the ANN is superior to that of the FLM. As can be seen from Figure 7, the results of ANN modeling, maximum R, and linear graph values were obtained. These confirm that the data sets in the ANN were well-trained, validated, and tested. The RMSE values for the neural network for the fabric hand prediction performance were within 0–1.0. 35 The RMSE value obtained using this method was 0.13, which is quite a good sign of the efficiency of the hand prediction using the ANN. In addition, simulation of the training data against the input was performed and the predicted data are shown in Table 8. Based on the result, the prediction performances of the FLM and ANN model were quite comparable with respect to the RMSE and RMPE. However, when individual predicted values were observed, the ANN model is more effective than that of the FLM, except for fabric E, and predicting the THV with the ANN is quite simple and out of the biases of rules, since fuzzy logic rules vary for each individual. Even though the ANN needs more data, the performance is acceptable for this experimental work. The results confirmed that the data sets that have been predicted using the ANN model and FLM can be used as a specification for quality control and inspection for prototype functional fabric production.
Conclusions
Fuzzy logic and ANN modeling were applied to predict the handle of functional fabrics. The prediction performance of the FLM for both HV and THV was effective; the RMPE values were less than 10% for most bipolar attributes and the RMSE values were within standard deviation values, which are variations of the real value and the predicted data except for a few data sets. Therefore, the FLM could be utilized to envisage the HV of the functional fabrics using finishing parameters as input data. On the other hand, THVs of the same fabric can be predicted using HVs given by panel judges as input data. Moreover, the prediction performance of the ANN on the THV was fairly good and comparable to that of the FLM, where low RMPE and RMSE values were achieved. These findings indicate that the FLM and ANN model can solve complex relations, as comfort has many dimensions. Thus, FLM and ANN-based prediction data sets of functional fabrics can be used for the development and production of these fabrics in a flexible way. In the future, the ANFIS, which combines both the FLM and ANN model, can be performed using more data sets.
Footnotes
Declaration of conflicting interests
The authors declared no potential conflicts of interest with respect to the research, authorship, and/or publication of this article.
Funding
The authors disclosed receipt of the following financial support for the research, authorship, and/or publication of this article: This work was supported by the Erasmus Mundus Joint Doctorate Programme SMDTex-Sustainable Management and Design for Textile [Grant Number n°2015-1594/001-001-EMJD].