



Abstract
Core yarn is a type of yarn that has a filament fiber in the center with a different fiber wrapped around it. This type of yarn is of growing importance in the textile industry. It is important to predict the quality characteristics of a core yarn before production to prevent the faulty production of fabrics. Therefore, the development of predictive models is a necessity in the textile industry. In this study, artificial neural network (ANN) and support vector machine (SVM) models are proposed to predict the quality characteristics of cotton/elastane core yarn, using fiber quality and spinning parameters. Principal component analysis and analysis of variance techniques are also used to reduce input dimensions, since high dimensional data may reduce a model’s potential for success in prediction. The prediction models are trained and tested using the data obtained from a textile production plant. The results of all the models are compared with each other on test data. Mean absolute percentage error (MAPE), mean absolute error (MAE) and correlation coefficient (R) are used to assess the prediction power of the models. Although on most of the tests SVM models fared slightly better than ANN models, both models provide accurate predictions for most of the yarn quality characteristics. The results show that the best models have over 90% success rate in MAPE and R. In particular, the Coefficient of Variance of mass (CVm) along the yarn, hairiness and Reisskilometer quality characteristics of the cotton/elastane core yarn are predicted with 91%, 93% and 95% accuracy, respectively.
Keywords
In order to maintain the high quality standards established by the clothing industry, textile manufacturers have to monitor the quality of their product, making textile quality a key factor in their competitiveness. 1 This makes the evolution of quality control a necessity for the sector. From human inspection to machines, quality control of textile production is a constantly evolving part of the industry.
Core spun yarn is a type of yarn that has a filament fiber in the center with a different fiber wrapped around it. These are value added yarns where the quality has more importance than the conventional yarns. They are produced mostly on ring and friction spinning machines. Core spun yarns take advantage of the qualities of both their components. The filament provides strength and lower twist level, while the sheath allows for the appearance and physical attributes of a fiber yarn.
2
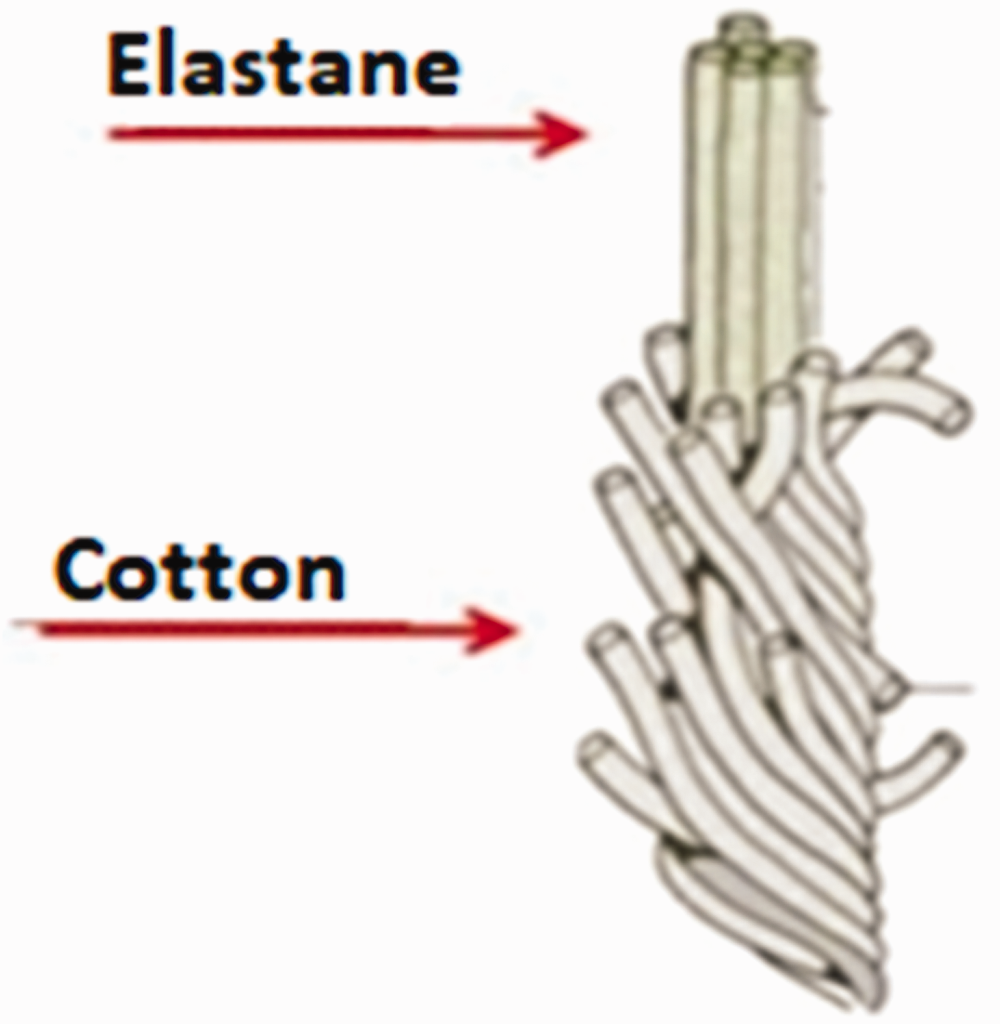
Cotton/elastane core yarn consists of an elastane core surrounded with cotton. The elastane core adds flexibility, stretch and rubber-like characteristics to the durability of cotton, as shown in Figure 1.
Elastane/cotton core yarn.
3
The quality characteristics of core yarns are very important in the textile industry, having a great impact on the quality of fabric and the final product. Yarn has many important characteristics, both physical and mechanical. The physical and mechanical characteristics of yarn, such as breaking force, tenacity, elongation, unevenness, thin places, thick places, neps and hairiness affect the resulting fabric, so predicting these characteristics before the production of yarn is of substantial importance. 4
It is important to predict the quality characteristics of the cotton/elastane core yarn before production in order to prevent the faulty production of fabrics. The human mind can only do this based on experience, which is not reliable or sustainable. Therefore, the development of prediction models is a necessity in the textile industry. Prediction models are used in the textile industry to achieve higher quality products using correct parameters and to decrease waste. By using correct estimations, the output (in this case, product) efficiency can be increased and waste of fibers and power for each time the yarn fails to meet the specifications can be decreased. Furthermore, by knowing the relationships between the performance and characteristics of yarns and fibers, the producer can make more accurate decisions on the fiber used in production for the quality of yarn required by the buyer. 5
Recent developments in the textile industry show that expert systems can help planners manage production lines. Artificial neural networks (ANN) have been found to be helpful in expert systems for resolving many problems in textiles, such as prediction of colorimetric values of fabrics, analysis of fabric defects, process optimization etc. 6 One of the earlier studies of ANN in the textile sector was the analysis by Tsai et al. in 1995 of four different types of fabric and defect detection by ANN models. The defects were accurately found and classified. 7 Since then, a number of studies have been conducted successfully in the textile sector and only the more recent studies are mentioned in the following review of the literature.
ANN models and linear regression models were used by Ogulata et al. to predict elongation and recovery of bi-stretch fabric. 8 Both types of models showed similar and accurate results. Gharehaghaji et al. used ANN models and multiple regression analysis to predict the stress characteristics of nylon core cotton blend yarn. 9 Analyzing both of these methods, it was determined that ANN models gave more accurate results. Balci et al. used ANN models with the Levenberg-Marquardt algorithm to predict the colorimetric values of striped cotton fabrics. 10 The number of nodes was changed to see the effect of nodes on the prediction. Balci et al. again used ANN models with the Levenberg-Marquardt algorithm and linear regression models to predict CIELab values and wash fastness of nylon 6,6. 11 The determination of yarn characteristics with statistical models and ANN was studied by Demiryurek and Koc. 4 In that study, the process was followed from the production of braids including viscose and polyester fibers to the winding cone. Balci and Ogulata compared ANN models against linear regression models to predict changes of CIELab values of fabric after chemical finishing. 12 ANN models were shown to give better performance than linear regression models. Kumar and Sampath used neural network models to predict the dimensional properties of cardigan fabric made from cotton ring-spun yarns. 13 The predictive power of the neural network model was shown to be highly accurate.
Predicting the tensile strength of cotton core spun yarns was another subject of ANN study. Yarn breaking strength, elongation and rupture of core spun yarns were predicted by both the ANN model and the linear regression model. ANN models were shown to be more accurate in the prediction of tensile strength of cotton core spun yarns. 14 Das et al. used ANN with a genetic algorithm, called hybrid ANN, to identify the set of fiber qualities that would give the requisite yarn quality. 15 Another prediction study for neural network models was prediction of yarn strength. The performance of the model was shown to be reliable and it was applied to a textile company in Italy. 16 Kayseri and Kirtay studied ANN models predicting the pilling tendency of interlock knitted fabrics using yarns with different yarn counts, although the regression coefficient was only 82%. 17 Zhenlong et al. used convolutional ANN models combined with BP neural networks against support vector machines to predict air jet texturing yarn intensity. Based on just five sets of test data the study concluded that the Concurrent Neural Network Bayesian Programming (CNN-BP) algorithm has better accuracy than other algorithms. 18 This study, on the other hand, has 34 test samples with more quality characteristics on the output variables.
Turhan and Toprakci used ANN models to predict yarn characteristics. 5 They compared the prediction performances of high volume instruments (HVI) and advanced fiber information systems (AFIS) by radial functioned neural networks. They developed a neural network model that can predict the tension and hairiness of yarns and this model was fed with the parameter outputs of HVI and AFIS.
Support vector machines (SVM) are similar to ANN, but newer than their ANN counterparts. SVM models were initially proposed in 1992, to make the linear function suitable to the classification and for the situation where the training set cannot be linearly separated. 19 SVM models have been used in the textile industry for a long time. Murino et al. used an SVM based framework for statistical classification of raw textile defects and the results of the SVM model were very promising. 20
Karras used single value decomposition analysis with vector quantification to transform images into features. 21 These features were used as teaching data for both SVM and ANN. The two models were then compared against each other, and it was shown that SVM had better results than ANN. SVM has also been applied to the problem of texture classification of woven fabric. In a study about texture analysis based classification, the classifiers were compared against each other, and SVM had better results with some of the parameters, like homogeneity, than others, like angular second moment. 22 Ji et al. used SVM models for the classification and identification of foreign fibers in cotton. The decision tree SVM model was used to improve the training speed. In 300 images, the testing accuracy was 98%. 23
Another application of the SVM model was fabric wrinkle categorization and classification. The study used wavelet transform to decompose images and gave the results to SVM models as parameters. In 300 images, a 75% success rate was achieved. 24 In 2011 an SVM classifier system was developed to inspect common fabric defects (neps, oil stains). It was found that the SVM classifier had a reasonable accuracy. 25
SVMs have also been used in predicting the strength of rotor spun yarn. HVI and AFIS results were used as parameters. It was shown that SVM performed well compared with an ANN model. 26 Another subject of SVM studies was the prediction of yarn quality parameters. Combined with a genetic algorithm, SVM models were shown to be more accurate in small datasets and in real-life production. 27
Ghosh and Chatterjee used SVM models to predict cotton yarn properties. 28 SVM models were used to forecast properties of rotor- and ring-produced cotton yarns. Fiber properties from HVI and AFIS were used as parameters. The forecast performances of these models were compared against ANN models. SVM models showed a very high degree of accuracy and better results than their ANN counterparts.
This study differs from the literature in three ways. First, this is the first study to develop prediction models for the quality characteristics of cotton/elastane core yarn. Second, this study uses data obtained from a textile plant. Finally, it acts as an original comparison between SVM and ANN models using reduced input data by principal components analysis (PCA) and analysis of variance (ANOVA). The rest of the paper is organized as follows. In the next section, the proposed ANN and SVM models are explained. The third section presents the results and discussion and conclusions are drawn in the final section.
Materials and methods
Materials
This study uses data provided by a Turkish textile plant. The dataset includes 37 types of fiber quality characteristics and spinning parameters and 10 types of core yarn quality characteristics. There are 227 samples for each of them without any missing data. The quality characteristics and spinning parameters of the fiber are collected from both HVI and AFIS machines. The datasets provided by the textile plant are divided into two columns representing the different textile quality control machines: HVI and AFIS. HVI is an automated bundle testing fiber quality control machine. It is mainly used to classify cotton and the mixture of fibers in the spinning mill. AFIS, which is a modular system, measures single fiber length, fineness, maturity and foreign matter and dust measurements as well as various statistical evaluations. In addition to the direct information about the fiber obtained by AFIS, parameters such as cleaning efficiency can also be calculated using input and output values.
Descriptive statistics for fiber characteristics from HVI

Descriptive statistics for fiber characteristics from AFIS

Aside from these inputs, results from the spinning and core spun tests of the fibers are also in the dataset. Spinning the fiber is part of the process of producing a yarn, so fiber with better spinning properties produces higher quality yarns. The yarn number shows the relationship between the unit of length and weight of the yarn which also reflects the diameter or thickness of the yarn. Spinning (m/min) value is the spinning ability of the yarn. Since core fibers are used in this study, core spun test results were also used. Core spun test results include Lycra decitex (dtex) which is the count of elastane. Lycra dtex is the measurement unit of the count of elastane. Take off value shows how many times the fiber was stretched. Ratio value represents the ratio of fiber length to fiber breadth (diameter), which relates to the suitability of a fiber for spinning into yarn.
Descriptive statistics for spinning and core spun test results

Quality characteristics of cotton/elastane core yarn are also included in the dataset. Each of the 227 samples was tested before and after being processed into yarn. The resulting quality characteristics are all shown in the dataset. The ELG value is the elongation of the produced yarn. The RKM (Reisskilometer) value is the breaking point of yarn where the yarn will break under its own weight; it is basically the tenacity of the yarn. 29 BForce is the breaking force of the yarn. The thinness and thickness of the yarn is shown by Thin-50 and Thick + 50 values. Thin places indicate mass reductions, while thick places indicate mass increase, and neps indicates the increase of short mass. Yarns with more thick and thin places are more prone to breakage during spinning, and they are less efficient during winding and weaving. Thick places are yarn defects with a diameter greater than adjoining segments extending 6 mm in length. The most likely cause of thick places is poor drafting. Thin places are substantially smaller than adjoining places by at least 25%. Poor piecing of yarn breaks, opening and cleaning of the in-feed material and defective operation are some of the reasons for thin and thick places. 30 Neps140 or Neps (140%) and Neps200 or Neps (200%) are indexes of yarn unevenness which can effect weaving preparation, weaving efficiency and cloth smoothing. 31 The H value is for yarn hairiness.
Descriptive statistics for quality characteristics of the cotton/elastane core yarn

Methods
ANN
The idea of neural networks has been around for more than 60 years. The first neuron idea can be found in an article published in 1943, ‘A Logical Calculus of Ideas Immanent in Nervous Activity’. 32 The motivation behind neural networks is the capability to learn. The principle is that there is no need to explicitly program a neural network, as it can learn from training data or encouragement. This ability to associate data allows neural networks to solve similar problems without explicitly training for them. This increases their degree of tolerance against noise.
The basic processor of a neural network system is called a neuron, as shown in Figure 2. Inputs are connected with weighted links or synapses to transfer function. Basically, an input of a synapse is connected to the neuron with a specific weight. The weight of a synapse in an artificial neuron can be positive or negative. These weights determine the effect of the inputs. The transfer function or the adder then basically summarizes the weighted inputs into a net input. This function is actually a linear combiner which can be affected externally. This effect, called a bias, is meant to increase or decrease the net input. The net input is then put into the activation function or the squashing function. This function basically squeezes the amplitude range of the output to a bounded value. If necessary, the lower limit of an activation requirement can be determined. This limit, called the threshold, is compared against the net input. If the net input is not higher than the threshold, the neuron will not activate. If it is higher then the neuron’s activation function will transform the net input into an output.
33
The basic structure of a neural network neuron.
The most common neural network consists of an input level or layer, a hidden layer and an output level. The input level is the place where external data enters the network. The hidden layer is the network’s calculation and transformation layer. The neuron adds weights to them namely wij and calculates the transfer function,
A network can have many hidden layers yet every neural network needs at least one. The output level is where information exits the network. If there is more than one layer between input and output, as seen in Figure 3, then the neural network is called a multilayer perceptron (MLP) neural network. MLPs are also called feedforward neural networks.
MLP neural network architecture.
Exemplary inputs and outputs are called training samples and these samples are given to neural networks with a learning procedure, which is a mathematical formula or algorithm such as backpropagation or Levenberg-Marquardt. 34 The number of features affects the size of the training sample. If too many features are chosen, the size of the training sample should increase accordingly. If the size of the training sample is kept the same while the number of features is increased, performance of the ANN drops severely. This is called the peaking phenomenon. Therefore, it is necessary to keep the number of features as low as possible without hurting the main objective. Both PCA and ANOVA are frequently used for input size reduction.
In this study, three different learning methods for ANN are used: Levenberg-Marquardt, Bayesian regularization, and scaled conjugate gradient algorithms.
The Levenberg-Marquardt method is the standard technique for solving nonlinear least squares problems. Least squares problems arise in the context of fitting a parameterized function to a set of measured data points by minimizing the sum of the squares of the errors between the data points and the function. If the fit function is not linear in the parameters, the least squares problem is nonlinear. 35 The Levenberg-Marquardt algorithm is preferred because it provides rapid convergence and stability in the training of ANN. 36
Bayesian regularized ANN are more robust than standard backpropagation networks and can reduce or eliminate the need for lengthy cross-validation. Bayesian regularization is a mathematical process that converts a nonlinear regression into a ‘well-posed’ statistical problem in the manner of a ridge regression.
A scaled conjugate gradient algorithm is the combination of the Levenberg-Marquardt algorithm and the conjugate gradient algorithm. It avoids search functions and uses a Levenberg-Marquardt-like approach to find the step size. The scaled conjugate method is shown to be faster yet less accurate than the Levenberg-Marquardt method. 37
SVM
An SVM is a supervised learning algorithm for classification and/or regression problems. 38 It is also described as a discriminative classifier defined by a separating hyperplane. This algorithm produces a hyperplane to categorize new examples according to the learning data. 39
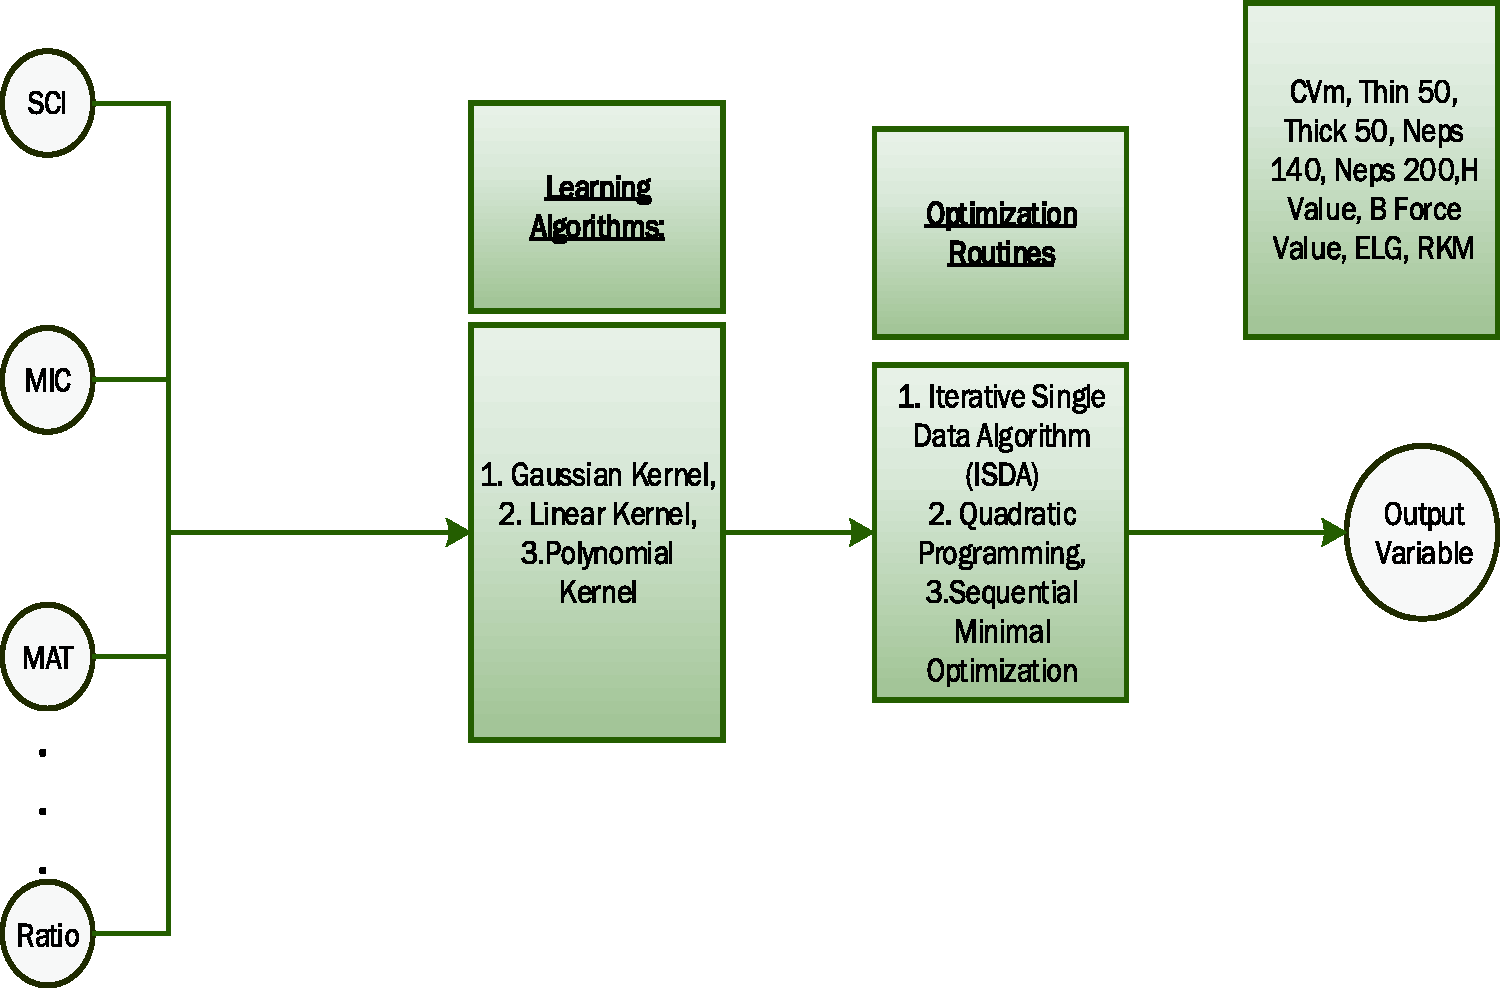
SVMs use kernels to directly operate on the input space. This is the characteristic ‘crossness’ of SVMs. They help developers to act as though they are using a basic linear algorithm, while in fact using complex algorithms like pattern recognition, regression or feature extraction. Gaussian kernel, linear kernel and polynomial kernel methods were used as learning algorithms for the SVM models. Iterative single data algorithm, quadratic programming and sequential minimal optimization methods were used as solvers.
Proposed ANN and SVM for the prediction of quality characteristics
ANN models were trained with the Levenberg-Marquardt, Bayesian regularization and scaled conjugate gradient learning algorithms. For the ANN models in each set there were three different learning algorithms each with 10 different numbers of nodes. Since there were three sets of input data this makes a total of 90 different experiments just for the ANN models. All of these learning algorithms used a single hidden layer with a range of nodes, starting from 10 nodes and ending in 28 nodes. Different numbers of nodes were used to find the best result possible for all of the ANN and SVM models. For SVM there were three sets of input data with three different learning algorithms each with three different solvers. This makes 27 different models for SVM. In total 117 models are analyzed. The experimental designs for both models are shown in Figure 4 and Figure 5.
Experimental design for ANN. Experimental design for SVM.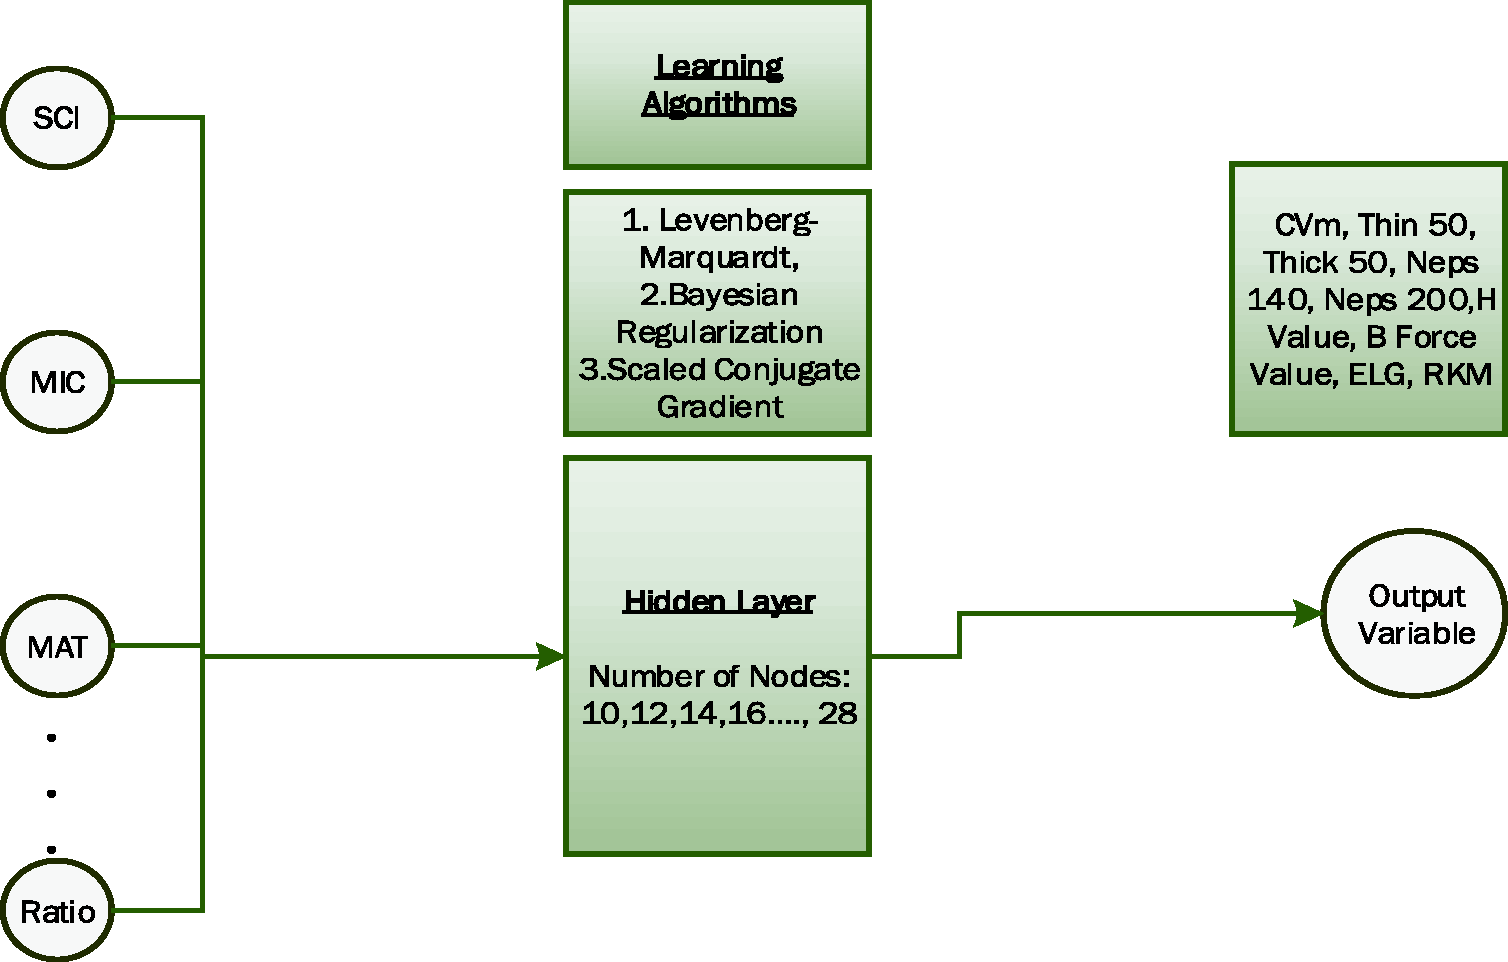
Dataset for testing models

Results and discussion
In this study, all of the ANN and SVM models were used to predict yarn quality parameters using fiber spinning and quality parameters. Input size was reduced using both PCA and ANOVA. Both reduced and non-reduced input sets were used for predictions, allowing for a comparison between reduced and non-reduced input size and their effects on the performance of ANN and SVM. MAPE and R were used as performance indicators for all of the ANN and SVM models.
PCA and ANOVA results
PCA eigenvalue matrix

Input dimension reduction by ANOVA is based on the effect of input variables on different output variables. Taking a 99% confidence rate, any significance value (P value) greater than 0.01 was regarded as an input variable not having a statistically significant effect on the mentioned output variable. According to the ANOVA results, 30 out of 37 input variables were found to be significant on the value of Neps140 while 29 of the 37 input variables were found to be statistically significant on the value of CVm, Neps200, H, BForce, ELG value and RKM value. For Thin-50 and Thick + 50, only three and six input variables had statistically significant effect on them, respectively. For CVm value, Mic, Str, Len and yarn twist are considered to be highly correlated. 40 ANOVA analysis expresses this relationship clearly. It is known that yarn count and spinning or twist are highly effective on Thin-50. 30 This study confirms yarn count to be effective, yet ANOVA excluded the spinning parameter; this may be caused by environmental variables or machine settings. It is also known that Thick + 50 values are highly correlated to rotor speed, rotor diameter, yarn count and spinning.30,41 Rotor diameter is not included in this study since it was not supplied in the dataset procured from the textile plant. Yarn count and spinning are both found to be significant by ANOVA. Ratio is also significant on Thick + 50. This is considered to be caused by the previous studies not including the ratio characteristic. Neps140 and Neps200 values were previously found to be effective on white specks which was correlated with FinemTex, nep per gram and immature fiber content. 42 With ANOVA, fineness (defined with FinemTex), nep per gram (defined with Nep Cnt/g) and maturity are all found to be significant on Neps values. Seed coat nep size (defined with SCN (um)) and fiber length are also found to be significant on both Neps140 and Neps200 values. These results coincide with the literature about neps. Previous studies also found rotor speed and rotor diameter to be parameters having an effect on neps, but this study did not have those parameters as input dataset. Fiber fineness, length, strength, short fiber content (SFC), trash content, thresh area, yarn count and yarn twist are known to have significant effects on yarn hairiness (defined with the H value).43–47 However, a study by Krupincova and Meloun in 2013 showed that yarn hairiness is primarily affected by yarn twist and yarn count. 48 ANOVA also corresponds with literature finding yarn count, spinning, trash content, thresh area, SFC and FinemTex to be significant. RKM is primarily affected by fiber length. 49 Every parameter of length is also included by ANOVA.
ANN and SVM results
Performance results of ANN and SVM

Performance results of ANN and SVM for each output variables

Figure 6 and Table 9 show the predictions by ANN and SVM for the CVm quality parameter and indicate that both ANN and SVM results are close to actual output except for one outlier point. ANN and SVM models give MAPE of 9.96% and 9.06%, respectively. It can be said that both models show high prediction success for CVm. Both ANN and SVM missed sample 26 with large margins. Sample 26 can be seen as an outlier of the actual values.
Test results for CVm output by ANN and SVM against actual outputs. CVm and BForce output values by models on test samples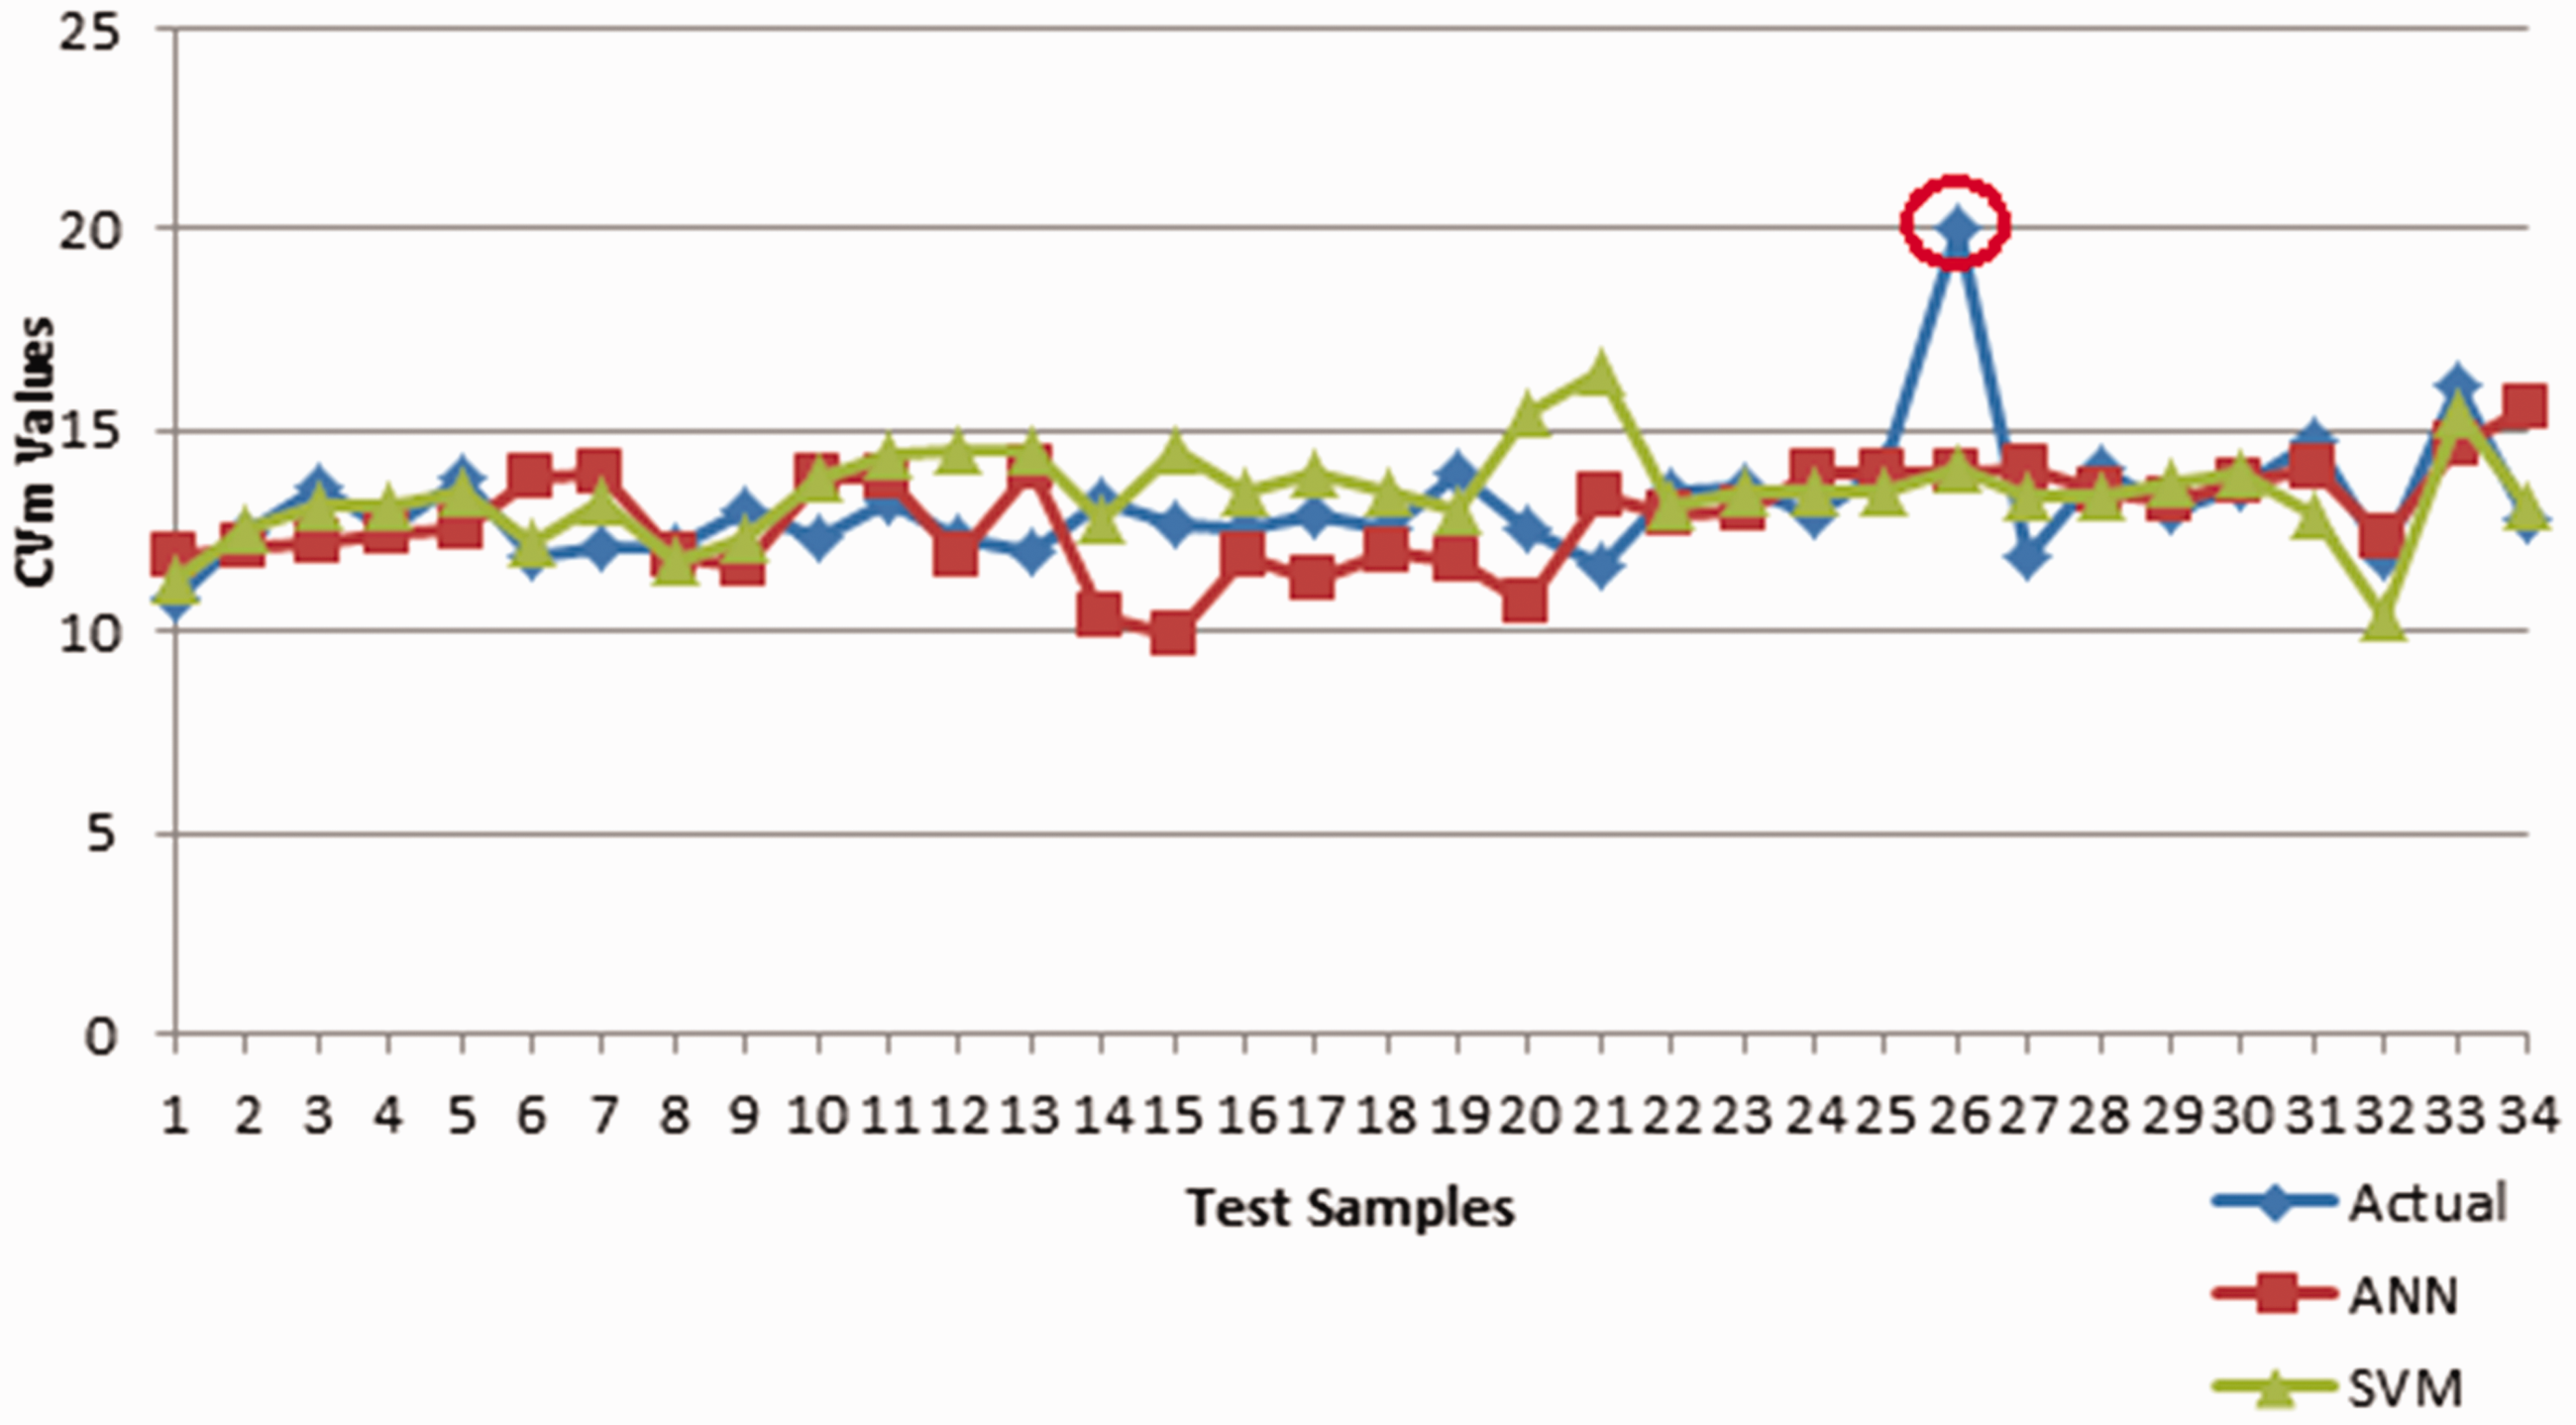

Figure 7 and Table 9 show that SVM model predictions for BForce values are closer to the actual values than the predictions by ANN. MAPE is 21.16% and 14.90% for the ANN and SVM models, respectively. Sample 1 has a large margin of prediction error with the ANN model, while this is not true for the SVM model. Sample 27 is shown as the outlier for both models.
Test results for BForce outputs of ANN and SVM against actual outputs.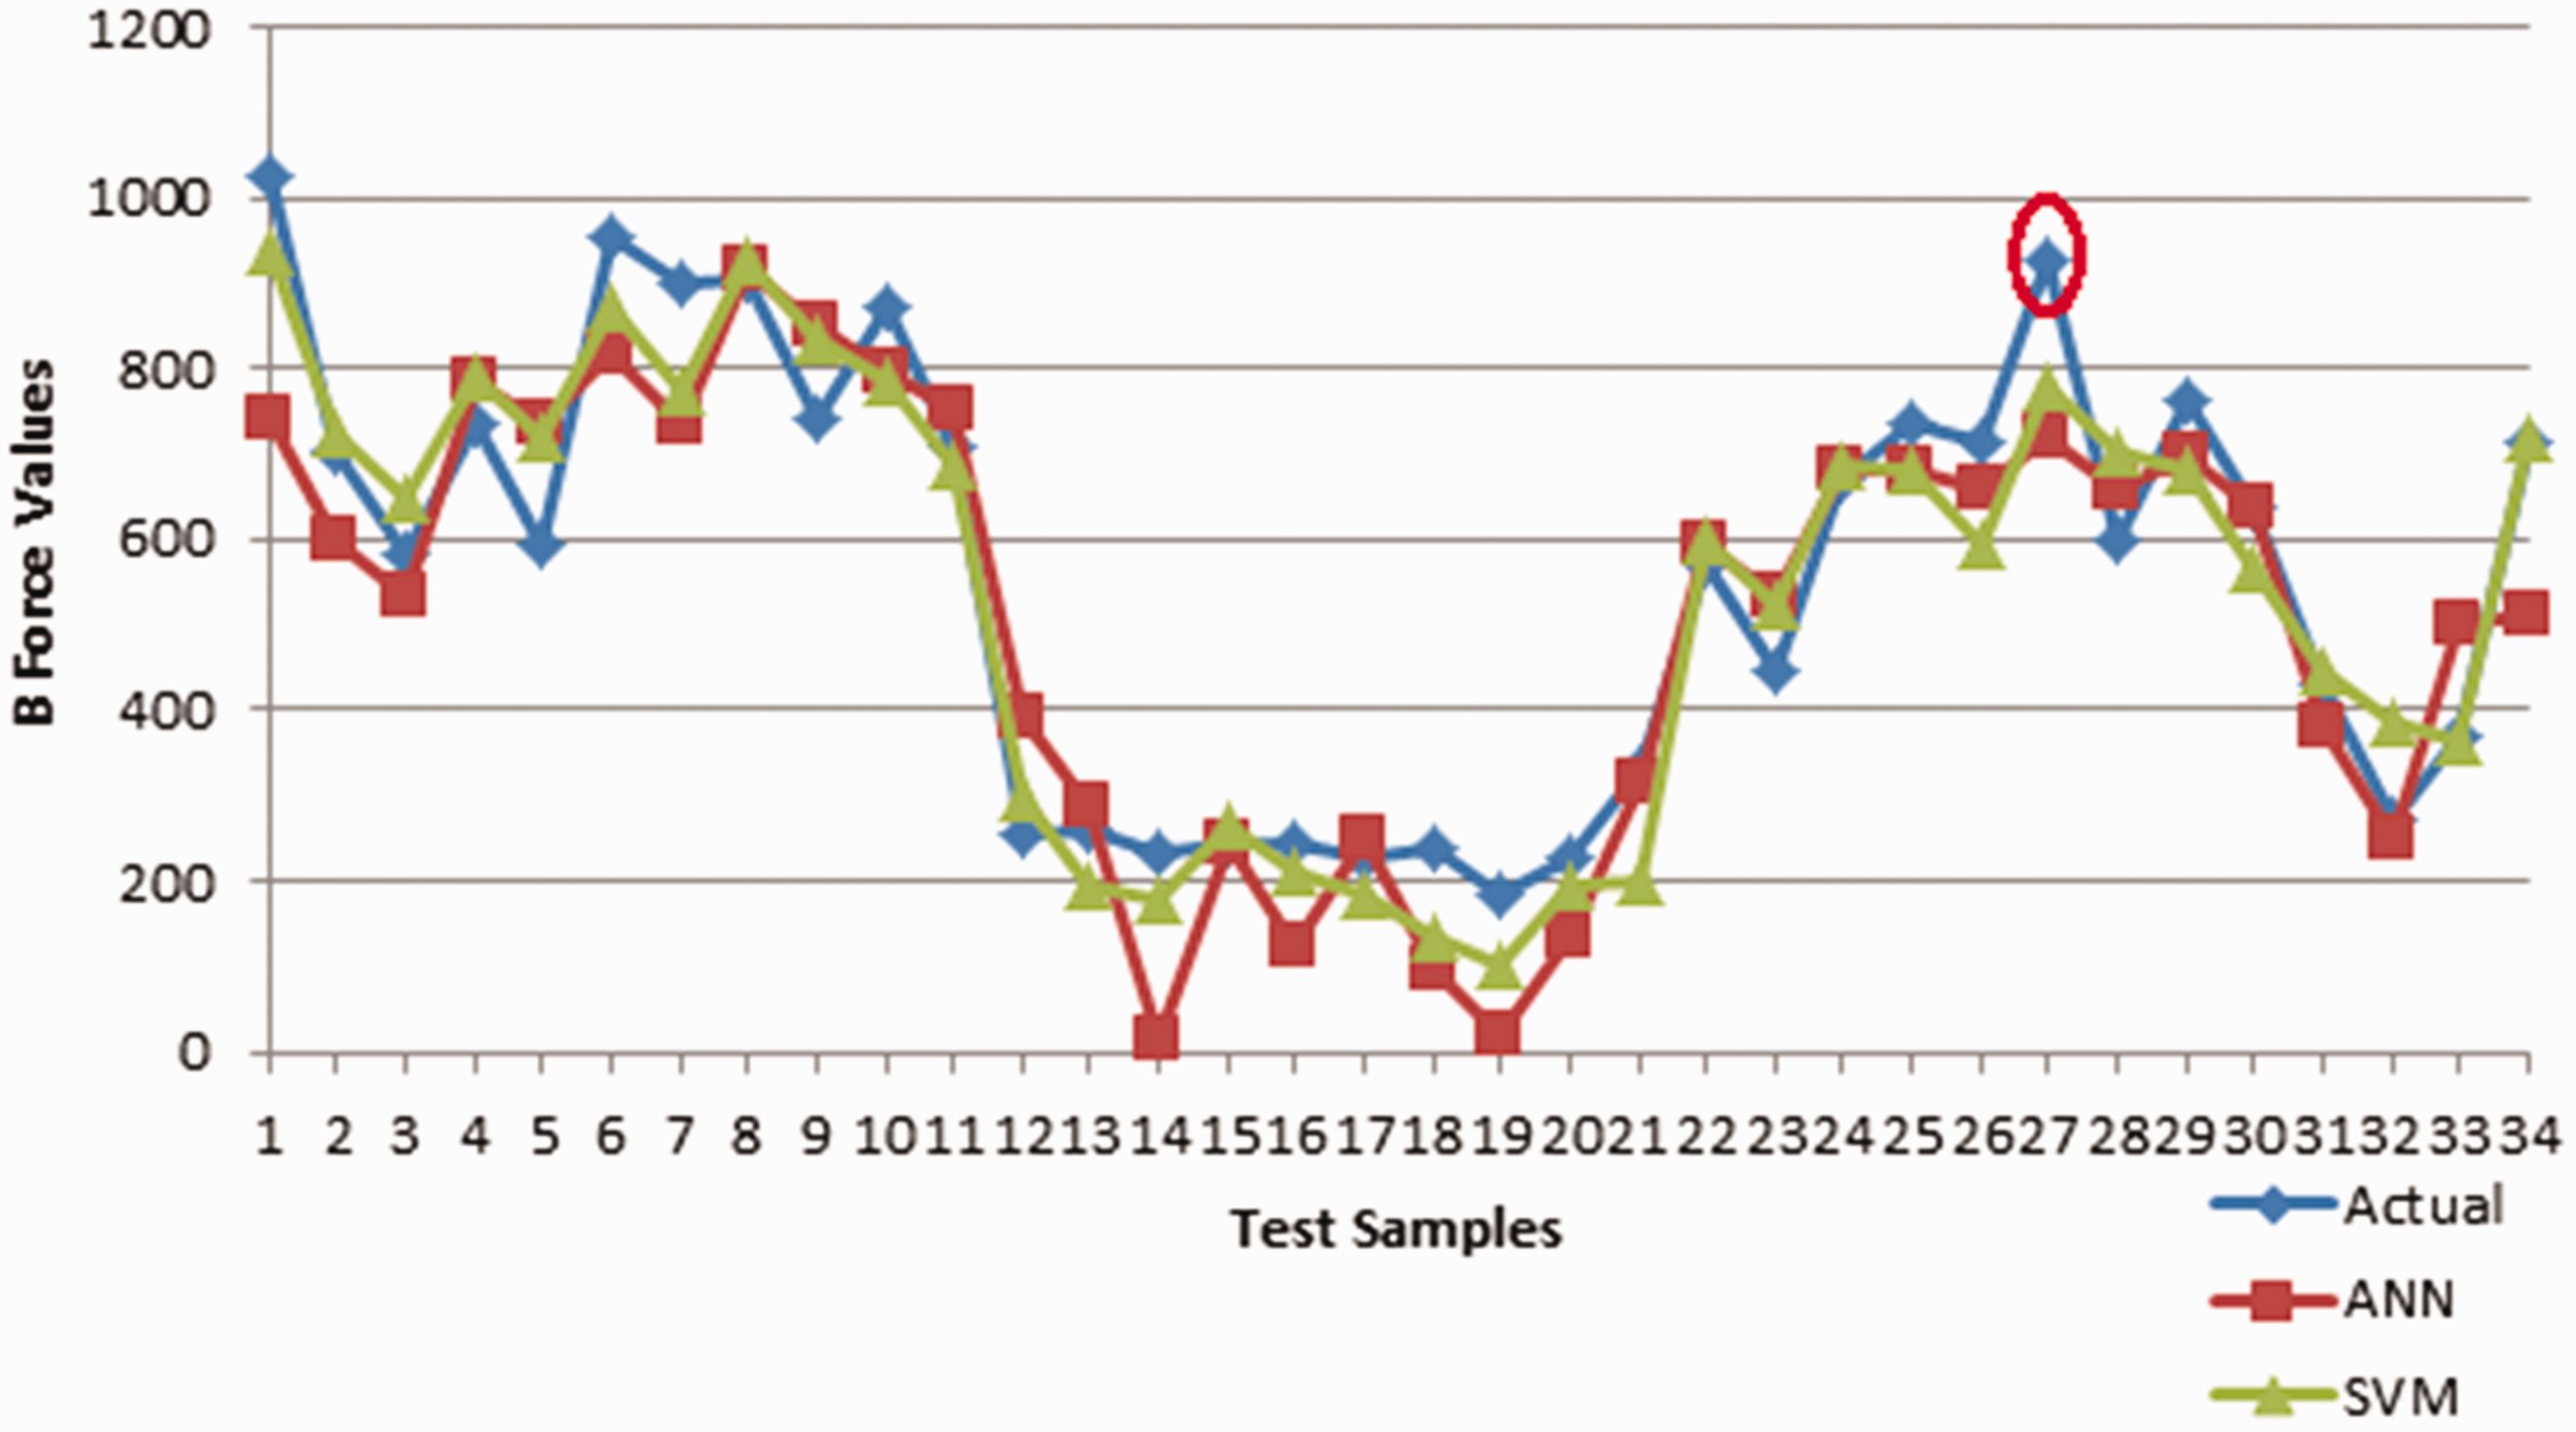
Figure 8 and Table 10 show the predictions by ANN and SVM for the Thin-50 quality parameter. They also show that both SVM and ANN prediction results have huge outliers and rarely conform to the actual values. For the most part on the Thin-50 values, none of the models give predictions close to actual values. SVM has a large margin of prediction error in some samples, shown within a circle on the graph in Figure 8. The reason that both models fail to predict Thin-50 correctly could be that for the Thin-50 quality characteristic we know that fine count yarns necessarily have higher Thin-50 values, but the textile plant where the data was collected generally processes low yarn numbers, as seen in Tables 3, 4 and 5. This could have diminished the training success and resulted in a distinct error value for both models. Sample 19 which has a fine yarn (yarn number/count 50, see Table 5) as input may have caused a large error value since the data provided did not include many examples of fine yarn (high yarn numbers/counts). Thin-50 is one of the outputs with a high coefficient of variance, as shown in Table 4. This could be another reason for the model’s failure to estimate this output value correctly. We also see a supporting result in MAPE values obtained by ANN for the test data including coarse yarns (yarn counts between 8 and 30) which is less (MAPE = 0.98) than the test data including fine yarns (yarn counts between 40 and 50). Another reason could be that only three input parameters of the dataset were found to be statistically significant on Thin-50 by ANOVA. It is known that there are more parameters such as rotor speed and rotor diameter that affect Thin-50.
Test results for Thin-50 outputs of ANN and SVM against actual outputs. Thin-50 and Thick + 50 output values by models on test samples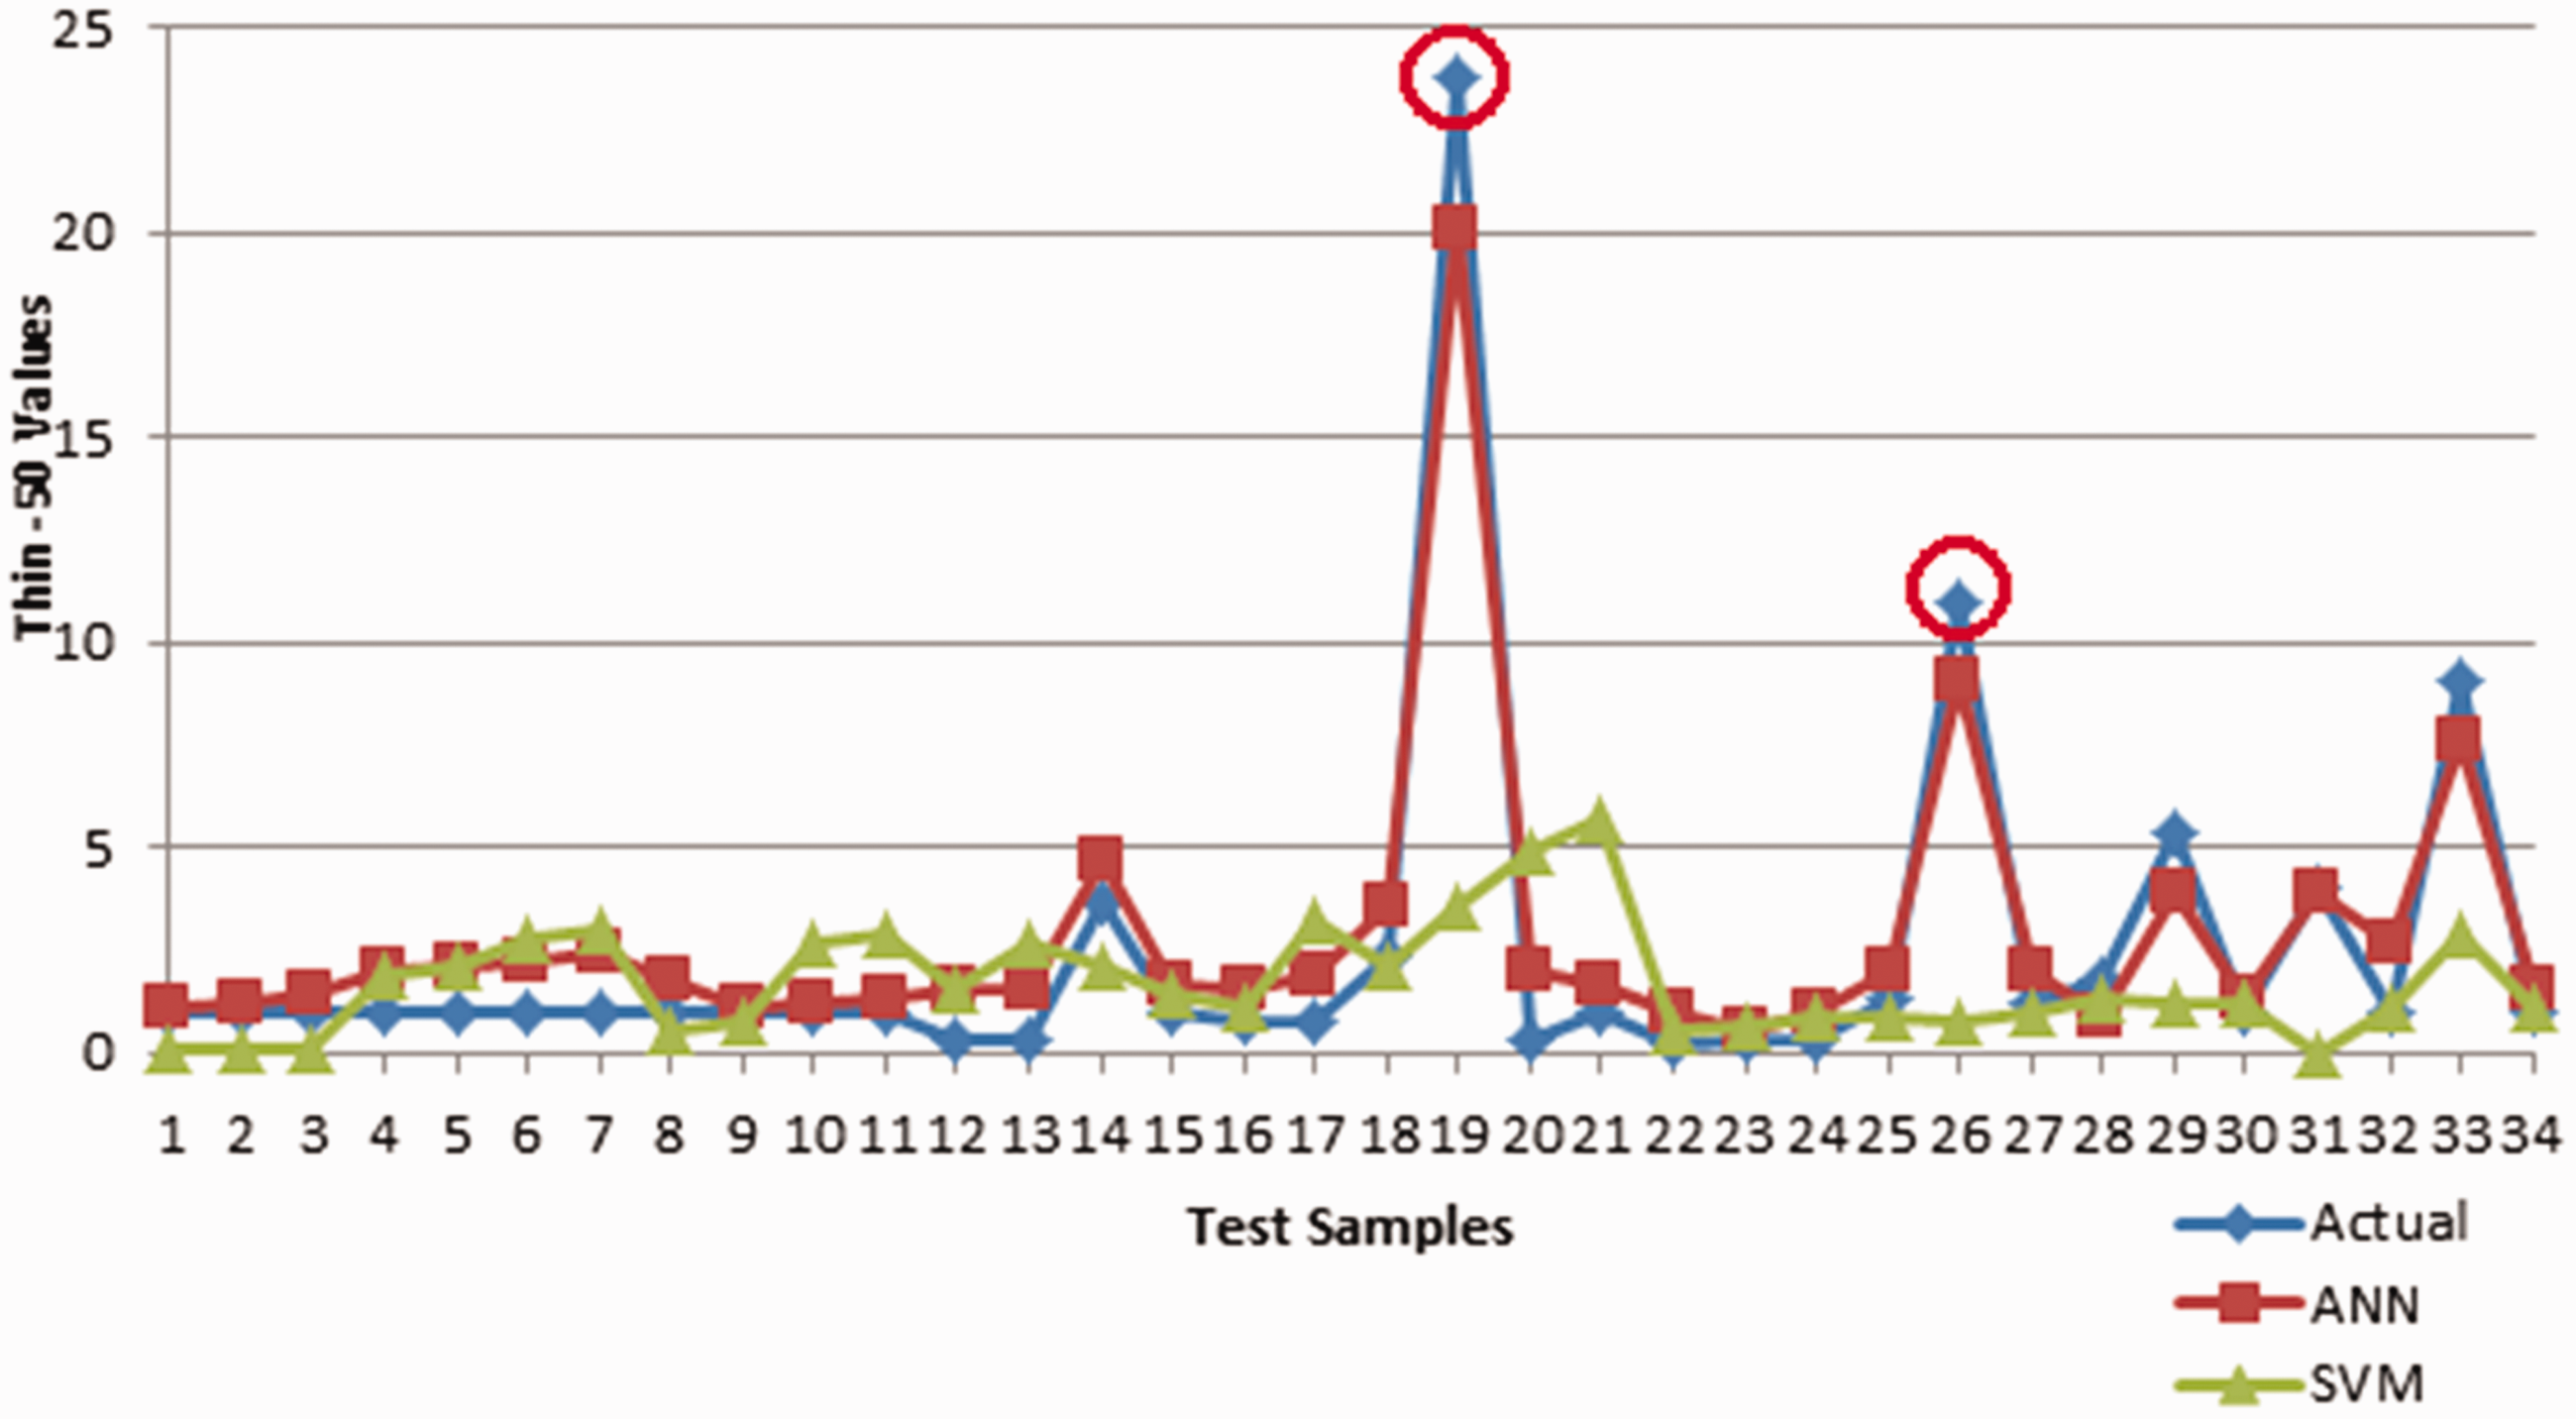

Figure 9 and Table 10 also show that, for the most part, ANN results fare better than SVM results when it comes to Thick + 50 values. On samples 26 and 33, both models fail within large prediction error margins. The reason Thick + 50 is harder for the models to predict correctly could be that just six input parameters were found to have a statistically significant effect on it by the ANOVA and PCA models. It is known that Thick + 50 values are highly correlated to rotor speed, rotor diameter, yarn count and spinning.30,40 Rotor diameter is not included in this study since it was not supplied in the dataset procured from the textile plant. Thick + 50 was also shown in Table 4 to have a high coefficient of variance value. The degree of variability within the data could have adversely affected the accuracy of the model. The lack of rotor diameter in the prediction models could give mistaken results. Uncontrollable or noise factors such as humidity, vibration and environmental temperature and some machine settings that are not used as input parameters could also decrease the model accuracy for the prediction of output parameters such as Thick + 50.
Test results for Thick + 50 outputs of ANN and SVM against actual outputs.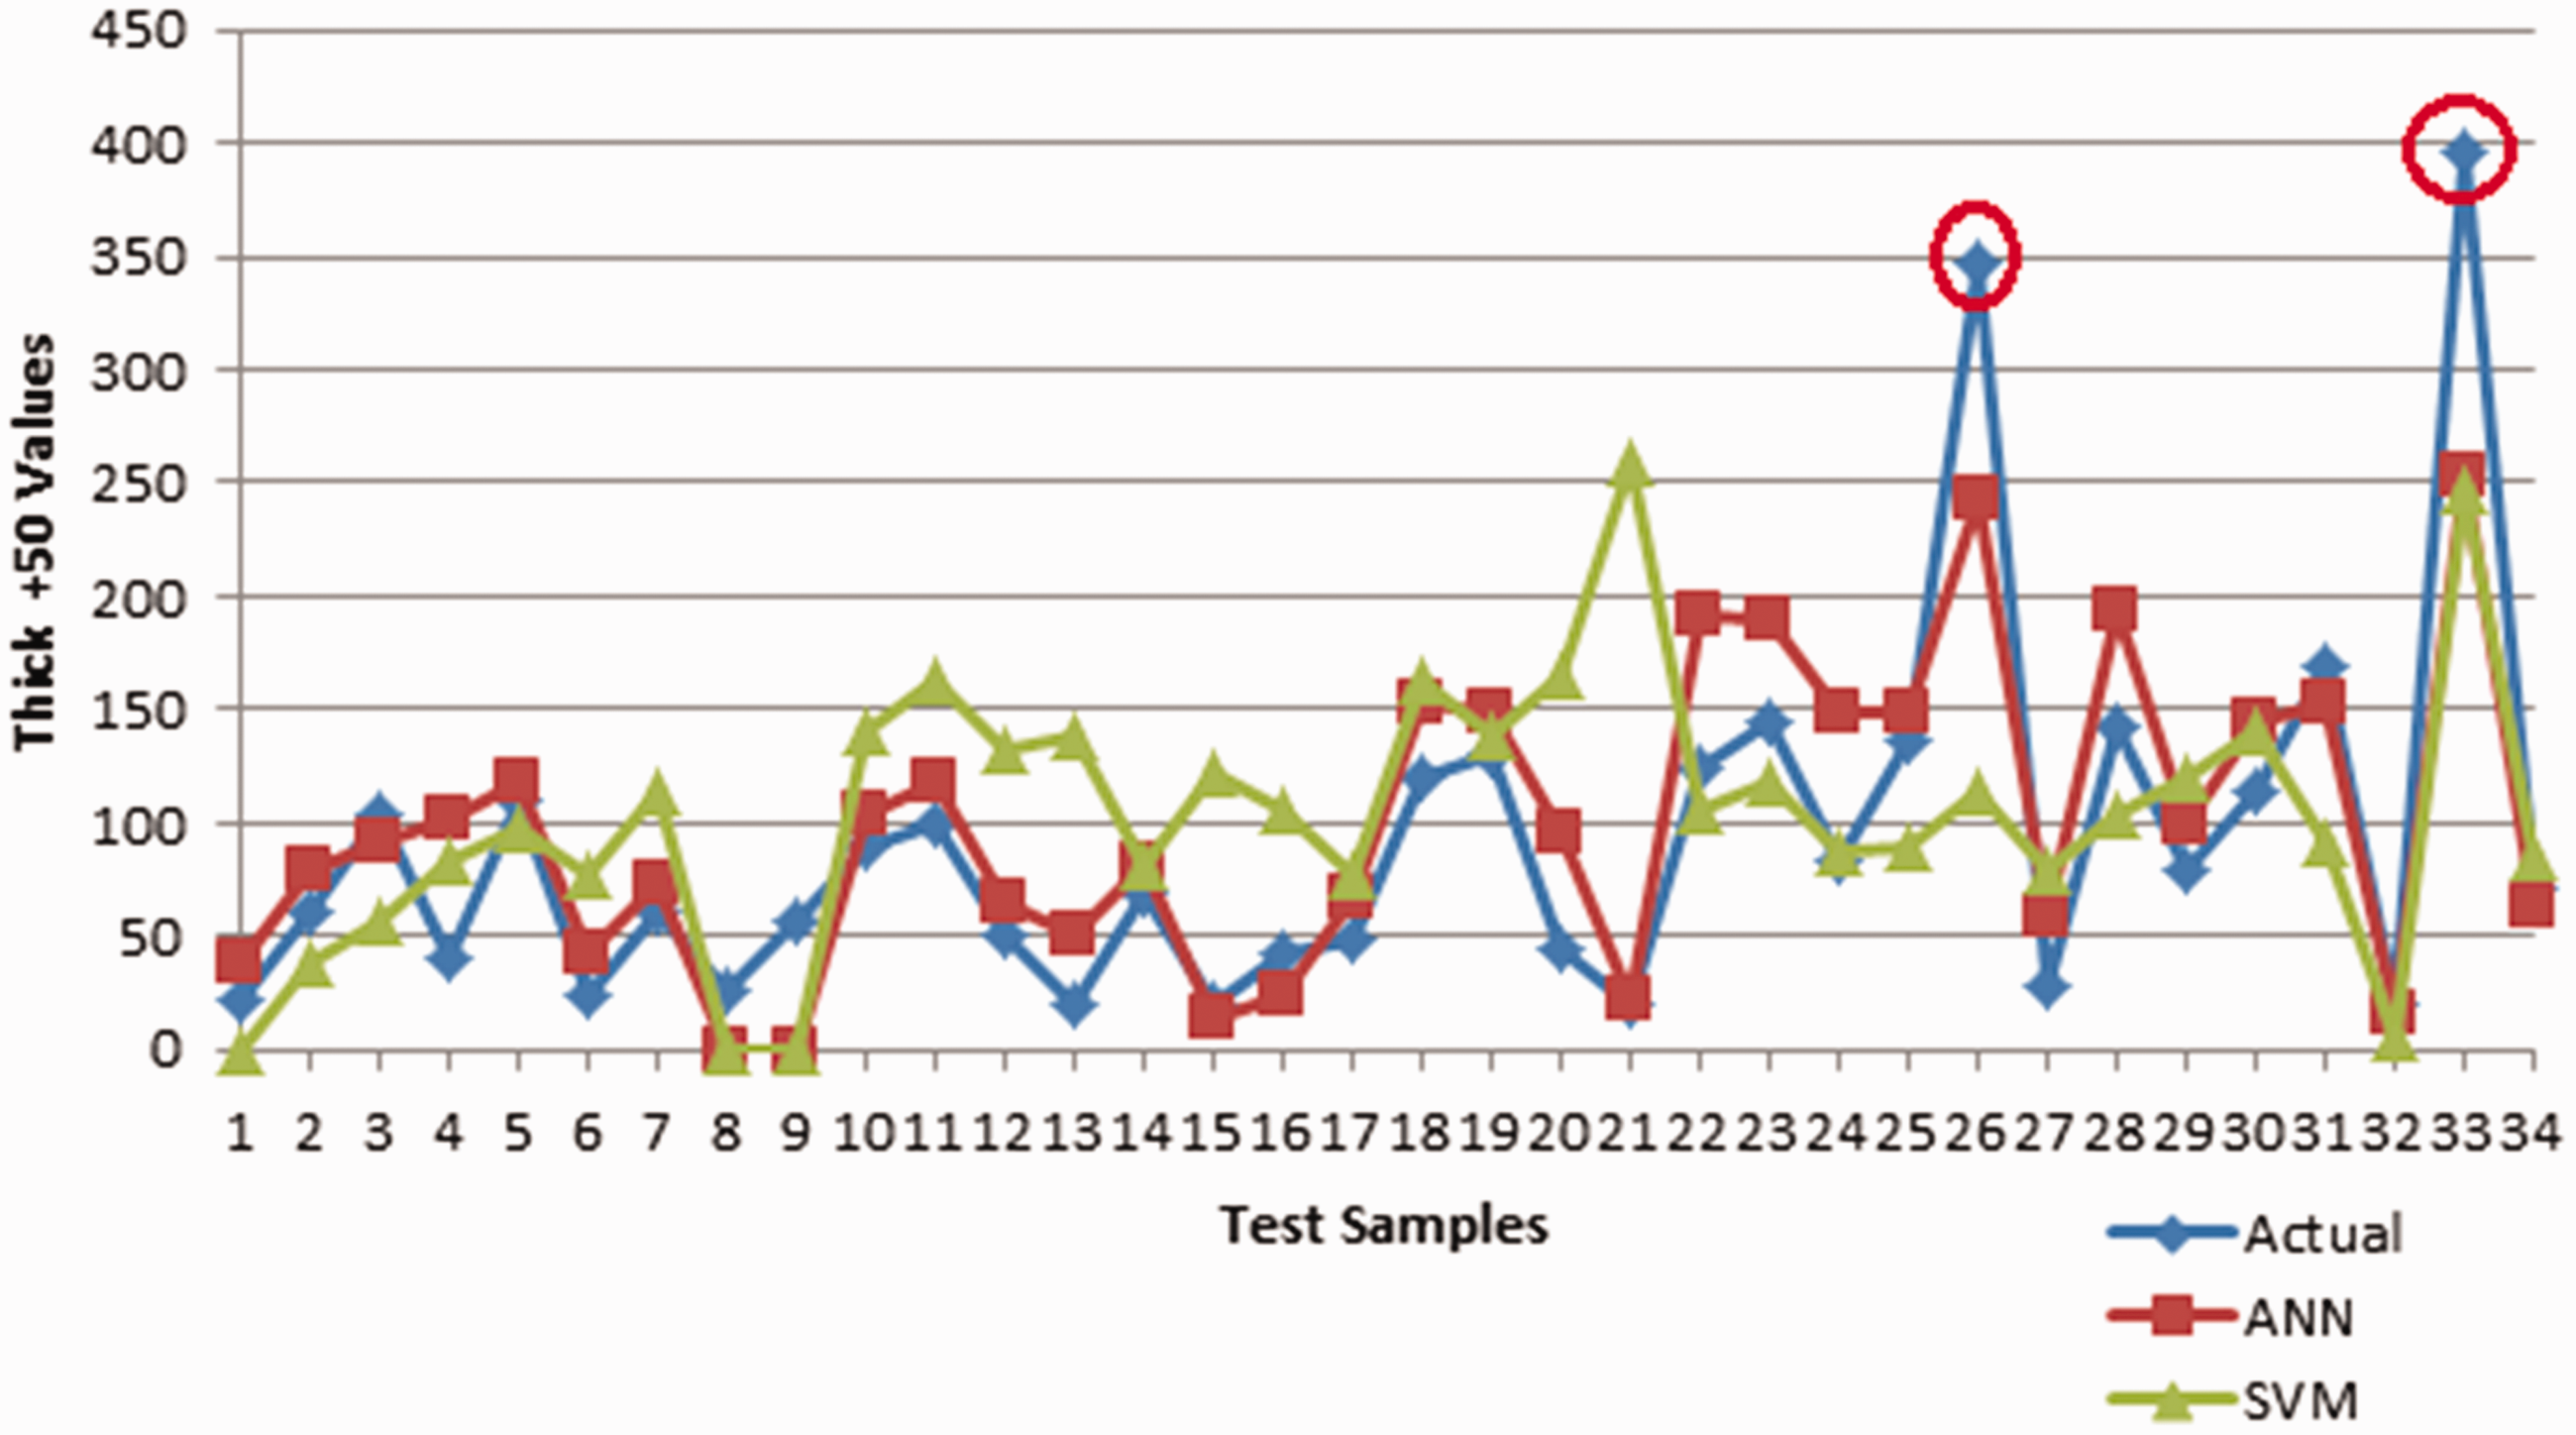
Figure 10 and Table 11 show that for the most part on the Neps200 values, the predictions of the ANN model are closer to the actual values than those of the SVM model. MAPE is 48.21% and 76.79% for ANN and SVM models, respectively. Both models have large margins of prediction error on most of the test samples. The reason the models are able to predict both Neps140 and Neps200 with low accuracy could be that both of these output values, with high coefficient of variation, make it more difficult for the models to learn. Sample 16 has a fine yarn (yarn number/count 40) as input which was rarely seen in the data. This may have caused the model to have insufficient training on fine yarn (high yarn numbers/counts). Figure 11 and Table 11 show that both the ANN and SVM model predictions are far from actual Neps140 values. MAPE is 31% and 41% for ANN and SVM models, respectively. Both models have large prediction errors, yet SVM has more errors than the ANN model, which shows in their MAPE values. Previous studies found that rotor speed and rotor diameter were parameters having an effect on neps, yet this study did not have those parameters as input dataset. Therefore, the predictive power of the models may be relatively low because of these missing parameters.
Test results for Neps200 outputs of ANN and SVM against actual outputs. Test results for Neps140 outputs of ANN and SVM against actual outputs. Neps140 and Neps200 output values by models on test samples
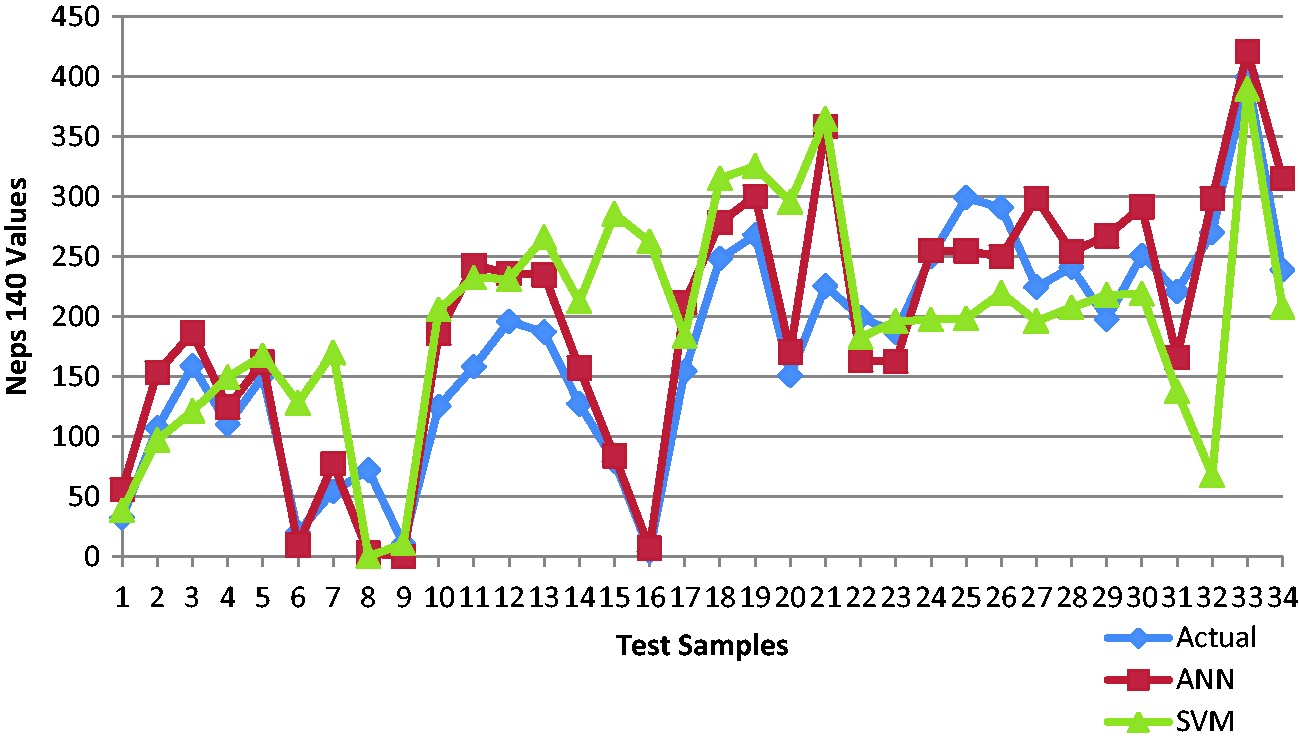

Figure 12 and Table 12 show that both the ANN and SVM models predict H values successfully and the values predicted by the models are very close to the actual values of H. MAPE is 7.45% and 6.58% for the ANN and SVM models, respectively. It also shows that the SVM model has smaller prediction errors and slightly lower MAPE value, showing that SVM could be the better model for predicting H value. Figure 13 and Table 12 show that both the ANN and SVM models have good prediction accuracy for ELG and the values predicted by the models are close to the actual values. MAPE is 11.76% and 10.69% for the ANN and SVM models, respectively. Both ANN and SVM are able to predict ELG values with high performance. Samples 19 and 25 both have large margins of prediction error for both models, however.
Test results for H outputs of ANN and SVM against actual outputs. Test results for ELG outputs of ANN and SVM against actual outputs. H and ELG output values by models on test samples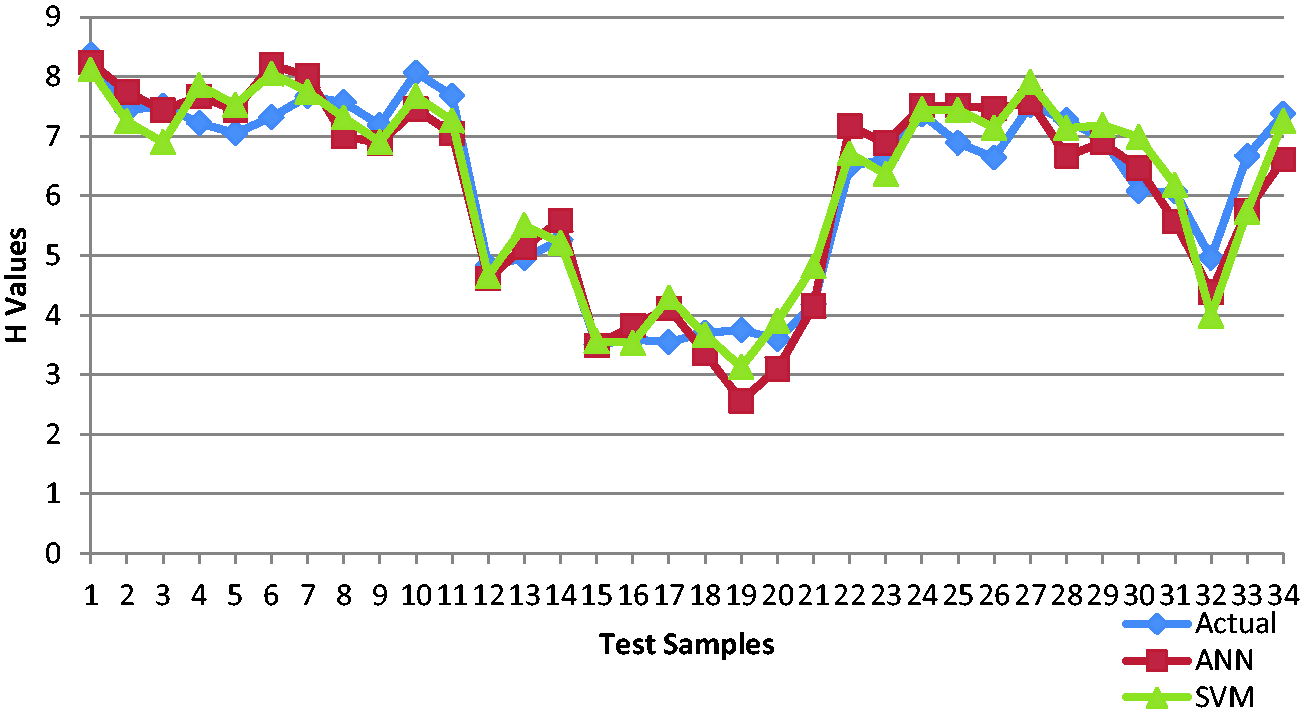
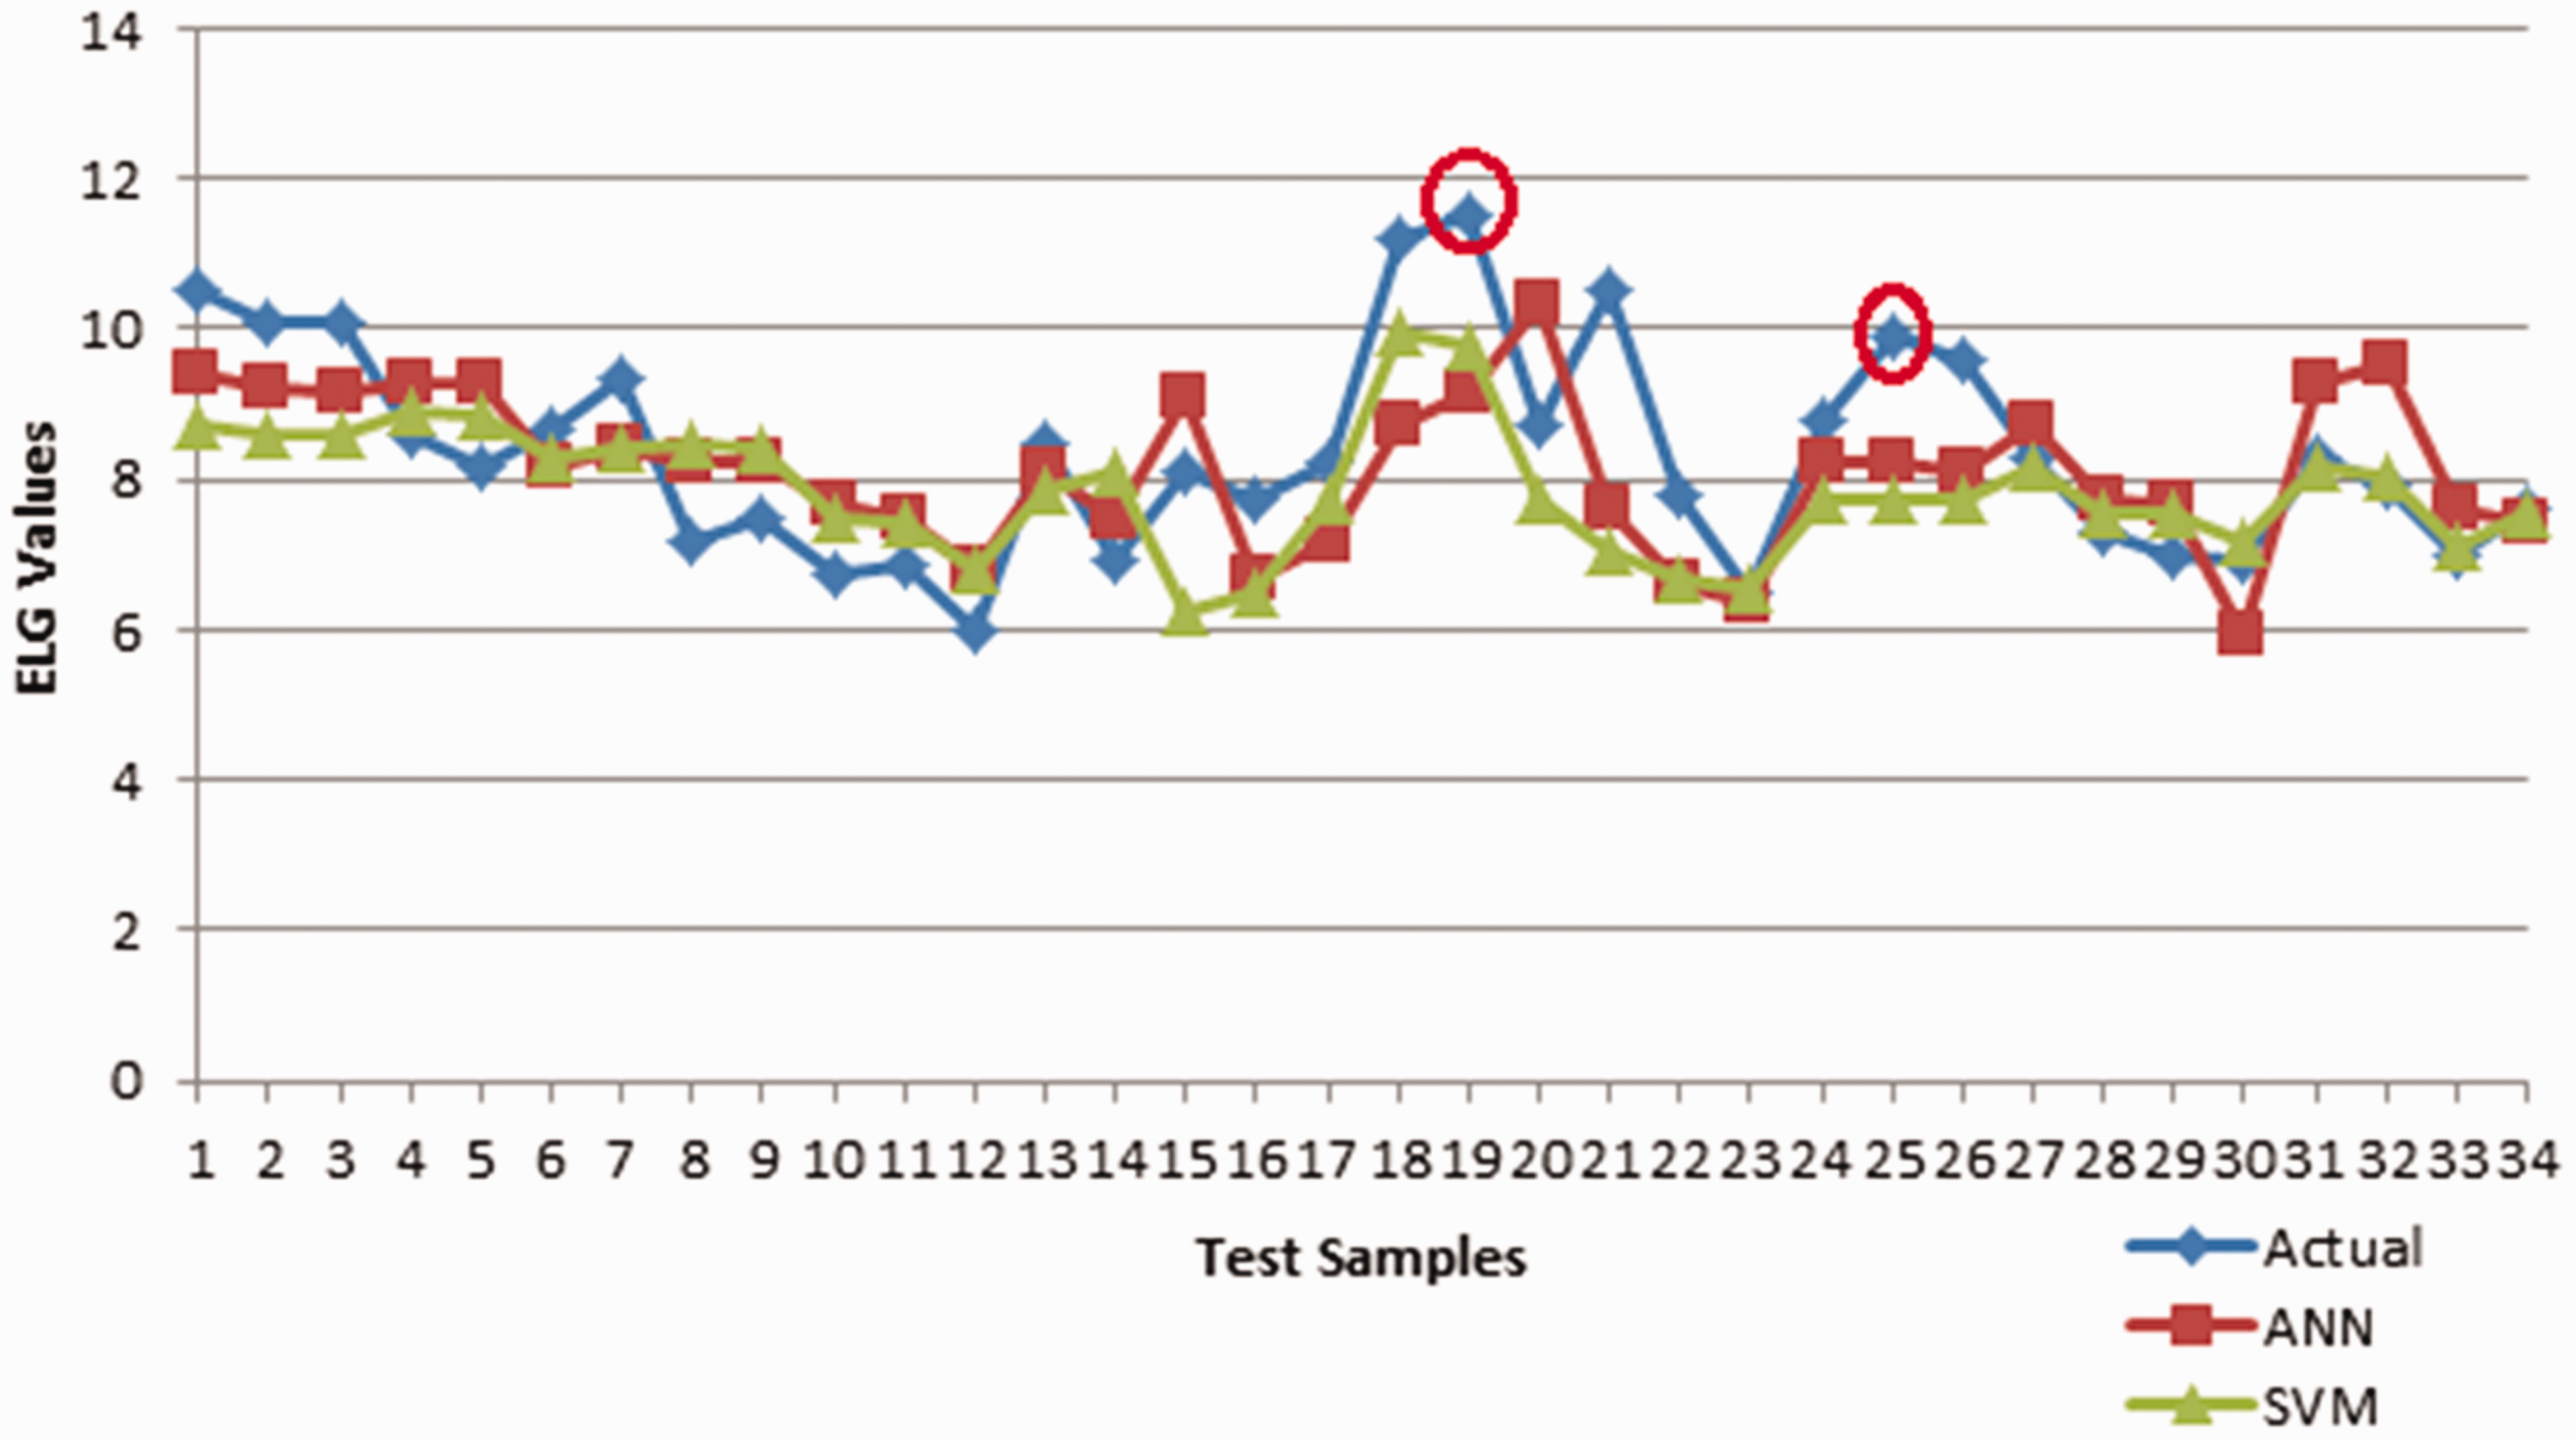

Figure 14 and Table 13 indicate that the predictions of both the ANN and SVM models are close to the actual RKM values. MAPE is 5.40% and 6.96% for the ANN and SVM models, respectively. Each model has less than 10% prediction error which makes them good predictors of RKM values.
Test results for RKM outputs of ANN and SVM against actual outputs. RKM output values by models on test samples

Conclusions
As a result of this study which developed ANN and SVM models for the prediction of quality parameters of elastane core yarn, the following conclusions can be drawn.
A common problem of textile plants is the effect of interactions between the sequential processes of the ongoing production lines on the material properties and the absence of engineering approach to this interaction to form a mathematical problem. In other words, there is no answer to how a single process affects the product performance individually or by the interactions between previous or next processes. At present, textile plants depend on the experience of the workers in addressing this problem. In this study, a new approach is proposed by using prediction models to be established with different artificial intelligence methods. In other words, the process based on experience is to make an engineering problem by forming prediction models. Predicting the parameters of elastane core yarns from the quality characteristics of the fibers will assist manufacturers to organize the technological processes. In fact it will allow the production planner to make an informed decision and manufacture the yarn with the required quality with minimum material waste. Therefore, modeling and predicting the properties of elastane core yarn are important subjects for textile researchers. This study provides them with exclusive information on how to select the most appropriate ANN and SVM models and how to interpret the results on test samples. This study proposes ANN and SVM prediction models to predict the quality characteristics of cotton/elastane core yarn using fiber spinning and quality parameters. The quality and spinning parameters of the fiber are collected from both HVI and AFIS machines. There are 37 parameters in total (it can be said to be high dimensional data) that may affect the quality characteristics of cotton/elastane core yarn and can be used as inputs of models. Quality characteristics of cotton/elastane core yarn are also included in the dataset. PCA and ANOVA dimensionality reduction techniques are used to reduce input dimensions since high dimensional input data may reduce the capacity of the models for successful prediction. Both reduced and non-reduced input datasets were used for predictions, allowing for a comparison between reduced and non-reduced input size and their effects on the performance of ANN and SVM. The model architectures are formed of an input layer, a single hidden layer and an output layer having nine nodes representing quality characteristics of cotton/elastane core yarn. MAPE and correlation coefficient (R) were used as performance indicators for both ANN and SVM models. These models were trained and tested. The models trained with input sets reduced by PCA were found to be the most successive among 117 models. Table 5 gives some input parameters for the test samples and also serves as an example of how the data was collected and classified. Tables 9, 10, 11, 12 and 13 show test output values for the test samples. They show the outliers in bold and can be used for comparison in future studies. Both the test results and input values are hereby shown to enhance the understanding and of both the material and the results. According to the test results, CVm, H, BForce, ELG and RKM can be predicted successfully by the models trained with input sets reduced by PCA. However, Thin-50, Thick + 50, Neps140 and Neps200 could not been predicted by the models with high accuracy, which shows in their MAPE. Thin-50, Thick + 50, Neps140 and Neps200 all have high coefficients of variation. Since a neural network efficiently learns data distribution, it is likely to learn the bias information to categorize input data. The data provided does not include many examples of high fine yarn numbers/counts. The reason Thick + 50, Thin-50, Neps140 and Neps200 are harder for the models to correctly predict could be that, as several researchers have concluded, Thick + 50, Thin-50, Neps140 and Neps200 are chiefly influenced by parameters not included in the dataset. Uncontrollable or noise factors such as humidity, vibration and environmental temperature and some machine settings that are not used as input parameters could also decrease the model accuracy. Additionally, there are a few input parameters that were found to have statistically significant effects on them and some of them have high standard deviation values within the dataset. Therefore, these reasons may cause the predictive success of the models to be relatively low. Although BForce has high standard deviation value, it is possible to predict with an 86% accuracy by the SVM model. ANN and SVM are adaptive algorithms. These results show that these models can generalize and predict parameters that are highly varied. In future studies, different prediction methods such as regression models could be used to predict these parameters. Additionally, increasing the number of datasets for parameter values rarely seen in the dataset can also improve the models’ learning ability and make them predict more accurately. Consequently, the results show that there is a great potential for this research in the field of computer assisted design in the prediction of quality characteristics of cotton/elastane core yarn with different prediction methods and suggest that the models are good candidates to be used in the prediction of some quality characteristics of cotton/elastane core yarn as a decision support tool in order to aid engineers to optimize parameters. 6.Increasing the number of experiments can increase the performance of both ANN and SVM, however, increasing the number of experiments and training size can cause the model to memorize the data causing an increase in error size. This study presents the best and most acceptable model after a number of trials, however, there are always more accurate and more capable ANN and SVM models. Both the SVM and ANN models are practical and useful for elastane core yarn producers in order to predict the quality characteristics of elastane core yarn before production. Both models are shown to be good predictors of CVm, H, BForce and RKM.
The data used to support the findings of this study are available from the corresponding author upon request.
Footnotes
Declaration of conflicting interests
The authors declared no potential conflicts of interest with respect to the research, authorship, and/or publicaton of this article.
Funding
The authors received no financial support for the research, authorship, and/or publication of this article.
