



Abstract
Fabric shape retention is an essential property for assessing fabric usability and easy-care properties, which needs to be evaluated frequently for quality improvement. At present, certain aspects of shape retention can be characterized by particular devices, such as the crease recovery tester, the fabric drape tester, etc. To effectively and accurately reflect fabric shape retention performance, we developed an automatic crease forming device to simulate fabric crease creation and the shape recovery process in daily life, and objectively assess the shape retention by an image processing method. A specified size specimen was laid flat on the device to create a sharp crease. Then, a video image of the fabric shape recovery is acquired for measuring the evaluation indexes, such as the vertex angle (VA), height (H) and shape retention area (SA). Finally, the results of this proposed method are compared with existing methods. When compared with the existing crease recovery tester, there is good consistency between the VA of the developed measurement system and the recovery angle of the fabric crease recovery tester, which indicates that the proposed method can be used to evaluate the crease recovery of fabrics. Compared with the drapability, there is linear function relationship between the H and SA of the developed measurement system and the draping coefficient of the fabric drape tester, which demonstrates that the proposed method can be used to evaluate the drapability. Therefore, experimental results indicate that the data calculated by our proposed method can be used to determine fabric shape retention.
Fabric shape retention, which is the character of keeping the appearance of fabrics in use, is closely related to fabric usability and easy-care performance. It generally includes wrinkle resistance, easy care, drapability, rigidity and flexibility, pilling resistance, dimensional stability, etc. The fabric wrinkle resistance, which is one of the most important indexes of shape retention, directly affects the smoothness and appearance of fabrics. Wrinkle or crease refers to the irreversible deformation of fabrics under the action of external forces in daily use. 1 The wrinkle recovery property of fabrics directly affects their shape retention and service life. 2 It is one of the most important properties for evaluating the usability of fabrics, especially in the military industry.
Crease generation methods can be divided into kneading, twisting and folding.3–5 In addition, the crease recovery property can be evaluated either by appearance assessment or recovery angle measurement. When using the appearance assessment method, the creased sample is compared to standard samples visually to measure the crease grade and indicate the crease property of the fabric.4,6 When using the recovery angle measurement method, a 40 mm × 15 mm fabric sample is folded and pressed for 5 minutes under specified conditions. After unloading the load, the sample is allowed to recover for 5 minutes. Then the crease recovery angle is measured.5,7 Since the late 1980s, machine vision and image processing technologies have been widely used in the study of reducing the subjective evaluation of fabric appearance smoothness.8–10 The features extracted by different technologies are selected to analyze the two-dimensional (2D) images or three-dimensional (3D) depth maps to describe the surface structure of the fabrics.11–15 Automatic detection of fabric wrinkle recovery performance is still in the exploratory stage. There are a few studies on improving the automation of the test method using laser or image processing methods.16,17 These studies insufficiently reflect the shape retention of fabrics using only the recovery angle as the evaluation index. Other than biaxially woven fabric, studies relevant to the shape retention of triaxial fabric have also received much attention. 18
This paper proposes a novel method for assessing fabric shape retention, by combining automatic control technology with video image processing technology. When compared with the existing relevant fabric shape retention evaluation devices, such as the Shirley crease recovery tester and the YG811E fabric drape tester, the developed test system makes three important contributions to the evaluation method: (a) it simulates the process of fabric deformation and recovery in daily use, which makes the results more realistic; (b) it automates the entire testing procedure so that human interference is eliminated; (c) it uses the video image processing method to measure the fabric shape retention parameters so test results are efficient and reliable. In short, the new method can automatic the fabric deformation, and track subtle changes in the deformation recovery process to provide a comprehensive understanding of fabric shape retention.
Method
Fabric shape retention testing device
This paper presents a novel method to objectively characterize the fabric shape retention and accurately evaluate the physical properties of fabrics. The method simulates the shape retention effect in use, that is, it produces a crease on the fabric and then lets the fabric flatten itself. A schematic diagram of the fabric crease formation and recovery process is shown in Figure 1.
Schematic diagram of the fabric crease formation and recovery process.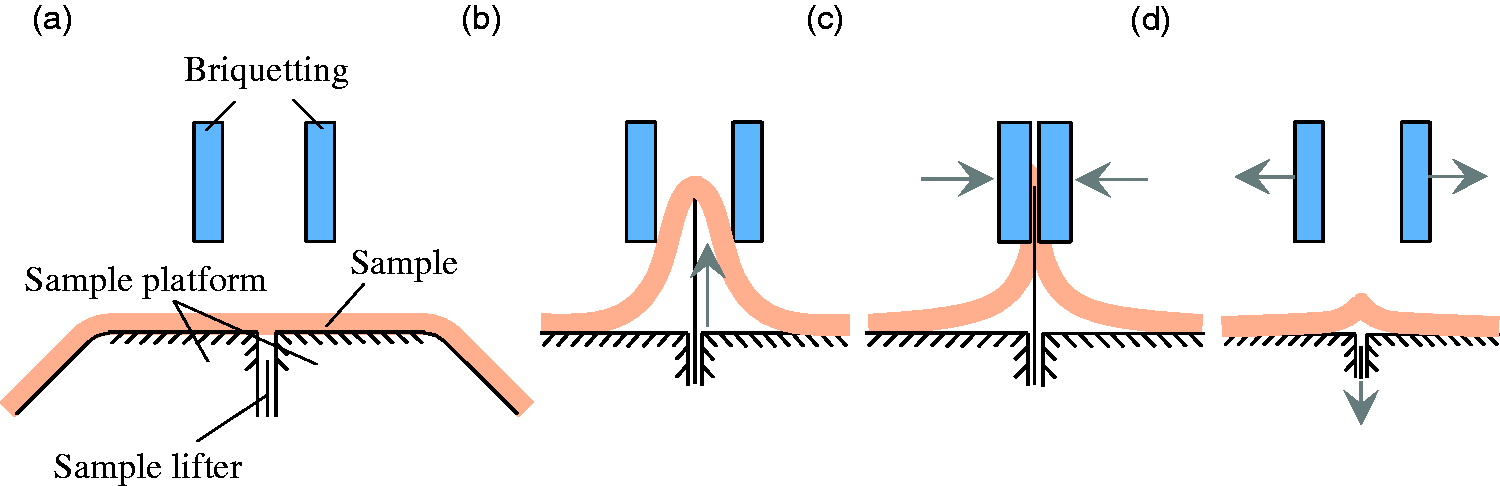
In Figure 1(a), a fabric sample is placed on the sample platform. The sample platform is composed of two pieces. The middle axis gap is convenient for the sample lifter to move up and down. The cross-section shape of the left- or right-hand platform is similar to a right-angled trapezoid, and the corner contact with the sample is a circular arc. Thus, the center line of the sample and the middle axis of the sample platform are aligned with each other. Since a sample is longer than the sample platform, its two sides are freely hung in the device. The sample lifter is placed at the lowest position before the experiment. Two briquettes are mounted above the sample platform. As shown in Figure 1(b), when starting the test, the sample lifter lifts part of the sample between the briquettes. Then, the briquettes move toward each other to press the sample (Figure 1(c)). Finally, when the specified pressing time is reached, the briquettes move backwards and the sample lifter rapidly descends. The sample is then allowed to freely recover its shape on the platform for 30 seconds (Figure 1(d)).
The above method is for a fabric shape retention testing device designed using an automatic control technology, as shown in Figure 2. After the fabric is allowed to recover for 30 seconds, video image processing technology is used to collect a video image of fabric crease recovery process, and to detect the index of each frame to accurately evaluate the fabric shape retention of the test fabric.
Fabric shape retention testing device.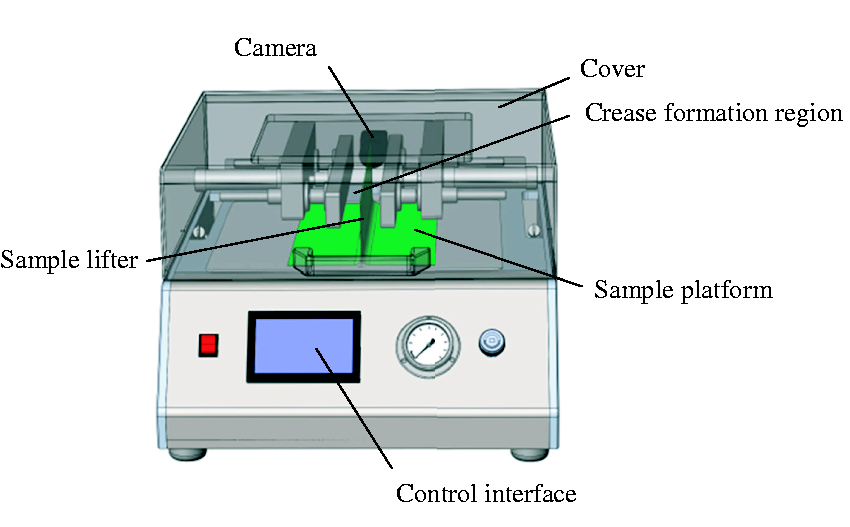
In Figure 2, the fabric shape retention testing device consists of the control interface system, camera, sample platform, crease formation region and sample lifter. The control interface controls the adjustment of pressure and pressure time of the crease formation region and the rising time of the sample lifter. The camera aligns with the sample platform to take video images of the sample cross-section in the crease recovery process. The sample lifter moves vertically along the axis gap position in the sample platform to control the up and down movement of the sample. The left- and right-hand briquettes in the crease formation region press the center axis of the sample and release the pressure, creating a sharp crease on the sample. The sample is placed on the sample platform in the specified position and freely flattened by itself. The experiment cover ensures the process is not disturbed by external factors.
Video image processing
The video image of the fabric shape recovery is captured using a Daheng industrial charge-coupled device (CCD) camera (MER-132-30GC). The computation was carried out in the MATLAB environment on a PC with an Intel(R) i3-1005G1 CPU @1.2 GHz and 8 GB memory. The captured image is an eight-bit grayscale, 1292 × 964-pixel image. The resolution of the image is 300 dpi. The video image processing software is used to assess the fabric shape retention of each video image frame. One video image is shown in Figure 3.
Video image of a folded specimen.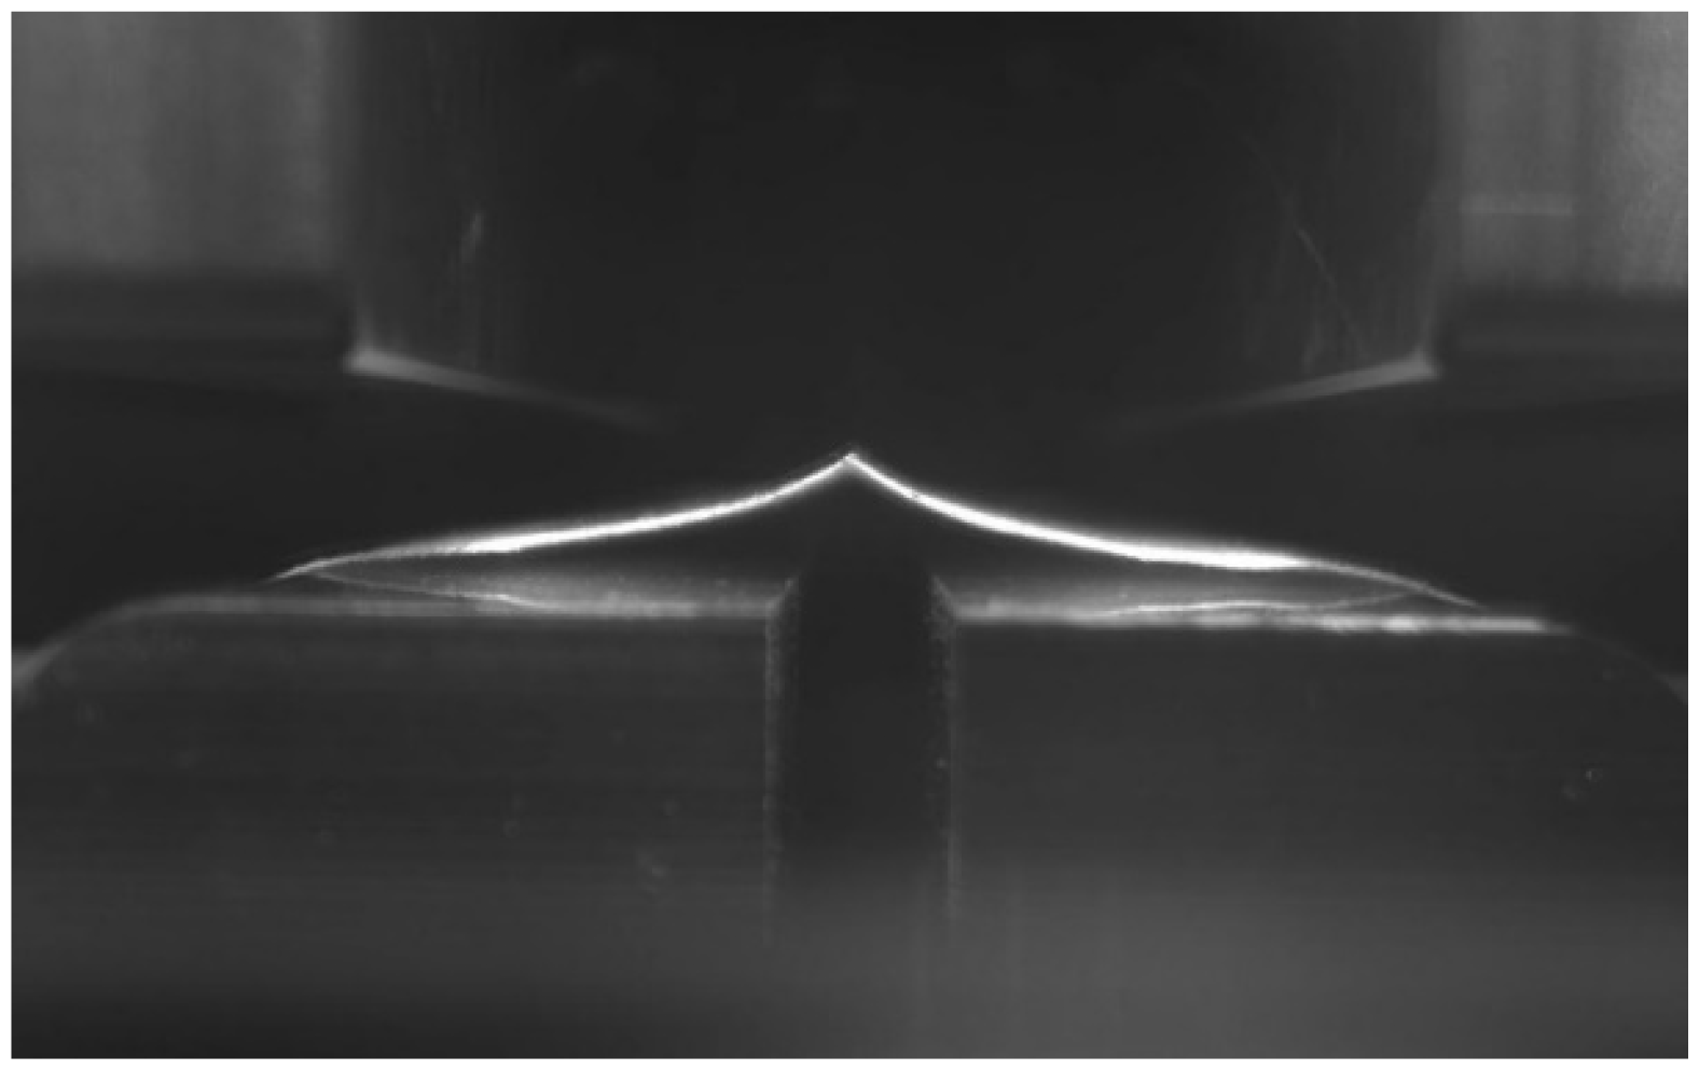
Three major steps are used to extract the features for evaluating fabric shape retention, namely image preprocessing, thresholding and morphology. The specimen in the video image was highlighted by subtracting out a pre-stored background image to subtract background noise. The image after preprocessing is shown in Figure 4(a). The grayscale image is transformed to a binary image using the Otsu algorithm.
19
The morphological opening is used to smooth the edge of the specimen. The structuring element selected for the opening was a disk-shaped template of 3 pixels in radius. To facilitate the index extraction and recognition, the thinning operation
20
is executed on the image and the specimen is transformed to a 1-pixel wide center line. The thinning image of Figure 4(a) after the opening operation is shown in Figure 4(b).
Video image processing: (a) preprocessed image; (b) thinning image.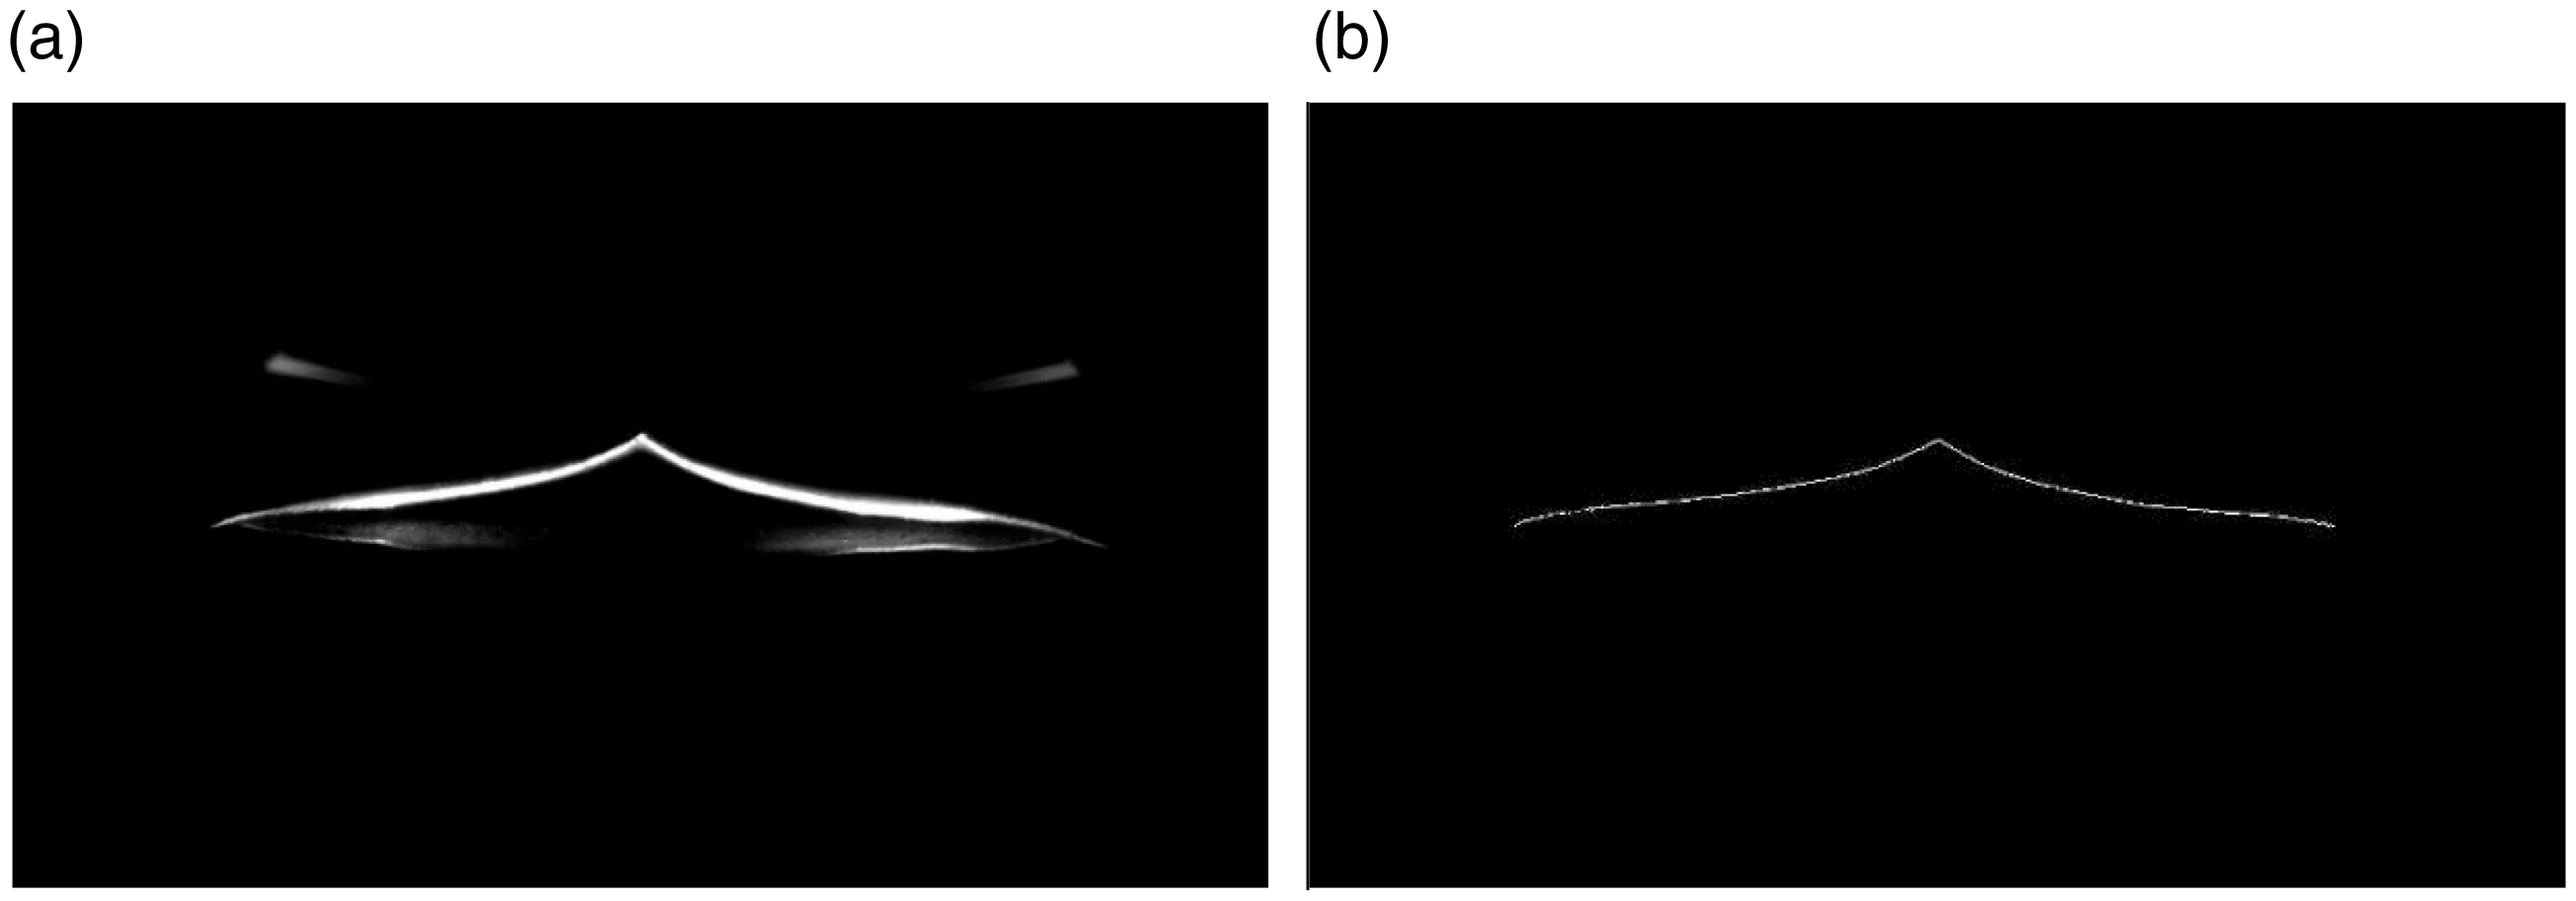
Evaluation method
Three fabric shape retention parameters, namely the vertex angle (VA), height (H) and shape retention area (SA), were extracted from the video image after processing for assessing the fabric shape retention. The characterization method of the parameters is shown in Figure 5.
Characterization parameters used to determine shape retention of the fabric.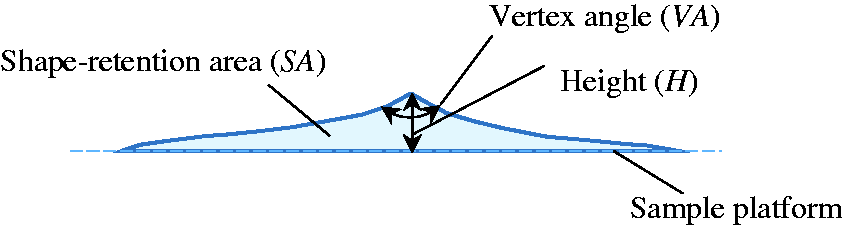
In Figure 5, the position of the sample platform in the captured video image can be calibrated before testing. The meaning of the fabric shape retention parameters are described as follows.
The vertex angle (VA) is the angle at the crease. It reflects the recovery degree of the fabric crease after pressure. The recovery process of the sample is affected by the friction between the sample and the sample platform, and the weight of the sample. It simulates the process of fabric unfolding under external force after wrinkling in daily use. The smaller VA is, the easier the fabric wrinkles; conversely, the less wrinkled it is. It is measured by the angles of the peak values in the Hough transform matrix of the area around the vertex pixel.
The height (H) is the shortest distance between the vertex and the sample platform. Parameter H reflects the drapability of the fabric to some extent. The higher H is, the worse the drapability of the fabric is.
The shape retention area (SA) is the area surrounded by the edge of the specimen and the sample platform. It reflects the overall shape retention of the fabric. The larger the conformal area, the stiffer the fabric, and the worse the drapability. The softer the fabric, the better the drapability. The SA is calculated by counting the number of pixels between the fabric and the sample platform (as shown in Figure 5) and converting it to the actual size based on the resolution of the image.
In summary, the larger the VA, the lower the H and SA and the better the fabric shape retention.
Experimental details
Materials
Test samples
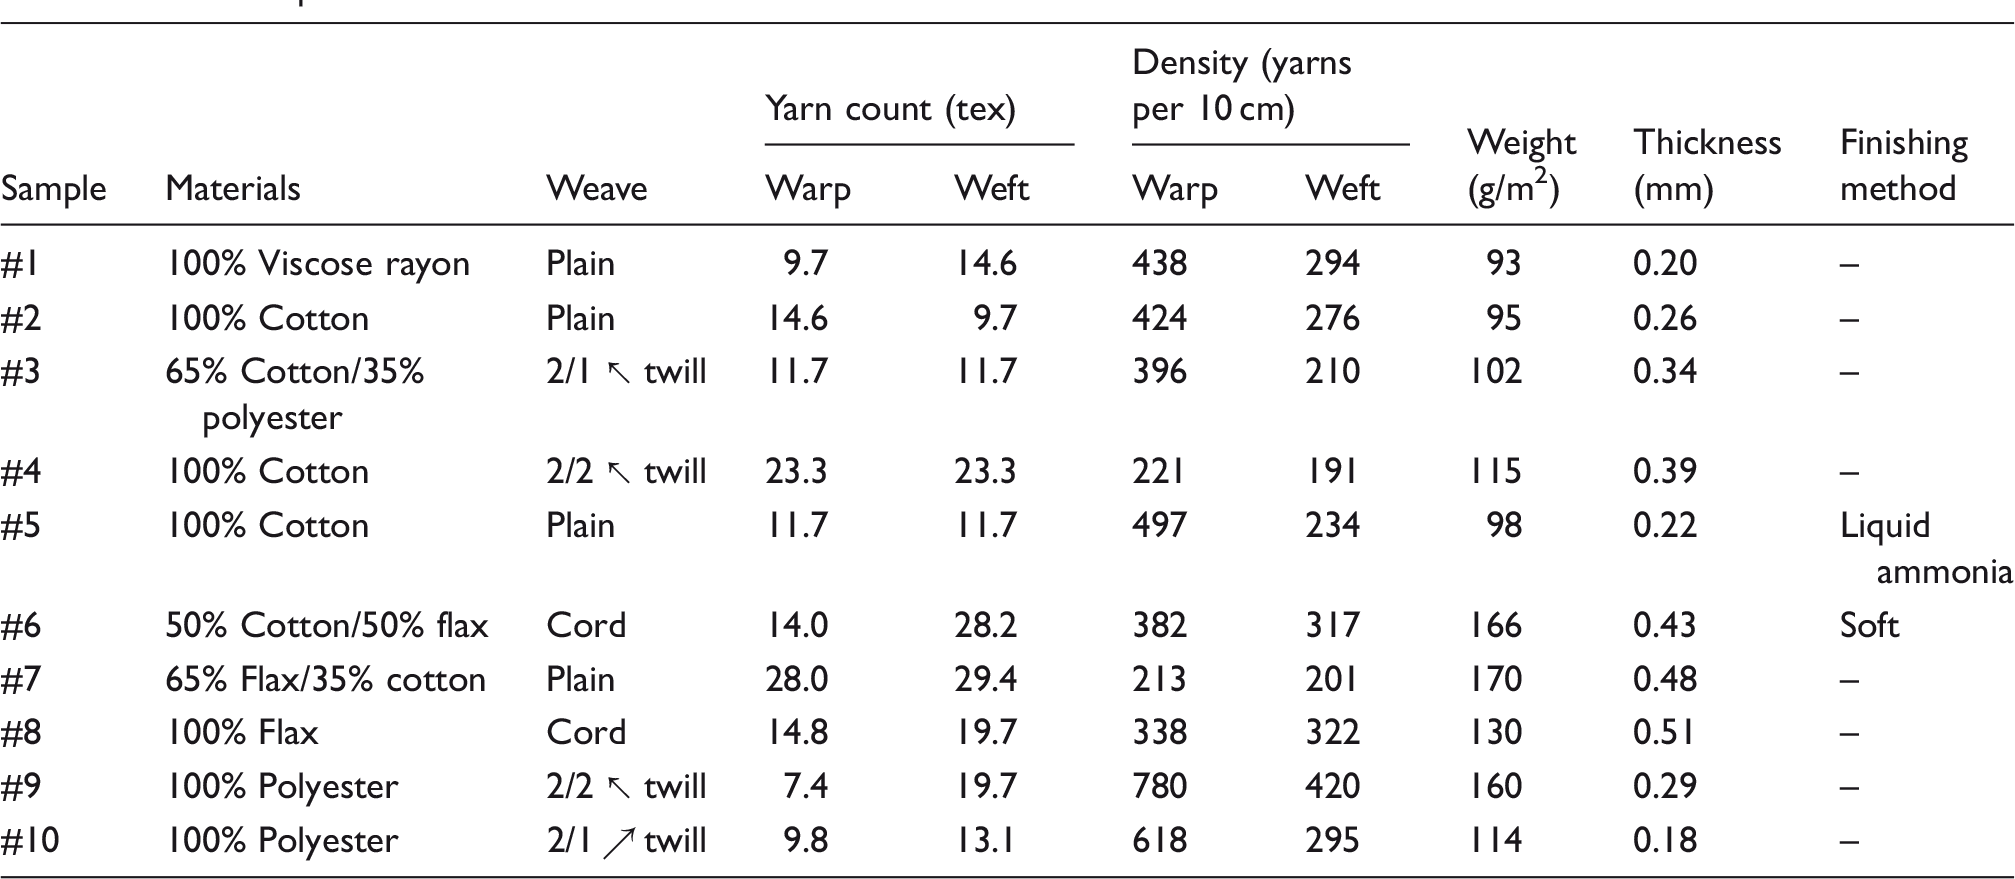
The face of each sample was marked before testing. Eight 300 mm × 300 mm size specimens were cut from each fabric. Half of the specimens were tested in the warp direction, while the rest were tested in the weft direction. The 300 mm × 300 mm size was determined through pre-testing to obtain the most stable results. The specimens were ironed and in standard testing condition (65 ± 2% (relative humidity (RH)) and 21 ± 1℃) for at least 24 hours.
Test procedure
The test procedure used to determine the fabric shape retention test is as follows.
Experimental preparation: the pressure and pressure time were set as 10 N and 10 seconds, respectively. Each sample was placed on the sample platform with the center line of the sample aligned with the middle axis of the sample platform. The sides of the sample lay freely on the sample platform. Instrument testing: when the device was started, the sample lifter automatically lifts the middle of the sample into the crease formation region. The left- and right-hand briquettes move toward the center and press the sample to form a sharp crease. When the pressure time is reached, the left- and right-hand briquettes move backwards. At the same time, the sample lifter falls to the bottom. The sample freely falls onto the sample platform. The video records the crease recovery process for 30 seconds. Video image processing: the video image of fabric crease recovery is synchronously processed to extract the evaluation indicator. The sample in the video image is enhanced using an image pre-processing method to subtract the background noise. Then the sample is extracted using a binary process. The sample is then transformed into a connected curve of single pixel width by a thinning algorithm for index extraction. Index extraction: the vertex at the crease was identified using the two contact points between the two sides of the sample and the sample platform from the connected curve obtained in the last step. Three indexes are extracted from the test results, the vertex angle (VA), height (H) and shape retention area (SA).
The shape retention parameters of the test samples were measured with the proposed method. The crease recovery angles were measured with a Shirley crease recovery tester. The drape coefficients were tested by a YG811E fabric drape tester.
Results and discussion
In pre-testing, we found the samples generally reaches their maximum recovery within 30 seconds. Thus, the video frame of the 30th second in the recovery period was extracted to analyze the fabric shape retention. Images of the test warp samples are shown in Figure 6. Images of the weft samples are similar to those of the warp samples.
Video images of the warp direction.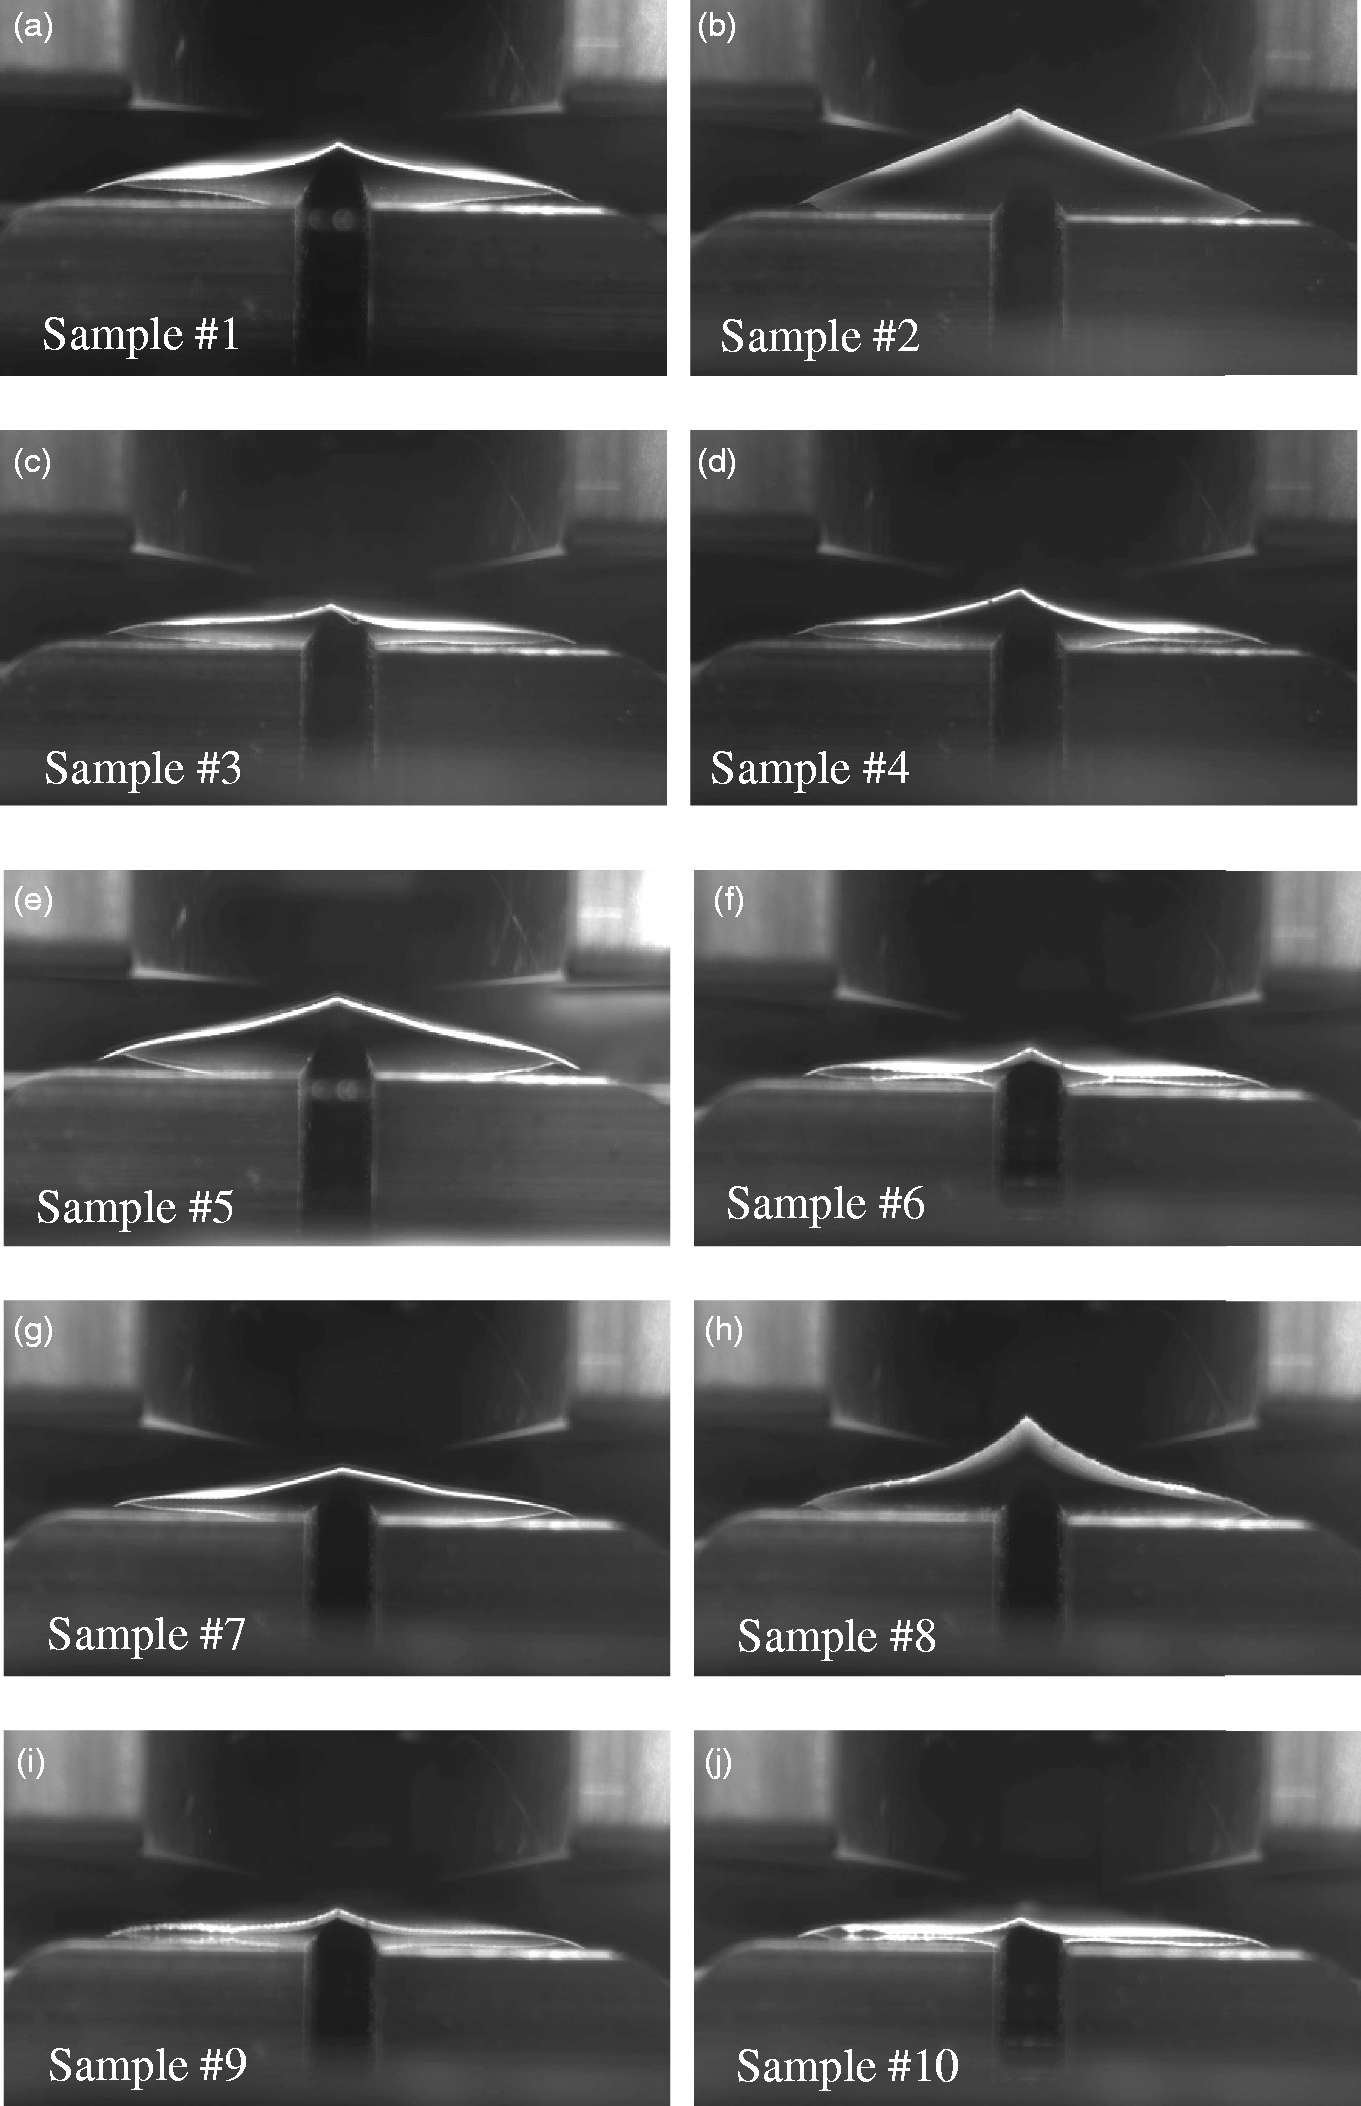
In Figure 6, it is obvious the shape retention varied from one fabric to another. The vertexes of some samples, such as Samples #2 and #8, are higher than the sample platform. Samples #6 and #10 are close to the sample platform. The VA is clearly displayed and easy to measure. Sample #8 seems to have narrow pointed vertexes. In addition, the stiffness and flexibility of the samples can be revealed from the video image. For further information, the shape retention parameters were determined by the image processing method.
Figure 7 shows the shape retention parameters of the 10 samples from the proposed method. Figures 7(a)–(c) show the results of the VA, H and SA of the warp and weft samples. The warp samples were folded to create a crease along the warp direction. The weft samples were folded to create a crease along the weft direction.
Boxplots of the fabric shape retention parameters: (a) VA; (b) H; (c) SA.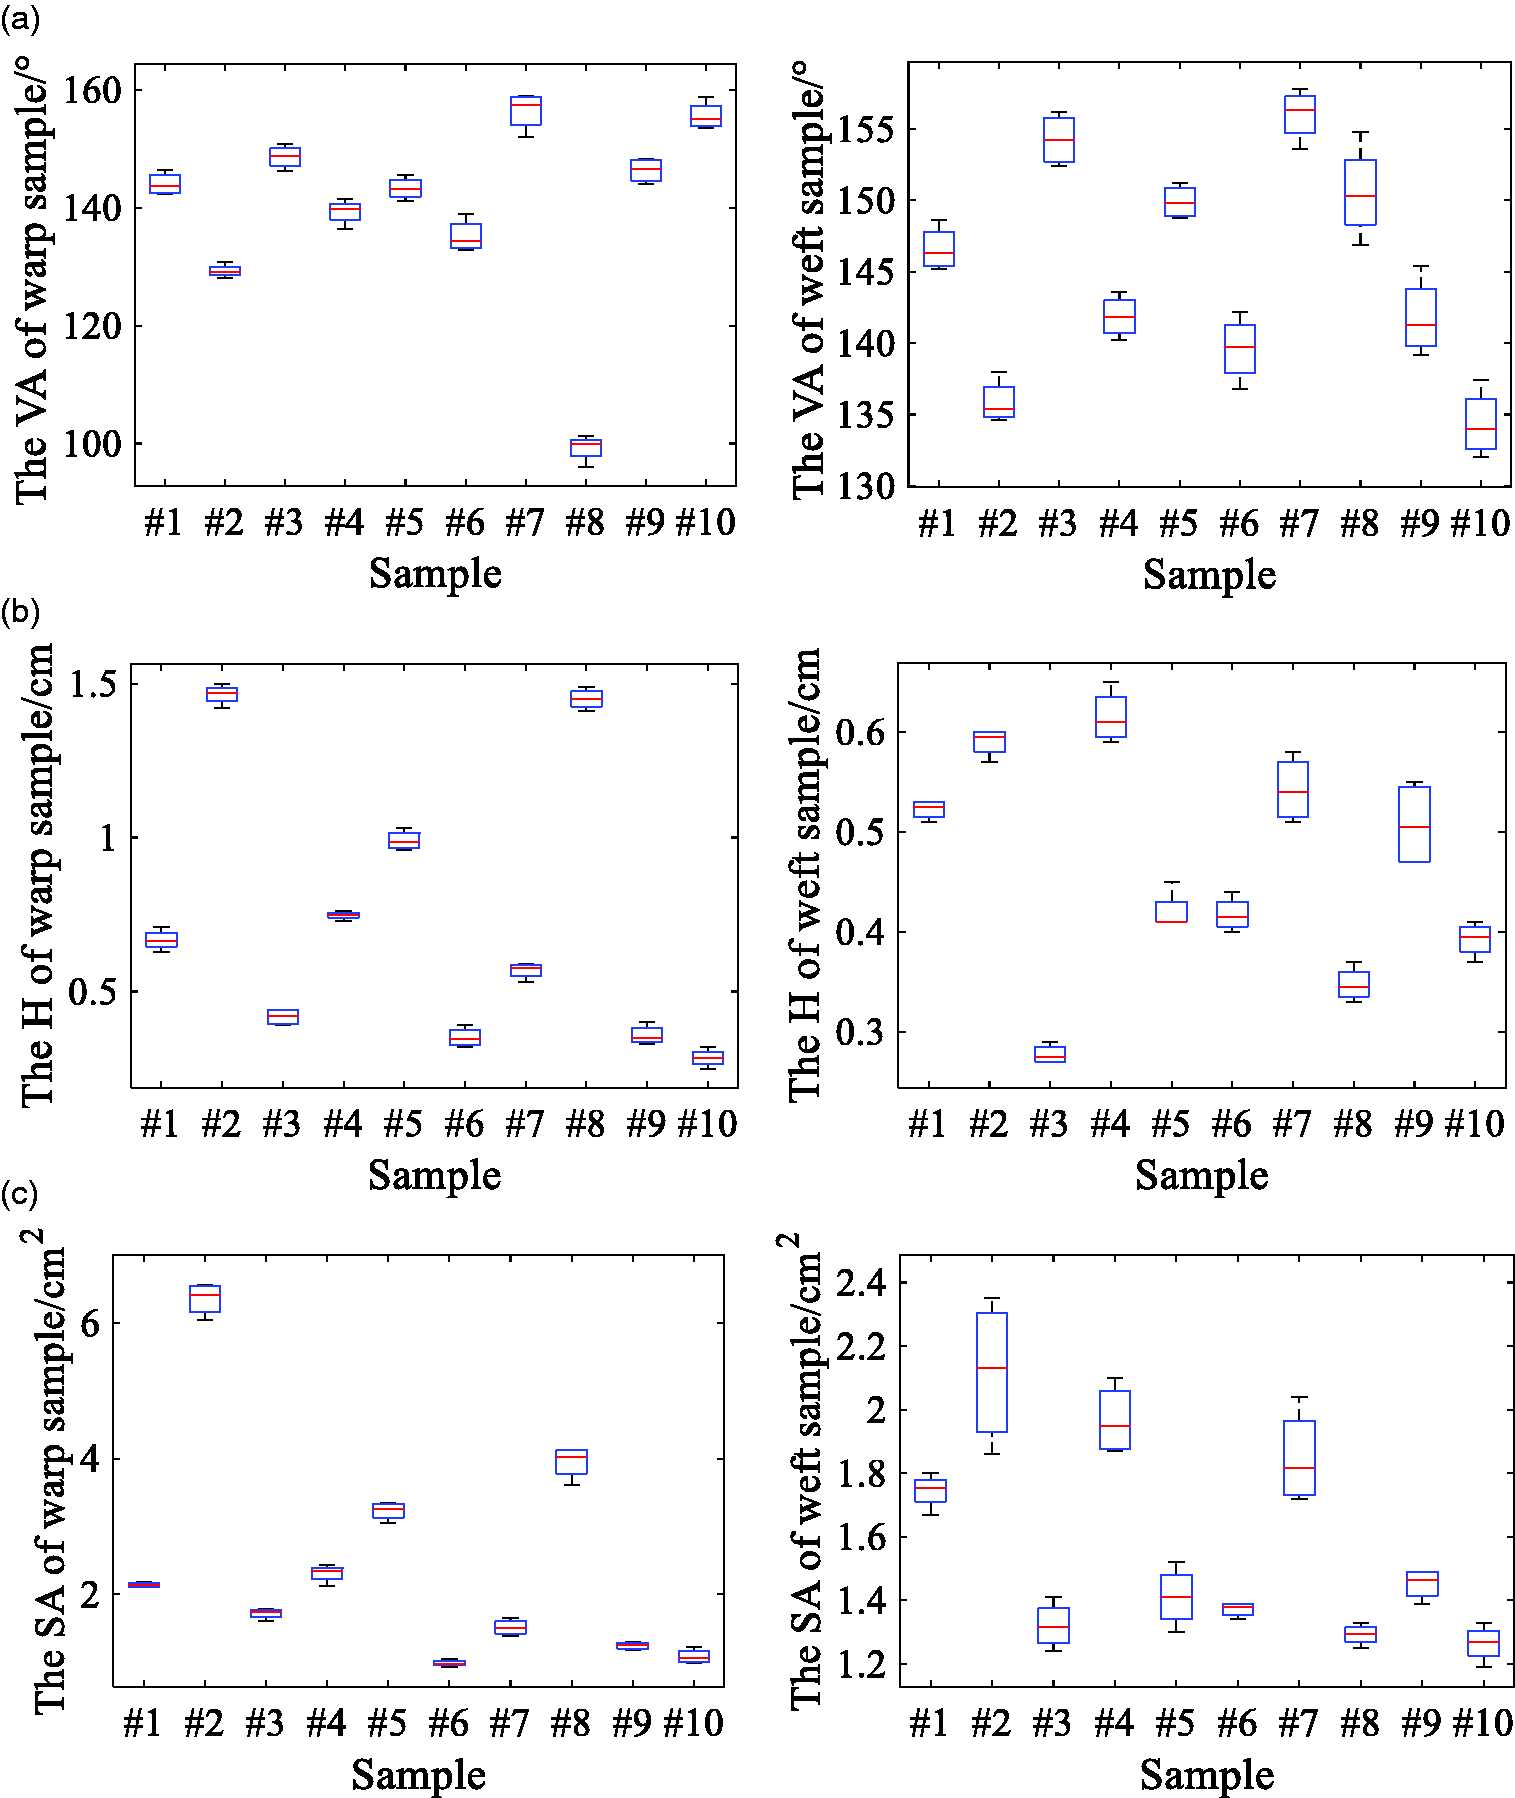
The parameters by the fabric shape retention testing method
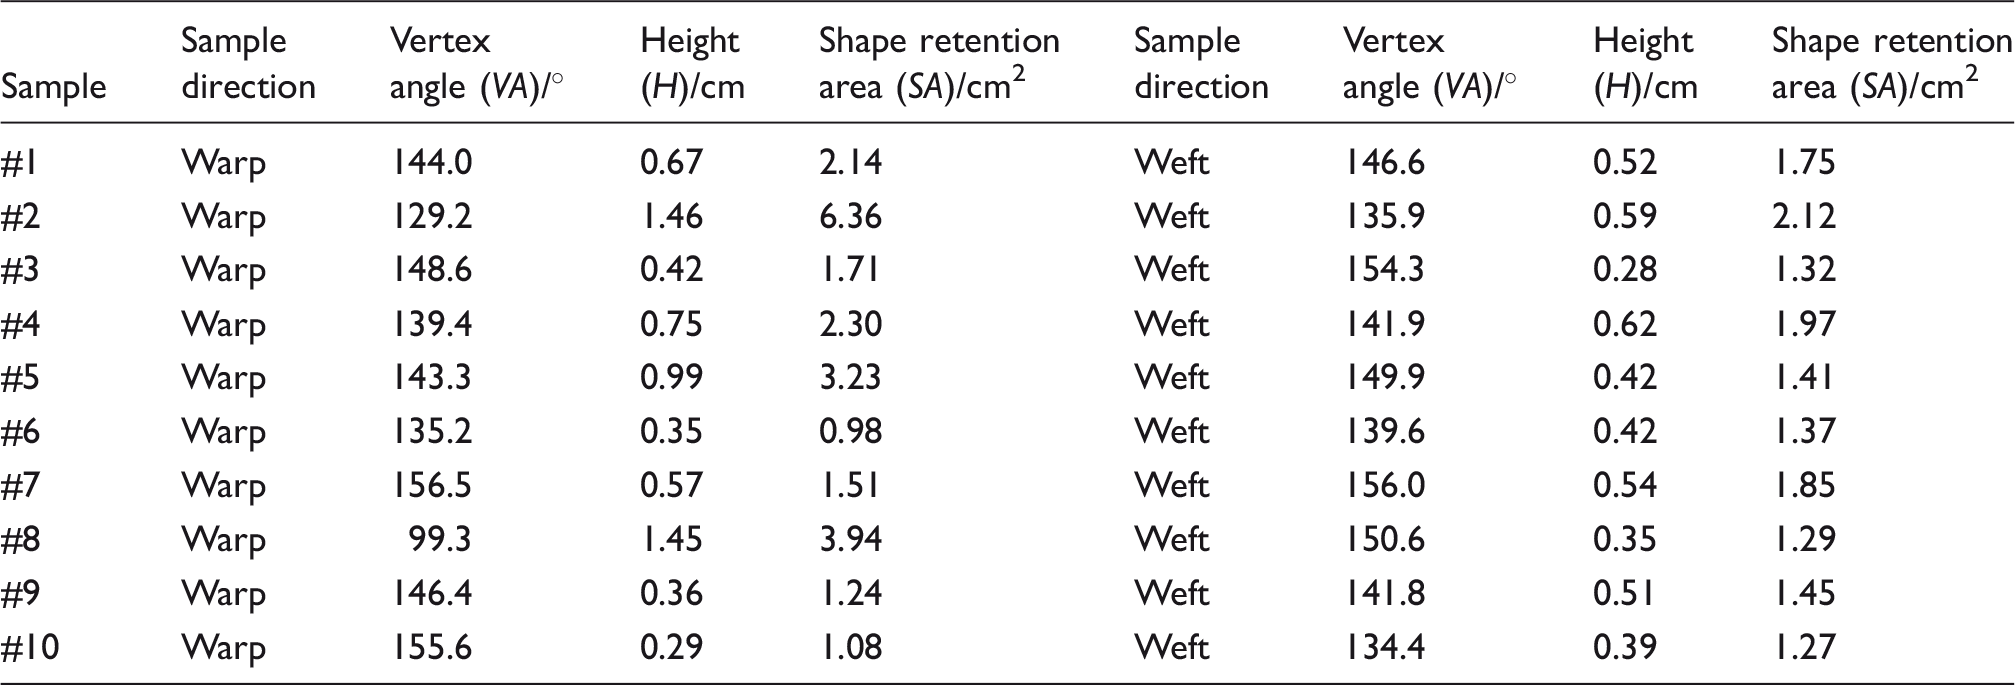
In Table 2, it was found that H has a high correlation to SA (r = 0.94). The VA has an inverse relation to H (r = –0.71) and SA (r = –0.56). Sample #1, the viscose rayon fabric, had better shape retention than the cotton fabric. Sample #3 contains polyester and it had better shape retention than the 100% cotton fabrics (Samples #2 and #4). The warp H and SA of Sample #4 were close to those of the weft specimen, perhaps because the warp and weft density of Sample #4 is similar. The shape retention of Sample #5 is better than that of Sample #2, which indicates that liquid ammonia finishing can improve fabric shape retention. The SA of Samples #2 and #4 revealed that the shape retention of plain weave fabrics is better than that of the fabrics with other woven structures. The same situation also appears for Samples #6 and #7. The results of the warp direction of Sample #8 are quite different from those of the weft direction. This may be due to the asymmetry of the cord weaving structure. Samples #9 and #10 are both high-density fabrics; the exhibited shape retention was similar to those of the blended and 100% natural fiber samples. In general, if VA of the warp sample was larger than that of the weft sample, then H and SA of the warp sample were less than those of the weft sample, and vice versa. The weight and thickness of fabric seem to have no effect on fabric shape retention.
The test results of crease recovery and drape properties
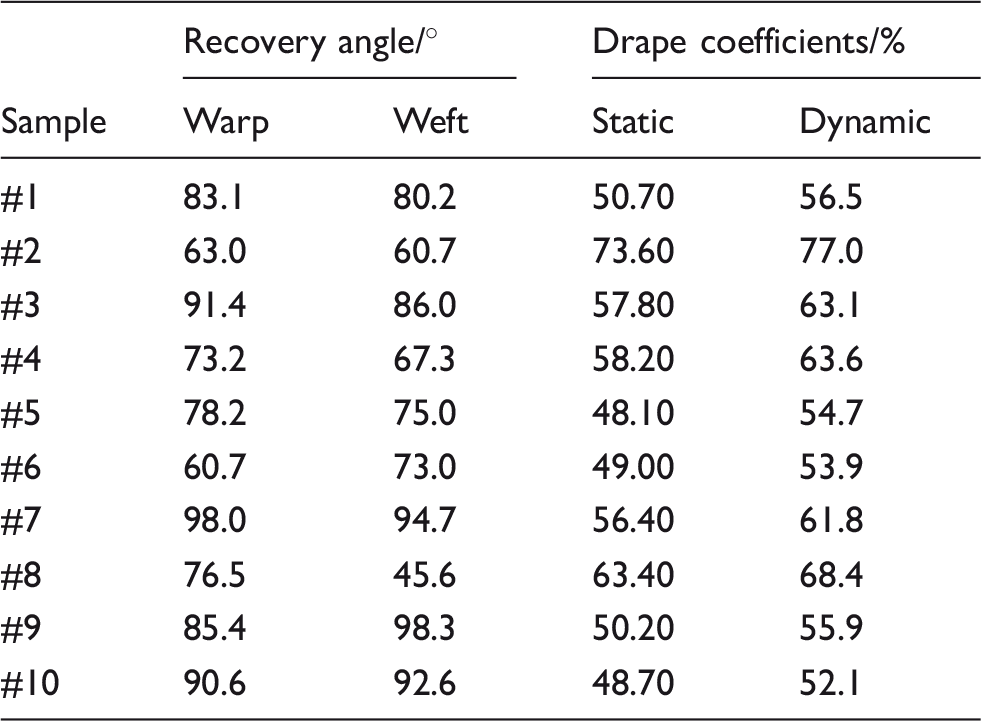
In Table 3, the recovery angles of the samples reveal the same correlation as VA. However, the drape coefficients have no significant association with the average recovery angle of the warp or weft specimens (r = –0.52).
Furthermore, linear regression analysis between VA measured by the shape retention test and the recovery angle obtained by the crease recovery test was conducted on the average of test data from the warp and weft samples. The Pearson correlation shows 0.87 and Sig. (0.001) (less than 0.05) between the two tests. Therefore, there is a significant linear correlation between VA and the recovery angle. A linear regression for VA and the recovery angle shows that the correlation coefficient R is 0.87, which indicates a good fit between the estimated model and the observed values. The adjusted fit R2 is 0.73, which means that the VA of the independent variable can explain 73% of the variation of the recovery angle of the dependent variable in this model. The error of the standard estimation is 6.9°, which is relatively small. The result of variance analysis shows that F is 25.0 and the corresponding Sig. value (0.001) is less than 0.05, which indicates that there is a statistical significance in regression with the current model. The non-standardized coefficients B (constant term) and VA are –102.046 and 1.269, respectively. The Sig. values of the constant term and VA are 0.023 and 0.001 (less than 0.05), respectively, which indicates that both the constant term and VA have significant effects on the recovery angle. Therefore, the univariate linear regression equation between VA and the recovery angle (RA) can be written as

In Equation (1), there is a corresponding functional relationship between VA and the recovery angle, which illustrates that the proposed method can characterize the fabric crease recovery property. Moreover, the universality of the test results can be improved by adjusting the experimental conditions, such as sample size, pressure and pressure time. This will be discussed in future research.
The result of the Pearson analysis shows that the correlation between SA and the static drape coefficient is 0.84 and Sig. (0.002) (less than 0.05), which demonstrates there is a significant linear correlation between the two data. The linear regression equation for SA and the static drape coefficient (SDC) is calculated as follows

The correlation coefficient R is 0.84 and the adjusted fit R2 is 0.67. The result of variance analysis shows that F is 19.0 and the corresponding Sig. value (0.002) is less than 0.05, indicating that there is a statistical significance in regression with the current model. The Sig. values of the constant term and SA are 0.000 and 0.002, respectively, which are less than 0.05. It shows that in this model, both the constant term and SA have a significant effect on the static drape coefficient.
The H has a linear correlation with the static drape coefficient. However, the fit of the equation is worse than the linear regression equation between SDC and SA. There is a reasonably high correlation between the static and dynamic drape coefficients (r = 0.99). The relation between dynamic drape coefficients and the shape retention is similar to that of the static drape coefficient.
Conclusions
This paper introduces a shape retention tester, which simulates the process of fabric deformation and recovery in daily use, and assesses the fabric shape retention of fabrics. The tester automatically produces a sharp crease in a fabric and captures a video image of the fabric recovery process. Shape retention parameters, vertex angle (VA), height (H) and shape retention area (SA), can be extracted from the video image to characterize the fabric recovery. The test results of the proposed tester show that there is a significant correlation between VA and the recovery angle tested by the Shirley crease recovery tester, and H and SA have a significant correlation with the drape coefficients obtained with the YG811E fabric drape tester. Test data indicates this test method will accurately characterize the fabric shape retention and is comparable to test methods currently in use. Research will look at the adaptability of different fabric types by changing the test conditions to improve the universality of the test system.
Footnotes
Declaration of conflicting interests
The authors declared no potential conflicts of interest with respect to the research, authorship, and/or publication of this article.
Funding
The authors disclosed receipt of the following financial support for the research, authorship and/or publication of this article: This work was supported by the National Key R&D Program of China (Grant Number 2017YFB0309200), the National Natural Science Foundation of China (Grant Number 61802152), the Natural Science Foundation of Jiangsu Province (Grant Number BK20180602), the China Postdoctoral Science Foundation Funded Project (Grant Number 2018M640453) and the Jiangsu Province Postdoctoral Science Foundation (Grant Number 2018K037B).
