
Abstract
A long-term static position causes inter alia hypoxia, poor blood circulation, slowing down of the metabolism, and problems in air and heat transport, which in consequence lead to the occurrence of bedsores. In the design of seats and mattresses for people with impaired mobility, advanced textile and composite materials should be used to improve safety and comfort. This functionality can be obtained using spatial textile materials. The aim of the research was to assess the impact of two unmodified woven relief structures I.0 and II.0 made of different yarns and ones modified by inserting linear elements (1: braided round tape and 2: polyethylene tube) to their rib tunnel on the heat transport and on the pressure distribution under loading of 0.5, 1, and 2 N. Element 1 lowers the value of average pressure on the fabrics I.1 and II.1, respectively, by 6.9% and 3.5% at the lowest loading and by 9.8% and 4.6% at the highest loading. For fabric II.2 with element 2, the decrease is of 10.4% and 8.4%, respectively. The thermal conductivity values increase by 8.8%, 9.4%, and 40.1%, respectively for I.1, II.1, and II.2. The pressure distribution and thermal characteristic of the fabrics depend on the type of yarn, the structure of ribs, and the linear element and its fit to the rib tunnel.
Research shows that even a healthy person spends about 13 hours a day in a sitting position. 1 A long-term static position causes inter alia hypoxia, poor blood circulation, and slowing down of the metabolism. Low physical activity leads to an increase in pressure on blood vessels and, as a consequence, to the occurrence of bedsores.2−4 This particularly concerns people with impaired mobility (bedridden or in a wheelchair) and those who spend long hours sitting at work, traveling, etc. 5 Limiting the risk of such health problems requires not only hygienic care but also ensuring appropriate conditions between the body and the substrate material (suitable temperature, moisture, and air transport).6,7 The significant issue is to use appropriate seats/mattresses that ensure the lowest and most evenly distributed pressure 8 as well as transport of air, moisture, and heat.9,10 In the design of seats and mattresses, durable advanced textile and composite materials with additional functionality to improve safety and comfort should be used. Such functionality can be obtained using spatial textile materials with expanded structure and surface topography. 11 Polyurethane and viscoelastic foam cushions currently in use build up heat and moisture between the skin and the cushion. Gel and air-filled cushions also do not provide physiological comfort, and can be easily damaged. 10 Spatial relief fabric with linear elements can ensure good transport of air, heat, and moisture as well as better distribution of pressure on the body surface, and as a result reduce the risk of bedsores. 6 One of the solutions is applying a ribbed weave, an example of which is Relant fabric.12,13 It is a relief woven fabric where the weft thread is composed of elastic thermo-shrinkable threads which, after thermal treatment, form a relief structure with the protruding parallel ribs. At the top of the ribs there are conductive threads, which ensure electrostatic discharge safety.12,13 The relief structure of the fabric may shape the distribution of pressure and physiological comfort, enabling circulation of air and moisture. Another anti-bedsores proposal is spatial materials in the form of a three-layered laminate, with the outer and bottom layer made of textile materials and the middle layer made of an elastic foam. These layers are glued together and their outer surfaces are flat. There are also highly elastic foam structures in form of mattresses or pillows with the contoured outer surface adjusting to body shape during their use. Although they reduce pressure, the body is in constant contact with the foam, which impedes the flow of air, heat, and moisture. 14
To date, studies have been conducted mainly on different homogeneous textile structures, layer systems, or mattresses.15−21 It was shown that spatial structure can improve physiological comfort. In our previous in vitro and in vivo research we found that the type of knitted fabric structure affects pressure distribution. 15 The impact of the structure of knitted textiles on thermal and moisture management properties was documented by Onofrei et al. 16 Biggi et al. showed that 3D double-woven fabrics are characterized by very good thermal and moisture management properties. 17 Thermal absorptivity is strongly linked with the structure of a fabric18,19 and the configuration of layers in multilayer textile materials.20,21
It is interesting to examine how the distribution of pressure and heat transport can be changed by inserting linear elements into channels of ribs in a relief fabric. The aim of the research was to develop spatial ribs textile structures filled with linear elements, and carry out a comprehensive analysis of pressure distribution and thermal parameters of physiological comfort.
Materials and methods
Materials
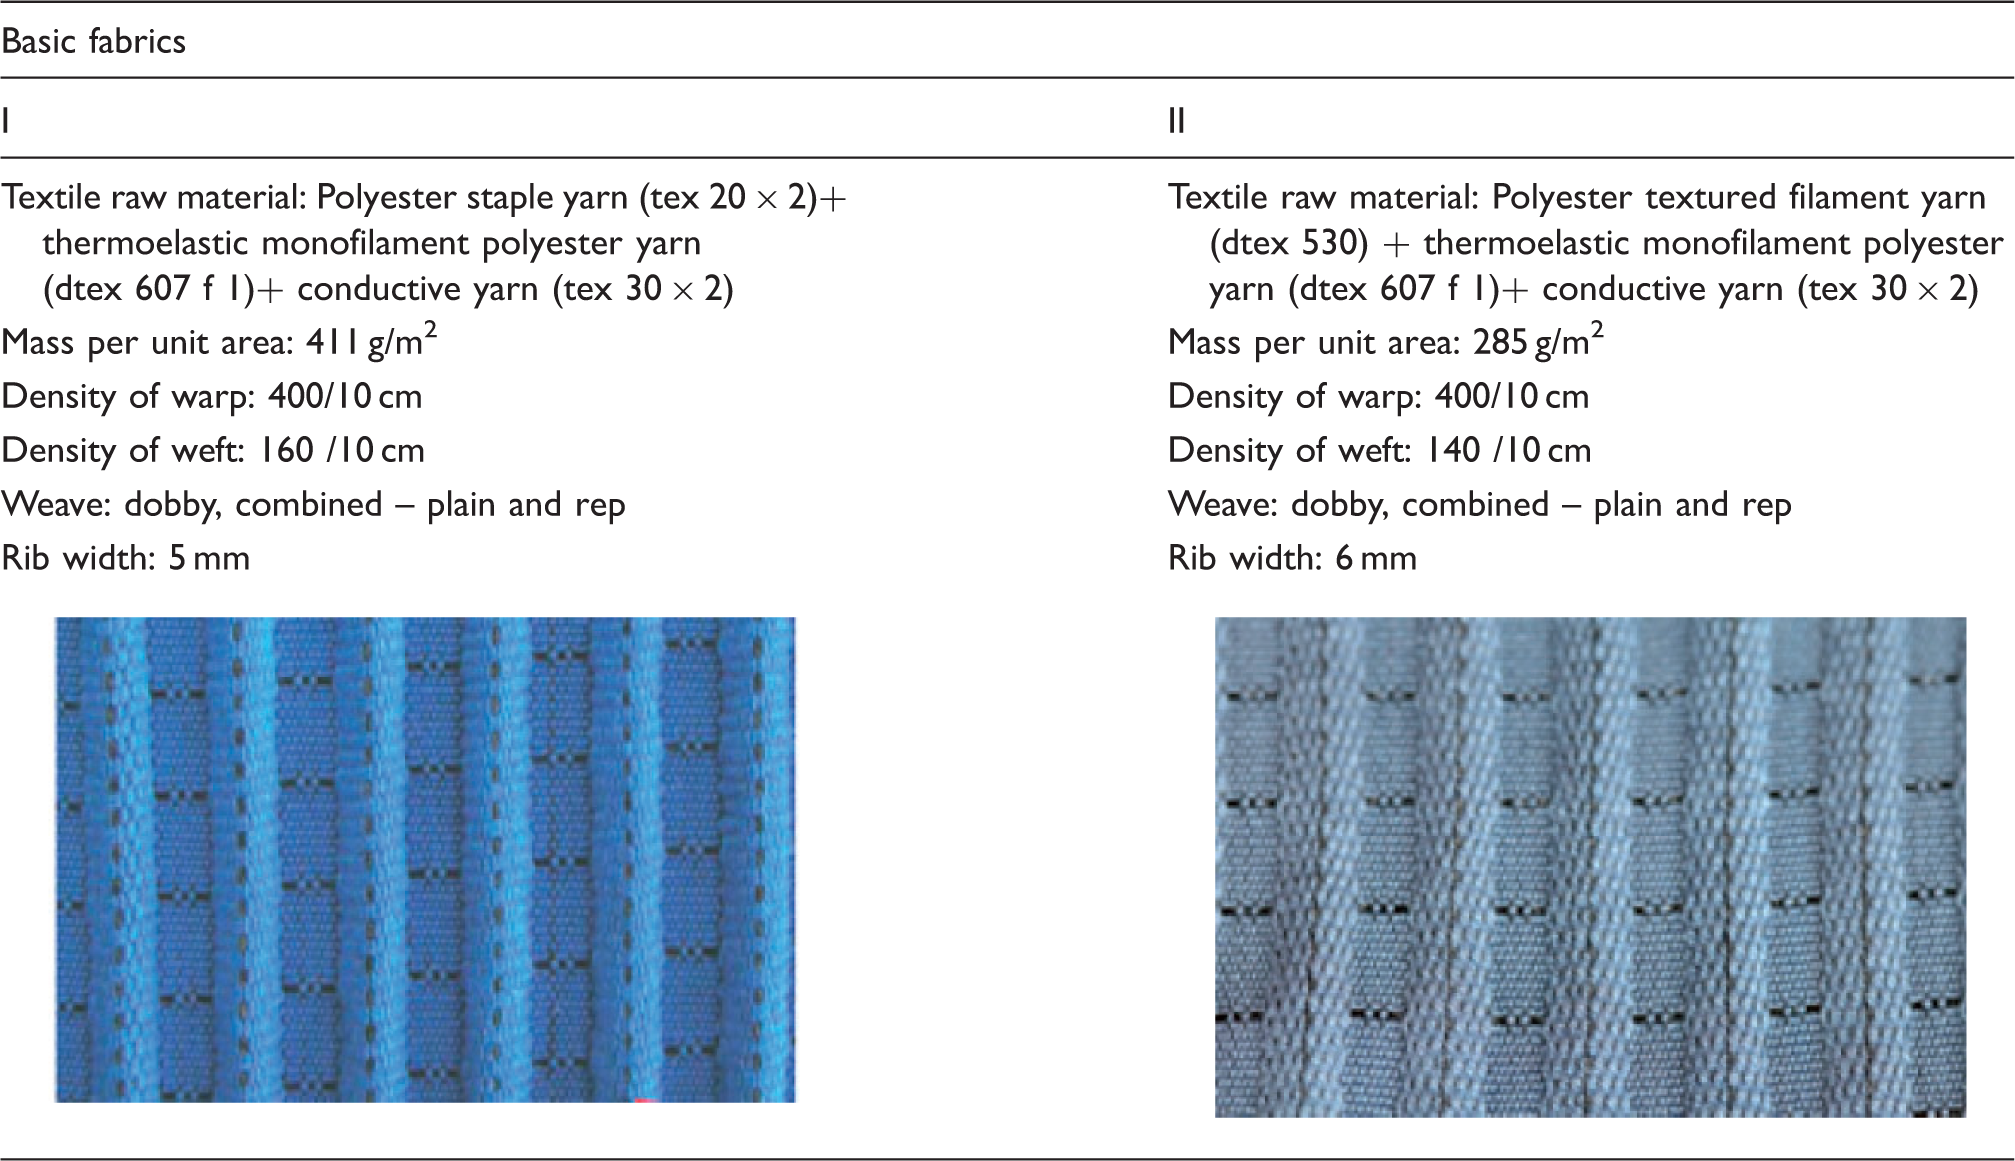
The patented spatial relief fabrics
11
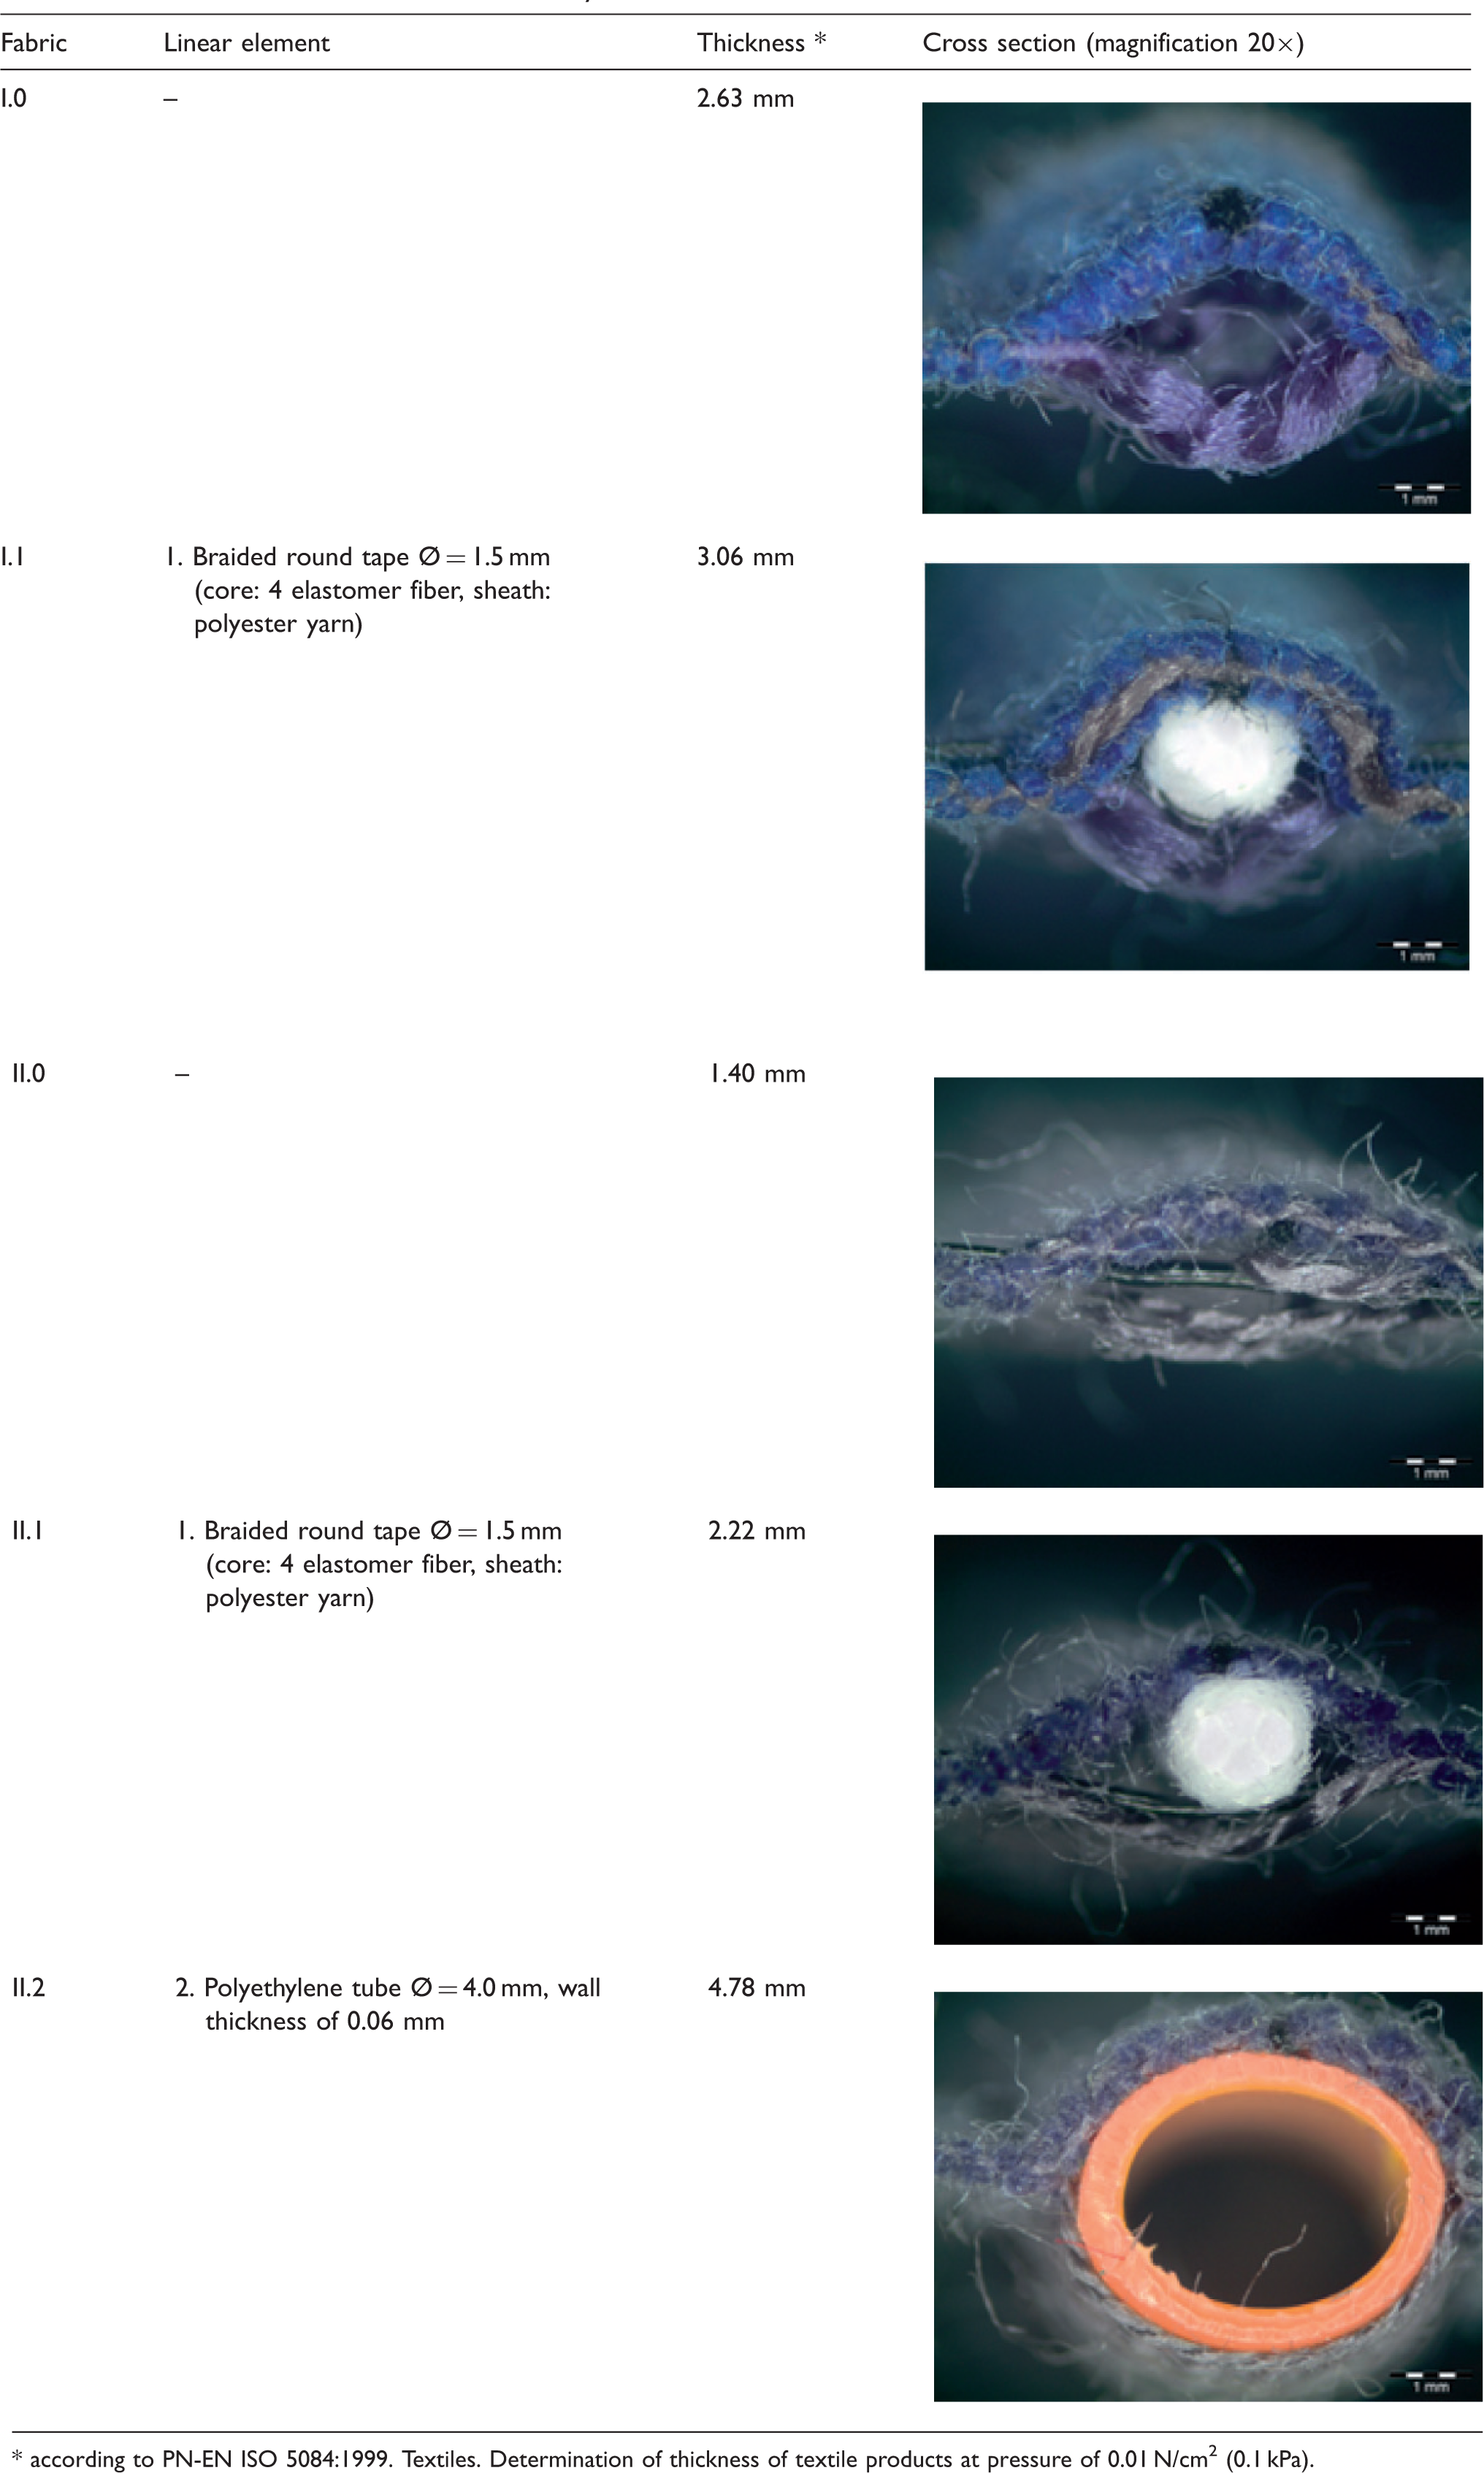
(Figure 1, Table 1) without (basic) and with linear elements of various characteristics (Table 2) were developed and produced at Łukasiewicz -Textile Research Institute.
Scheme of relief fabric. Characteristics of basic relief fabrics Characteristic of fabrics used in the study according to PN-EN ISO 5084:1999. Textiles. Determination of thickness of textile products at pressure of 0.01 N/cm
2
(0.1 kPa).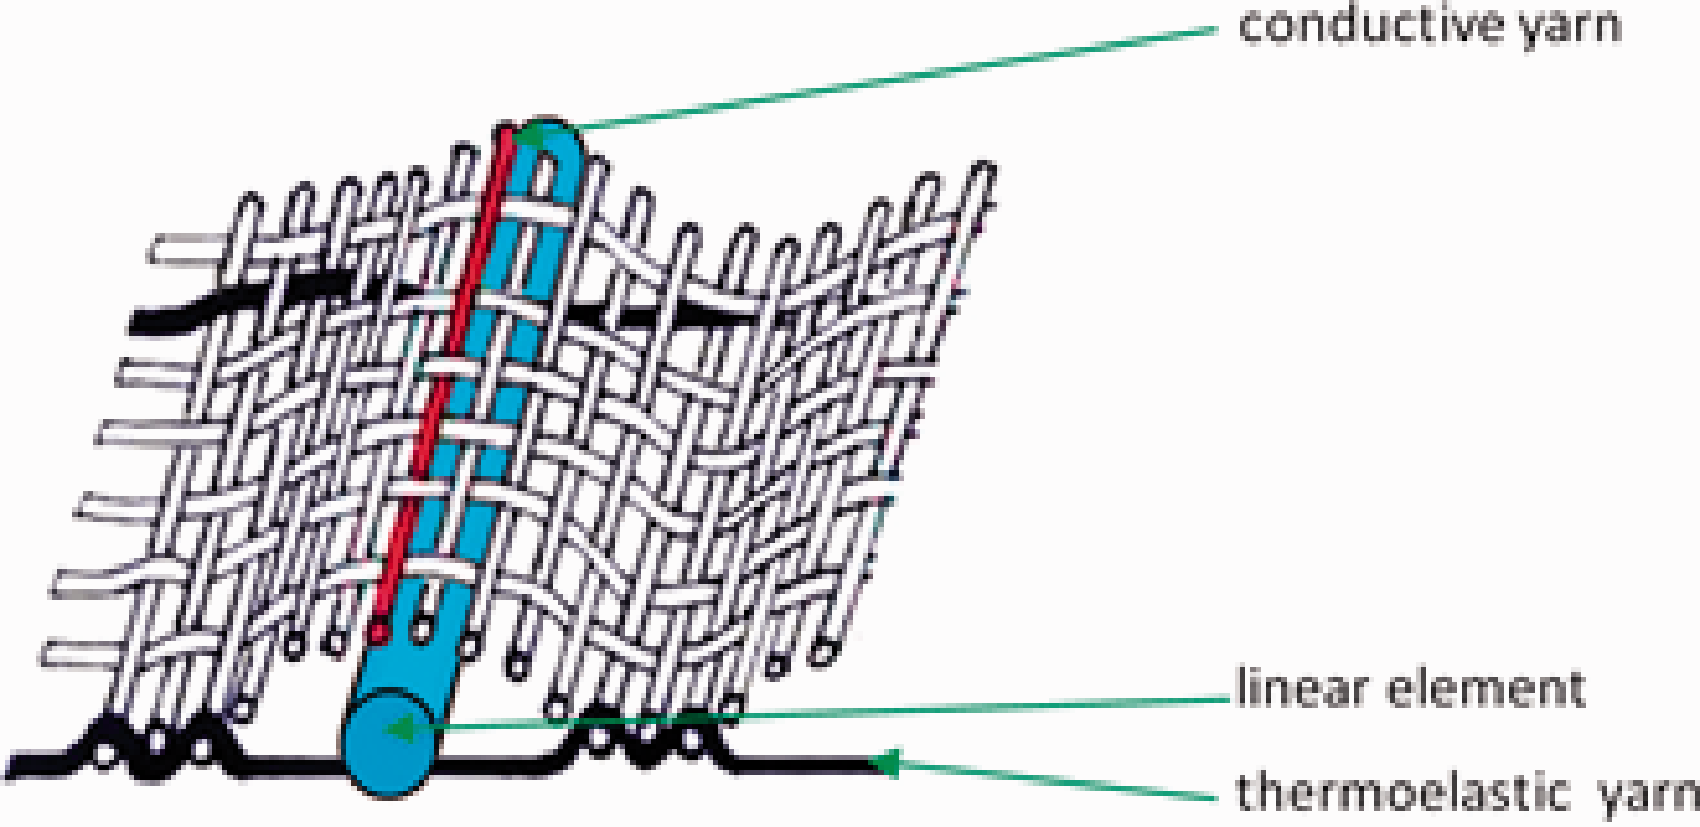
Testing of pressure distribution
Testing of pressure on the fabrics’ surface was performed using I-SCAN system (TekScan, USA) with flexible thin-film sensors. A thin-film sensor 5027 with dimension of 2.79 × 2.79 cm and thickness of 0.625 mm and a total number of measuring points of 1936 (248/cm2) was used. 22 The principle of measurement is based on measuring the electrical resistance that is inversely proportional to the pressure. The measurement of pressure values and visualization of their distribution on the maps were done. Stainless steel cylindrical loads with mass of 50 g, 100 g, 200 g and the area of the base of 2.84 cm2, 4.52 cm2, and 7.07 cm 2 were used, ensuring the pressure force of 0.5 N, 1 N, and 2 N, respectively. The sensor was placed between the load and the top side of the fabric. Each individual measurement was registered as a 24.8-second film. Tests were carried out at the temperature of 21 ± 2℃ and relative humidity (RH) of 40%, on samples acclimated for 24 hours in the same conditions. Prior to taking the measurements, a calibration of the sensor was performed following the procedure recommended by the manufacturer. Twenty pressure measurements were taken for each fabric, and average values and standard deviation were determined.
Testing of heat transport
Testing of thermal insulation properties
Testing of thermal insulation properties was performed using Alambeta (Sensora, Czech Republic) apparatus23,24,26 and KES-F7 Thermo Labo II (KATO TECH CO., LTD., Japan) apparatus.25,26 The Alambeta test is based on measuring the amount of heat flowing through the sample placed between two plates—the upper one, heated up to about 32℃ and the bottom one with the temperature of 22℃. The plates of 95 cm 2 area exert a constant pressure of 200 Pa ± 10% (1.9 N). Fabrics were placed with the top side toward the heating plate and the following parameters were measured: thermal conductivity λ, thermal diffusivity a, thermal absorptivity b, thermal resistivity r, thickness h, ratio of max heat flow to stationary heat flow p, max heat flow density qmax.
The KES-F7 Thermo Labo II apparatus in following configuration was used:
T-Box—a box with a copper plate of 9 cm
2
area and weight of 90 g, fixed to the insulator and with a temperature sensor. Constant pressure to the sample of 980 Pa (0.9 N) was provided. BT-Box—with the main heating plate BT of 25 cm
2
area and weight of 150 g and the buffer heater inside the box with temperatures sensors. Constant pressure to the sample of 587 Pa (1.5 N) was provided. Cooling Base—cooling plate with adjustable temperature.
Measurements were taken at the temperature of 20 ± 2℃ and 65 ± 5% RH. Max heat flow density in the place of contact qmax and thermal conductivity k were measured. For both methods, 10 measurements were taken on the whole area of the sample and the average value and standard deviation were determined.
Active infrared thermography method
Heat transport was measured by the method of active infrared (IR) thermography using a thermal imaging camera MobIR M3 (Guide Infrared, China) integrated with software Guide IrAnalyser, which enables the analysis of images, distribution of temperatures on the surface, and determining the maximum, minimum, and average temperature. The testing took into account the emissivity factor, which is 0.84 for fabrics I.0 and I.1, and 0.94 for fabrics II.0, II.1, and II.2. Samples were placed at a distance of 0.5 m from the thermal imaging camera. Tests were carried out at 21 ± 2℃ and 40% RH. During heating process, samples of fabrics were placed with top side toward the heating plate. The process started at 21 ± 2℃ and continued to 55 ± 0.5℃. For each sample, 50 images were taken over the time of 1200 s. During the cooling process, samples were placed with bottom side toward the plate. The process started at the temperature of 55 ± 0.5℃ and continued until the samples reached 21 ± 2℃. For each sample, 50 images were taken over the time of 360 s.
Testing of air permeability
Air permeability was measured at 20 ± 2℃ and 65 ± 5% RH.
27
The amount of air flowing perpendicularly to the sample with the area of 20 cm
2
in the unit of time was measured. The pressure difference on both sides of the sample was 100 Pa. Five measurements were taken and the average value was calculated. Air permeability R was calculated from the following formula (1):
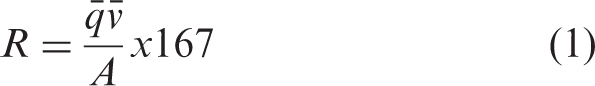
Statistical analysis of the data was carried out using Statistica 8, StatSoft Software (StatSoft Inc.) including basic statistic, Fisher’s test, and Student’s t-test.
Microscopic analysis
Microscopic imaging of the fabrics and analysis of the surface topography were performed on the digital optical microscope OLYMPUS DSX1000 (magnification of 20× and 50×).
Results
Pressure distribution
Average values of pressure for fabrics I.0, I.1, II.0, II.1, II.2
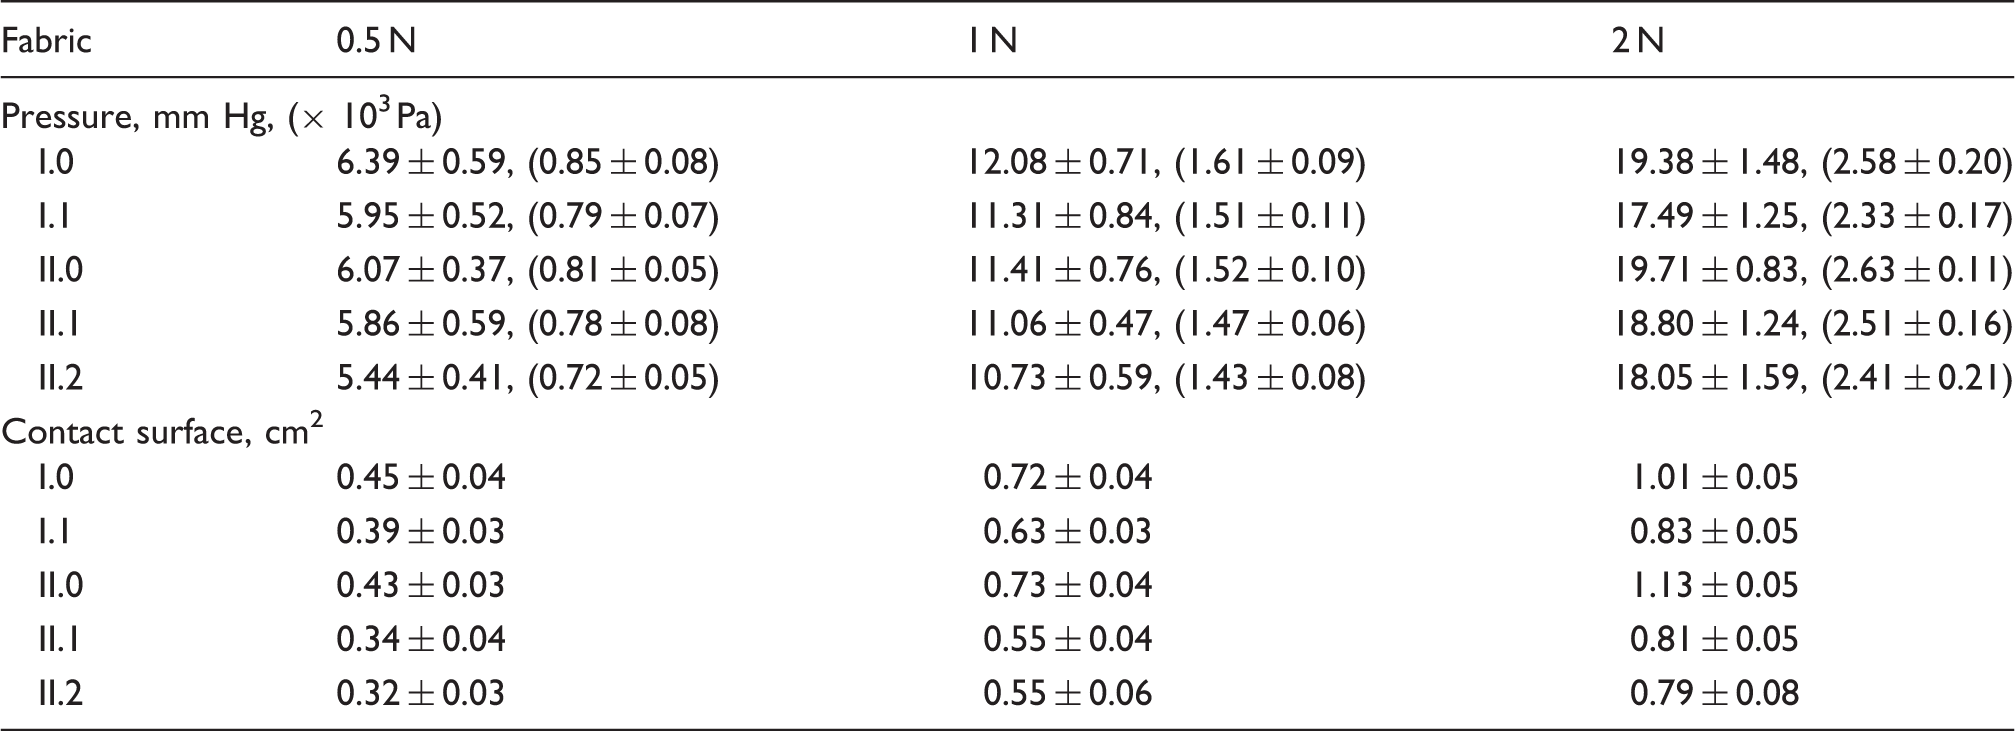
The highest value of average pressure was observed for basic fabrics I.0 and II.0 for each load. Comparing both basic fabrics, the higher pressure was found for fabric I.0 loaded with 0.5 N and 1 N, about 5% and 5.5%, respectively. In the case of 2 N load, the pressure values are similar (the difference is ∼1.5%), but higher for II.0 which has the wider ribs. It was found that linear elements in the form of a braided tape or a polyethylene tube tend to reduce the average pressure on the fabrics. In the case of samples I.1 and II.1 with the same round braided tape, for loads of 0.5 N and 1 N, the pressure is lower for sample II.1 by 1.5% and 2.2%, respectively, whereas for 2 N load it is higher by about 7% in relation to sample I.1. Such effects may be result of differences in structure of the yarn and the basic fabrics.
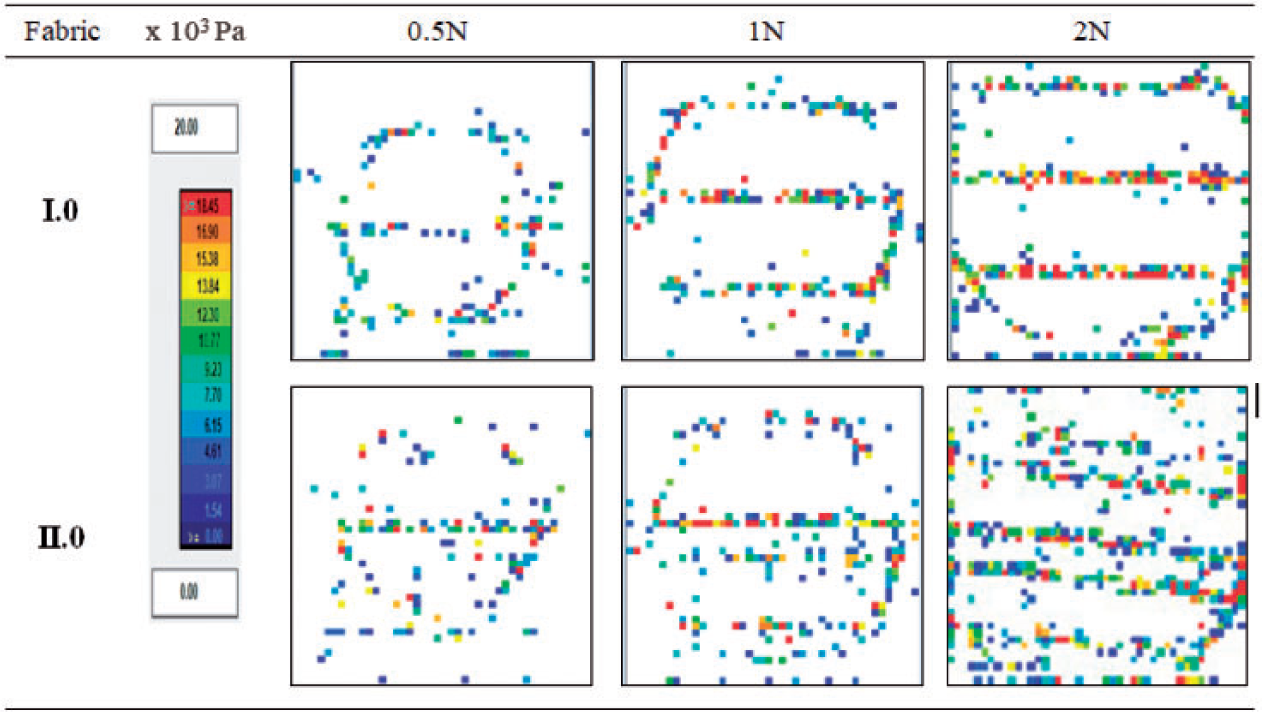
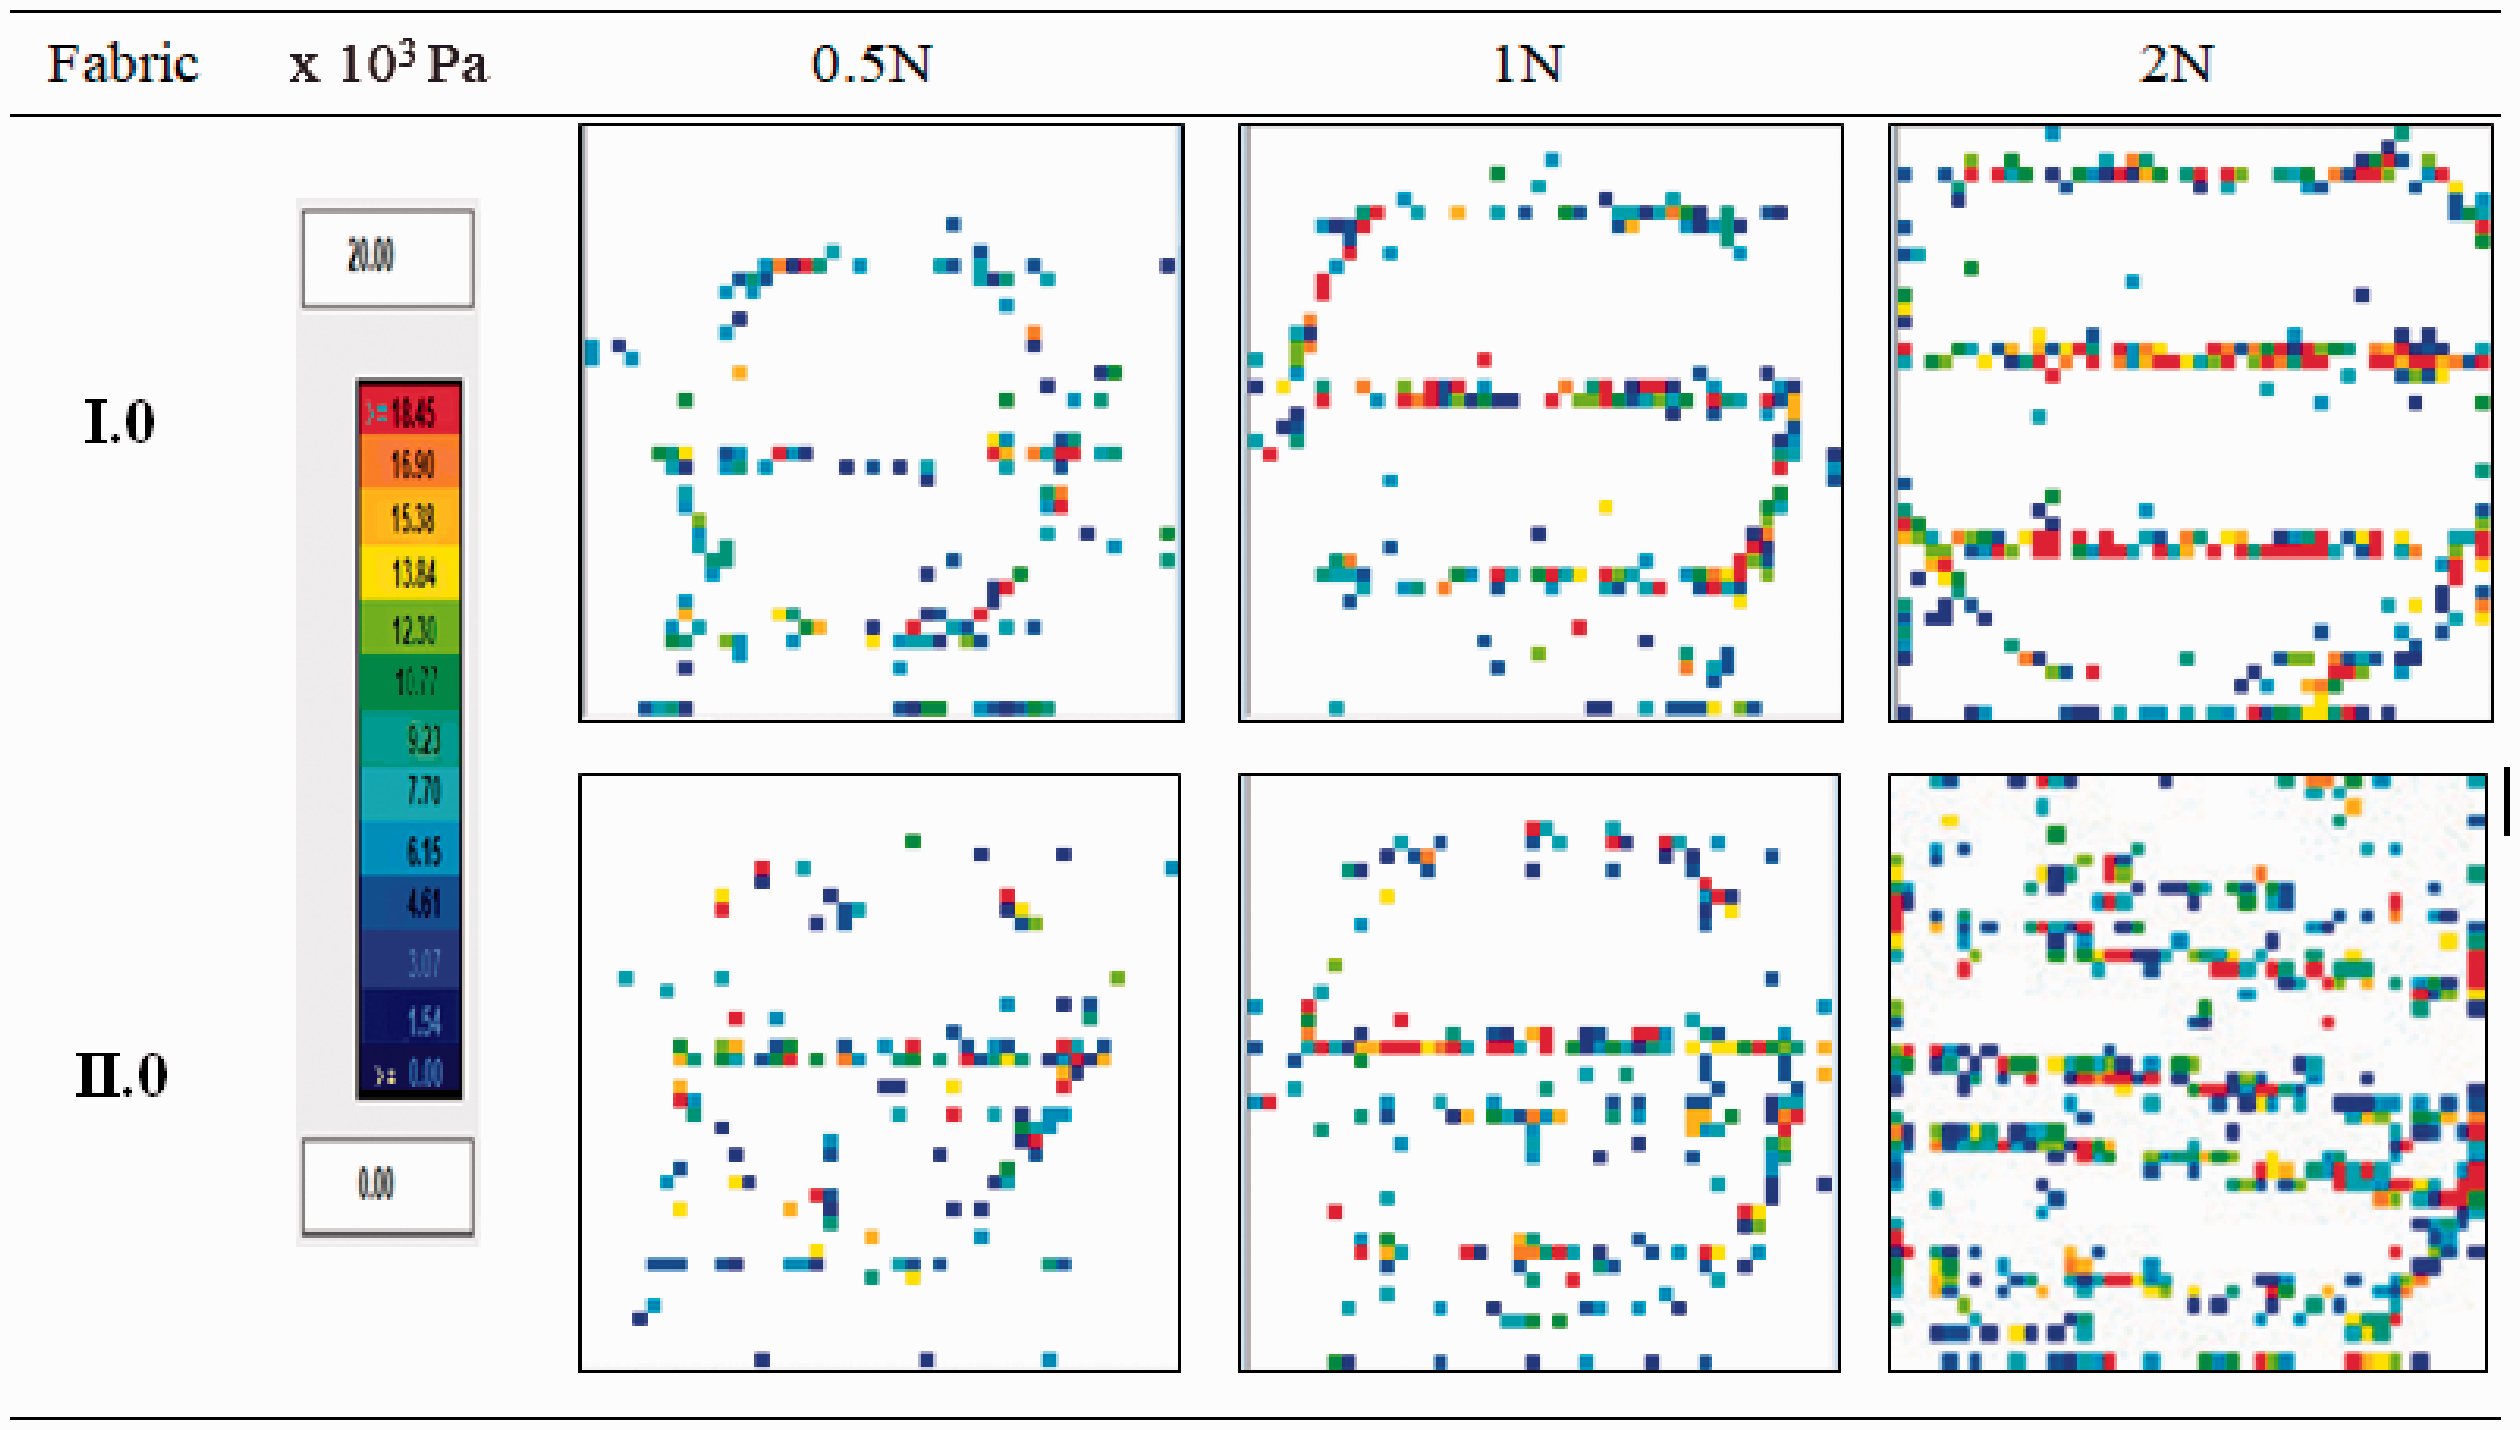
Distribution maps of the pressure values for fabrics I.0 and II.0
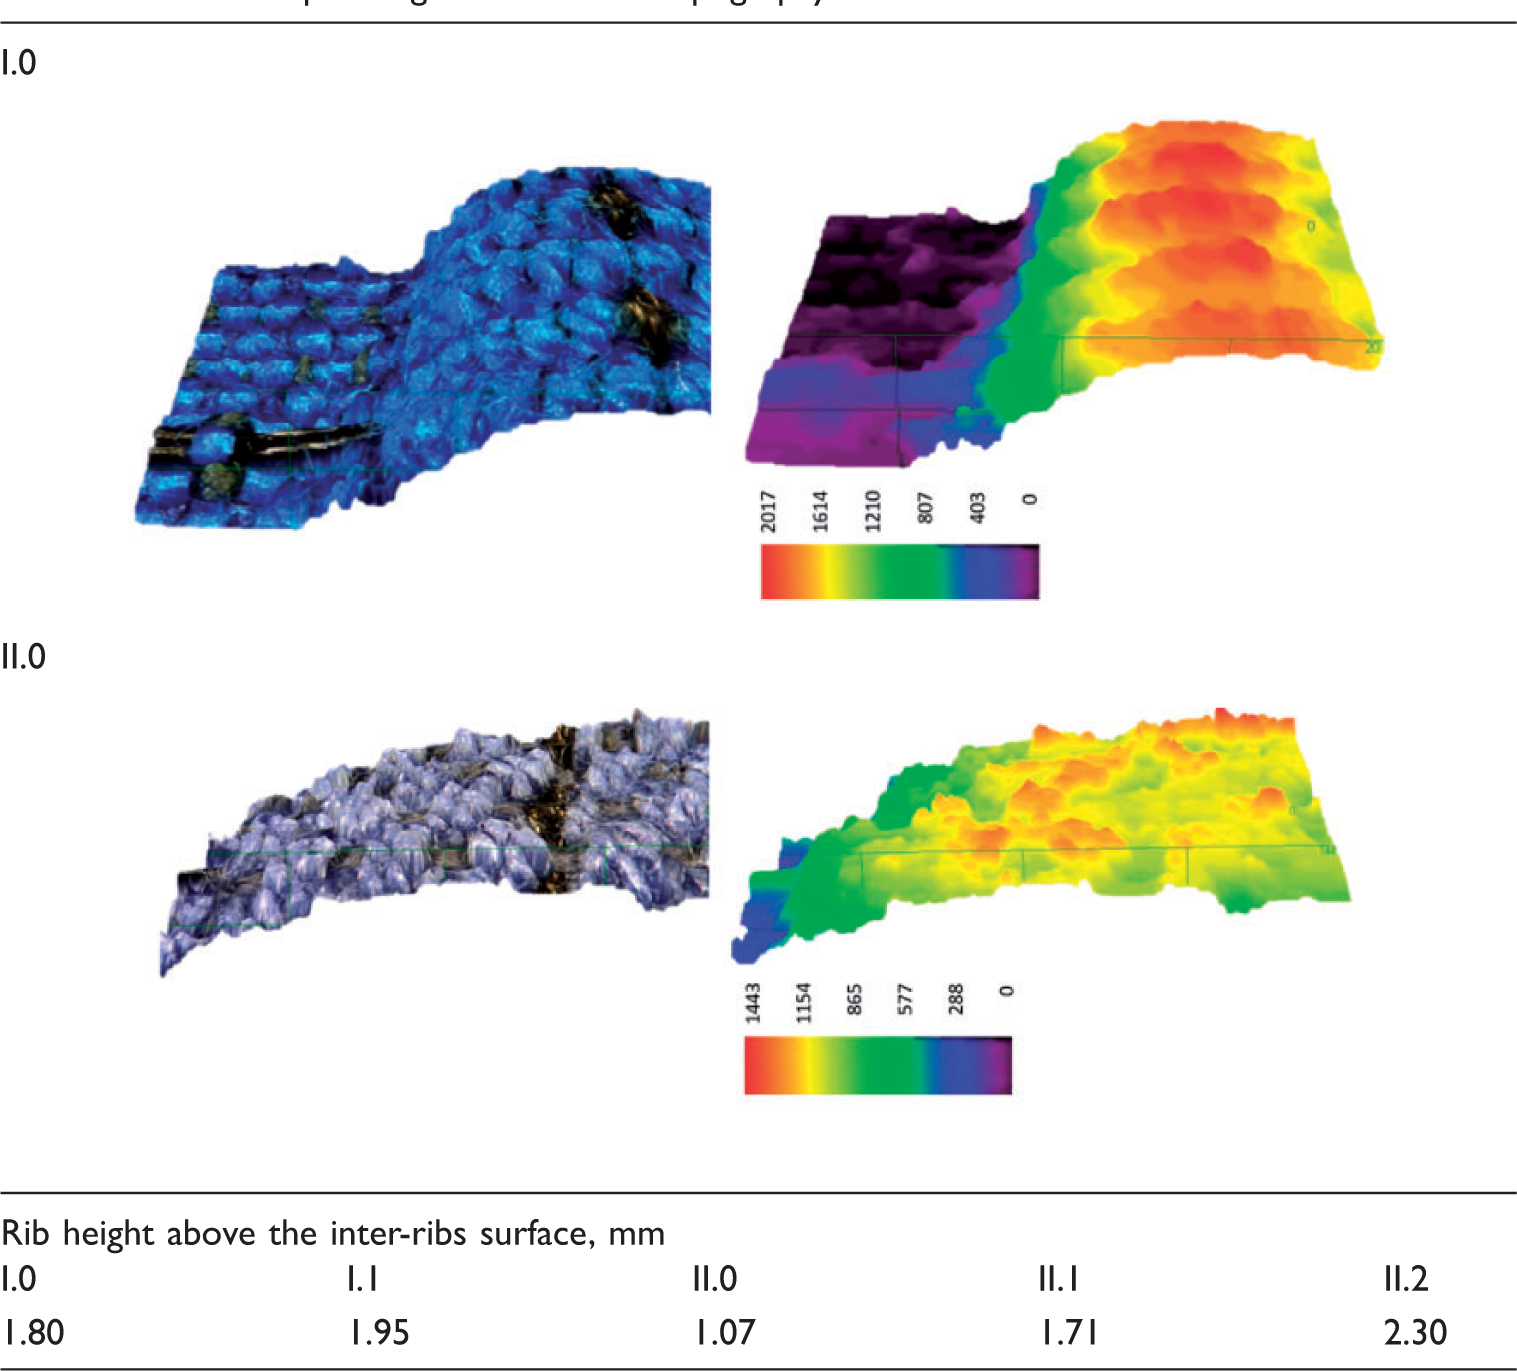
Microscopic images and surface topography of the ribs of fabrics I.0 and II.0
The pressure distribution depends on the type of fabric. The maximum pressure range is about 100–120 mmHg (13.33–15.99) × 103 Pa (Table 4, the red color). Based on the maps, the size of area with pressure not exceeding half of the maximum pressure value was calculated as 0–60 mmHg (0–7.99) × 103 Pa. The percentage of these areas is different depending of the fabric type and the load (Figure 2).
The percentage of area with the (0–7.99) × 103 Pa pressure values.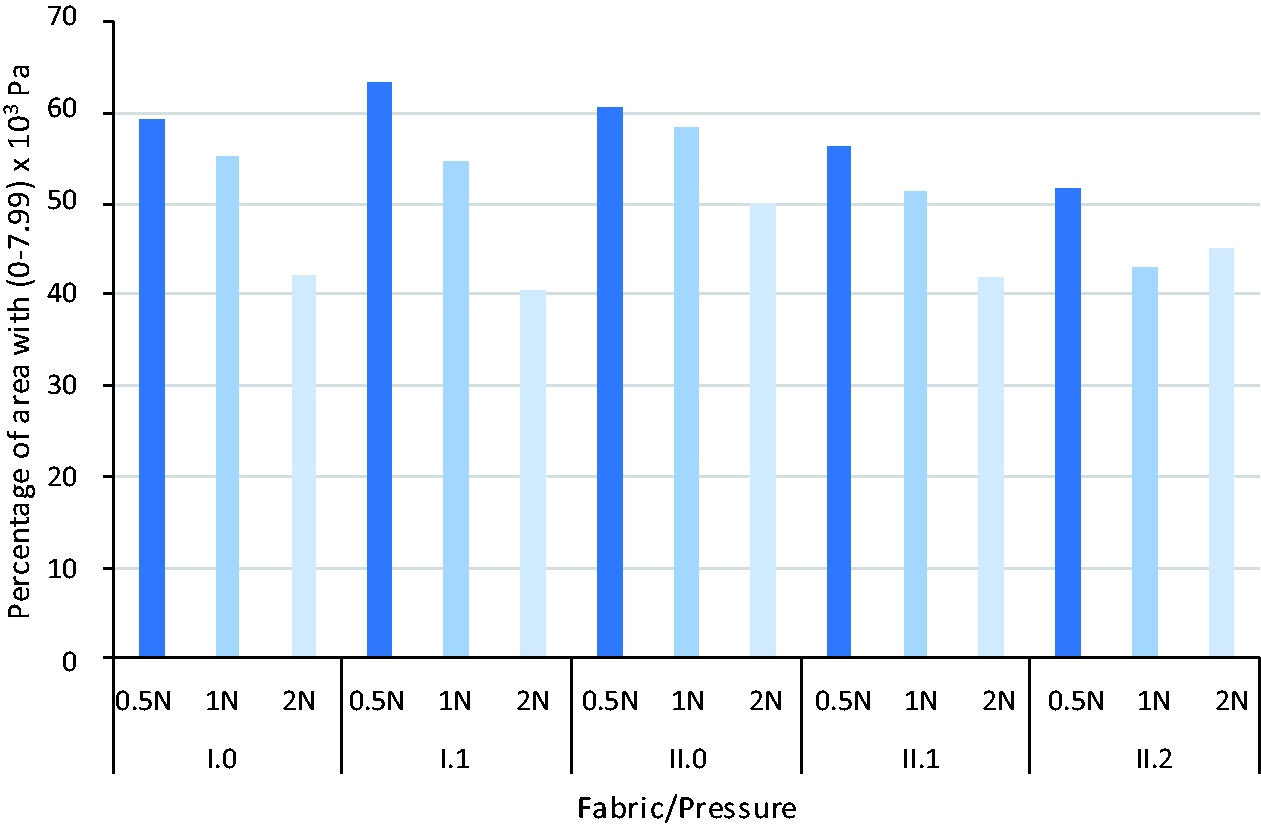
The share of area with a pressure of 0–60 mmHg (0–7.99) × 103 Pa decreases with the increase of pressure force for all fabrics, excluding II.2. For basic fabrics I.0, II.0 and fabrics I.1, II.1 with the same linear elements under 0.5 N and 1 N loads, pressure in the range of 0–60 mmHg (0–7.99) × 103 Pa occurs in more than 50% of the measuring area. For fabric II.2 such pressure takes over 50% for 0.5 N load only. The distribution of pressure, especially for the lower pressure forces, can be affected by the fabric structure and the surface topography.
Evaluation of heat transport
Insulating properties
Results of the Alambeta test
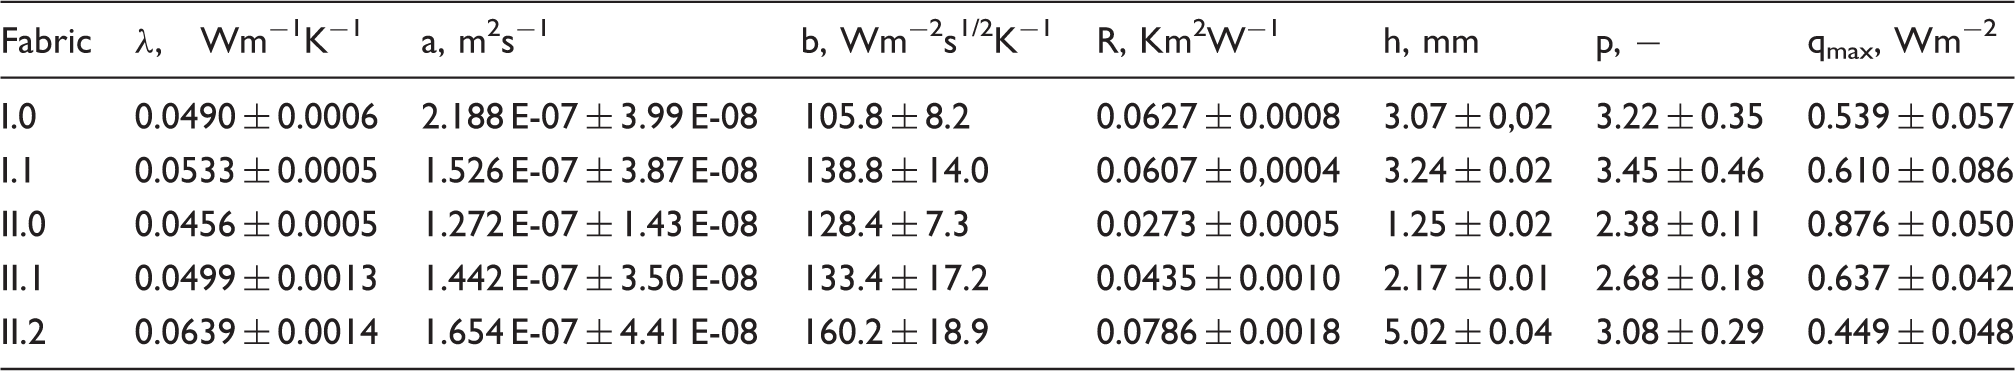
It was observed that the thermal characteristic depends on the raw materials of components, structure, thickness, and mass per unit area of the fabrics. The structure of the yarn and fabric influences, inter alia, the size of the contact surface between the fabric and the plate of the apparatus. The highest values of absorption b were observed for fabric II.2. A high value of thermal resistance r results from large volumes of air and the thickness of this fabric. In the case of this sample, inserting the tube results in changing both the top and bottom side of the fabric and increasing of the air entrapped between fabric surfaces and the plates. For the other fabrics the bottom side is flat and adheres to the plate during measurement. For basic fabric II.0 the values of absorption and thermal resistance are significantly lower because this fabric has the lowest thickness, and also the spaces filled with air are the smallest. For fabrics I.1 and II.1 with the same linear element, the differences concern the values of thermal resistance. Higher resistance was observed for fabric II.1, which results from wider ribs and larger air content. The linear element fills the space of ribs in fabric I to a greater extent, which is confirmed by the differences in thickness of fabrics I.1 and II.1 which are 3.24 mm and 2.17 mm, respectively. Fabric II.0 is characterized by the highest value of max heat flow density qmax. This sample has the lowest mass per unit area and thickness and the largest contact surface determined for load of 2 N (Table 3).
Results of measurements on KES-F7 Thermo Labo II apparatus
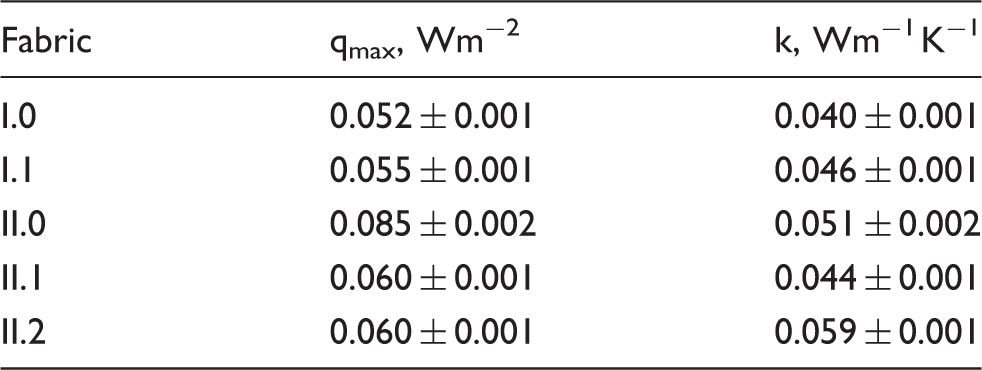
The results of tests using KES-F7 Thermo Labo II apparatus show similar dependencies as in the case of results of Alambeta test. There are significant correlations between results of max heat flow density for both methods (qmax KES = 0.0699 qmax Alambeta + 0.0189, r = 0.8539). The highest value of qmax, meaning a cooler feeling of the fabric at touch, is for basic fabric II.0. The highest value of thermal conductivity k was obtained for fabric II.2 (with polyethylene tube). It was observed that for the complex heterogeneous structures, the results of tests are attributable to the properties of all components as well as the structure of the tested system.
Heat transport during heating
Figure 3 presents thermovision images for fabrics II.0 and II.2 after 330 seconds of heating and the values of maximum and minimum temperatures.
Example thermovision images for fabrics II.0 and II.2 after 330 seconds of heating.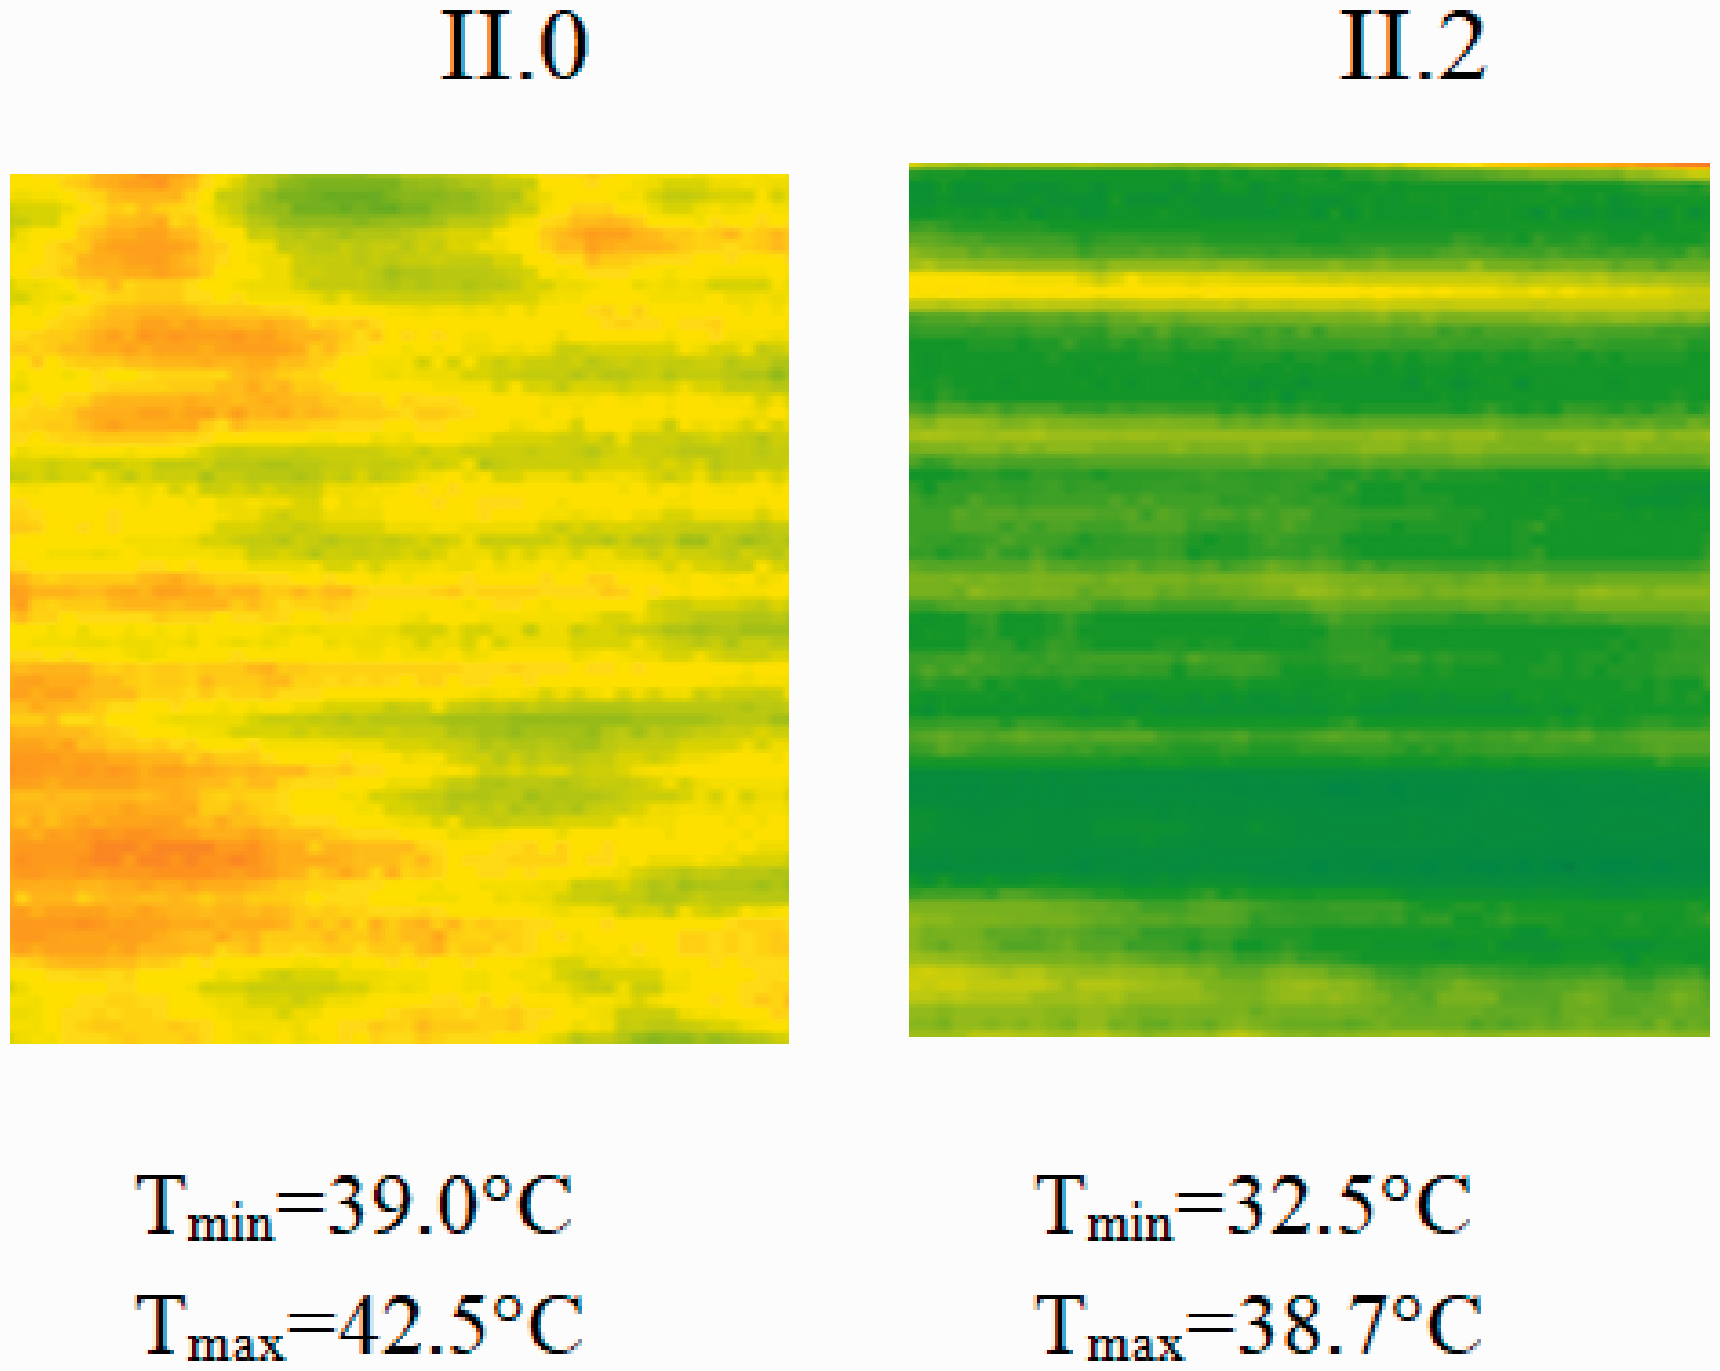
On the basis of the thermovision images recorded during heating, the dependence of surface temperature of the fabric on time was determined (Figure 4). The increment of temperature and the rate of its increase on the fabric surface in the range of 0–330 s were also calculated (Table 8).
Dependence of temperature (T) on time (t) for fabrics I.0, I.1, II.0, II.1, and II.2 during the heating process. Total increment of temperature, the rate of temperature increase in the range of 0–330 s and temperature after 1200 s of heating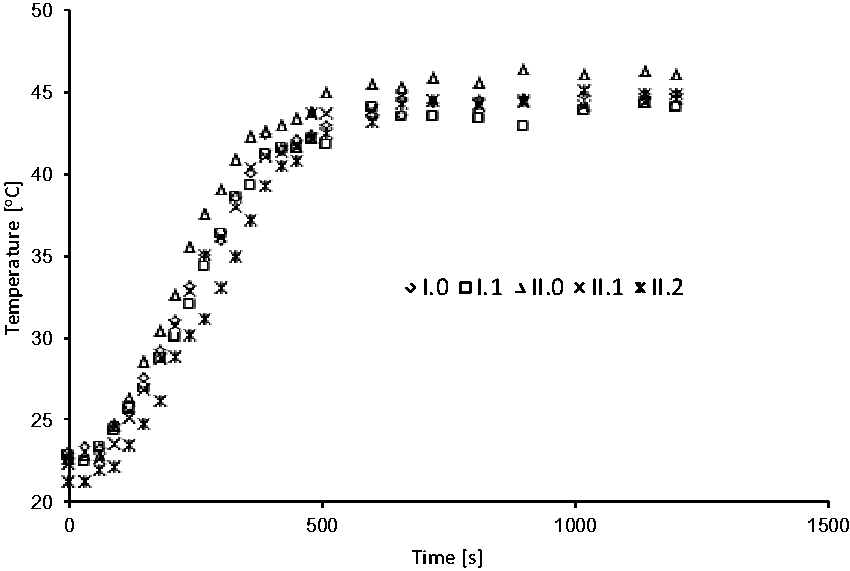
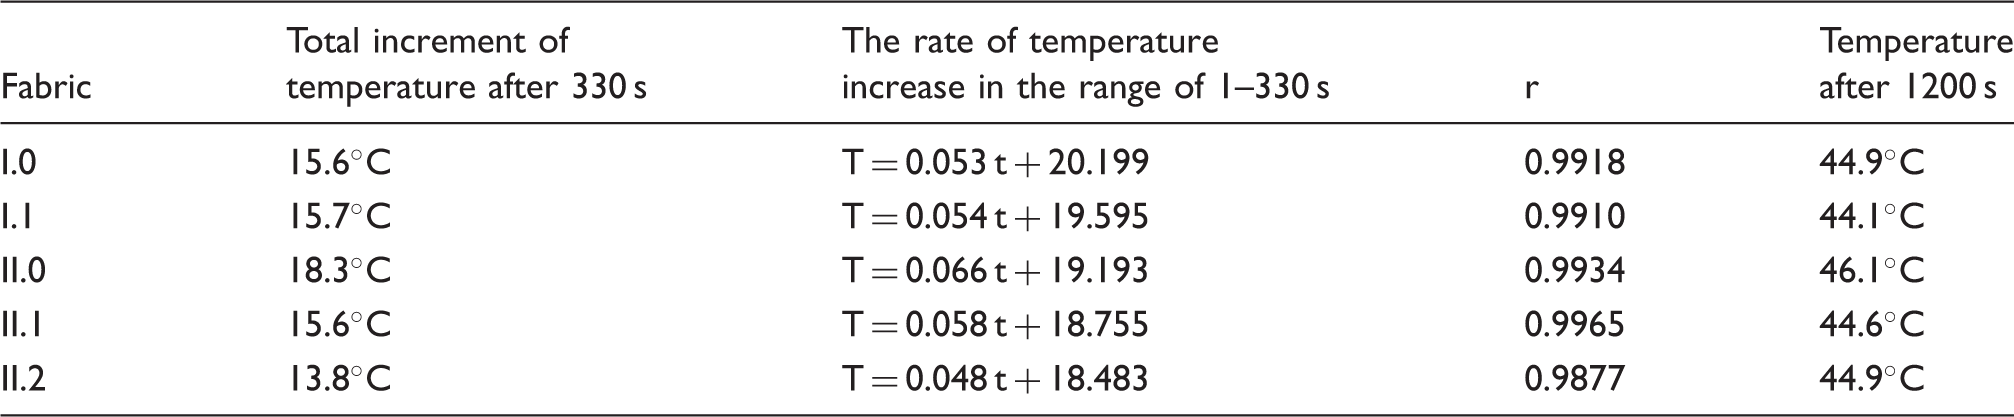
In the range of 1–330 s the highest temperature increment was observed for fabric II.0 and the lowest for fabric II.2. For these fabrics also the highest and the lowest rate of temperature increase was found (slope of 0.066 and 0.048, respectively). This results from the differences in the heat resistance values obtained in the Alambeta test, respectively of 0.0273 Km 2 W−1 and 0.0786 Km 2 W−1 (Table 6). The temperature after 1200 s is the highest for fabric II. 2, and for the other fabrics the values are similar.
Heat transport during cooling
Based on the thermovision images recorded during the cooling process, the dependence of temperature of the fabric on time was set up (Figure 5) and the drop of temperature after 60 s and the rate of temperature decrease were calculated (Table 9).
Dependence of temperature (T) on time (t) for fabrics I.0, I.1, II.0, II.1, and II.2 during the cooling process. Total drop in temperature, the rate of temperature decrease in the range of 1–60 s and minimum temperature after 360 s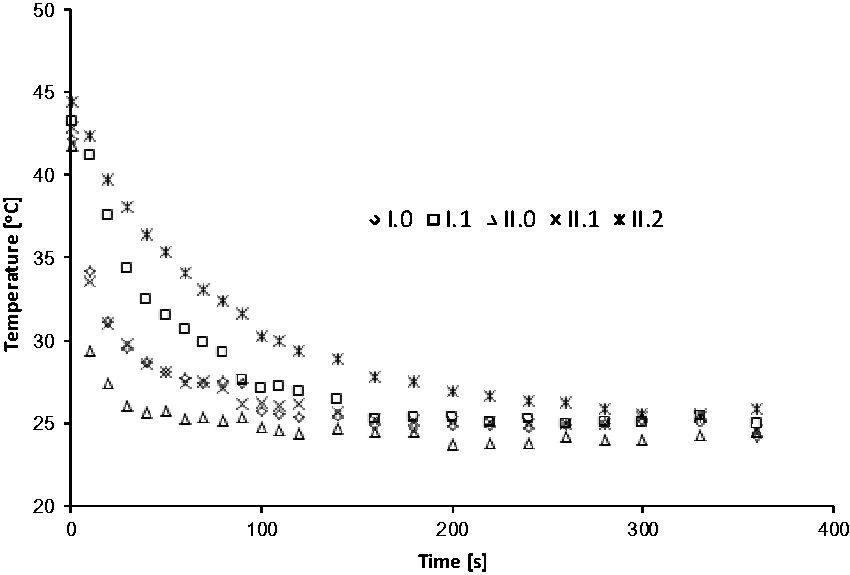
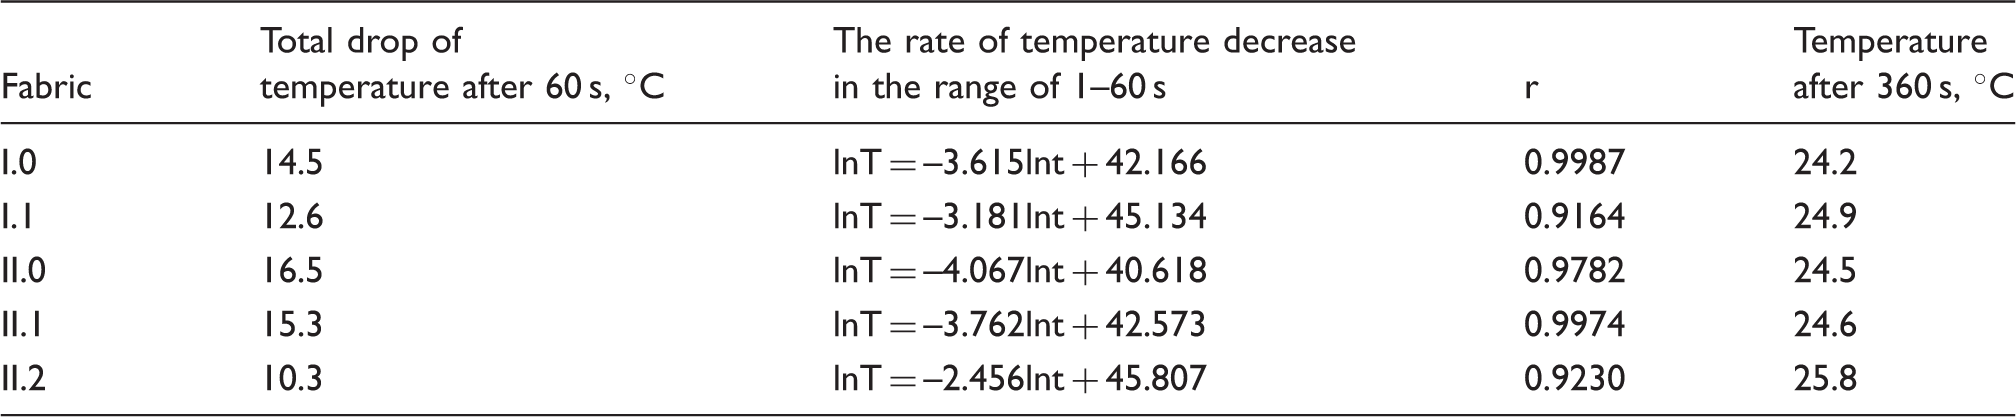
The cooling curves of the fabrics differ particularly for the beginning of the process. For comparison purposes, the rate of temperature decrease in the range of 1–60 s was determined. The slowest cooling was observed for fabric II.2 and the fastest for fabric II.0 (slope of –2.456 and –4.067, respectively), which may result, inter alia, from the differences in their values of thermal absorptivity (Alambeta test), respectively of 160.2 Wm−2s1/2K and 128.4 Wm−2s1/2K (Table 6). For the basic fabrics I.0 and II.0, the impact of the differences in the yarn and fabric structure on the cooling effect is visible (slope of –3.615 and –4.067, respectively). After placing the same linear element in both fabrics, the cooling rate decreased by about 12% and 7.5% for I.1 and II.1, respectively. The presence of polyethylene tube in the fabric II.2 caused a decrease in the cooling rate of 39.6%. After 60 s the highest temperature drop was observed for fabric II.0 and the lowest for fabric II.2 (Table 9). After 360 s the temperature values for all fabrics were comparable; however fabric II.2 has the highest temperature. Fabric II.2 with polyethylene tube is most heterogenous system and is characterized by significant differences in the heat conductivity of the components. Thermal conductivity of air is 0.025 Wm−1K−1, polyester 0.218 Wm−1K−1, and polyethylene 0.50 Wm−1K−1.28 The complex structure and the presence of the air-filled tube can slow down the cooling of this fabric. The heat transport process in heterogeneous systems is very complex. Shen et al. 29 analyzed heat transfer for different fabrics with the same weave taking into account the mass density, specific heat, and thermal conductivity of the fibers and air. By modeling heterogeneous heat transfer for fabrics and comparing the results with experimental data, they found that in the case of high thermal conductivity anisotropy of the fiber, faster heat transport was observed in the longitudinal direction of the yarn. Linear longitudinal elements placed into ribs fabrics can thus shape the heat transport, which is confirmed by the results of heating and cooling rate of tested fabrics. In Figure 3, the temperature distribution on the surface of the ribs and between them is clearly visible.
The change in thickness of the base fabrics under pressure of 1.9 N in Alambeta apparatus indicates that the fabric I.0 has a more stable ribs structure than II.0 of lower mass per unit area (respectively of 411 g/m2 and 285 g/m2) and thickness (respectively of 2.63 mm and 1.40 mm) in an unloaded state (Table 1 and 2, Figure 6). Consequently, fabric II.0 has a significantly larger contact surface under pressure of 2 N measured by the I-SCAN method. Such changes affect the thermal diffusivity value, respectively, of 2.188 E-07 and 1.272 E-07 m2s−1 for I.0 and II.0, which depends, inter alia, on the air content in the structure. The addition of a longitudinal textile element 1 into II.0 structure increased the thickness of fabric II.1 (Figure 6) and also reduced the air content, so the thermal diffusivity values get closer each other for fabrics I.1 and II.1, respectively, of 1.526-07 and 1.442 E-07 m2s−1. We also found that the insertion of the element 2 (tube), besides increasing the thickness and reducing the contact surface, changed the structure of the bottom side in fabric II.2. In contrast to the other fabrics it is not flat, which also affects thermal kinetics (Figure 5).
Comparison of thickness measured by Alambeta method and contact surface value measured by I-SCAN method under pressure, respectively of 1.9 N and 2 N.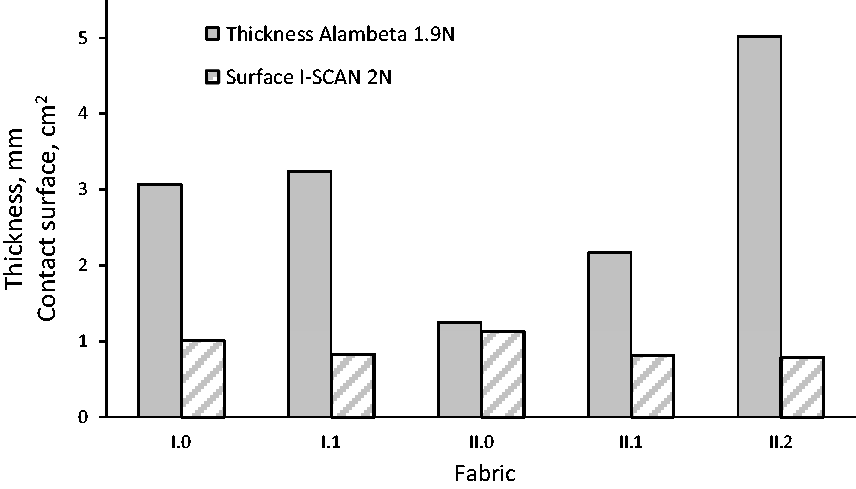
Air permeability
Air permeability for fabrics I.0, I.1, II.0, II.1, and II.2
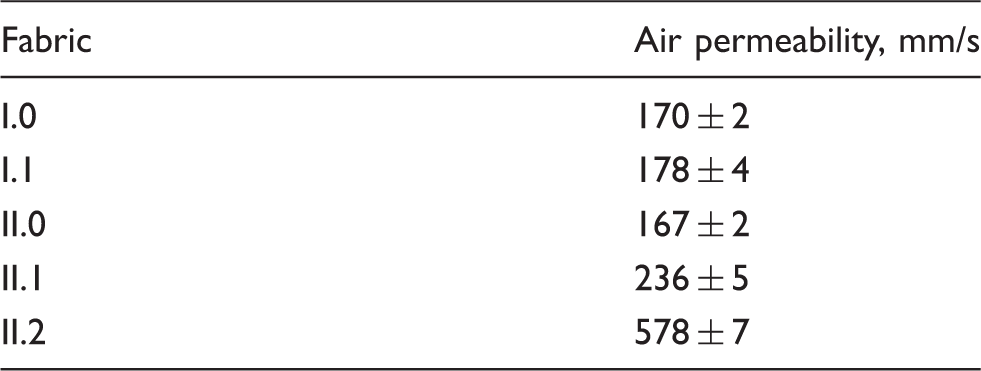
It was also found that there is significant correlation between air permeability and thermal conductivity (Table 6) values (R = 4 E-0.5 λ + 0.0426, r = 0.923).
Summary
We tested basic and modified relief fabrics with regard to pressure distribution and heat transport. The pressure distribution and kinetics of temperature changes of the tested fabrics depend on the type of woven relief structure, linear element, and its fit to the rib tunnel of the fabrics. These factors also affect the contact area between the fabric and the surface of the sensor under various loading. The highest value of average pressure was observed for basic fabrics I.0 and II.0 for all tested loadings of 0.5 N, 1 N, and 2 N. Inserting the same linear element 1, braided round tape, into both basic fabrics, lowers the value of average pressure on the surface of the fabrics I.1 and II.1 by 6.9% and 3.5%, respectively, at the lowest loading and by 9.8% and 4.6% at the highest loading. For fabric II.2 with linear element 2, polyethylene tube, this decrease is by 10.4% and 8.4%, respectively. The local increase in the individual pressure in the area of filled ribs was observed for the highest loading. Inserting the linear elements also changes the thermal characteristic of the fabrics. Thermal conductivity values increased by 8.8%, 9.4%, and 40.1%, respectively, for fabrics I.1, II.1, and II.2. Designing relief textile materials which may shape the heat transport and the pressure distribution requires taking into account material characteristics of all components and the construction of the whole system. This allows adjustment of the relief structure to the needs of dedicated use; this will be the next step of our research.
Footnotes
Acknowledgements
Basic fabrics were developed as part of the EUREKA E! 3422 – UPTEXEL project Modern upholstery materials with antistatic properties. Modification of textile structures was carried out in the frame of statutory activities (PS.IW.03.01.T3) of the Textile Research Institute in 2018 financed by the Ministry of Science and Higher Education. The part of methodology was elaborated in the 4th stage of the program ‘Improving the safety and working conditions’ financed by the Ministry of Science and Higher Education/National Centre for Research and Development.
Declaration of conflicting interests
The authors declared no potential conflicts of interest with respect to the research, authorship, and/or publication of this article.
Funding
The authors disclose receipt of the following financial support for the research, authorship and/or publication of this article: This study was supported by Ministry of Science and Higher Education/National Centre for Research and Development, Poland.