




Abstract
Fabric shape retention is a crucial property that impacts the durability and usability of fabric and which needs a convenient and accurate evaluation method. In the previous research, the automated crease recovery testing method was used to obtain fabric crease recovery information and evaluate the property of shape retention. Based on the previous research, an orthogonal test method was adopted to investigate the effect of different test parameters on the stability of shape retention detection in this paper. First, three factors, that of sample size, pressure, and pressure time, and three different levels of each factor were determined by the L9(34) orthogonal test table. Next, the fabric shape retention indexes were detected by nine different test schemes, and the comprehensive score of shape retention index standard deviation was obtained as the evaluation criterion of the orthogonal test results. Finally, the optimal test scheme was determined by visual analysis and variance analysis. The results show that the sample size has a certain effect on the stability of shape retention indexes, while the pressure time and the pressure have no significant influence. The optimal test scheme is that the sample size is 30 cm × 30 cm, the pressure time is 60 s, and the pressure is 40 N. The test result measured by the optimal test parameters reveals excellent stability when the vertex angle standard deviation is 2.0°, the height standard deviation is 0.06 cm, and the shape retention area standard deviation is 0.16 cm2. This paper provides an experimental basis for improving the accuracy of fabric shape retention evaluation method.
Fabric shape retention is one of the properties to decide whether the fabric is easy to use and maintain, which determines the style and performance standard of the fabric. The shape retention of fabrics includes wrinkle recovery, drape, smoothness of appearance, and dimensional stability, etc. The accurate, objective, and comprehensive evaluation of the fabric shape retention is fundamental to textile inspection investigations. The test results are subjective and less accurate when using the conventional standard method to detect fabric shape retention properties. At present, image processing methods and machine vision technology are the usual methods for inspecting fabric properties. Shyr et al. designed a dynamic drape automatic measurement system based on the principle of Cusick's drapemeter and image analysis technology, and the system can automatically measure the static and dynamic drape coefficients of fabrics. 1 Choi et al. developed an objective quantitative grading system for fabric wrinkles based on two-dimensional Fast Fourier Transform (2D-FFT) and verified that the system is objective and quantitative by comparing with the existing testing methods. 2 Shi and Wang used the elastic and friction elements to simulate the theoretical model of fabrics, and described the fabric wrinkle recovery performance accurately by detecting the bending stiffness properties and the bending hysteresis properties. 3 Fridrichova and Zelova used the image processing method to detect the fabric wrinkle recovery angle in different wrinkle directions and proposed an objective evaluation method of multi-directional measurement of crease. 4 Yu et al. proposed the total drape angle index, which is based on 3D fabric drapability to characterize the drapability of woven fabrics. 5 Azmat et al. proposed a fabric drape height index, which can be used to evaluate fabric drape objectively. 6 Zhang et al. used image processing technology to evaluate the fabric shape retention by calculating the convex area of the four side cross-section image of the fabric. 7 Zheng et al. proposed the fuzzy mathematics double model mutual verification method by combining subjective fuzzy evaluation and a near-optimal gray element model to evaluate the shape retention of casual trousers. 8 Most of these studies are the only investigation on single properties, such as wrinkle recovery, drape, and other properties, and there are only a few comprehensive performance studies on fabric shape retention. Furthermore, specialized equipment is required to detect the comprehensive performance of fabric shape retention.
Thus, the shape retention detection system based on image processing technology was proposed to extract and analyze the shape retention indexes of fabrics in the former study. 9 Proven by the test, the extracted shape retention indexes can constitute a linear relationship with the crease recovery angle or drape coefficient measured by the existing standard methods. Nevertheless, the test method with the former test parameters is not suitable for some fabrics with excellent crease recovery performance, and the stability of index extraction needs to be improved. As known from the conventional testing of fabric crease recovery angles and the current research on fabric shape retention, different testing parameters can affect the stability of shape retention index detection. Zhang et al. adopted the single-factor method to explore the influence of test parameters such as sample size, pressure, pressure time, and recovery time on the detection results of the cotton fabric crease recovery angle. 10 Wang et al. discussed the influence of several different loads, pressure time, and recovery time on the crease recovery property of woven fabric by using a crease recovery tester. 11
On the basis of the former study, 9 this paper further investigates the effect of different testing parameters on the stability of fabric shape retention index detection. The orthogonal test method was chosen as an efficient and scientific method to optimize the test scheme. Based on the experience and the current research, the factors and levels that affect the stability of fabric shape retention index detection were first determined. Referring to the L9(34) orthogonal test table, the test scheme was determined. The SDs of the shape retention indexes for three experiments were taken as the evaluation criterion to obtain the best test parameters. As demonstrated by the orthogonal test, altering the test parameters can improve the stability and accuracy of the fabric shape retention index. This study provides an experimental reference for the test parameters selected for the subsequent research of fabric shape retention.
Experimental
Materials
Seven types of woven fabrics with different materials and specifications were selected in this study. The specifications of the fabrics are shown in Table 1. The existing standard methods of fabric crease recovery performance specify that the crease recovery angle in both warp and weft directions should be detected. This paper aims to explore the effect of different test parameters on the stability of fabric shape retention index detection. By using the same test parameters, the rule reflected by the test results of warp and weft direction are similar. The main reasons for the difference of fabric shape retention property in different crease directions are the difference of warp density and weft density. Thus, only weft samples are tested for each fabric. Three samples were cut along the weft direction for each fabric and placed at 65 ± 2% RH, 21 ± 1°C (70 ± 2°F) conditions for at least 24 hours before testing.
The specifications of test samples

Method
Video image acquisition of fabric crease recovery
The fabric shape retention testing device used in this paper is shown in Figure 1. The device consists of the control system interface, the sample table, the lifting device, the pressure device, the camera, and the upper cover.
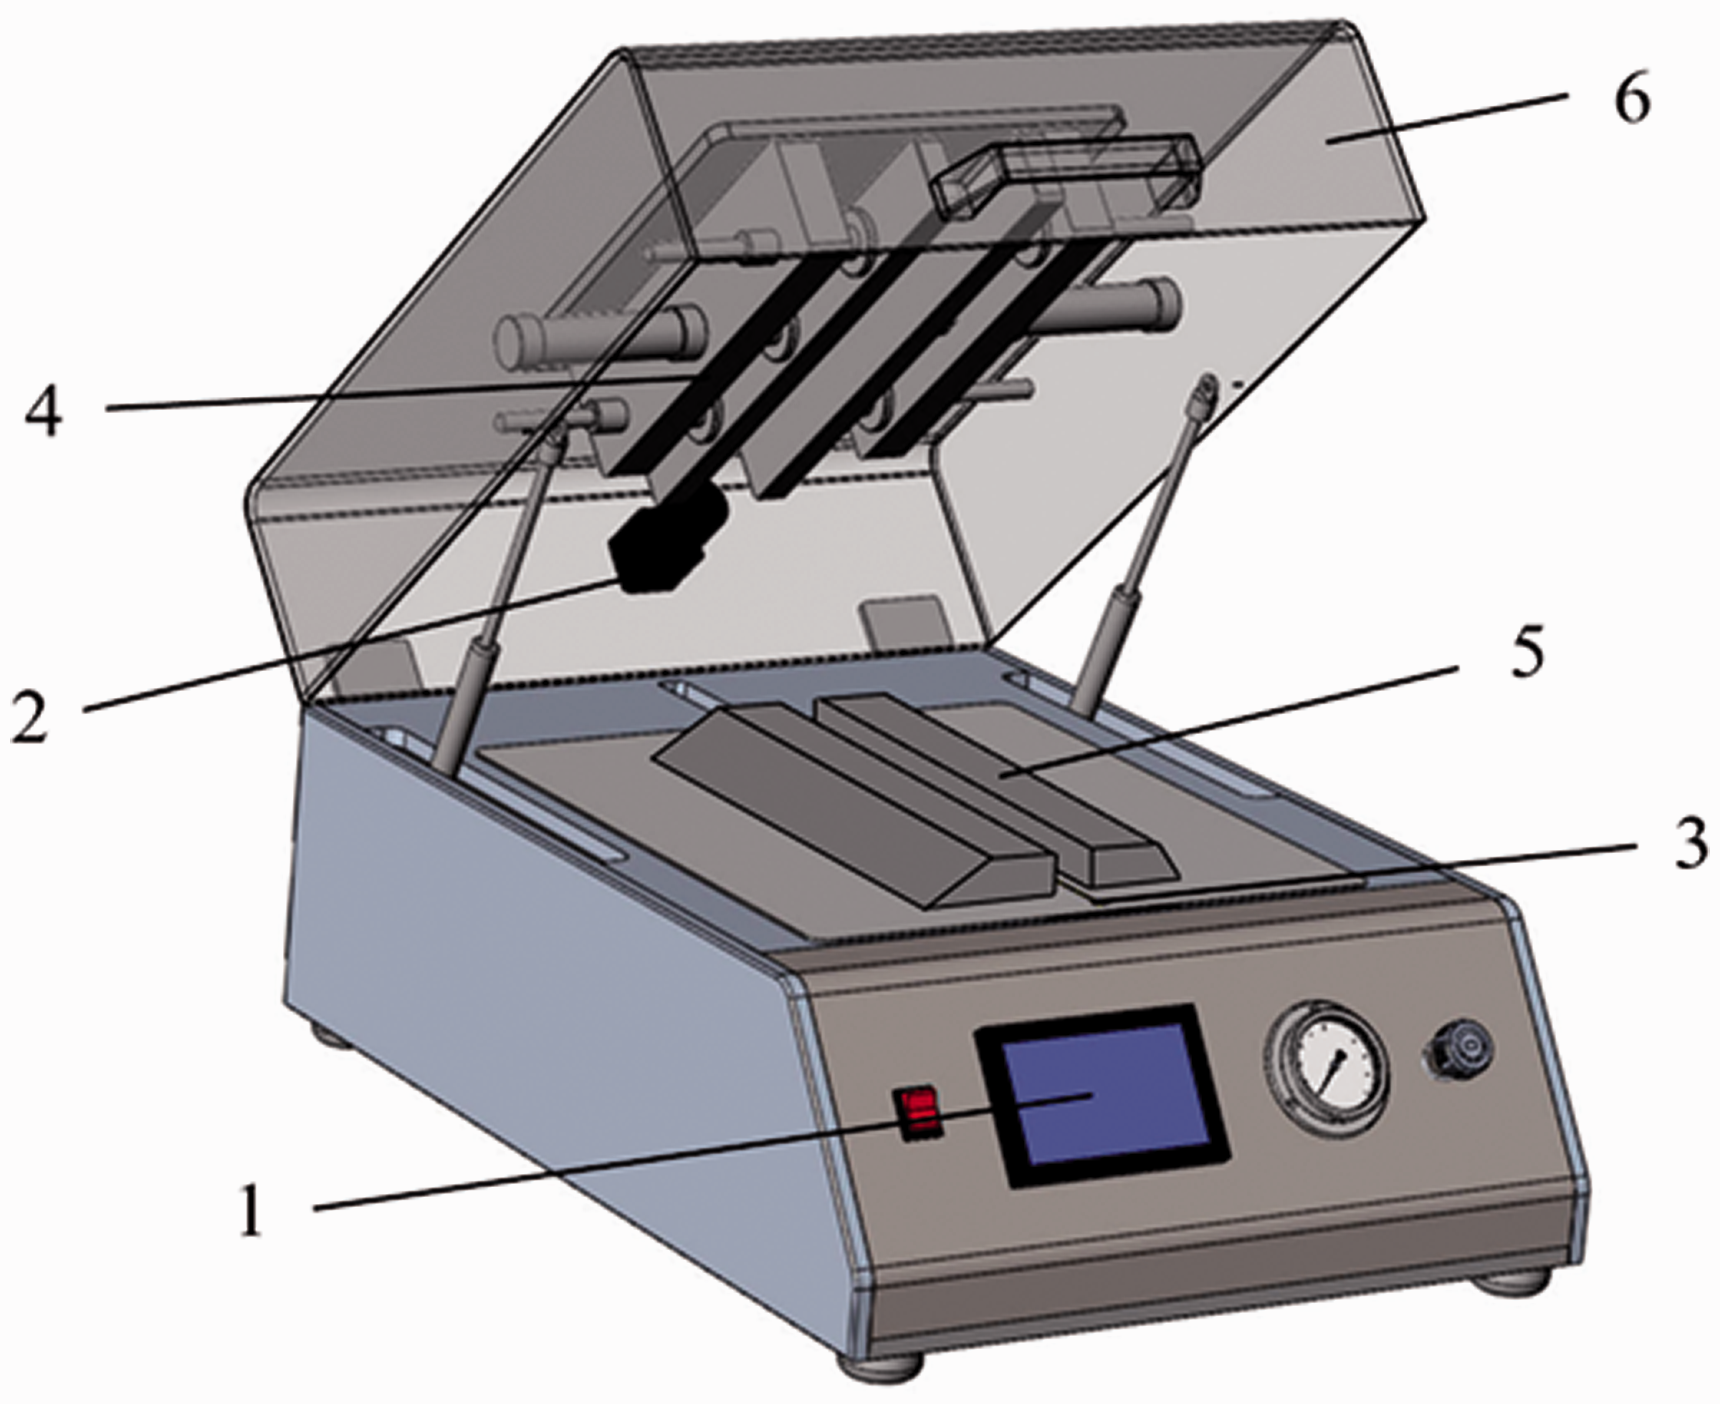
The fabric shape retention testing device. (1—control system interface; 2—camera; 3—lifting device; 4—pressure device; 5—sample table; 6—upper cover.)
Firstly, the parameters such as pressure time, pressure, and action interval time of the lifting device are input in the control system interface. Then, the sample is laid flat on the sample table with the centerline of the sample parallel to the middle axis of the sample table. When the system is started, the sample rises with the action of the lifting device and then the pressure device presses it. When the pressure time is reached, the pressure device is removed and the lifting device descends. The sample falls onto the sample table to unfold the crease. This process is carried out in an environment with the upper cover closed to isolate the interference of external factors and the process of fabric crease unfolding is recorded by the camera. The frame rate of the video sequence is 8.60 f/s and the video image is a 1284 × 961 pixels 8-bit gray image with a resolution of 300 dpi.
Video image processing
One frame of the captured video sequence in the crease recovery period is shown in Figure 2. The steps for video image processing are as follows. Firstly, the video image is preprocessed to highlight the sample by subtracting the pre-stored image background. Then, the gray image is processed into a binary image (Figure 3) by using the Otsu threshold algorithm. 12 The sample is processed into a white foreground and separated from the black background. Then, the “disk” structure element with a radius of four pixels is selected to perform a morphological opening operation on the image. Thus, the environmental noise is removed, and the image becomes smoother. In order to be convenient for the identification and extraction of evaluation indexes, the edge detection method is carried out to detect the brightness change of pixels in the image from top to bottom. When the pixel brightness value of the detection point changes from zero to one, the pixel is taken as a point on the thinning line of the crease contour of the sample. The image is finally processed into a connected curve composed of white dots in single-pixel size, which is shown in Figure 4.
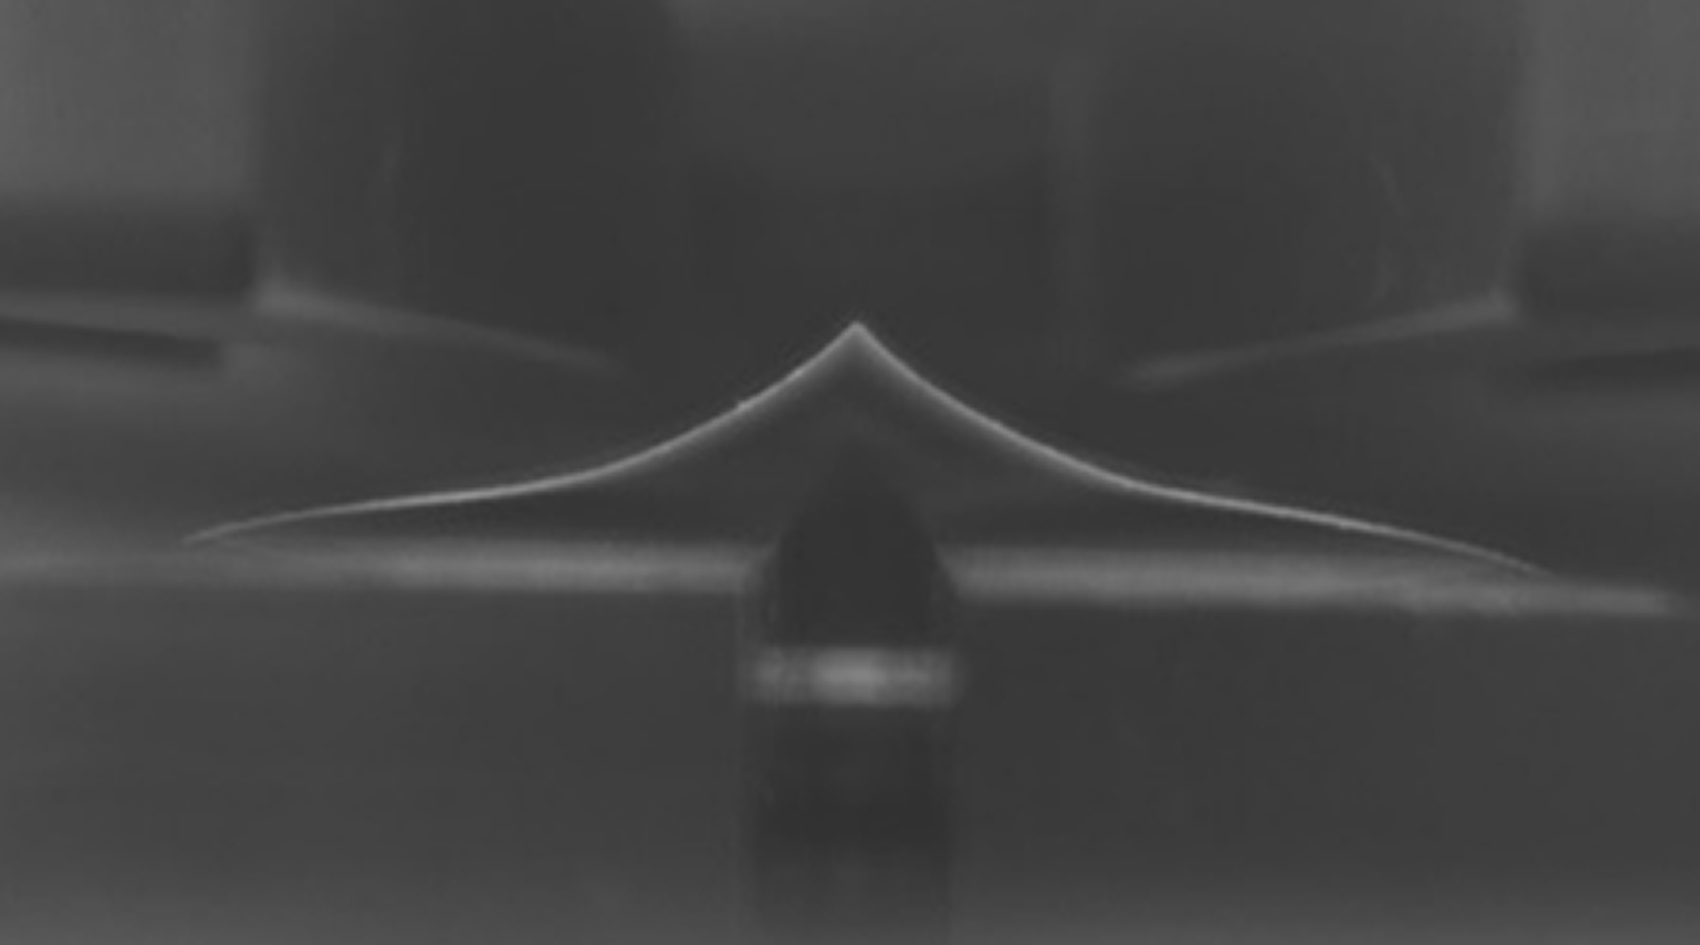
A frame of the video image.
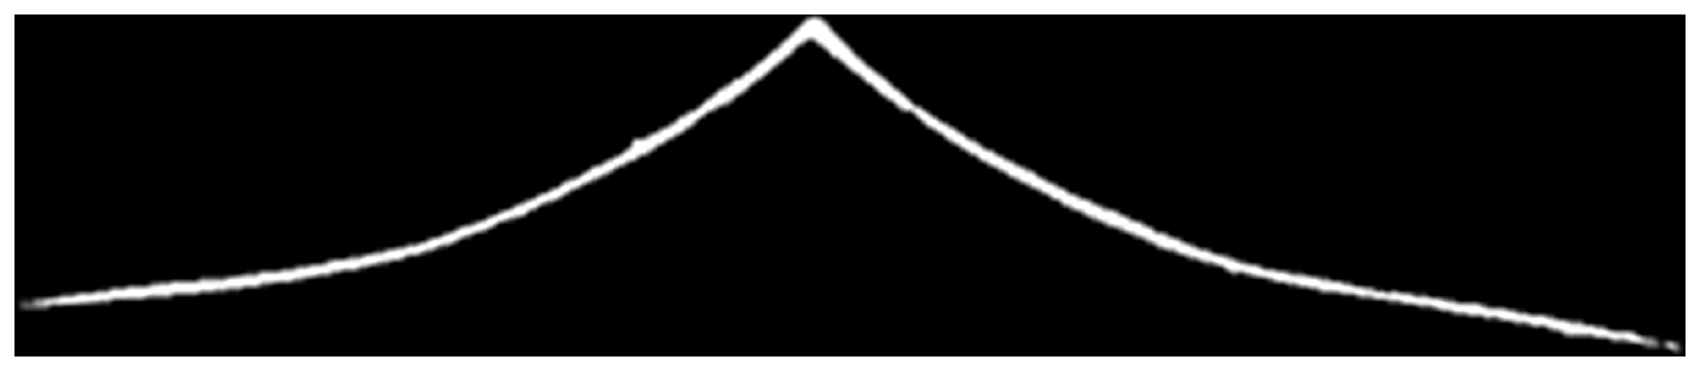
Binary image.
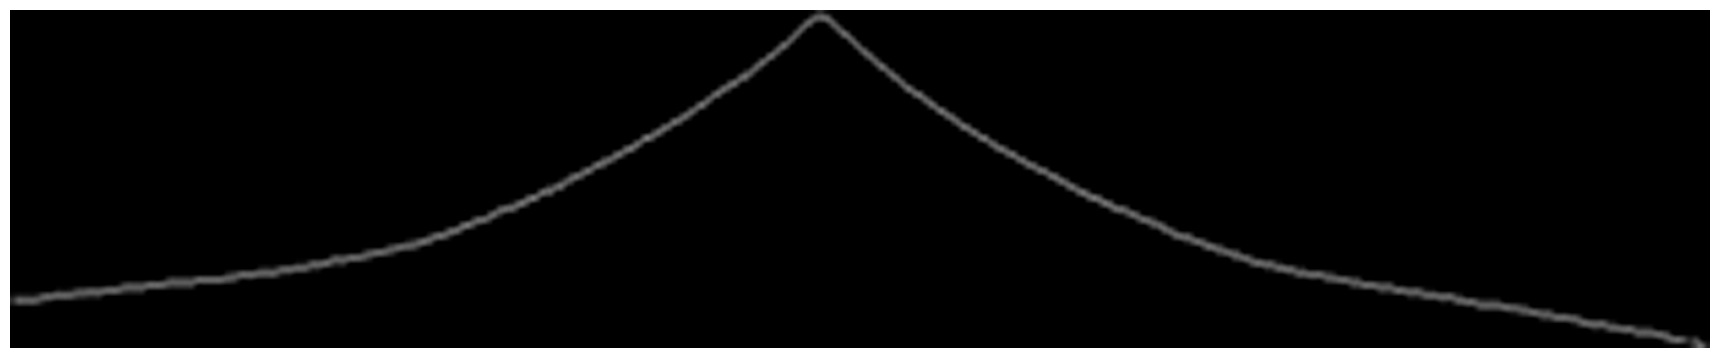
The crease contour image.
Index extraction of fabric shape retention
Three indexes for evaluating fabric shape retention are extracted from the processed video images, namely the vertex angle (VA), the height (H), and the shape retention area (SA). The VA is the angle formed by the two sides of the sample crease. The larger the VA is, the better crease resistance of the fabric. The H is the vertical distance between the crease vertex and the sample table. The smaller H is, the better the drape performance of the fabric. The SA is the area enclosed between the two sides of the crease and the sample table. The smaller SA is, the better the comprehensive shape retention ability of the fabric is.
Orthogonal test design
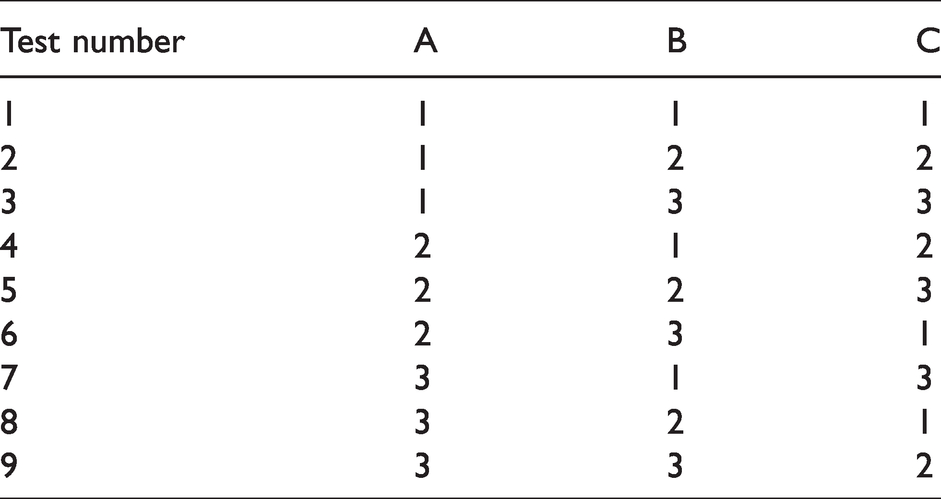
Orthogonal tests are conducted on the representative test points to investigate the general information of the test. Besides this, orthogonal tables can be utilized to determine the influence ranking of factors and levels, and then the optimal test schemes are selected. The orthogonal test is an efficient, rapid, and economical method for experimental design.13–14 The reference for factor selection in the orthogonal test was provided by current research on fabric crease recovery angle detection and the requirements of AATCC 66-2017. 15 The parameter settings, such as the sample size, pressure time, and pressure, can directly affect the extraction results of the fabric shape retention index. Thus, sample size (A), pressure time (B), and pressure (C) are chosen as the three factors of the orthogonal test. Before conducting the orthogonal test, the level range of each factor was determined by the pre-experiments. For the fabrics with exceptional crease recovery properties, the fabric shape retention indexes were difficult to extract from the indistinct crease when the pressure time is less than 60 s or the pressure is lower than 20 N. To improve the fabric type applicability of the test parameters, 60 s and 20 N should be selected as the minimum level of the factor of the pressure time and the pressure, respectively. Considering the improvement of test efficiency and the pressure device setting, 180 s and 40 N were selected as the maximum level of the pressure time and the pressure, respectively. The fabric shape retention test method requires that samples should be free to unfold the creases on the sample table by self-weight and crease resistance. The sample length should be longer than the sample table length and the sample should not touch the bottom edge of the device. Therefore, the minimum level of the sample size factor in the orthogonal test is 20 × 20 cm, and the maximum level is 30 × 30 cm. Consequently, the orthogonal test with three factors at three levels was designed by a L9(34) orthogonal test table. The factors and their corresponding levels are shown in Table 2. The arrangement of the orthogonal test is shown in Table 3.
Three factors and their corresponding levels

The arrangement of the orthogonal test
Each test scheme of the orthogonal test was repeated three times. For each test scheme, the average of the VA SD (SDVA), the average of the H SD (SDH), and the average of the SA SD (SDSA) of all samples were taken as the evaluation indexes of fabric shape retention index extraction stability. The extreme difference standardization method was used to calculate the scores of different evaluation indexes for each scheme. The variation coefficient method was used to calculate the weight of different evaluation indexes in the score equation for each scheme.
The comprehensive score (Score) for each scheme is the sum of the different evaluation index scores multiplied by their corresponding weights. The comprehensive score calculation equation is shown in equation (1).

WVA is the weight of the VA SD index, WH is the weight of the H SD index, and WSA is the weight of the SA SD index.
The weight calculation equation of the evaluation index is shown in equation (2).

Wi is the weight of the evaluation index i. Vi is the coefficient of variation of the evaluation index i. The coefficient of variation is the ratio of the SD to the average of the evaluation index i. n is the total number of indexes.
The larger the Score is, the greater stability of the shape retention index detected by the test scheme, and the greater stability of the shape retention system.
Results and discussion
Through multiple dynamic detection experiments, the fabric shape retention indexes tend to stabilize in the crease recovery stage and can reach a stable state within 60s. 16 Therefore, the fabric shape retention data in the sixtieth second of the crease recovery process is selected to represent the fabric shape retention property in this paper. The mean value of the shape retention indexes of samples (such as the VA, H, and SA) for three repeated tests of nine test schemes are shown in Table 4.
Mean value of the shape retention indexes

As shown in Table 4, the VAs of Sample #2 and Sample #7 are larger than that of the other samples, and the H and SA are smaller. It illustrates that the samples containing wool fiber have good crease recovery properties. Sample #4 and Sample #5 are the same material, but Sample #4 has a smaller SA than Sample #5. Sample #4, with the larger yarn density and weight, has a better shape retention property.
For samples of all test schemes, the Pearson correlation between the average of the VA and the average of the H is −0.731(|−0.731|<0.80). The Pearson correlation between the average of the VA and the average of the SA is −0.620(|−0.620|<0.80). The Pearson correlation between the average of the H and the average of the SA is 0.972(0.972 > 0.80), which demonstrates that the H and the SA have a linear relationship. Therefore, only the VA and the SA are needed for evaluating fabric shape retention. For the orthogonal test, only SDVA and SDSA are used as the evaluation criteria for detecting the stability of shape retention indexes. In the comprehensive score calculation equation, the weight of the SDH index score is zero. According to equation (2), the weight of the SDVA index score and the SDSA index score are 37% and 63%, respectively. The calculation equation of the final comprehensive score is shown in equation (3).

The SD of the shape retention indexes for three repeated tests of nine test schemes are shown in Table 5.
The SD of the shape retention index
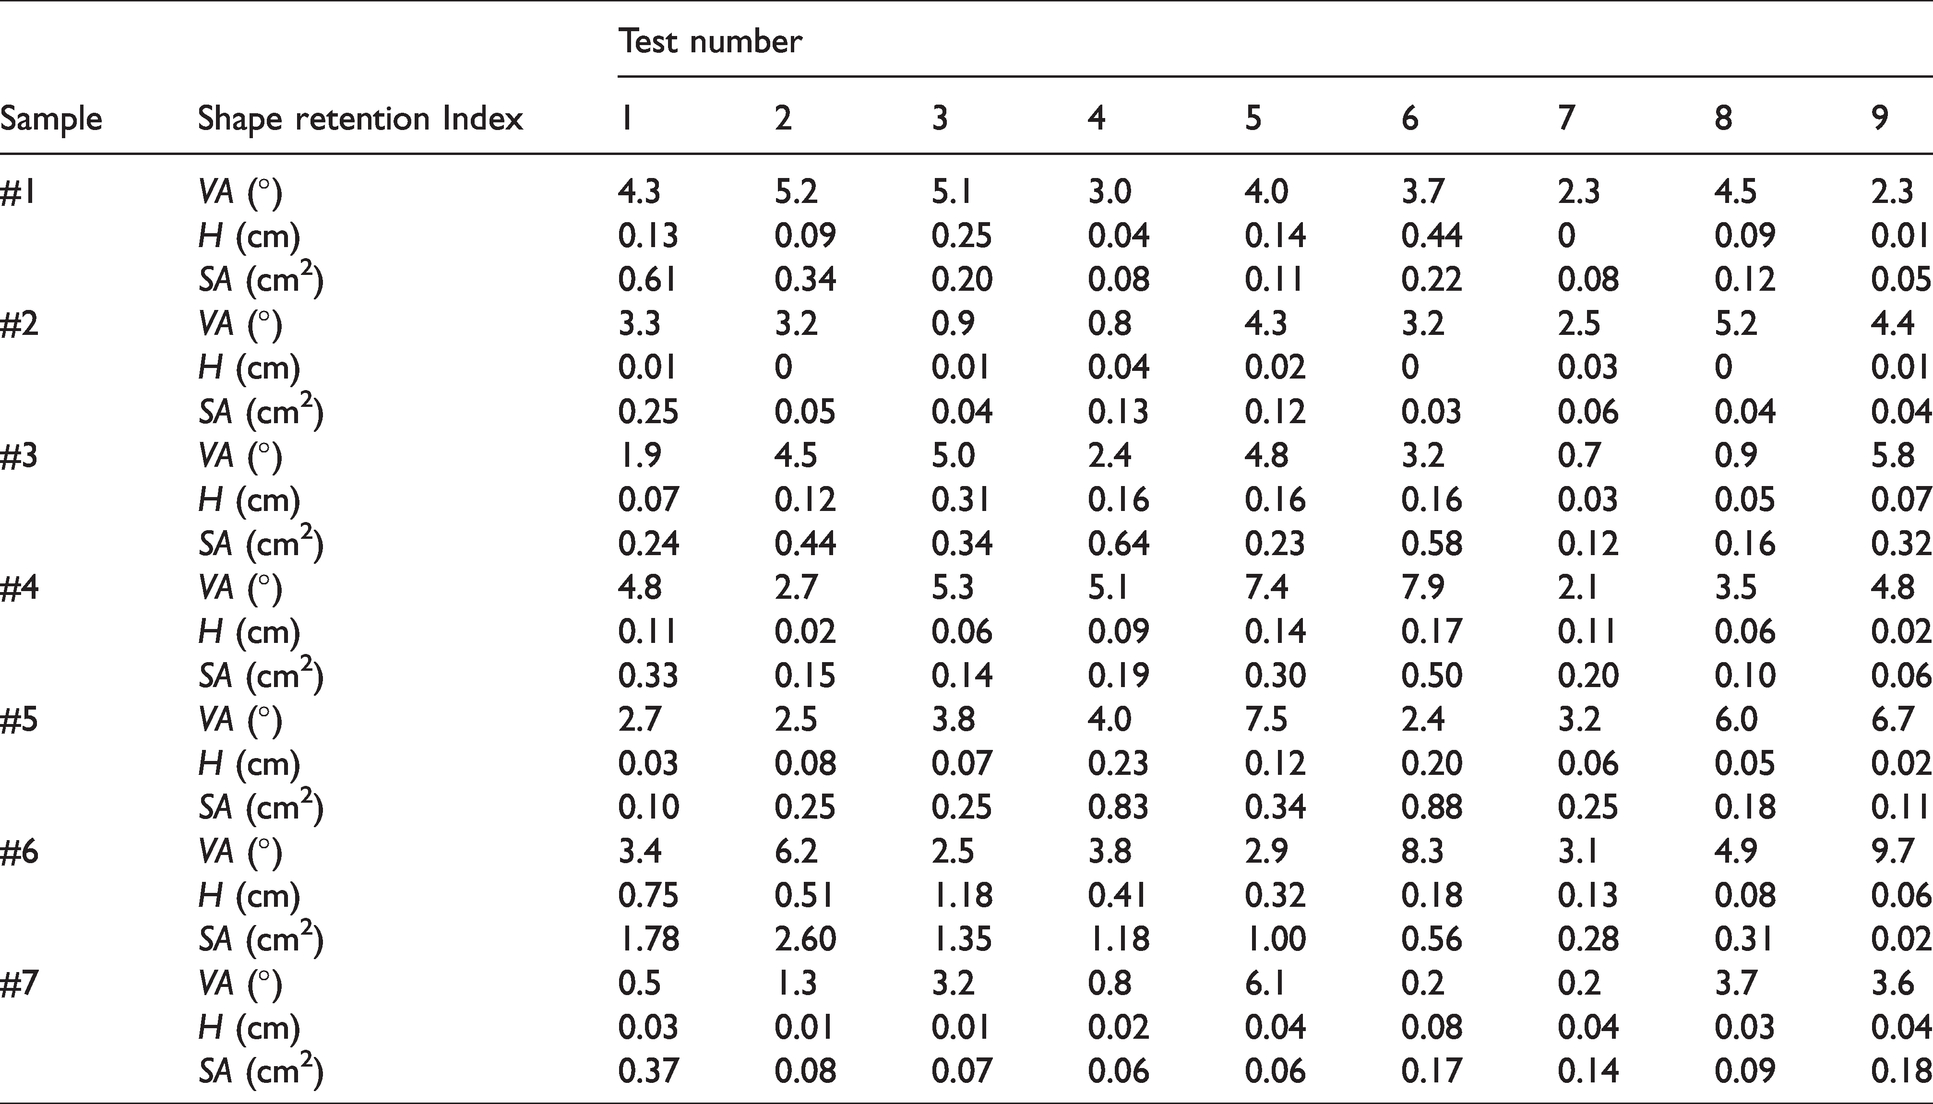
In Table 5, the maximum SD of the VA, H, and SA of the samples are all the results of Sample #6, which are 9.7°, 1.18cm, and 2.60cm2, respectively. Sample #2 and Sample #7 contain wool fiber which presents a large fast-elasticity recovery rate and a small slow-elasticity recovery rate. Thus, the creases of Sample #2 and Sample #7 can be recovered in a short time. The shape retention indexes of the rest of the samples can maintain good stability for different test schemes.
For each test scheme, the average SDVA and average SDSA of all samples and the Score are shown in Table 6.
Results of the orthogonal test
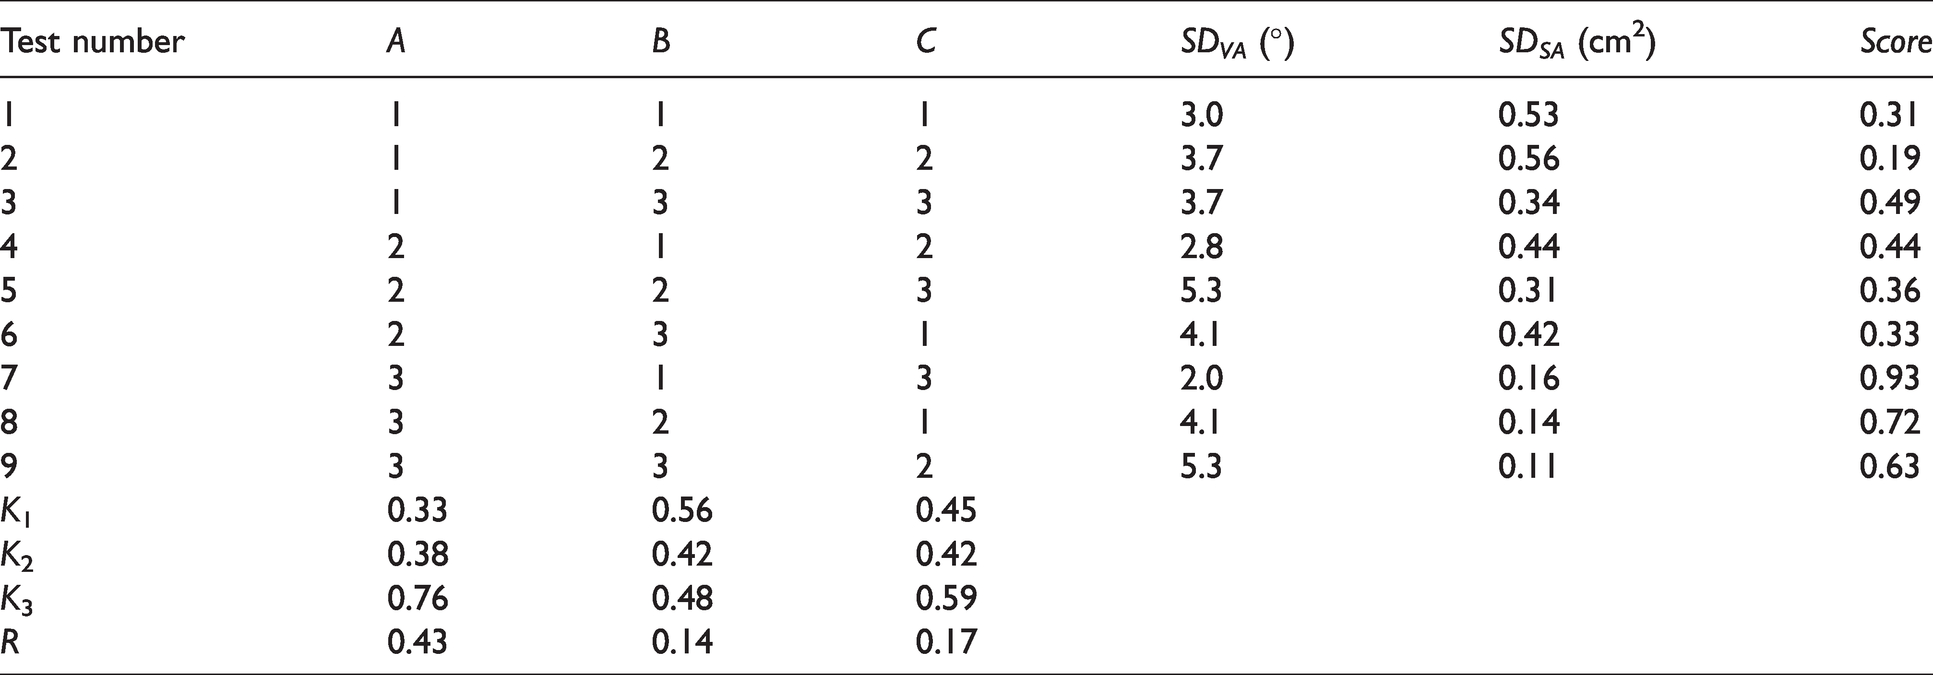
In Table 6, the Ki value of factor j represents the average of the Score of factor j at level i. For the same factor, the larger the K value is, the higher Score of the level. The R value of factor j is the range of the K value of factor j at three levels. For three factors, the larger the R value is, the greater influence of this factor on the test results. By comparing the R value of three factors, the effect of the factors on the shape retention index detection is ranked as A>C>B. By comparing the K value at three levels of the same factor, the effect of the levels for each factor on the test results are ranked as A3>A2>A1, B1>B3>B2, C3>C1>C2.
In the crease recovery stage, the sample can naturally unfold the crease by gravity. The smaller the sample is, the worse the stability of the test results is. When the pressure is small, the yarns in the fabric can produce the fast-elasticity deformation and the slow-elasticity deformation. When the pressure time is too long, the yarns in the fabric can produce stress relaxation. Thus, it is not easy to recover the creases for fabrics and the stability of the test results decreases.
The orthogonal test results using ANOVA are shown in Table 7.
ANOVA of the orthogonal test results

In Table 7, the Type III Sum of Squares value reflects the degree of dispersion and concentration of the data. The larger the Type III Sum of Squares value is, the more discrete the data is, and the smaller the Type III Sum of Squares value is, the more centralized the data is. The df value is the number of levels minus one that reflects the degree of freedom of the Type III Sum of Squares. The Mean Squares is the ratio of the Type III Sum of Squares to the df. The Mean Squares are used to reasonably compare the degree of dispersion and concentration between data with different numbers. The F value is the ratio of the Mean Square value of the factor to the Mean Square value of the error. According to the F-distribution table, when the df value of the factor is two and the df value of the error is two, the critical F value is 19.00 at 95% confidence interval and the critical F value is 9.00 at 90% confidence interval. The significance of the effect of factors on the results can be known by comparing the F value of factors with the critical F value at different confidence intervals. Thus, the sample size (A) can affect the stability of the shape retention index detection (Sig.< 0.1, 9.00 < FA < 19.00) that the confidence interval is 90%, while the pressure time (B) and pressure (C) have no significant influence (FB < 9.00, Fc < 9.00). Considering the time saving and convenience of operation, the optimal scheme of the orthogonal test is A3B1C3, where the sample size is 30cm × 30cm, the pressure time is 60s, and the pressure is 40N. Because the optimal scheme A3B1C3 is in the orthogonal test design table, it is not needed to verify the test results. The results show that the SDVA is 2.0°, the SDH is 0.06cm, the SDSA is 0.16cm2, and the Score is 0.93. The result is stable and reliable.
Conclusions
In the previous study, the automated crease recovery testing method based on image processing technology was used to evaluate fabric shape retention performance. On the basis of this method, the orthogonal test method was used to further explore the effect of sample size, pressure, and pressure time on the stability of fabric shape retention index detection. The SDs of the shape retention indexes were taken as the criteria for evaluating fabric shape retention stability. The extreme difference standardization method and the variation coefficient method were applied to calculate scores of test schemes. By comparing the comprehensive score of all test schemes, the optimal test scheme was selected where the sample size is 30 cm × 30 cm, the pressure time is 60s, and the pressure is 40N. The results of the optimal test scheme show that the VA SD is 2.0°, the H SD is 0.06cm, the SA SD is 0.16cm2, and the comprehensive score is 0.93. The test method with optimal parameters can steadily extract shape retention indexes and accurately evaluate fabric shape retention performance. Research will continue on the dynamic detection of fabric shape retention indexes by using optimal test parameters.
Footnotes
Declaration of conflicting interests
The authors declared no potential conflicts of interest with respect to the research, authorship, and/or publication of this article.
Funding
The authors disclosed receipt of the following financial support for the research, authorship, and/or publication of this article: This work was supported by Textile Vision Science & Education Foundation J202109, the National Natural Science Foundation of China (grant number 61802152).
