



Abstract
The structure of nonwovens gives special functions, and the establishment of the structure model has important reference significance for the realization of functions. In this work, the two-dimensional configuration of polyester fibers in a spunlaced nonwoven fabric was extracted, and the configurational feature points of 2500 fibers were obtained. Combined with the generative adversarial nets algorithm, the generation model of the two-dimensional configuration of fibers was proposed after learning the configuration feature of 2500 fibers. Based on the assumption that the fibers are randomly distributed in the nonwoven fabric, we established a three-dimensional model of the spunlaced nonwoven fabric on the fiber scale using ABAQUS software. In addition, the water diffusion experiment and simulation were carried out to visualize the diffusion process of a water droplet in the nonwoven fabric, verifying the accuracy of the model. This method provides a novel idea for the modeling of textile structure on the fiber scale, which can be regarded as a model basis for the subsequent simulation analysis and function research.
Forming of the nonwovens is a kind of rapid prototyping method which can process fiber networks to form a fiber entanglement structure with certain strength directly. The common processing methods of nonwovens include mechanical, thermal bonding, or chemical methods. In addition to being used in clothing textiles, more functional fibers can also be added to prepare the materials with different functions. Filtration separation material,1–5 biomedical, 6 reinforcement material, 7 adsorption field, 8 and energy utilization 9 were involved. In these applications, the structure of nonwovens is the most critical factor, and the pores and mechanical properties formed by fiber entanglement make it widely used.
In early research, most scholars focused on the forming process and physical properties, and the characterization of fiber configuration and entanglement form is the key object. Hearle and Stevenson 10 systematically studied the anisotropy of nonwovens from the aspects of modulus, strength, elongation at break, and fiber orientation, and provided a systematic theoretical basis for the performance research of nonwovens. Also researchers11,12 have studied the forming process and the interaction between fibers in detail. Pourdeyhimi and colleagues13–15 conducted a series of works on the characterization of fiber orientation using simulation analysis and tracer analysis, and systematically described the structural characteristics of nonwoven fabric. Britton and Sampson16,17 established a two-dimensional nonwoven model and analyzed the physical properties of the model through computer simulation. In addition, image analysis technology was also used to measure the structural characteristics of fibers and fiber segments in nonwovens, and the length, thickness, curl, and orientation of fiber in nonwovens were characterized. 18 This research mainly studied the change of fiber configuration during the forming process and the final configuration of fibers in the nonwoven fabric. In terms of structural characterization, it is of great significance, but the studies were mostly based on the analysis of single cross-sectional figures, which were unable to realize the connection of different cross-sections. In the process of obtaining the three-dimensional (3D) structure of nonwovens, the researchers also adopted many effective ways.
In the research on obtaining the 3D structure of nonwovens, the most important method is image acquisition. Many researchers usually use different types of image acquisition equipment to collect the 3D structure of various nonwovens. Digital volumetric imaging technology19,20 was often used to extrude the 3D structure of the nonwoven fabric, and the gas permeation properties were also deeply studied combined with the computational fluid dynamics method. In addition, Jeon et al. 21 established a 3D model of nonwovens based on X-ray technology, and systematically characterized the changes of fiber configuration in the process of nonwoven stretching. Besides this, Faessel et al. 22 also selected the X-ray method to build fiber networks in low-density fiberboards. Then, the random distribution model of the fiber was established, and the effects of fiber bending, adhesion, and friction on the tensile mechanics were analyzed. This study provided a new idea for the structural analysis of low-density fibrous materials. However, the lack of equipment accuracy limits the application of technology when facing the acquisition of some closely arranged structures and the structures with a microfiber scale.
Besides this, to acquire the 3D structure precisely, some researchers focused on the research and expansion of algorithms. Wang et al. 23 collected several groups of images with different depths of field from the same perspective of nonwoven fabric, and the reconstructed image corrected the unfocused fiber to obtain the nonwoven fabric structure with thickness information. However, with this algorithm, the field of vision of the 3D structure is smaller, and the interference between the fibers in different regions will affect the accuracy of the structure. Without using image acquisition tools and equipment, Shi et al. 24 used the random seed method to construct a 3D model of fibrous assembly material which is similar to a nonwoven fabric, and also studied the influencing factors of mechanical properties. But the configuration of the individual fiber was not considered.
Combined with the above analysis, in this study, 2500 fibers in a spunlaced nonwoven fabric were extracted, and a dataset of fiber configuration was established. On this basis, the generative adversarial nets (GAN) algorithm was selected to realize the generation model of fiber configuration. A certain number of individual fibers with fiber configuration features were generated, and the fiber network was constructed by the random distribution of individual fibers in a certain space. Subsequently, the finite element simulation was used to compress the generated fiber network model and realize the structure construction of the spunlaced nonwovens. Finally, the accuracy of the 3D structure of nonwovens was verified by a water drop diffusion simulation and experiment.
The construction method of the model
The nonwoven forming method is to process the fibrous assembly directly into a network structure through physical or chemical treatment. Taking spunlaced nonwoven material as the example, its forming process is to machine a specific form of fiber network through water jet puncture, which can promote fibers to entangle with each other, and friction self-locking between fibers gives it enough strength. The production process is a kind of physical mechanical forming with mass contact and collision. If the 3D structure of the nonwoven fabric is simulated by following this real process, it needs to involve numerous interactions between water and fibers as well as the continuous contact between the fibers, which also must consider the damage and large geometric deformation of the fiber. The simulation process will be too complex and the calculation is huge. For this reason, in this paper, we proposed a new model simplification scheme for the construction of the nonwoven model.
The configuration of fibers in the nonwoven materials is various, and the fiber bulking data cannot be listed one by one. Therefore, it is necessary to obtain the configurational characteristics of all the fibers. Based on this thought, we established the 3D model of the nonwoven structure by characterizing the buckling configuration regularity of fibers, and the process is shown in Figure 1.
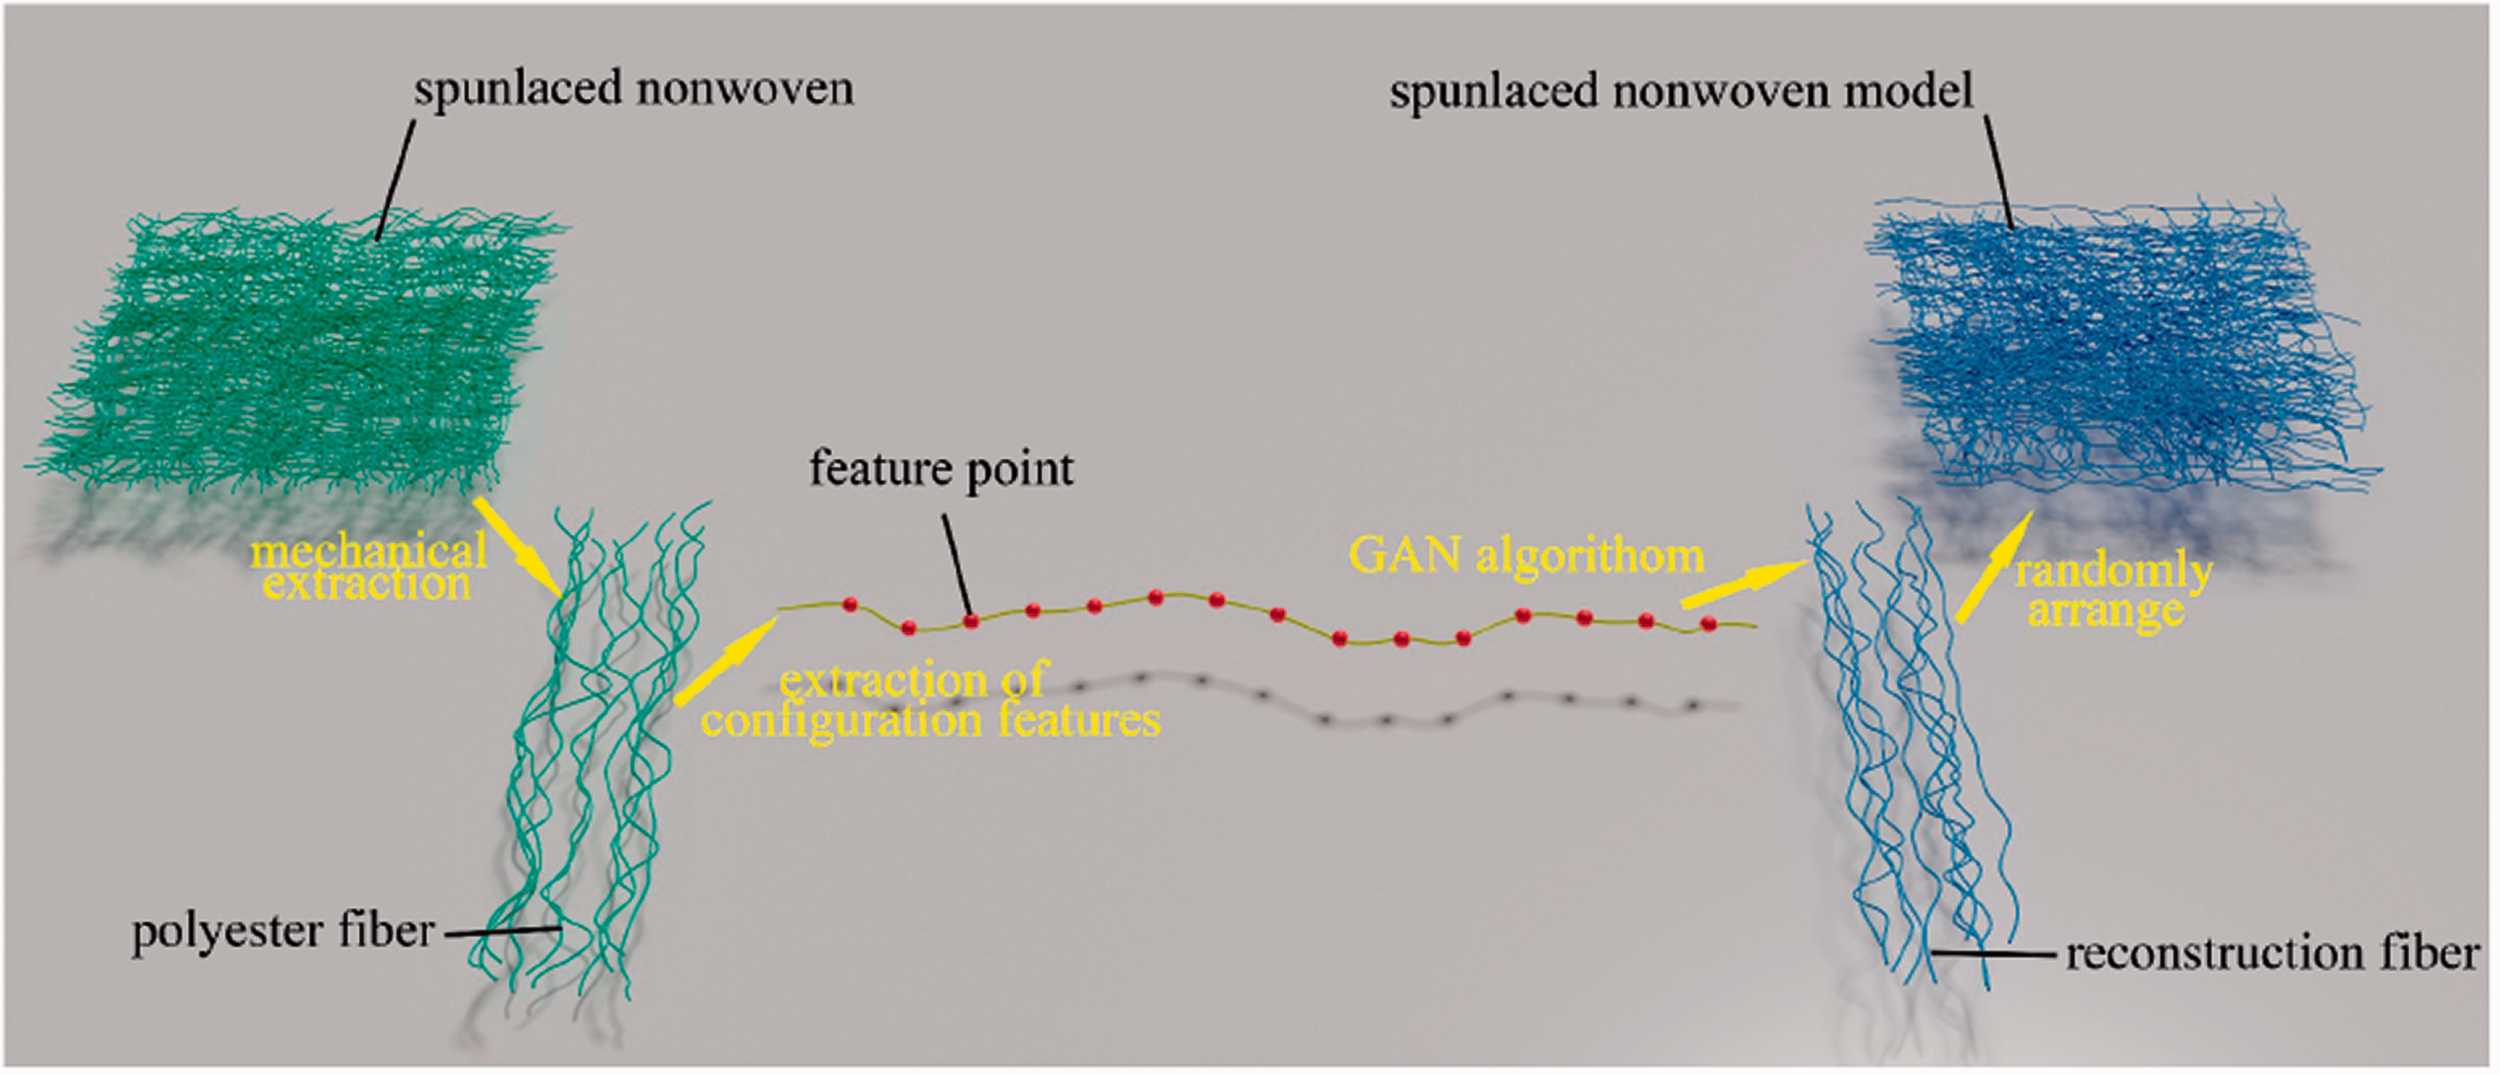
The scheme of the nonwoven fabric modeling.
First, a fixed number of individual fibers in the nonwovens were extracted one by one to collect their configuration data which can express the bulking state of the fiber. Then, the GAN algorithm was used to learn and characterize the configurational characteristics of all the fibers. Subsequently, the new individual fiber model was generated based on the trained GAN algorithm. Finally, according to the hypothesis of fiber random distribution in the nonwoven fabric, the virtual fibers with real fiber configuration characteristics were rearranged and assembled into the nonwoven model on the fiber scale.
It should be emphasized that the fiber cannot be extracted through a noncontact method from the nonwovens, so the change of fiber configuration caused by the external force during fiber extraction was ignored. Meanwhile, it is considered that the distribution of fibers in the nonwoven fabrics is random in any area, and in the virtual model, we randomly distributed the center of gravity of the fibers.
Configuration characterization of individual fiber
Image acquisition and processing
In the acquisition process of the fiber image, we separated the individual fibers mechanically from the spunlaced nonwoven fabric, and used an optical microscope to collect the longitudinal configuration image of the fibers (Figure 2(a)). Subsequently, the fiber direction was adjusted (Figure 2(b)), and the process of threshold segmentation was carried out (Figure 2(c)). Furthermore, the noise of the fiber image was removed (Figure 2(d)). Finally, we obtained the final configurational image (Figure 2(e)) through enhancing the vision and compensating for the lack of information artificially caused by the precision of the optical microscope and image processing error.
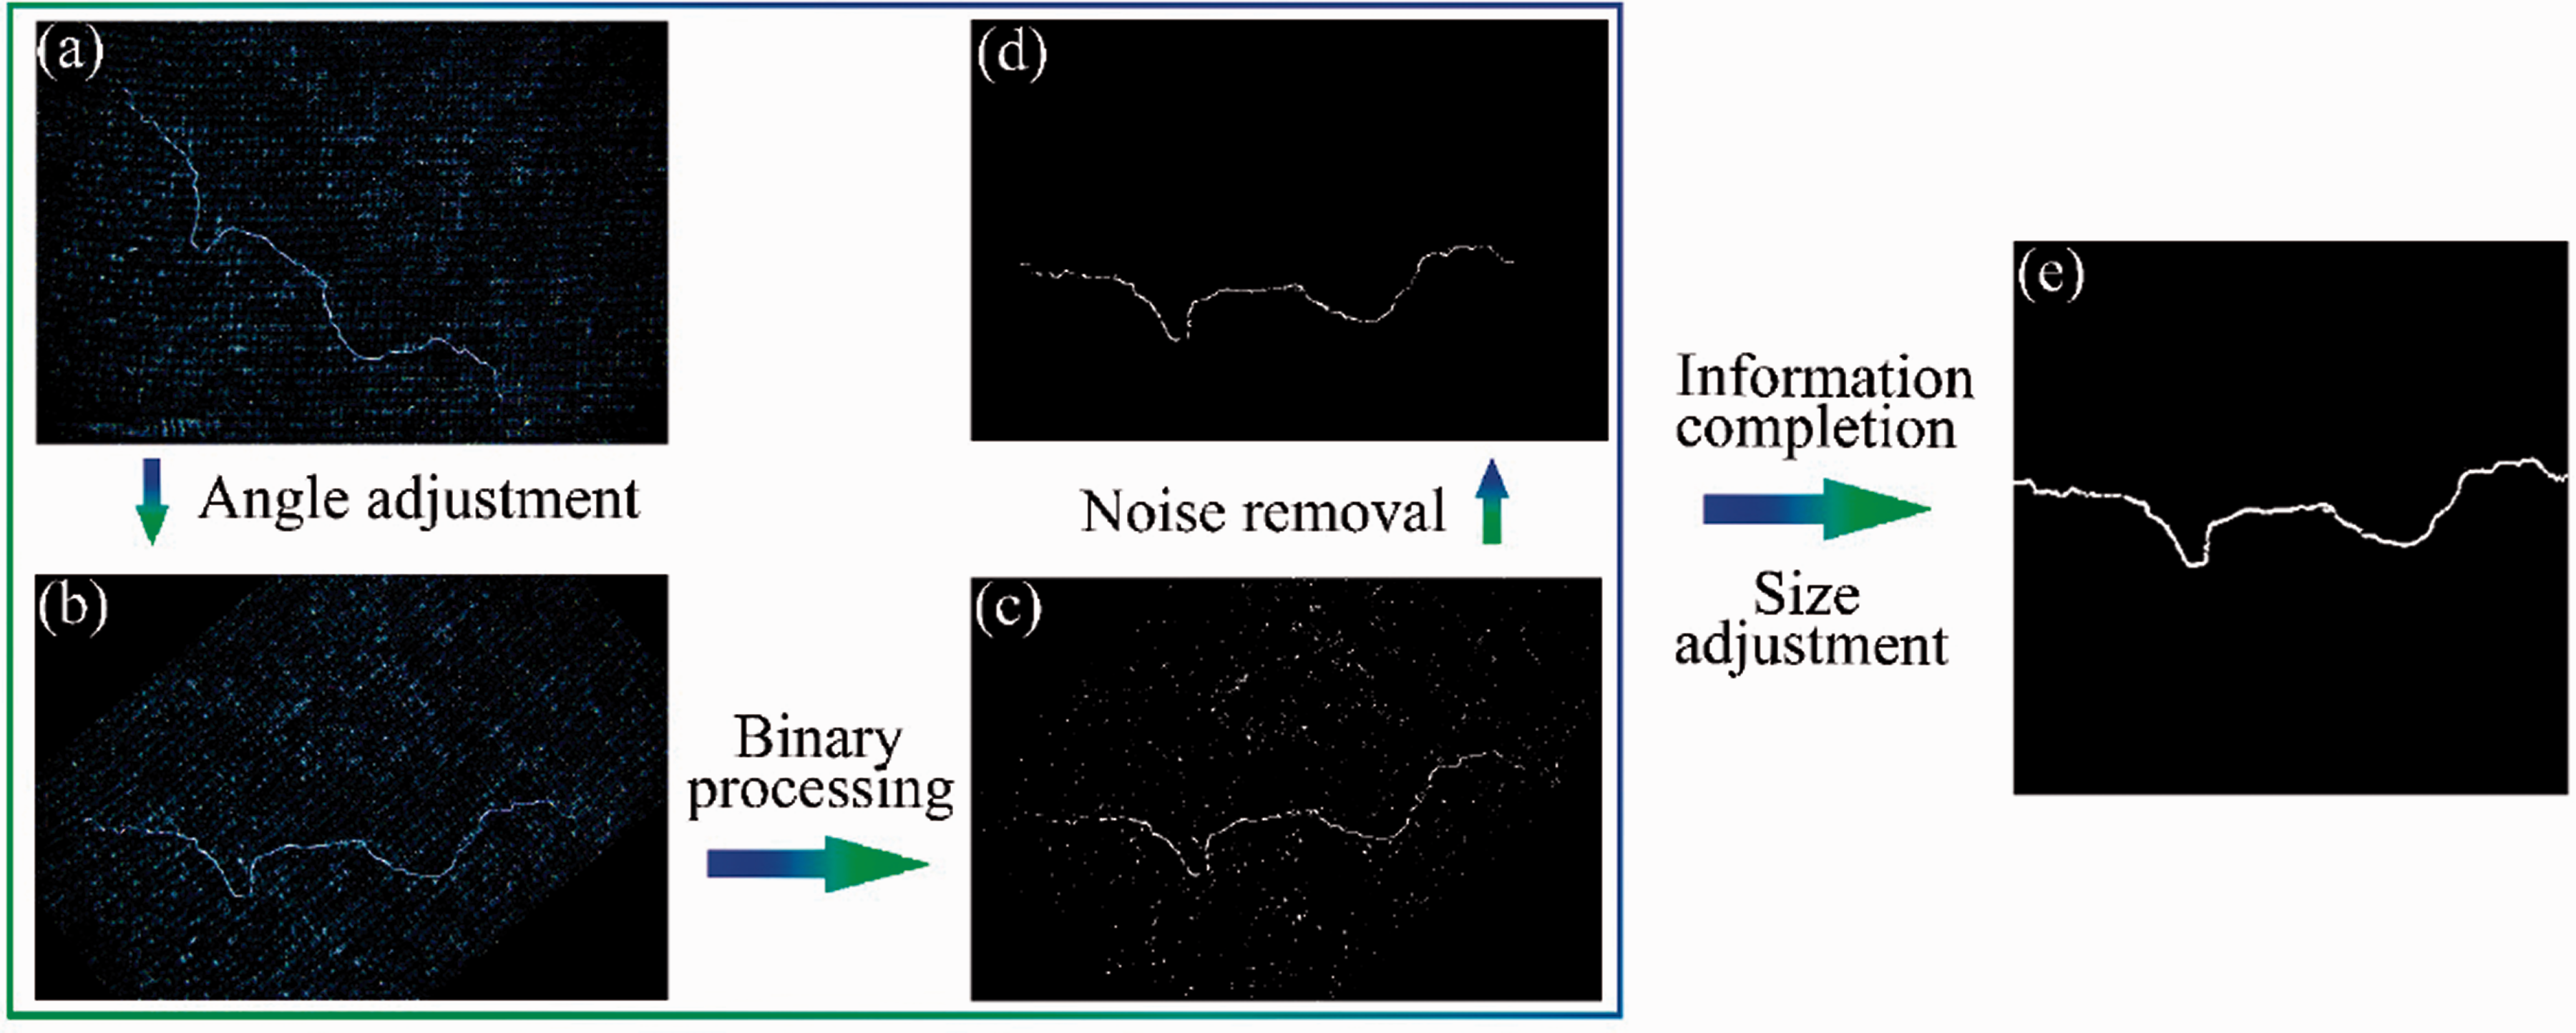
Image processing of fiber configuration.
For convenient processing, the image in Figure 2(e) was cropped and zoomed to an image of 300 × 300 pixels, and the processed image retains the key information of fiber configuration of the original image and can be used for further data extraction.
After preprocessing of fiber images, the area occupied by the individual fiber in the image is very small, and most areas of the image are redundant information. If this image is directly used for the GAN algorithm, it not only contains too much invalid information but also will lead to a dramatic increase in the number of individual fiber samples. Therefore, to reduce the calculation, only the fiber configurational feature value was extracted. Meanwhile, given that the dimension of the fiber image is too large compared with the number of samples, 15 feature points of individual fibers were extracted as input data. It must be mentioned that, while reducing the sample number and calculation, the method of information extraction sacrificed the accuracy of fiber configuration. The matrix form used to characterize the configurational characteristics of individual fiber is shown in equation 1.

Figure 3 shows the extraction processing of an individual fiber configuration feature, the processed image is placed in the rectangular coordinate system, and it can be converted into a grey matrix with a size of 300 × 300 pixels. Starting from the 10th column, we extracted one column of matrix data every 20 columns, and 15 groups of data were extracted in one fiber. The number of selected columns is recorded as Xn (where n = 1, 2 … 15, Xn = 10, 30, 50 … 290). For each Xn, there is an ordinate that can be obtained on the fiber, which is recorded as Yn (where n = 0, 1, 2 … 15, Yn can be any data from 0 to 299). If Yn took more than one data in the image, the average value of all data would be selected which is recorded as
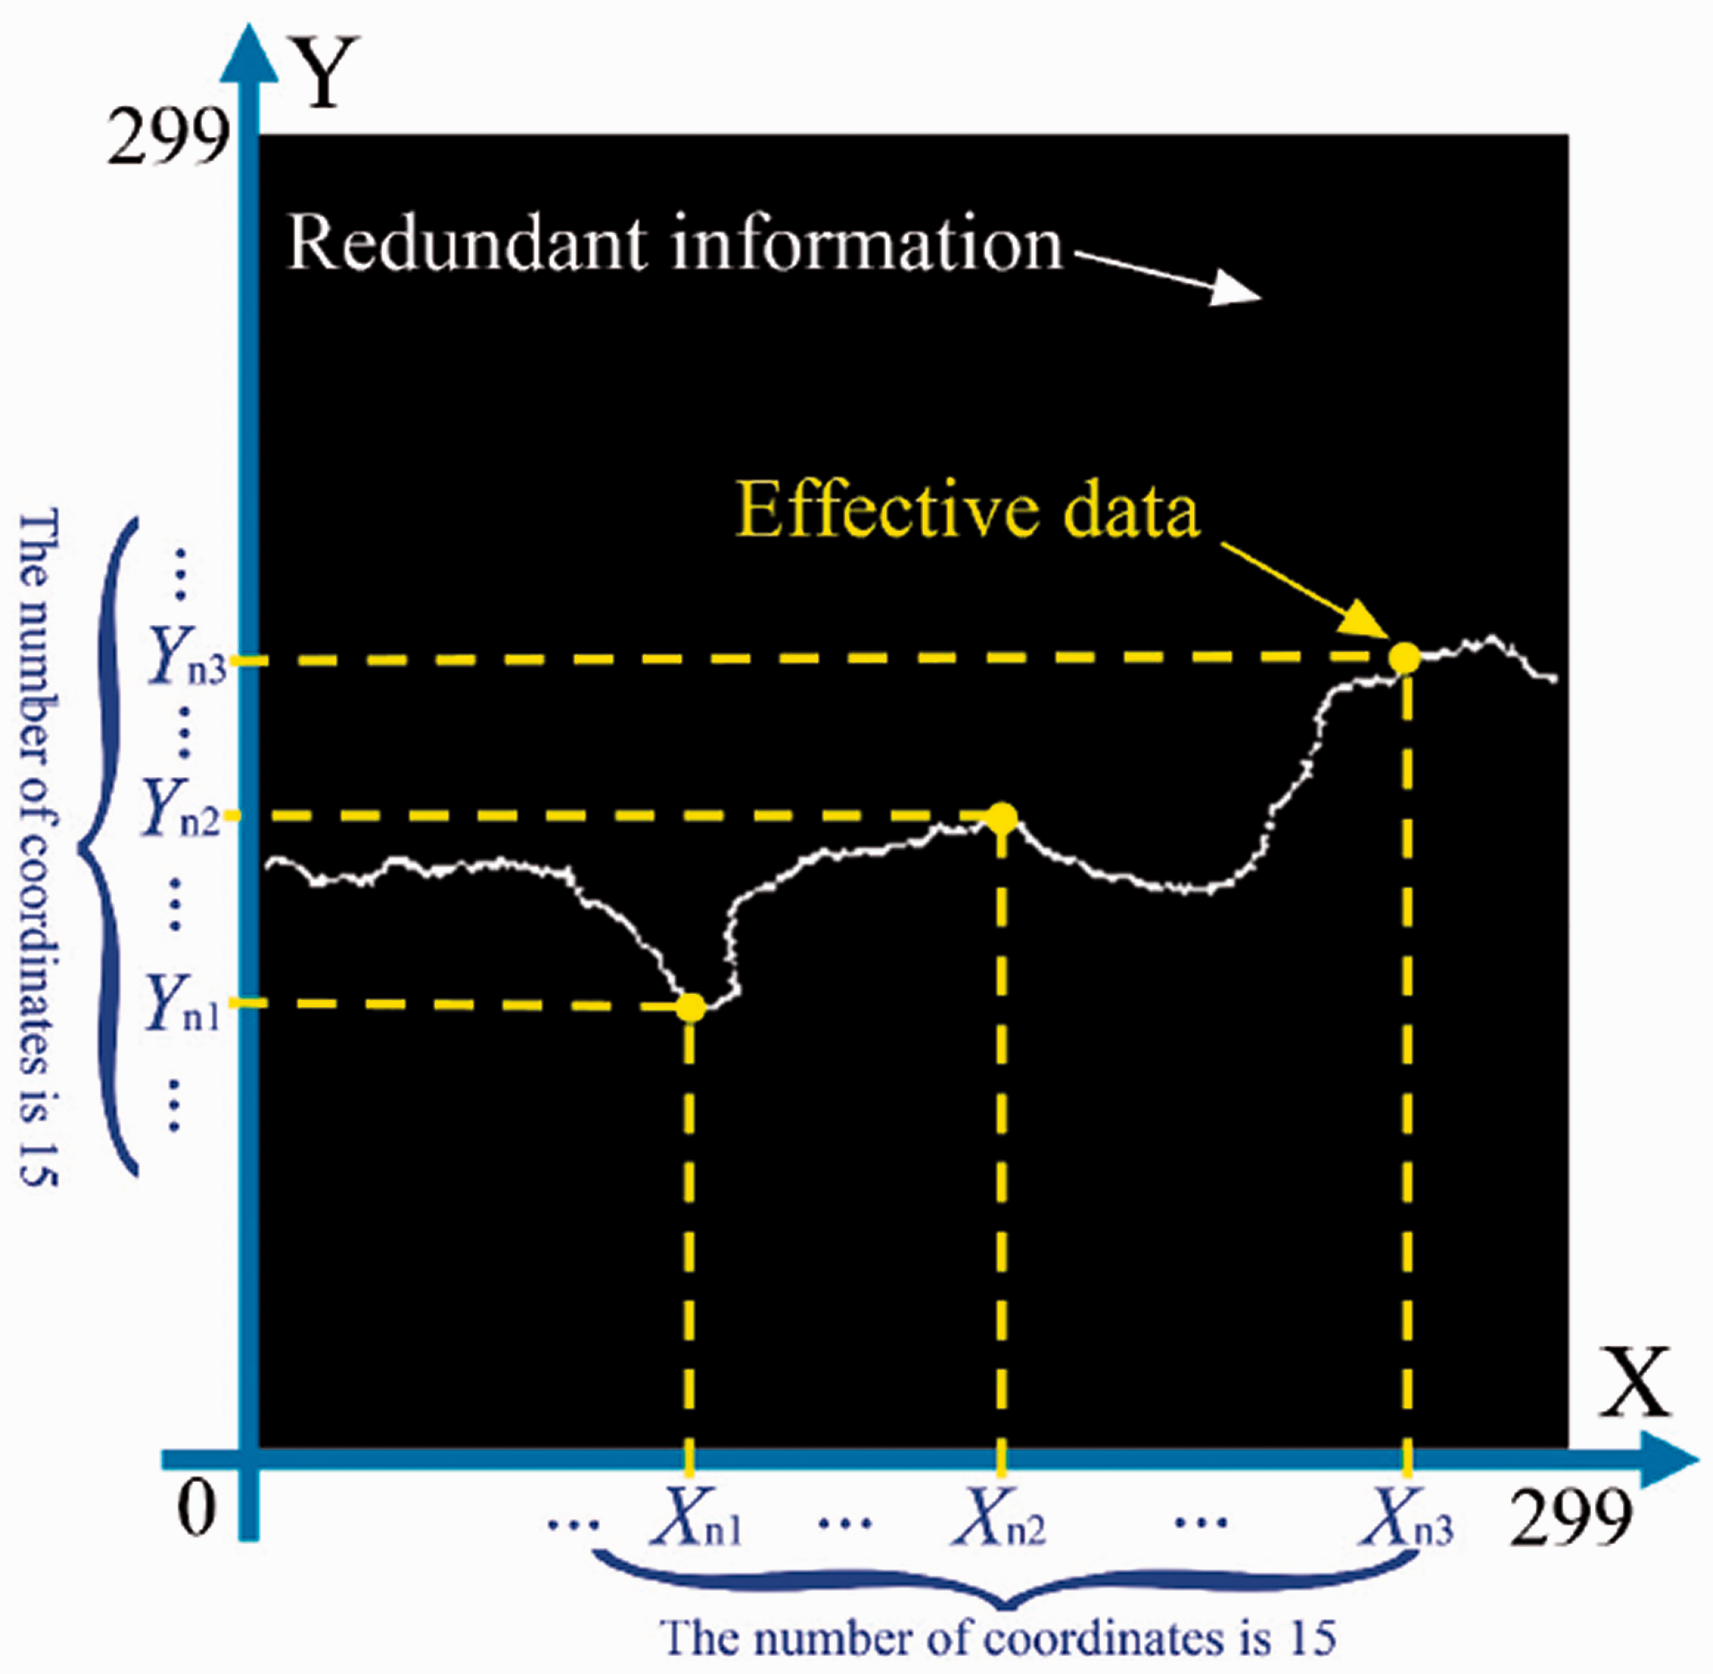
The feature points extraction of the fiber configuration.
The implementation of the GAN algorithm
The GAN algorithm is a kind of deep learning algorithm, which makes it achieve effective data distribution through the game of the generative network and discriminant network. It was first proposed by Goodfellow et al.,
25
and now it has been widely used in the field of data generation. The core of the algorithm is shown as equation 2.

Based on the principle of the GAN algorithm, a generation model for fiber configuration reconstruction was established, and the implementation process of the GAN algorithm is shown in Figure 4.

Principle of fiber configuration reconstruction.
A total of 2500 groups of fiber configuration data obtained are taken as the input real data of the algorithm, and there is also a generator that can generate fake fiber configuration. In the initial stage, the generator could only generate fiber configuration data randomly, while the discriminator in the initial stage also could not distinguish the real fiber configuration data from the generated data. With the continuous optimization of the algorithm, the performance of the discriminator was improved, which can better distinguish the real fiber data; meanwhile, the generator was also continuously optimized to generate the fiber configuration feature data closer to the real fiber. The details of the GAN algorithm are shown as follows. The batch size chosen is 64, and the number of the epoch is 24. The learning rate for generator and discriminator is 0.0001. The selected activation function is ReLU, and the optimizer for generator and discriminator is Adam.
The configuration change and convergence of generated fibers are shown in Figure 5. The star point is the individual configuration feature data of the fiber, and each broken line represents the configuration of one fiber. For every five epochs, it drew the configuration of five fibers learned by the generator of the algorithm (Figure 5(a)). Figure 5(b) shows the standard deviation of the ordinate difference of fiber configuration feature points in different epochs, and the dotted line is a fitted curve. In order to show that the algorithm will tend to be stable, the standard deviation of fiber configuration in different stages was used as the judgment index. In the starting stage, the standard deviation ranges from 5 to 40, which shows that the algorithm already has great randomness. With the increase of the number of trained fiber configurations, the value of the fitted curve tends to converge stably to 18 (red line), exhibiting that the trained GAN algorithm can effectively and steadily output virtual fiber configuration. The configurations of an extracted and reconstructed fiber are shown in Figure 5(c), and we used the broken line segments to represent the fiber configuration. We found that the configuration characteristics of the generated fiber are not completely consistent with the real fiber, but the buckling characteristics are similar. This is because only the law of fiber configuration was learned from the real fibers, and the trained algorithm could generate new virtual fibers with similar characteristics law. Importantly, the discrimination probabilities of the discriminator for real fiber and generated fiber converge to 0.5 after great fluctuations (Figure 5(d)), which proved that the trained discriminator is difficult to distinguish the configuration of the generated fiber from that of the real fiber.
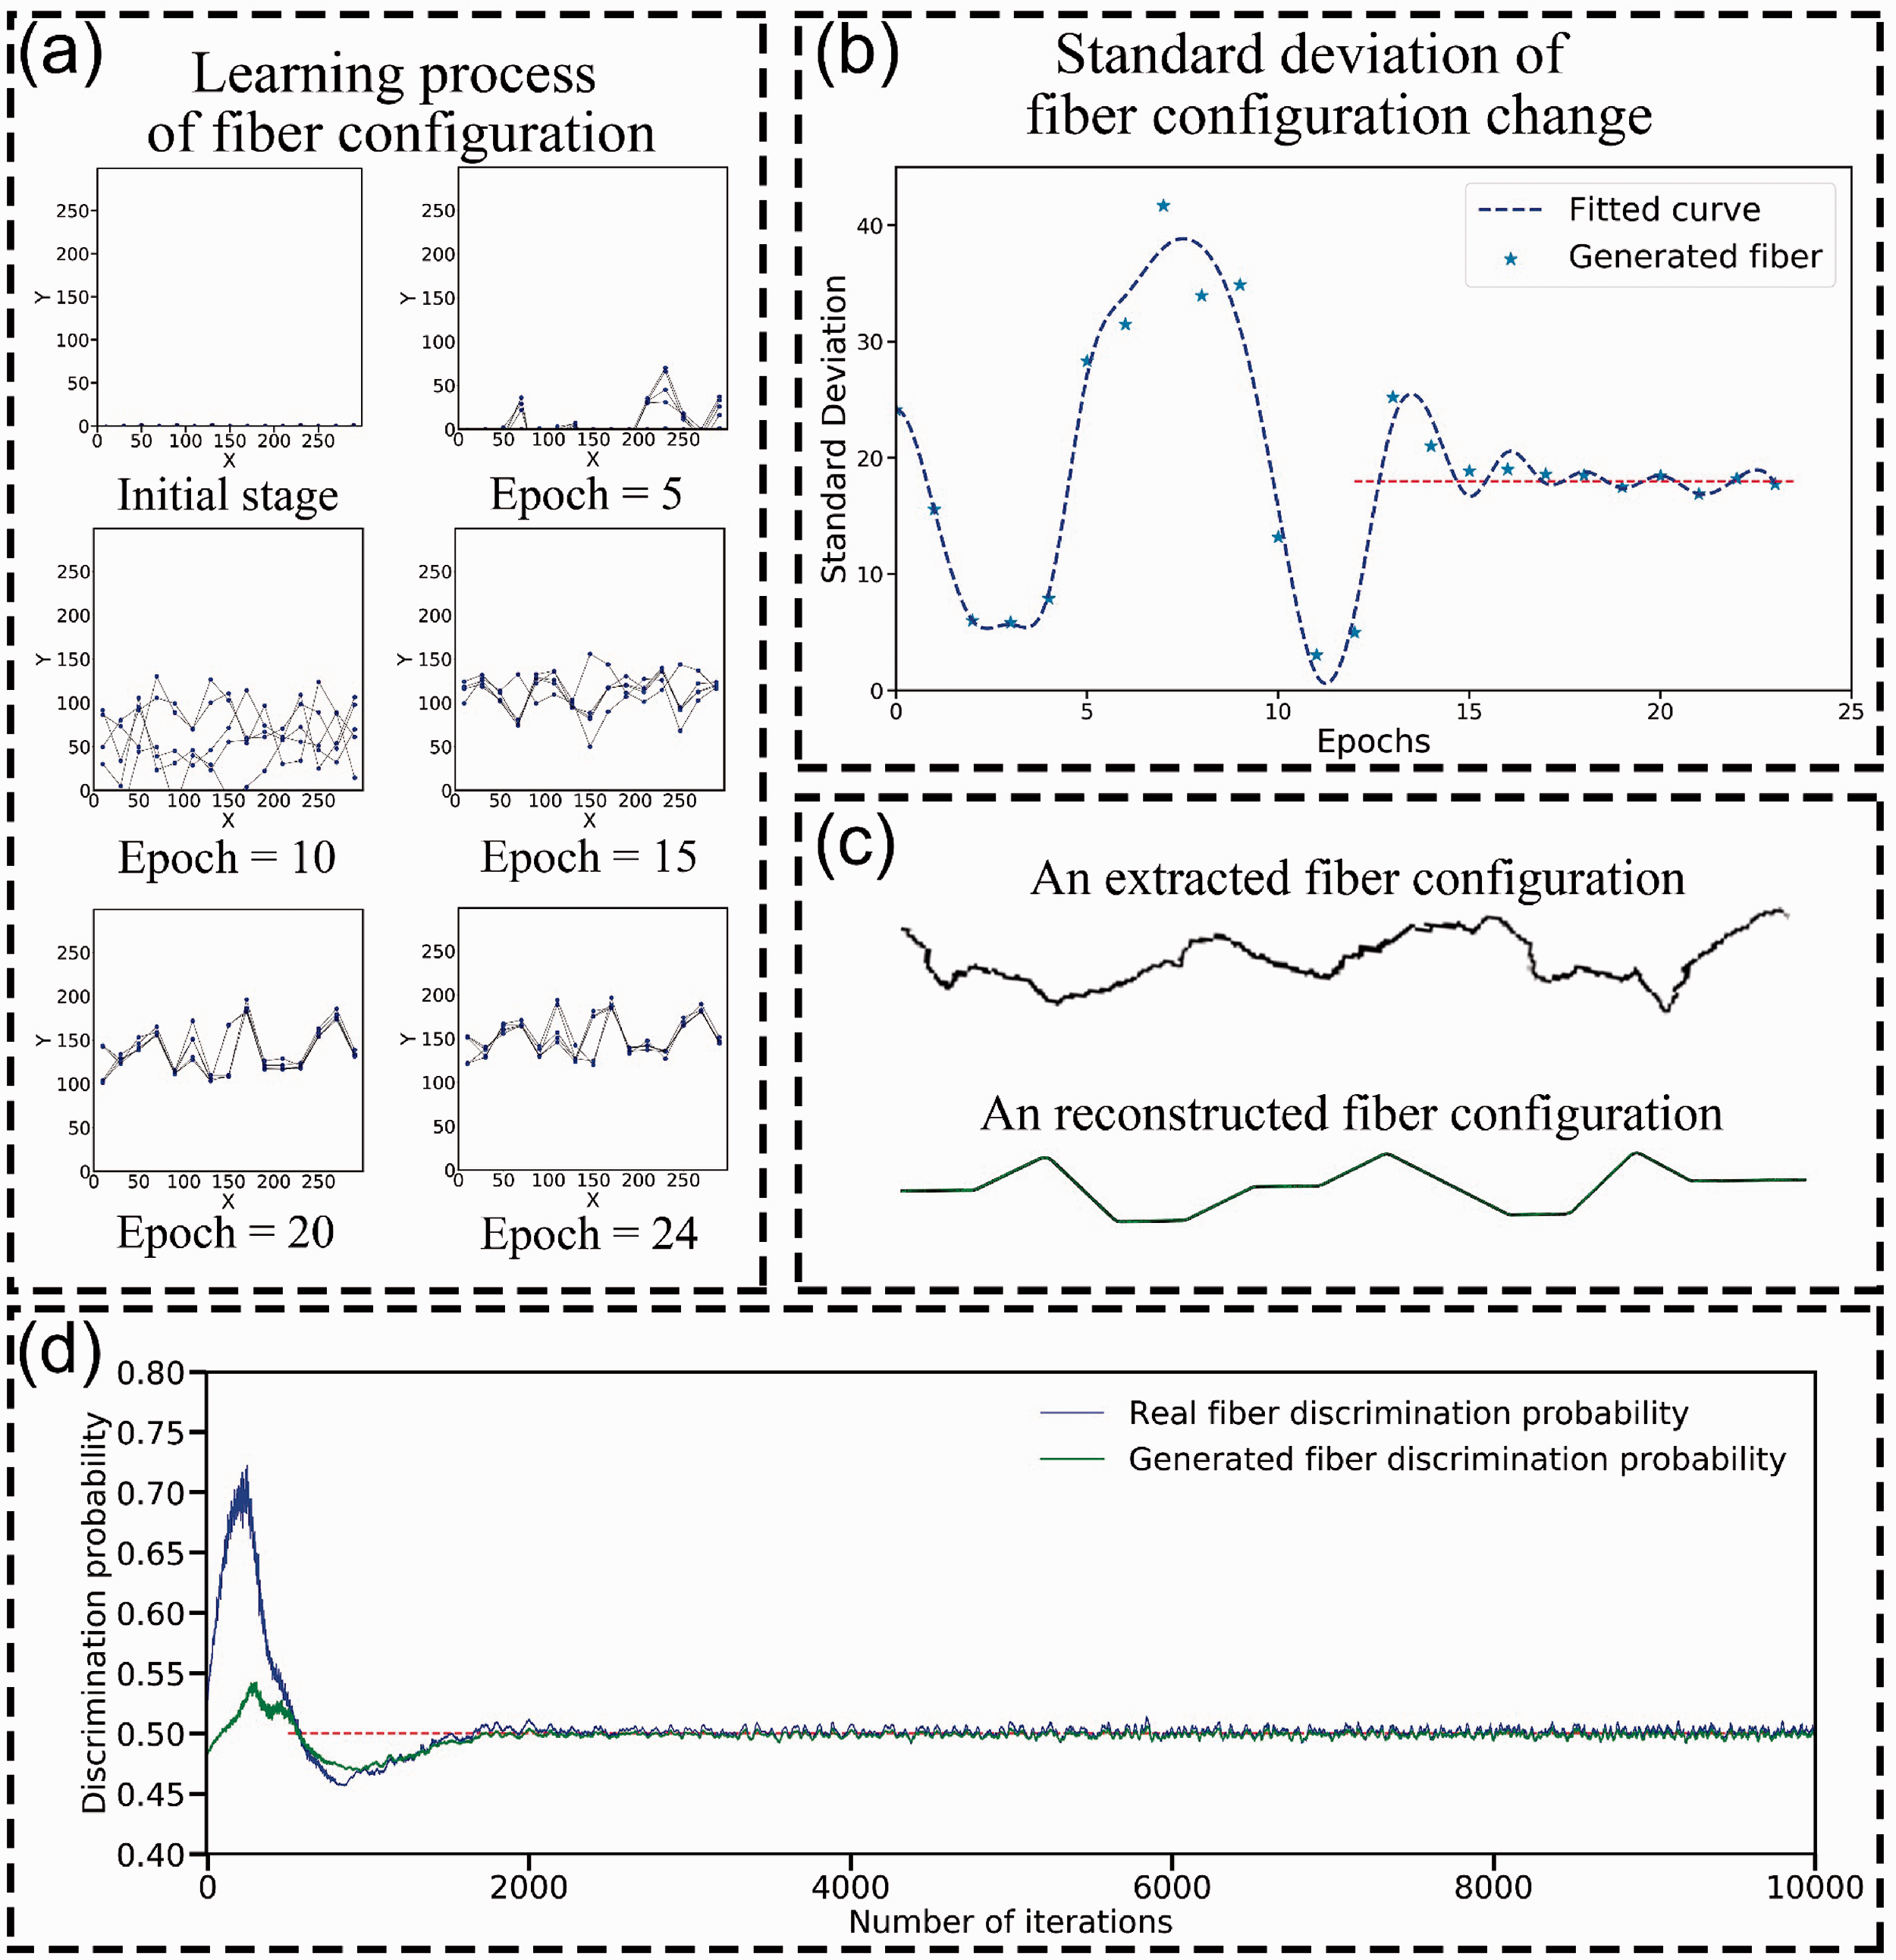
Verification of algorithm performance. (a) The learning process of fiber configuration during different epochs; (b) The standard deviation of the fiber configuration during different epochs; (c) An extracted fiber configuration and a reconstructed fiber configuration; (d) The discrimination probability of real fibers and generated fibers.
Establishment of the nonwoven structure model
Fiber network compression simulation
From the above, we knew that the new fiber configuration could be effectively characterized. The GAN algorithm could generate individual fiber configuration data, and the fiber solid model could be established in ABAQUS software. In this paper, the arrangement of fibers in the spunlaced nonwoven is regarded as random distribution, and the center of gravity of the fiber was taken as the distribution point. Meanwhile, the spunlaced nonwovens are formed by fiber entanglement, so there will be no melting between fibers, and there should also be no overlap between solid models of fibers in the software. To ensure that all fibers are nonoverlapping and reduce the calculation time, the initial thickness of the fiber network needs to be set greater than the final nonwoven model. By compressing the fiber network, we can generate the nonwoven fabric model.
In Figure 6(a), the cuboid frame is the distribution boundary of the center of gravity of all fibers. The gravities are set to be randomly distributed within the boundary. Figure 6(b) is the fiber network generated based on the GAN algorithm. In Figure 6(c), two plane fixtures are respectively set at the upper and lower ends of the fiber network model, and the lower fixture is fixed while the upper fixture is set to move closer to the lower fixture during compression simulation. Figure 6(e) shows the finite element simulation of the compression process by the Explicit module in ABAQUS 2017, the simulation process lasts 0.1 s. In addition, the parameters of the fiber are shown in Table 1 and the parameters related to the compression simulation are shown in Table 2.

Forming simulation of the spunlaced nonwoven structure. (a) The center of the gravity of each fiber generated randomly; (b) The fiber network model generated based on each center of gravity; (c) Position of two compression fixtures; (d) The morphology of the nonwoven structure compressed by two fixtures; (e) Compress simulation process of the fiber network; (f) Fiber friction entanglement due to compression process.
Parameters of the polyester fiber

Parameters of compression simulation

It can be seen from the analysis and simulation process that when T is 0.015 s, some bottom fibers fell and contacted with the lower figure due to gravity. When T is 0.035 s, numerous fibers contacted with the lower fixture, and there were also large amounts of contacts and collisions between fibers. At 0.065 s, all fibers accumulated in the lower fixture due to gravity, and the upper fixture contacted the top fibers at 0.080 s. When T=0.1 s, the upper fixture moved to the final position, the final morphology of the fiber network can be regarded as the 3D structure of a spunlaced nonwoven fabric. Figure 6(f) shows the initial position of the local fibers and the position after compression, and the compression behavior promotes the contact between the fibers and makes them form a fibrous assembly similar to the nonwoven structure.
Liquid water diffusion simulation and experiment
The fiber orientation in the spunlaced nonwoven fabric is usually anisotropy and results in the uniform distribution of pores between the fibers. In this study, we selected the liquid water diffusion experiment to verify the accuracy of the 3D structure of the spunlaced nonwoven fabric. The water drop diffusion simulation experiment is shown in Figure 7.
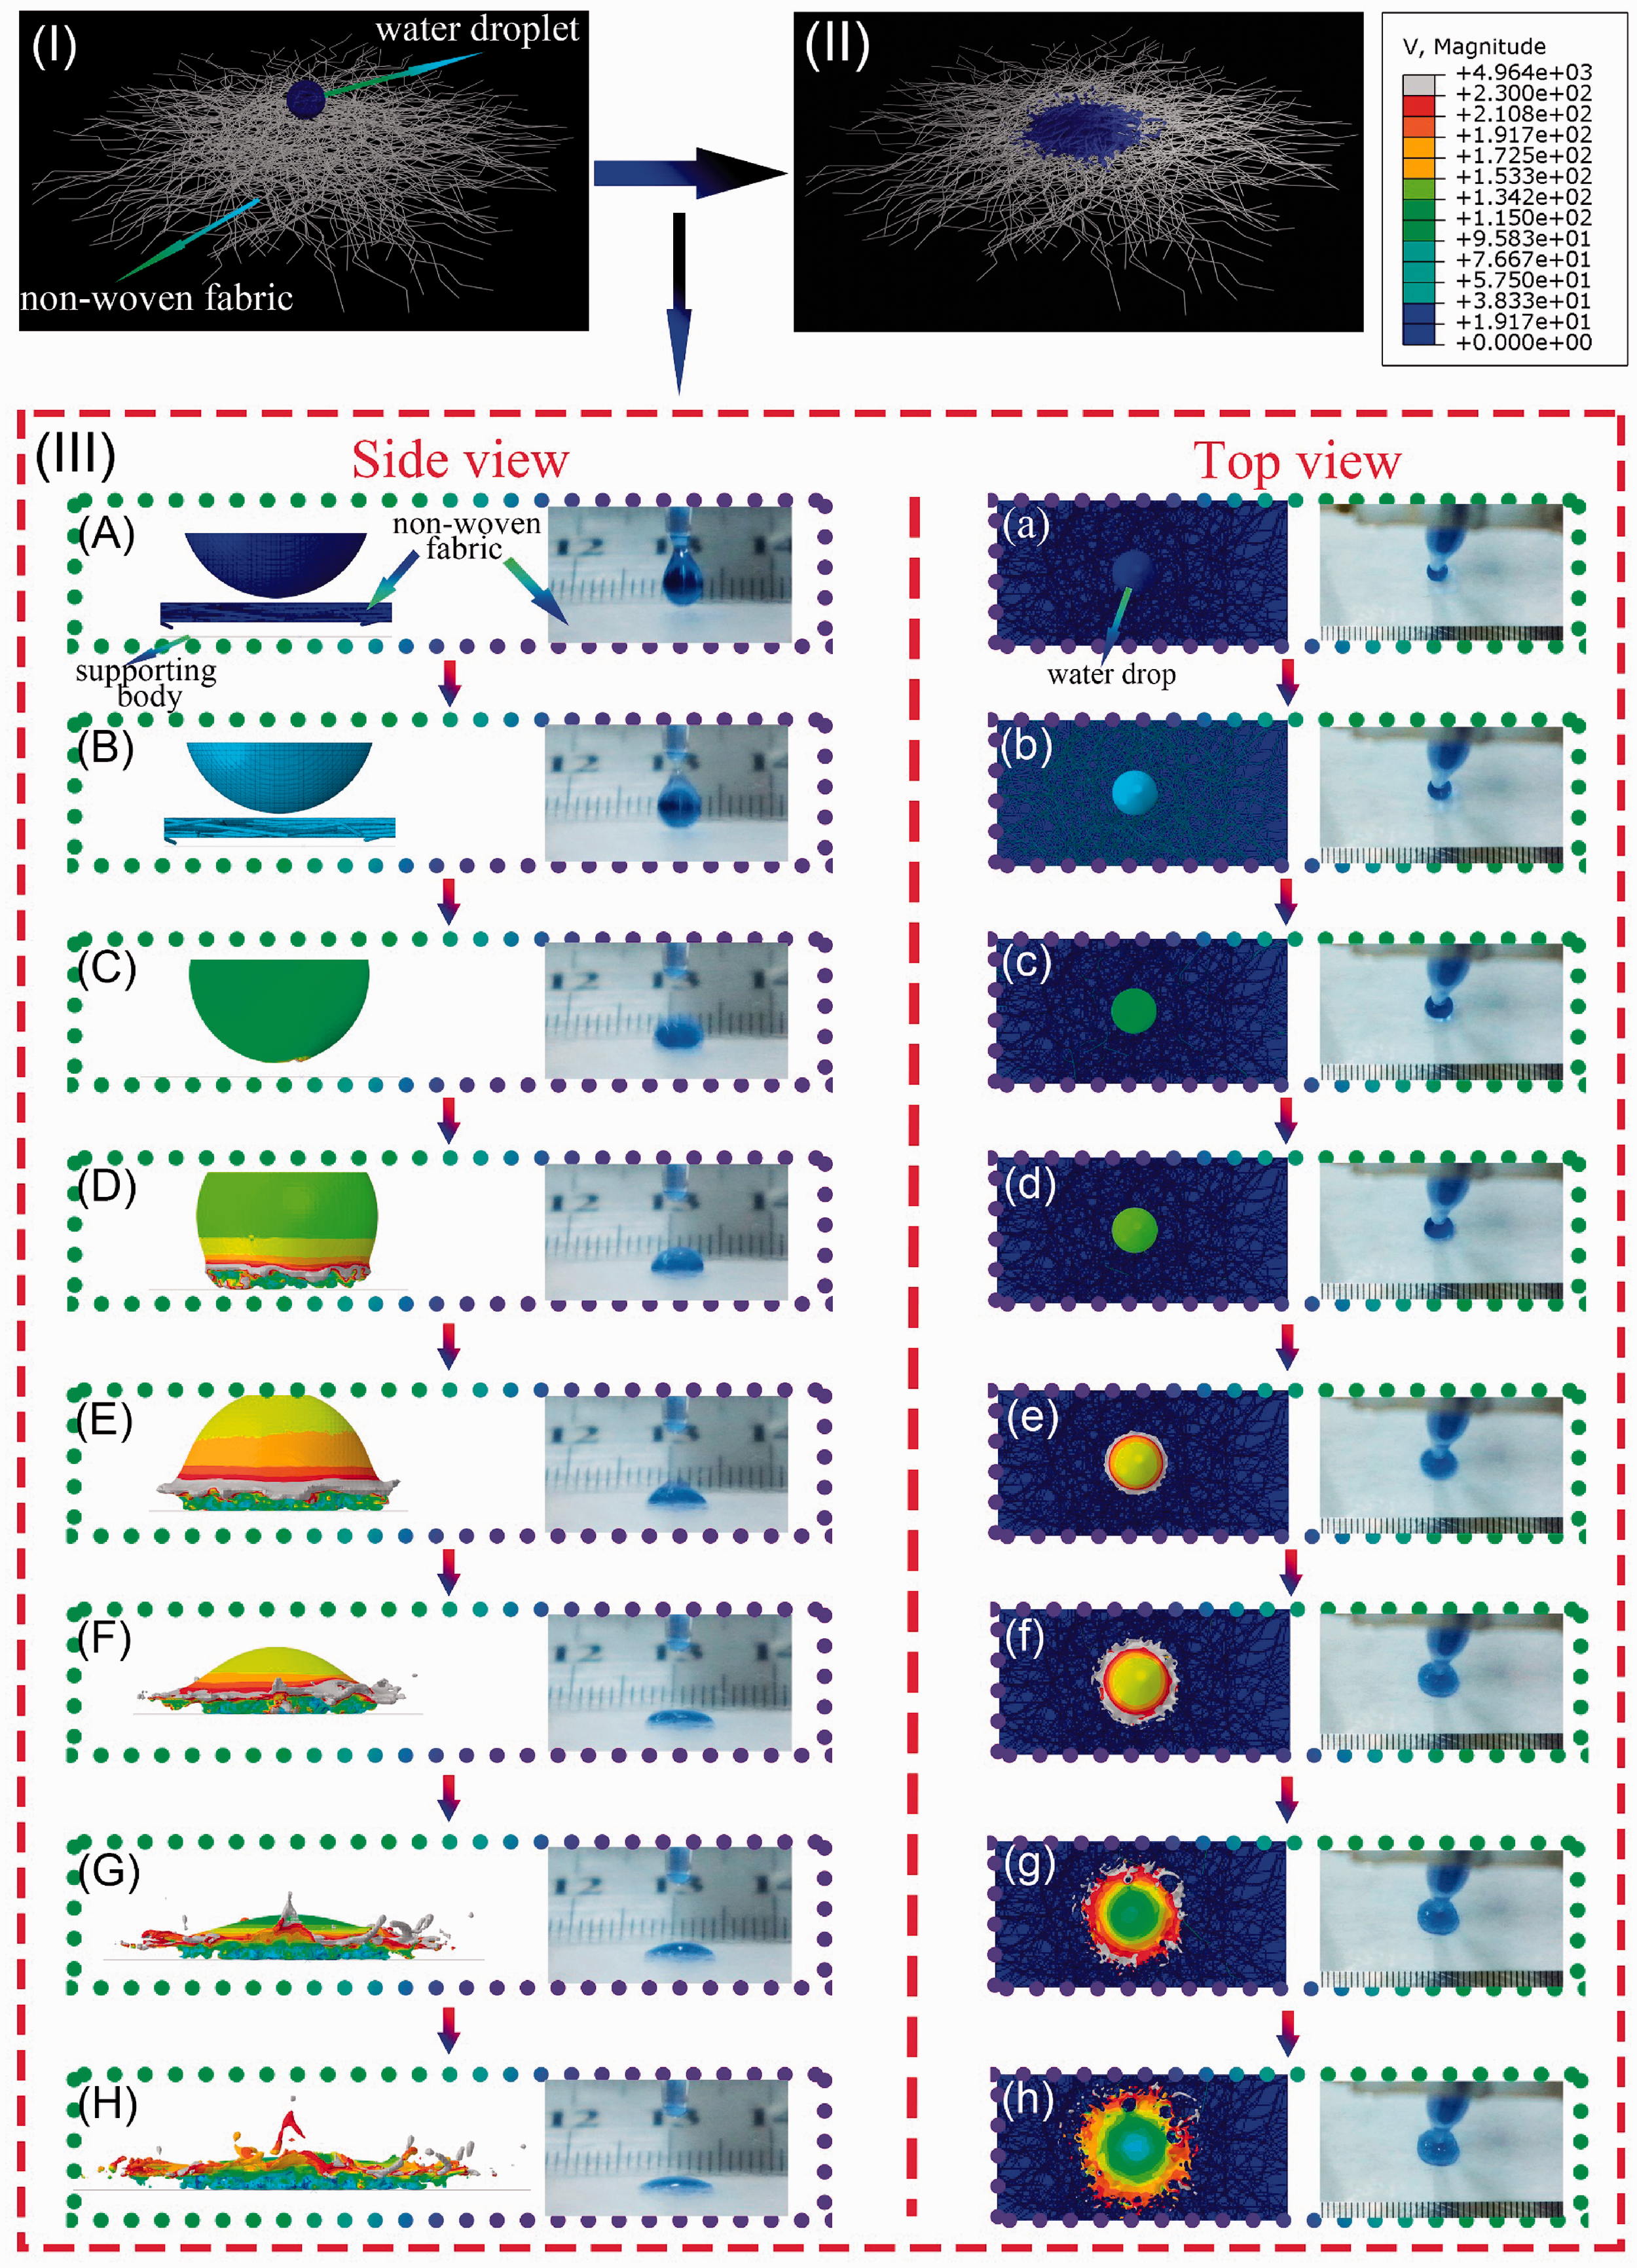
The diffusion experiment of the water droplet. (a) The positing of the nonwoven structure and droplet in the simulation; (b) The final diffusion form of the water droplet; (c) The diffusion simulation process of the water droplet.
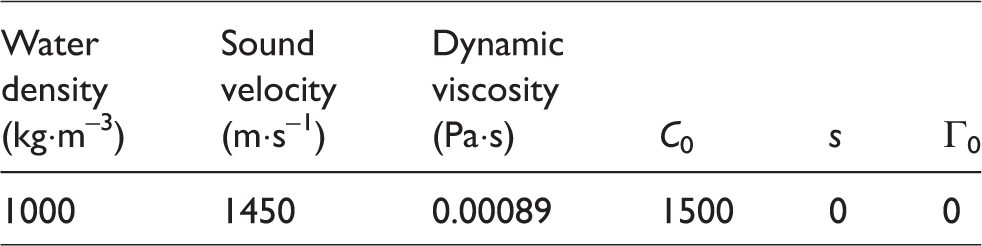
Figure 7(a) shows the initial morphology of the water droplet during the diffusion experiment, and Figure 7(b) shows the final morphology. The detailed process of water droplet diffusion is shown in Figure 7(c). In the simulation, we selected the coupled Eulerian–Lagrangian (CEL) method to describe the fluid flow process, and the Explicit module is used for process analysis in ABAQUS software. Meanwhile, a linear equation of state, Us–Up equation (equation 3), was used to model incompressible viscous and inviscid laminar flow governed by the Navier–Stokes equation of motion. The water is modeled using the linear Us–Up Hugoniot form of the Mie–Grüneisen equation of state (equation 4).
26


Parameters required in the diffusion simulation
Parts A to H in Figure 7(c) show the side views of the water droplet diffusion simulation and real experiment. For clarity, the nonwoven model is hidden in parts C to H. After the water droplet contacted the nonwoven fabric, its height was smaller and the diameter was increasing gradually, and the water droplet diffused along with the pores between fibers. It can be clearly observed, from parts D to F, that the water droplet changes from a round shape to a flat shape.
Parts A to H in Figure 7(c) show the top views of the water droplet diffusion in the simulation and real experiment. The spherical water droplet fell to the nonwoven model in a free fall and diffused along with the pores between fibers. It can be seen from the simulation that the water droplet diffused from the center of the spherical water droplet to the surrounding area after contacting the nonwoven model, and the diffusion was basically equidistant. From the upper view, the diameter of the simulation liquid trajectory increased continuously, meanwhile, in the real experiment, the water droplet also behaved as a similar diffusion track.
From the above experiments and simulation analysis, the morphology change of the water droplet in the simulation experiment was very close to that of the real experiment. Through the side view, we can qualitatively characterize the accuracy of the selected droplet simulation method, and the water droplet diffusion simulation in the top view proved the correctness of the 3D model and the uniformity of the pores in the spunlaced nonwoven fabric.
Conclusion
In this paper, a novel strategy was proposed for the generation of the 3D structure of spunlaced nonwoven fabric. Through the extraction and learning of 2500 fibers configuration feature, the configuration of fibers in the nonwoven fabric was reconstructed by the GAN algorithm, achieving the configuration generation of virtual fiber as well as visualizing the generation process of virtual fiber at different stages. Combined with the ABAQUS software, a fiber solid model with 15 feature points and circle cross-section characteristic was created. Furthermore, based on the assumption of the random distribution of fibers and the compression simulation based on the finite element method, a spunlaced nonwoven model with a thickness of 0.125 mm was constructed on the fiber scale. In addition, during the verification process of the 3D nonwoven model, a water droplet diffusion experiment through the CEL method in ABAQUS software was simulated, realizing the coupling simulation of water and fiber. Through the analysis of the top view and the side view of the simulation and real experiments, the morphological change of the water droplet tended to unify, which proved the accuracy of the 3D nonwoven model on the fiber scale.
Footnotes
Declaration of conflicting interests
The author(s) declared no potential conflicts of interest with respect to the research, authorship, and/or publication of this article.
Funding
The author(s) disclosed receipt of the following financial support for the research authorship, and/or publication of this article: This research was supported by the Fundamental Research Funds for the Central Universities and Graduate Student Innovation Fund of Donghua University (grant no. CUSFDH-D-2020022), National Natural Science Foundation of China (grant no. 61379011) and Shanghai Frontier Science Research Center for Modern Textiles, Donghua University.
