



Abstract
In this paper, an economical way for accurately determining weight-based short fiber contents in raw cotton and semi-finished slivers by utilizing special bilateral beard specimens and image processing was introduced. In the specimen preparation, cotton fibers were drawn by a manual device into a sliver, then the sliver was combed to form a bilateral beard specimen, and finally the bilateral beard was scanned to generate a grayscale image from which a relative fiber number curve was extracted. An algorithm for calculating the weight-based short fiber contents based on the curve was proposed. Five types of cottons were repetitively measured to investigate the robustness of the results of
Naturally, cotton fibers possess wide length distributions, resulting from cotton breeds, growing conditions, harvesting methods, and ginning practices, and are usually characterized by a number of length parameters.1–5 Short fiber content (SFC) is such a parameter that represents the weight-based or number-based proportion of fibers shorter than a threshold in a sample.6–8 Because short fibers compromise yarn quality (e.g., strength, evenness, and hairiness), it is widely acknowledged that they play a negative role in yarn manufacturing.9–13 Therefore, methods to measure SFCs in raw cotton continue to be focused upon in the textile testing and instrumentation research area.14–18
A traditional approach is the array method, in which fibers are manually aligned at one end to form a baseline and then separated into a range of length groups to be weighed separately. 7 A length–weight histogram of these length groups can be used to calculate several length parameters, including weight-based SFC. In this time-consuming manual operation, short fibers tend to bear a larger risk of being lost than long fibers. 19
The High Volume Instrument (HVI) is an automatic system that is widely employed to evaluate the integrated quality of raw cotton because of its efficiency and completeness of measurement.20–22 Fibers in raw cotton are randomly grabbed and hung on a row of needles and then combed to form a tapered beard. The beard is scanned by a light slit to generate a fibrogram showing the changes of fiber amount from the needle line to the tapered end. Many length parameters can be extracted from the fibrogram; however, it is not possible to measure SFC firsthand because the fibers near the needle line are likely to be tangled or folded. 23 Instead, the HVI provides a prediction parameter, the Short Fiber Index (SFI), based on other available HVI parameters. 24 , 25 The low repeatability of the SFI, however, prevents it from being used in the United States Department of Agriculture’s (USDA's) raw cotton classification system.26–29
Another widely employed automatic instrument is the Advanced Fiber Information System (AFIS), which has a built-in fiber opener for individualizing cotton fibers from a sliver, as well as a photoelectric sensor to test the fibers’ length when they are transported by a high-speed airflow. 19 On the basis of at least 3000 single fibers and the assumption that the fibers have uniform linear density, AFIS can output length–number frequency distribution histograms, length–weight frequency distribution histograms, and a series of length parameters extracted from these histograms. 23 ,30–33
In recent years, a new form of bilateral beard specimen had been introduced for simplifying the sample preparation in fiber length testing.34–37 The bilateral beard specimen, which has two tapered ends in opposite directions, eliminates not only the fiber entanglements that severely alter the SFC but also the un-measurable areas of specimens. The Lengthcontrol system (LCT) is the first commercial system that can automatically produce bilateral beard specimens from a feeding sliver and provide SFC measurements. 38 , 39 However, the fibrogram principle and validation results of the LCT have not been made publicly available.
The above-mentioned commercial instruments have a high degree of automation, but they generally have the disadvantages of being expensive and complicated to maintain. In this paper, we developed a novel method for measuring weight-based SFCs in an economical and reliable way, called the Image-based Bilateral Beard Method (abbreviated as IBBM). This method utilized a transmission scanner to scan bilateral beard specimens, then extracted the fiber number change curve from one end of the bilateral beard to the other, and finally calculated the weight-based SFCs using a special algorithm. Beyond the measurement methods and algorithms, this paper also investigated the robustness and the agreement of the weight-based SFC results respectively from the IBBM and a reference method.
Method
Specimen preparation and scanning
Figure 1 presents the procedure of specimen preparation. Firstly, 0.65 ± 0.15 g cotton fibers from a cotton bale or semi-finished sliver are drawn to form a sample sliver of approximately 20 cm long and 5 cm wide, using the fiber drafting device of the array method, which can make tangled fibers straight and parallel without breaking them. Next, the sample sliver is randomly clamped by a clamp with an extra narrow jaw. The clamping line should be perpendicular to the axial direction of the sliver and at least 5 cm away from the sliver’s ends to avoid instability of the ends. Then, the floating fibers are gently combed away, and the sample sliver is converted to a bilateral beard specimen. Finally, the bilateral beard specimen is scanned by an office transmission scanner, which has ordinary parameters such as three-color light-emitting diode (LED) linear lighting, 16-bit gray depth, a linear-array charge-coupled device (CCD), 3200 dpi × 6400 dpi optical resolution, and 3.9 Dmax optical density. To balance the measurement accuracy, efficiency, and equipment cost, the images are set to 1000 ppi resolution and 8-bit gray depth.

Procedure of specimen preparation.
Image processing
As the beard image is 8-bit grayscale, the gray values of image pixels are from 0 to 255, which precisely reflects the intensity of transmission light at different pixel points. As shown in Figure 2, the gray values are normalized by dividing by 255, converting into the transmissivity at each point. Then, the transmissivity is further transformed into the bilateral beard’s areal density at each point by using the optical algorithm presented in our previous publication for calculating the areal density of the laminar fiber assembly. 40
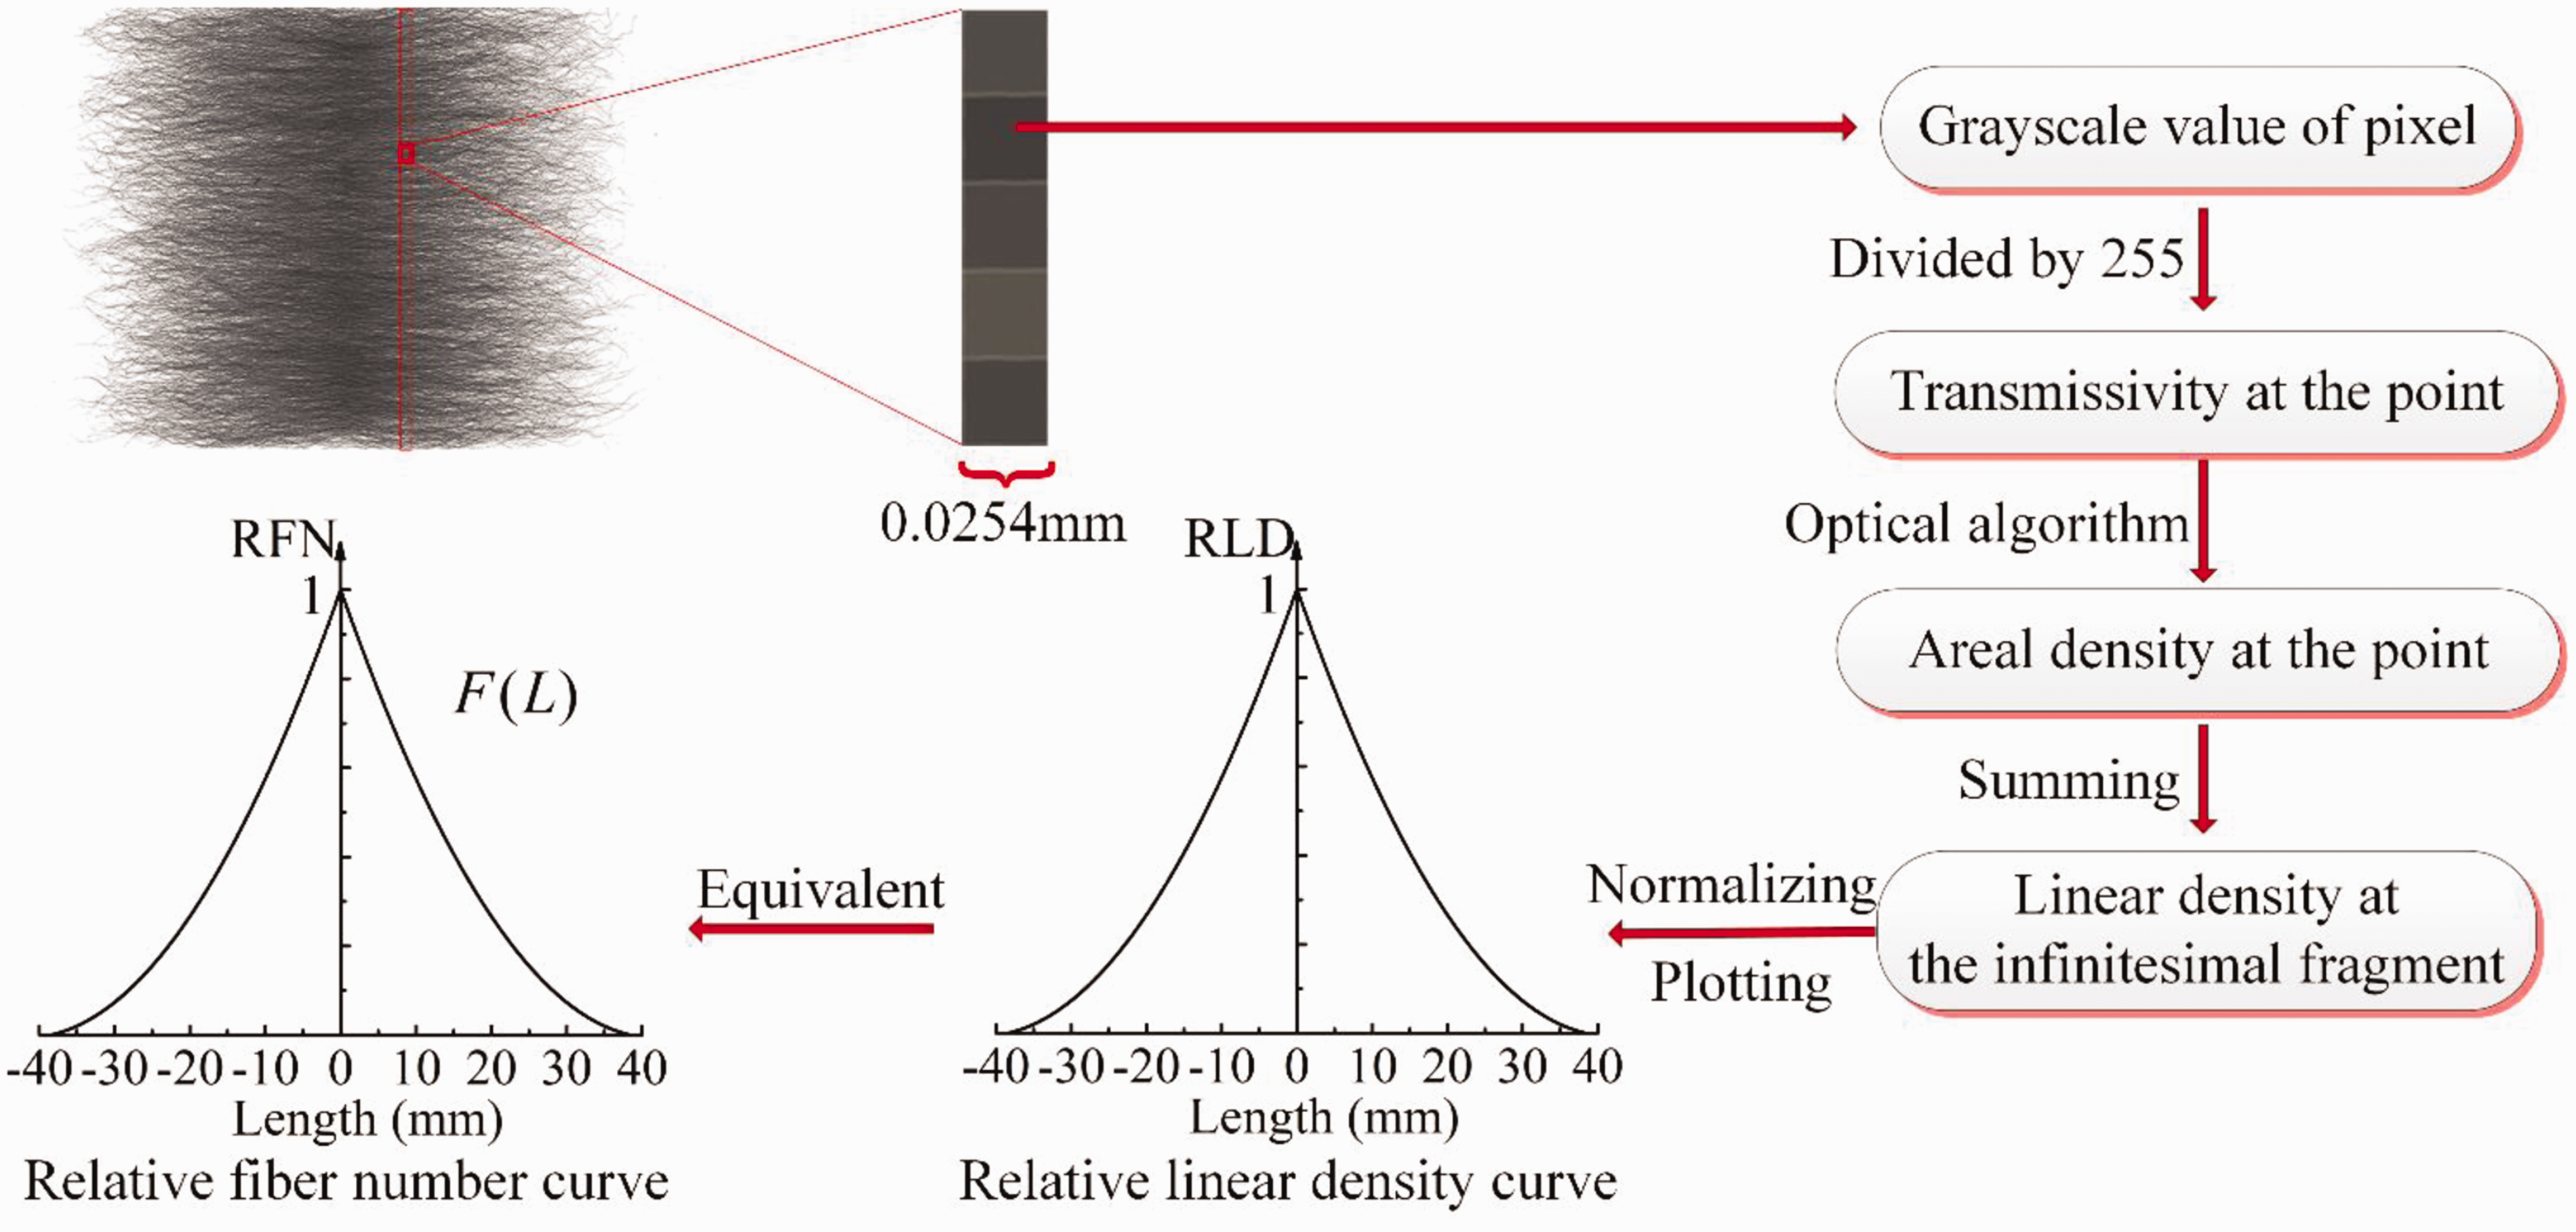
Principle of image processing. RFN: relative fiber number; RLD: relative linear density.
Because each column of the image corresponds to an infinitesimal fragment of the bilateral beard, summing the areal densities of the points in one column gives the bilateral beard’s linear density at the corresponding infinitesimal fragment. It is expected that the clamping line has the highest linear density, so dividing the linear density of each infinitesimal fragment by the clamping line’s linear density can result in a normalized vertical axis value of the relative linear density (RLD) curve. Considering the image resolution is 1000 points per inch, which means the size of pixels is 0.0254 mm × 0.0254 mm, the location of each infinitesimal fragment on the horizontal axis can be established.
Eventually, the RLD curve of the bilateral beard specimen can be plotted as shown in Figure 2. Under the common assumption that fibers in the same sample have the same linear density, the linear density at each infinitesimal fragment has a linear relationship with the number of fibers there, so the RLD curve can be equivalent to the relative fiber number (RFN) curve from which the SFC values can be extracted.
Analysis of the symmetry of the bilateral beard
In this study, to reduce the random fluctuation caused by the nonuniformity of cotton fibers, the bilateral RFN curve in Figure 2 was transformed into a unilateral RFN curve, as shown in Figure 3, by averaging the vertical axis values of the symmetry points on the horizontal axis. Although the bilateral beards are intuitively symmetric, it still needs to be theoretically proved that there is no systematic difference between the two ends.

Geometrical meaning of the SFCw(α) calculation formula. RFN: relative fiber number. (Color online only.)
In the bilateral beard, for a fiber whose length is
Possible relationships between the lengths of the left- and right-hand segments and a specific distance from the clamping line (color online only)
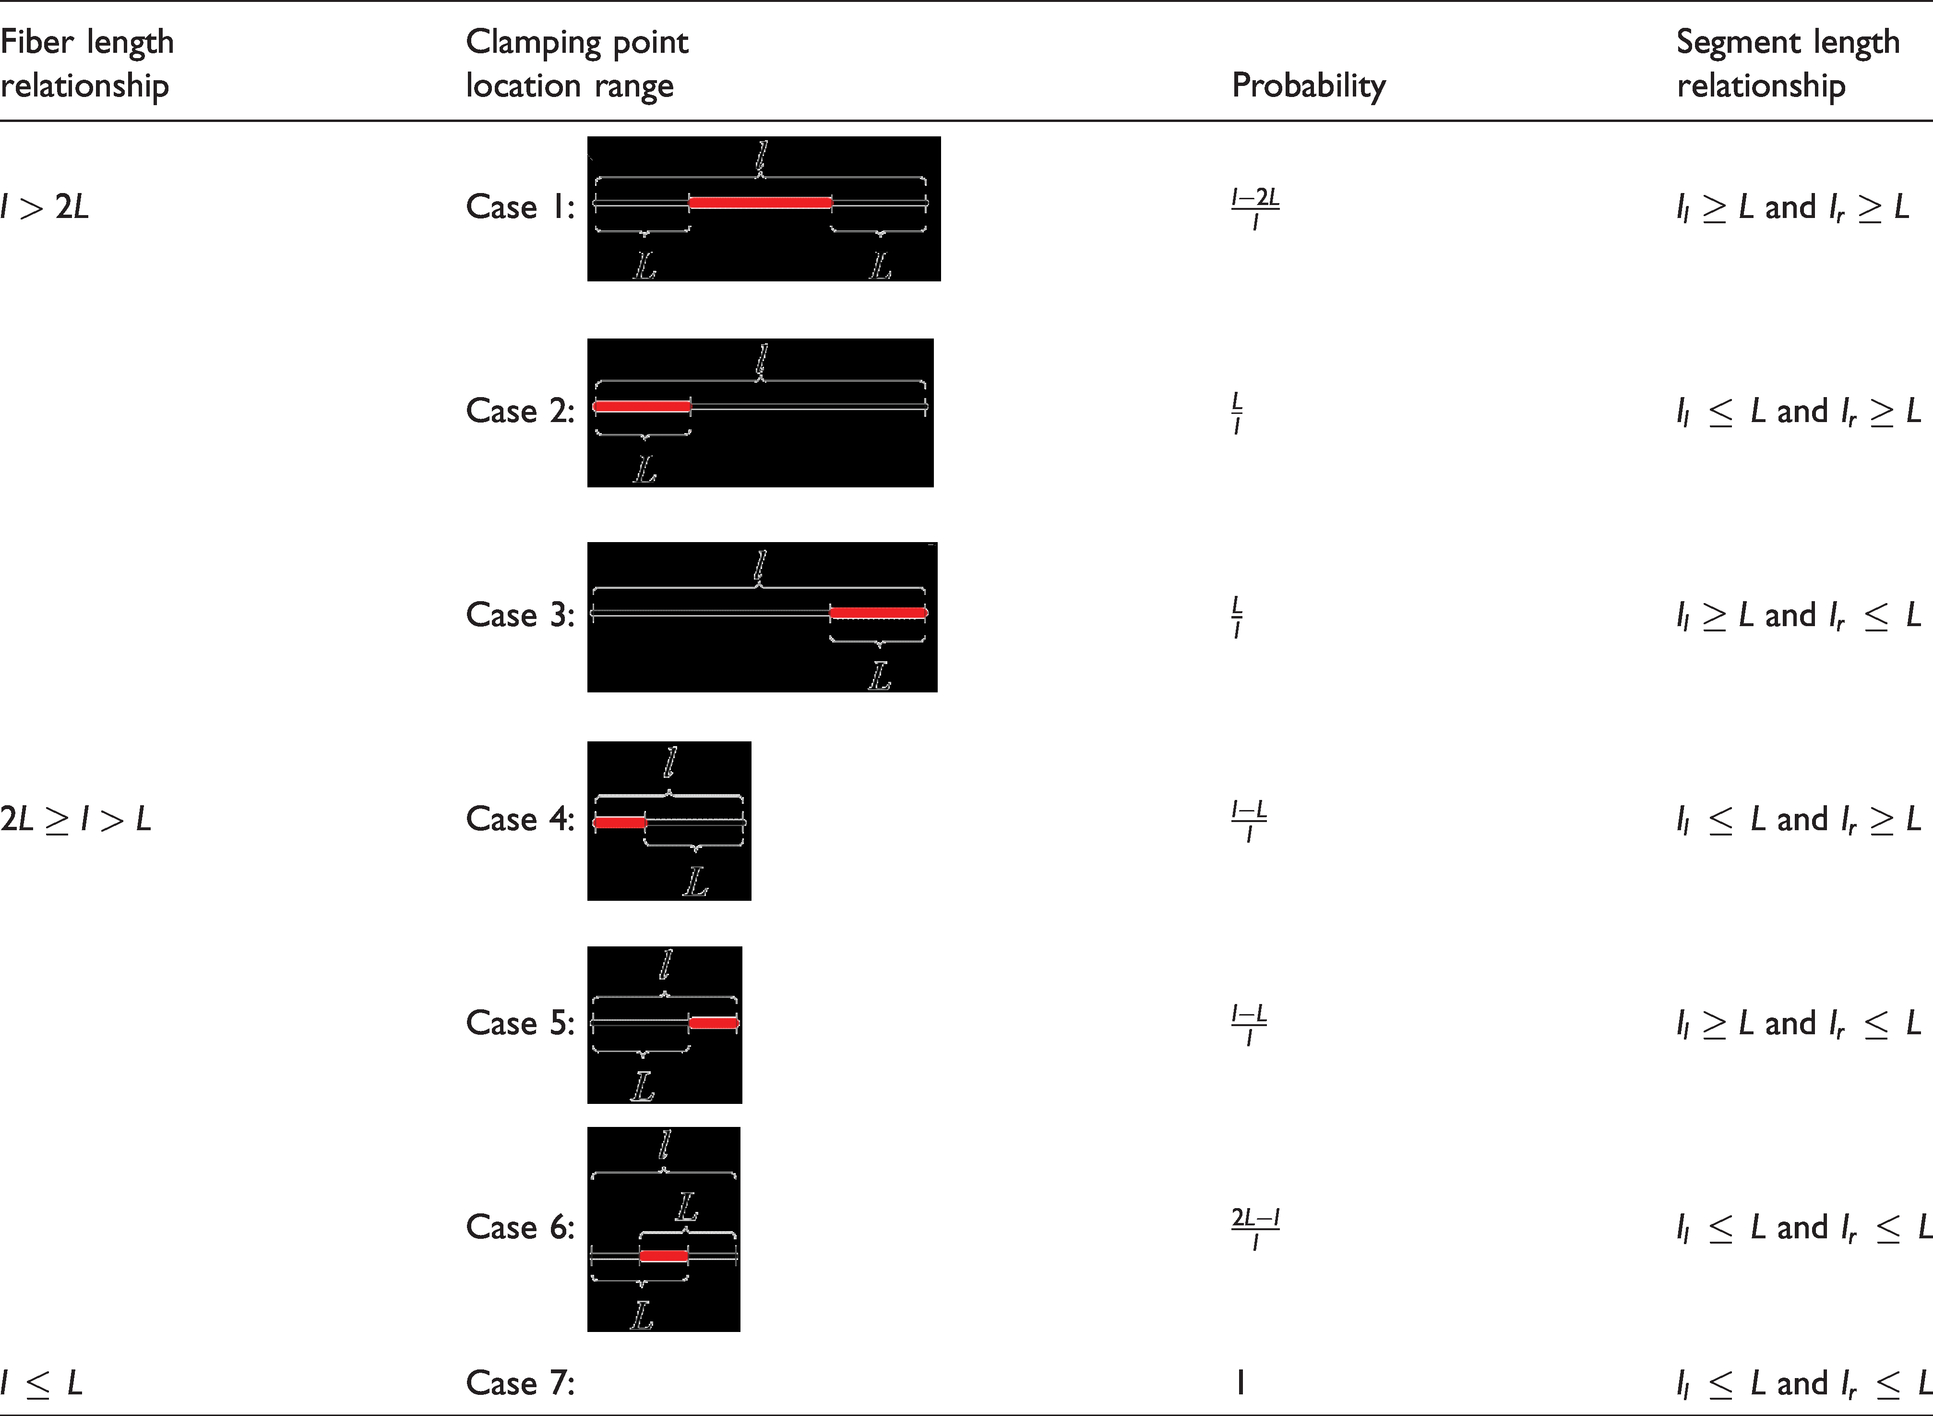
If 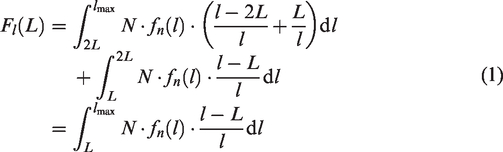
Similarly, the number of fibers extending to the right-hand side with a distance beyond 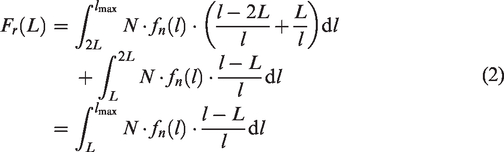
It is obvious that 
For experimental verification, 10 bilateral beard specimens from 10 types of cotton samples (marked as 1–10) were prepared and cut into two halves along the clamping line. The weights of the heavier half and the lighter half of each bilateral beard are shown in Table 2. The average weight ratio and the maximum weight ratio were 1.030 and 1.043, respectively, which confirmed that the bilateral beard specimens had good symmetry.
Weight contrast between the two halves of the specimens

SFC algorithm
According to some previous reports on the IBBM,
34
,
35
,
41
the weight-based length probability density function of raw cotton, 
Here, the variable 
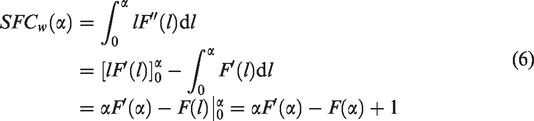
Here,
As
Considering that the length threshold of short fibers is different in different countries, for example, it is 0.5 inch (12.7 mm) in the USA and some other countries while it is 16 mm in China, both of these two standards were employed in this study, and Equation (6) became


Because 
Similarly, the slope of the line between 
Analysis of the number of specimens needed
The current fiber length measurement methods generally require several specimens to obtain reliable results. It has been reported by many references that the SFC has lower robustness than most other length parameters, which may be primarily caused by the short fibers’ more serious unevenness from one cotton boll to another, and from one plant to another. 7 , 10 , 13 , 14 , 28 So, it is of great important to investigate the number of bilateral beard specimens needed for stable and reliable SFC results.
For this purpose, five laboratory samples, including upland cottons (samples 11–13) and island cottons (samples 14 and 15), were used, and 10 specimens from each sample were made and tested. These SFC results were analyzed by using Equation (11), where 
Table 3 lists the SFC results of the multiple tests and some analysis data when
Analysis of the number of specimens needed for error rate control

Results and Discussion
Repeatability comparison with AFIS
To examine the repeatability level of the SFC results from the IBBM, the AFIS Pro 2 was employed as a reference method to measure the above five samples (samples 11–15) again. The results are based on plenty of direct data of individual fibers, making AFIS a good reference for fiber property measurement studies.
According to AFIS operating regulations, 10 sliver specimens of 0.5 g were prepared from each of the samples, then put into the AFIS test tube and tested one by one. The repeatability statistics of SFC results from the IBBM and AFIS are presented in Table 4, where the difference ratio of the 10 measurements was the difference between the maximum and minimum measurements divided by the average.
The repeatability statistics of short fiber content (SFC) results from the Image-based Bilateral Beard Method (IBBM) and Advanced Fiber Information System (AFIS)
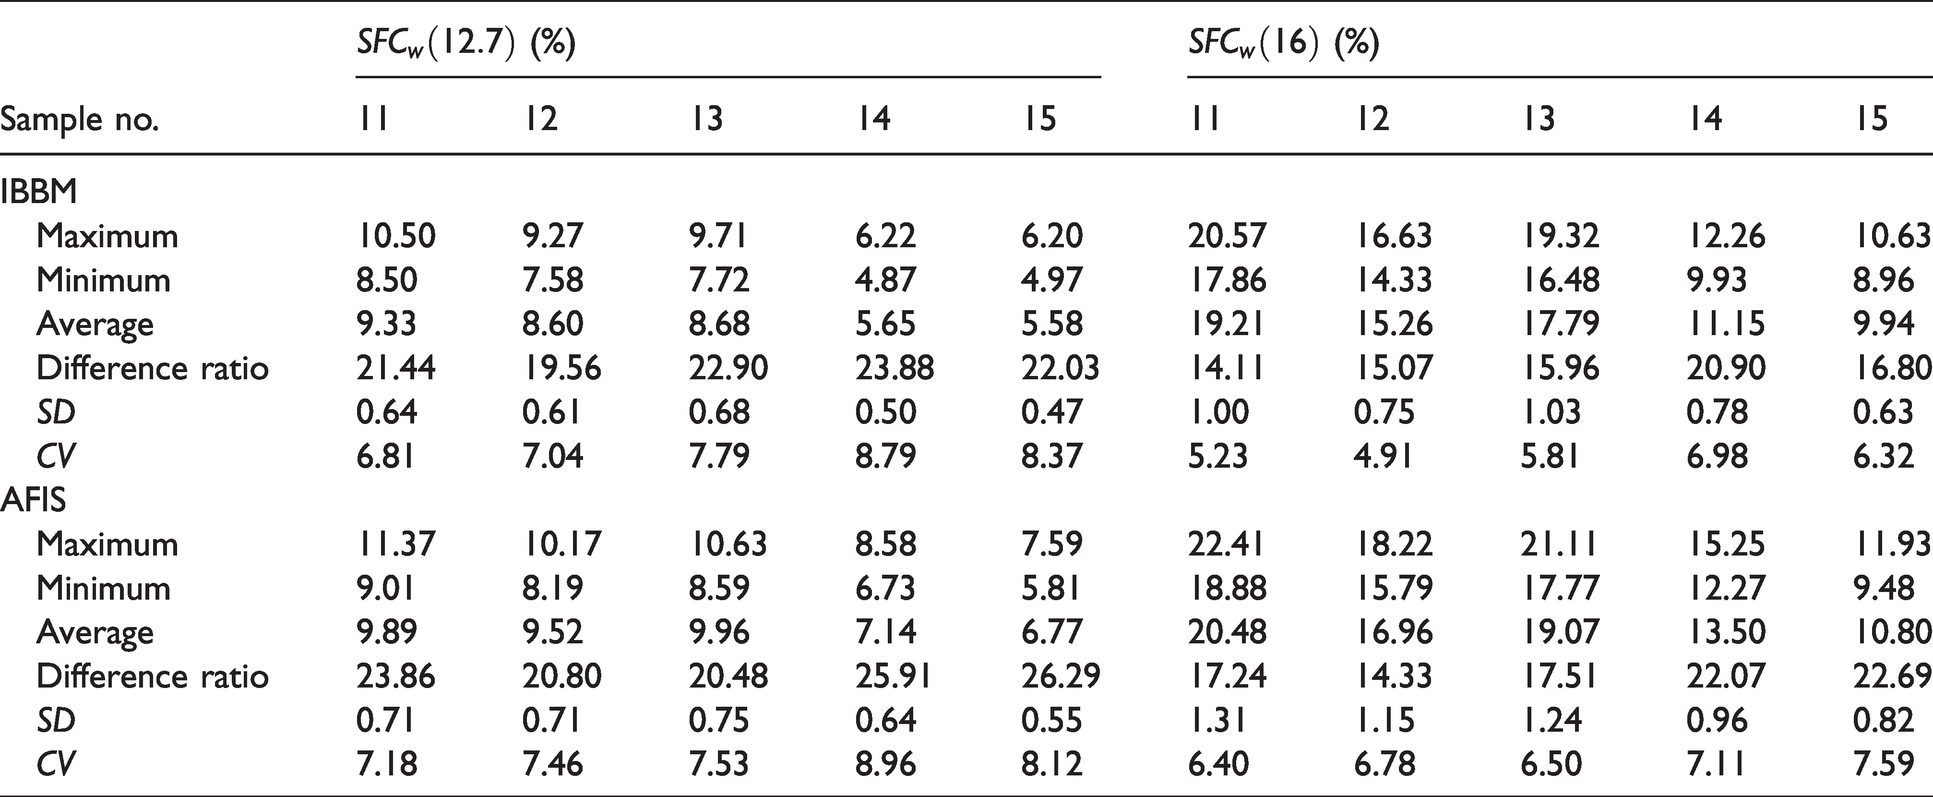
Comparing the repeatability evaluation index of the two methods, it can be seen that the difference ratios, the standard deviations (SD), and the coefficients of variation (CV) of SFCs from the IBBM are similar or sometimes lower than those from AFIS, signifying that the former has analogous or better robustness compared with the latter. Besides, the SFCs from AFIS appear a little higher than those from the IBBM, one possible reason being that fiber breakages in the opening process have brought a bias into the measurement, as many studies have indicated.
13
,
14
,
17
,
24
,
25
For both methods, in addition, the results of
Analysis of the substitutability of the SFC results from the IBBM and AFIS
In order to investigate the correlation and the consistency of the SFC results from the IBBM and AFIS, a total of 37 types of cotton samples (including the 15 samples above) from some of the world’s major cotton producing areas were collected and tested, which included 25 upland cottons from the USA, China, India, Australia, and Mexico, and 12 island cottons from China, Uzbekistan, and Egypt. In the former method, the final result of each sample was the average of four bilateral beard specimens. And in the latter method, the final result was based on four sliver specimens.
Figure 4 shows the correlation analysis results between the SFC results from the IBBM and AFIS. The Pearson’s correlation coefficient is r = 0.9043 for

Correlation analysis between the short fiber content (SFC) results from the Image-based Bilateral Beard Method (IBBM) and Advanced Fiber Information System (AFIS).
As shown in Figures 5 and 6, a consistency check was conducted by the Bland–Altman method, which is usually used to test the consistency of two subjects at the 95% confidence level. The ordinate data are the differences between the two SFC results of the two methods, and the abscissa data are their means. The lines of “Mean+1.96*SD” and “Mean–1.96*SD” respectively represent the upper 95% limit and the lower 95% limit. For
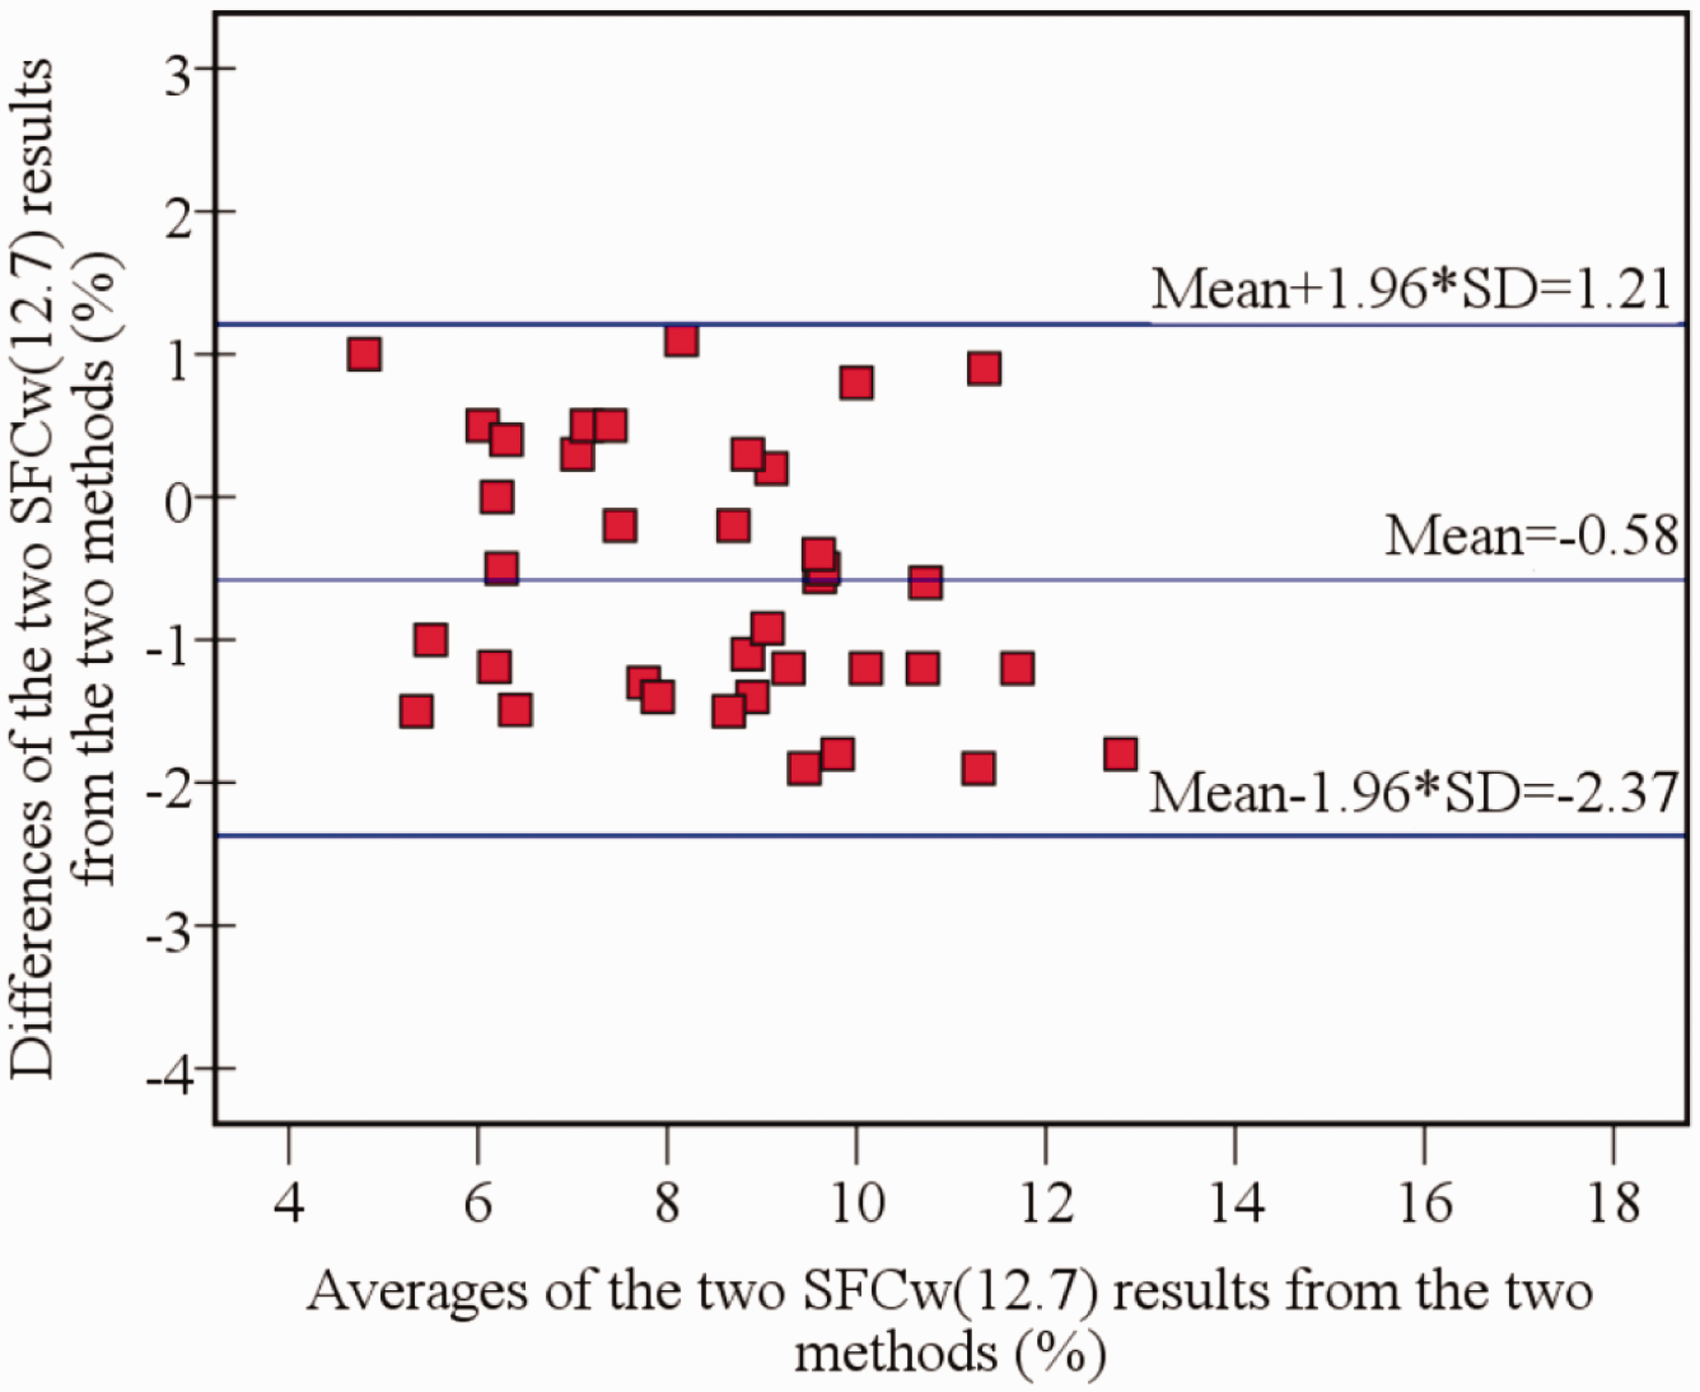
Bland–Altman analysis for SFCw(12.7) results from the two methods.

Bland–Altman analysis for SFCw(16) results from the two methods.
Conclusions
This paper presents the IBBM for accurately measuring the SFCs in raw cotton or semi-finished slivers. A new type of specimen, called the bilateral beard, was used, which should be scanned into grayscale images for extracting RFN curves. In this paper, general algorithms for extracting the weight-based SFCs from the RFN curves was proposed. Five types of cotton samples were repetitively measured to investigate the robustness of the results of
Footnotes
Declaration of conflicting interests
The authors declared no potential conflicts of interest with respect to the research, authorship and/or publication of this article.
Funding
The author(s) disclosed receipt of the following financial support for the research, authorship, and/or publication of this article: This work was supported by National Natural Science Foundation of China (Grant No: 51673036, 51803108), Fujian Provincial Natural Science Foundation of China (Grant No: 2019J05106), Quanzhou City Science & Technology Program of China (Grant Nos: 2019G028, 2018G011), and Quanzhou Home-bay Recruitment Program of Global Talents (Grant No: 2017ZT002).
