



Abstract
With the purpose of solving the problems of uneven velocity and energy loss of the foreign fiber sorters, this paper has analyzed the nozzle distribution and structure in the foreign fiber sorting system, and presented the design of a nozzle with the circular distribution contraction–expansion structure. The turbulent kinetic energy was optimized through a circular distribution of the nozzle to improve nozzle velocity uniformity, according to the effect of air flow on wall surface distance. Meanwhile, the nozzle was optimized with the contraction–expansion structure based on the relationship between the Mach number and the nozzle’s cross-sectional area. The stepped cross-section of the nozzle was replaced by a transition curve cross-section to restrain the sudden change of the air flow velocity in the nozzle. The optimized nozzle structure was discussed in terms of the velocity, the pressure, and the energy loss. It was found that the velocity increases by 9.2%, the required pressure decreases, and the energy loss decreases. So the effectiveness and practicability of the proposed method were illustrated.
The foreign fibers in cotton cause the defects and stains of the fabric, which affect the economic benefits of cotton mills. Foreign fiber sorters are widely used in the industry to eliminate them. 1 The foreign fiber sorters collect cotton with a charge coupled device (CCD) camera, detect the foreign fibers in cotton through image data processing, and finally the foreign fiber is eliminated by the nozzle. The structure of the nozzle will affect the eliminating rate of foreign fibers and the energy loss of the devices; thus, many experts and scholars have done a lot of research on the optimization design of nozzles.2,3
Some scholars study the distribution of nozzles to change the uniformity of air velocity and improve the detection efficiency of foreign fibers. Li et al. 4 used 32 high-pressure air nozzles arranged horizontally to remove foreign fibers in cotton. Then, LiI et al. 5 used a nozzle plate structure with one nozzle inlet to control four nozzle outlets to remove the foreign fibers. Next Tan et al. 6 introduced some foreign fiber sorters and found that the removal effect of one inlet and four outlets was the optimal. Moreover, Gerasimov et al. 7 analyzed the corresponding numerical values of the nozzle distribution uniformity in detail, which provided the possibility of effectively solving the problems involved in designing instruments for measuring air flow velocity and their metrological facilities. Rim et al. 8 evaluated the effects of nozzle distribution, nozzle spacing, and pipe spacing on the ejection characteristics, and proved that the nozzle distribution has a significant influence on the velocity. Aghaei-Togh et al. 9 analyzed the nozzle distribution mode and showed that the nozzle distribution angle has a great influence on the design parameters of the nozzle, and presented a better design method for layout of nozzles, according to the one-dimensional (1D) performance calculations and three-dimensional (3D) flow pattern analysis. Liao et al. 10 used Fluent software to perform numerical simulations, used the Multi Zone method to divide the grids to realize the dense processing of the grids at the nozzles, studied the influence of nozzle aperture and nozzle distribution on air flow, and concluded that the effect was best when there were four nozzles. Chen et al. 11 studied the influence of design parameters such as nozzle position and nozzle diameter on the nozzle axis air flow direction and jet deflection distance, and designed an efficient and energy-saving separator to improve the elimination efficiency of foreign fibers in cotton. At present, the nozzle design with horizontal arrangement is mainly used, but the removal effect is not good. In this paper, the nozzle design with circular distribution is proposed to improve velocity uniformity.
Furthermore, the study of the flow field characteristics of the nozzle structure has important application value to improve velocity and reduce energy loss. In order to further improve the design efficiency of the cotton foreign fiber sorters, Deng et al. 12 measured the gas velocity distribution on the axis of the high-velocity gas nozzle through experiments, compared the results of numerical calculations, and found that the jet area of the Laval nozzle was larger than the rectangular cross-section nozzle, and the effect of eliminating foreign fibers was better in practice. Belforte et al. 13 studied the internal air flow field of the nozzle and compared the air flow characteristics of nozzles with different structures, which found that the circular hole has better air flow bundling performance, which was of great significance for reducing energy loss. Liang et al. 14 used Fluent software to numerically simulate the air flow field of the nozzle in the foreign fiber sorters, and obtained an ideal or stable flow field by improving the structure parameters of the nozzle, thereby improving the eliminated efficiency of the entire system. Then, Chen et al. 15 designed a nozzle with a compression-expansion structure, used the Meshing module in the Fluent software to mesh the nozzle air flow field model, and analyzed the changes of the nozzle's gas velocity on the air flow centerline to obtain the best nozzle diameter and distribution. Yan et al., 16 Zeng et al., 17 and Jin et al. 18 used computational fluid dynamics (CFD) technology to carry out a numerical study and analyzed changes in flow velocity and pressure by simulating the air flow pattern in the nozzle, thereby optimizing the nozzle structure. Moreover, Shang et al. 19 used the guided body and cone body of nozzle to conduct combined experiments to provide reference for nozzle structure optimization. Slootmaekers et al. 20 compared the normal volumetric flow velocity and generated impact force between a stepped nozzle and a so-called energy-saving nozzle, simulated the variation each nozzle under three different input pressures, and found that the stepped nozzle consumed more energy and generated less pressure when the inlet pressure was the same. At present, the CFD model is mainly used for numerical analysis to realize the optimization of the nozzle structure. This paper analyzes the optimized nozzle structure through the three aspects of velocity, the pressure, and the energy loss to improve the performance of the nozzle.
Hence, this study analyzes and optimizes the distribution and structure of nozzles to improve the eliminating rate of foreign fiber in cotton. Firstly, the traditional nozzle is improved, using the circular distribution instead of the straight horizontal distribution, and the contraction–expansion structure instead of the stepped structure. Then, using Fluent software to simulate and analyze the optimized nozzle, it is found that the optimized performance is significantly better than the previous performance. Finally, by designing an experimental platform to measure the axis velocity of the nozzle outlet, the measurement effect is consistent with the simulation effect, which demonstrates the effectiveness of the proposed method.
Optimization design of nozzle outlet distribution
The nozzle in the traditional foreign fiber sorting system is composed of two nozzle plates, an inlet, and an outlet; the effective area of nozzle elimination is within 70 mm of the outlet; and this structure is only used by a few enterprises in China. 4 At present, most enterprises use a structure with an inlet nozzle and four stepped outlet nozzles connected, and the nozzle outlets are distributed in a straight line.5,6 The straight horizontal distribution of the nozzles results in lower nozzle axis velocity on both sides, which reduces the eliminating rate of foreign fibers. Moreover, air flow through the stepped nozzle causes a sudden change in the area of the air flow to form a shock wave, which increases energy loss. Therefore, the structural optimization design of the stepped nozzle is required.9,15
Aimed at the problem of uneven air flow of the four nozzles distributed horizontally, a circular nozzle distribution is proposed. The optimized solution not only widens the air flow coverage, but also produces uniform air flow according to the same distance between the inlet and the outlets. The nozzle outlet distribution before and after optimization is shown in Figure 1.
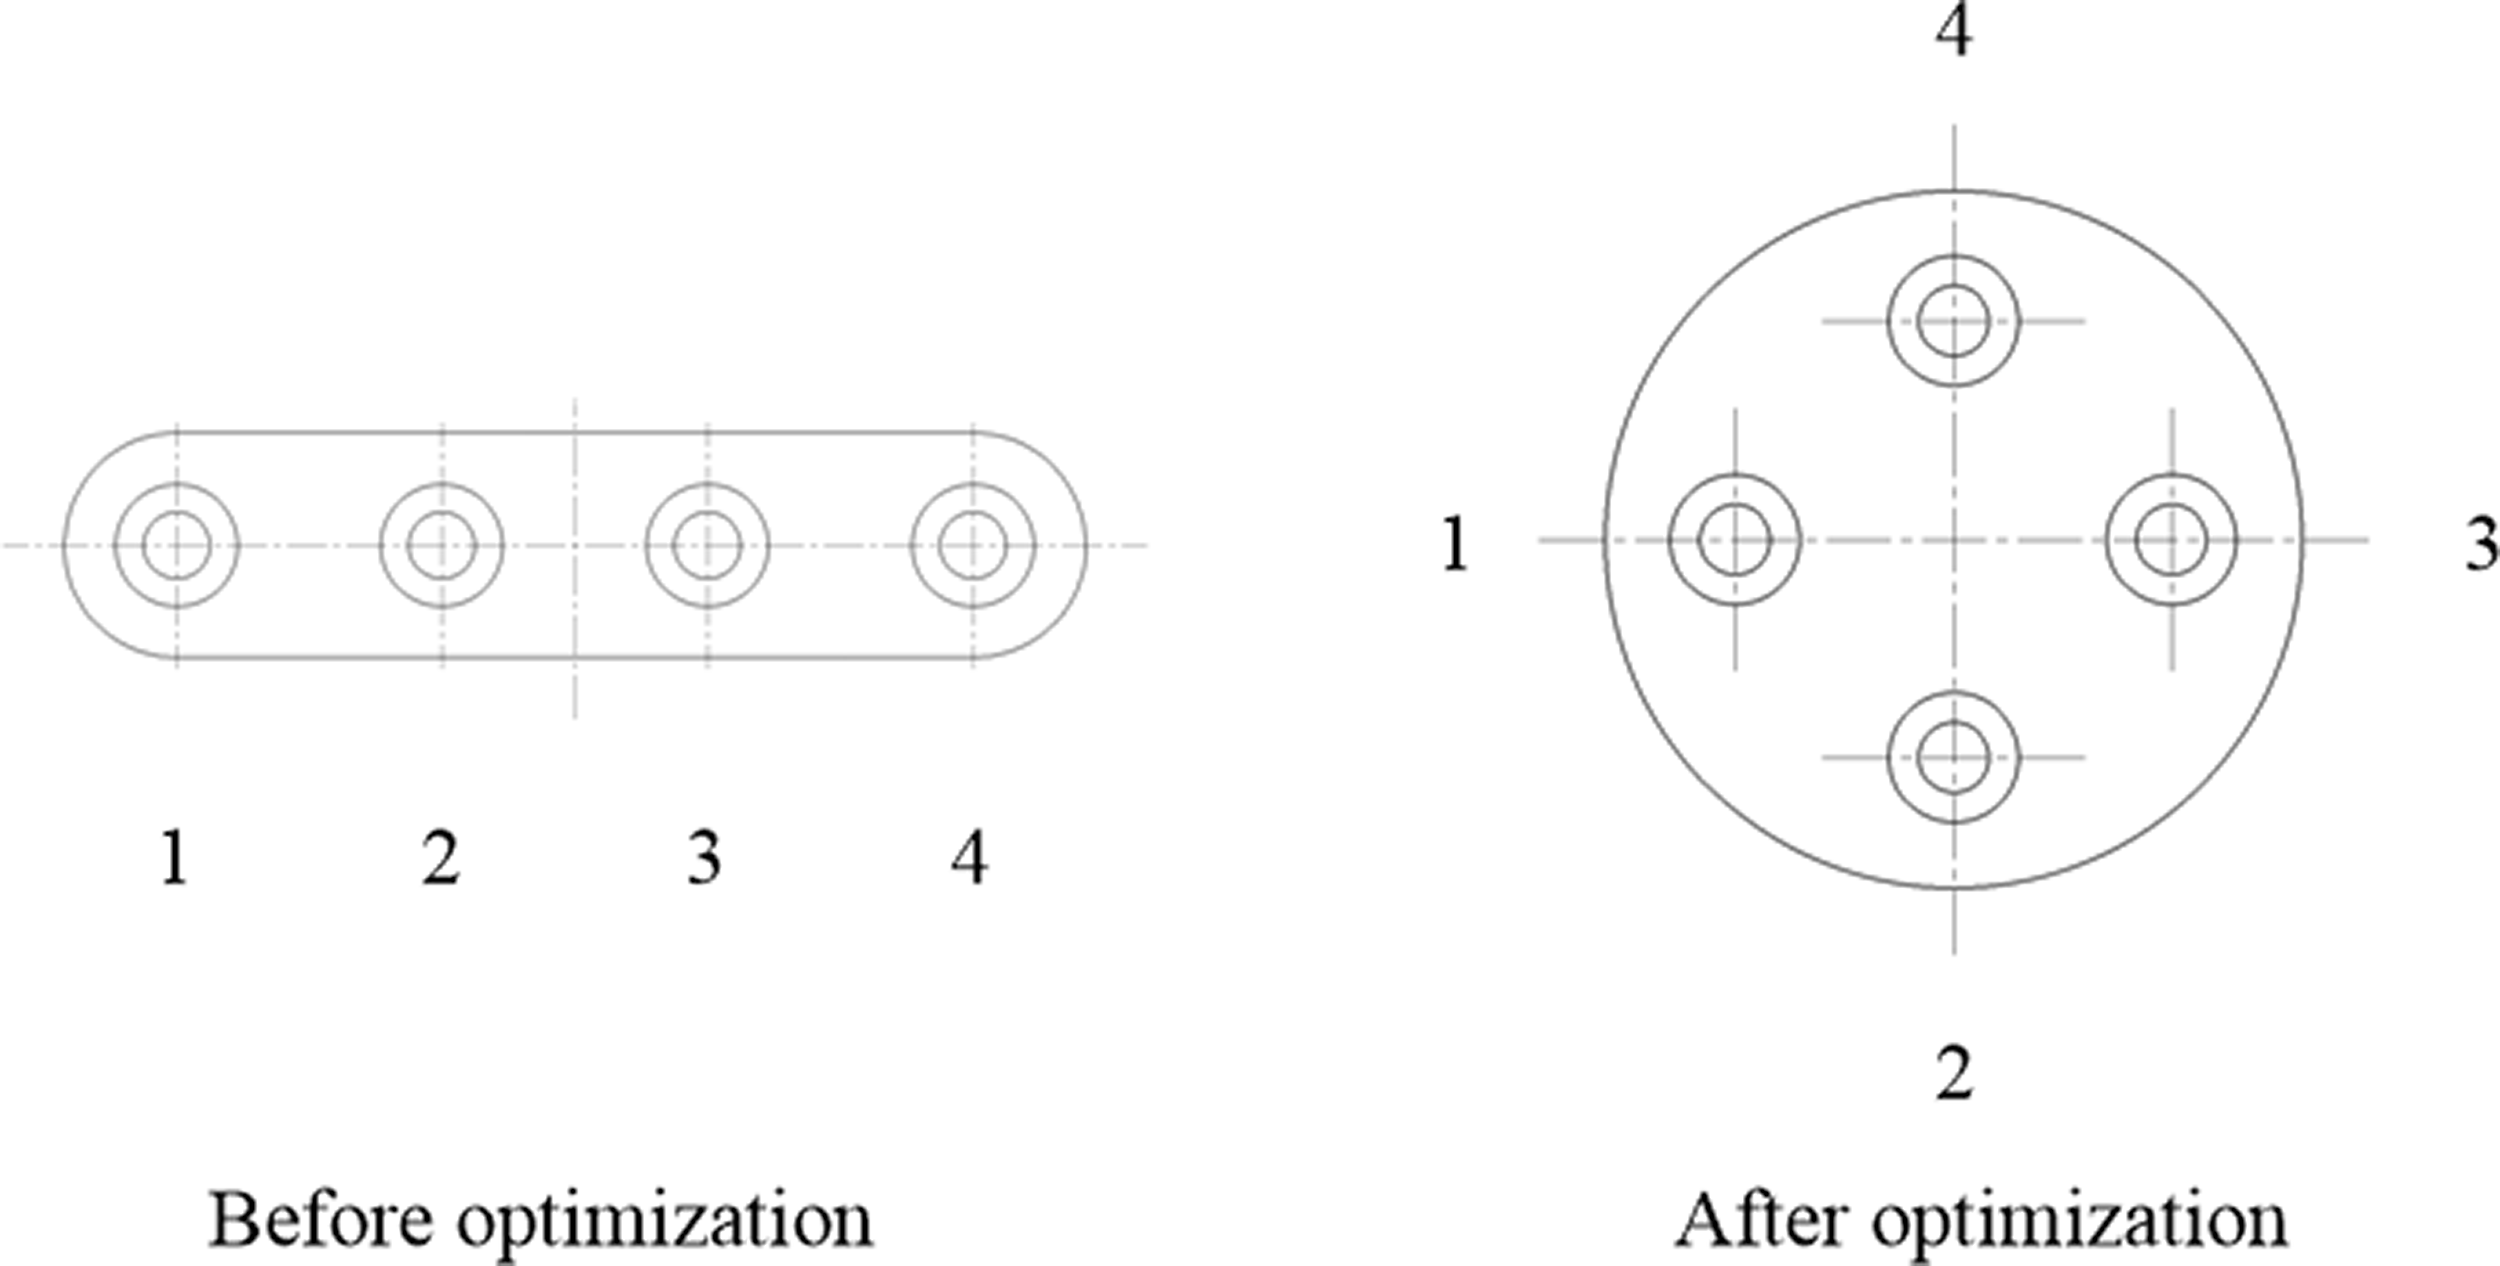
Nozzle outlet distribution before and after optimization.
Nozzle structure optimization design
Nozzle optimization analysis
There is no heat exchange between the nozzle and the outside world due to the rapid air flow in the foreign fiber sorting systems. When the friction between the inner wall and the air flow is ignored, the air flow in the nozzle can be regarded as a 1D constant variable cross-section isentropic flow. Then, according to the relationship between the flow Mach number and the cross-sectional area, the changes of the nozzle cross-sectional area and the influence law of the flow characteristics are deduced, as shown in Table 1.
Influence of nozzle cross-section area changes on air flow
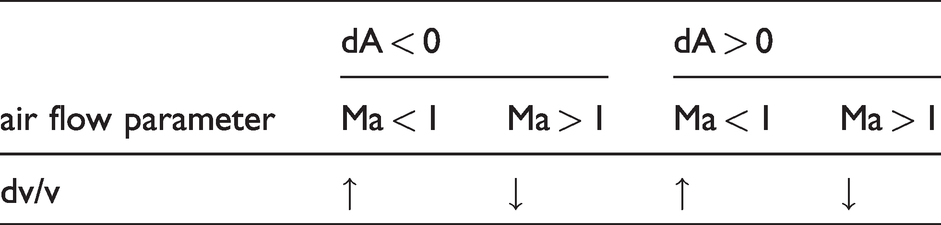
It can be seen from Table 1 that in order to reduce the nozzle air flow pressure, if the air flow is at the subsonic velocity Ma < 1, the nozzle cross-sectional area should be decreased with the increase of the flow velocity; if the supersonic velocity Ma > 1, the nozzle cross-sectional area should be increased with the increase of the flow velocity. It is pointed out that when the velocity is in the subsonic range, the nozzle with the reduced cross-sectional area should be used, and when the supersonic is reached, the nozzle with the increased cross-sectional area should be used. Since the foreign fiber elimination process needs to change from subsonic velocity to supersonic velocity, this paper adopts contraction–expansion structure. 21
The size of the nozzle was designed with the optimal elimination velocity as the initial condition, as shown in Figure 2. The optimized inner cross-section of the nozzle was divided into a contraction section OT and an expansion section TE, and the expansion section was divided into an initial expansion section TA and an expansion wave-absorption section AE. The contraction section OT was the air flow acceleration section, and the subsonic air flow was accelerated in the nozzle with the reducing cross-sectional area. After reaching the sound velocity at T, the supersonic air flow continued to accelerate in the TE section with the increasing cross-sectional area and reached the optimal elimination velocity at the outlet. The optimized inner wall of the nozzle had a streamlined structure, the curvature changed continuously, and the cross-sectional area was not abruptly changed, which effectively reduced the energy loss of the air flow during the flow. 22
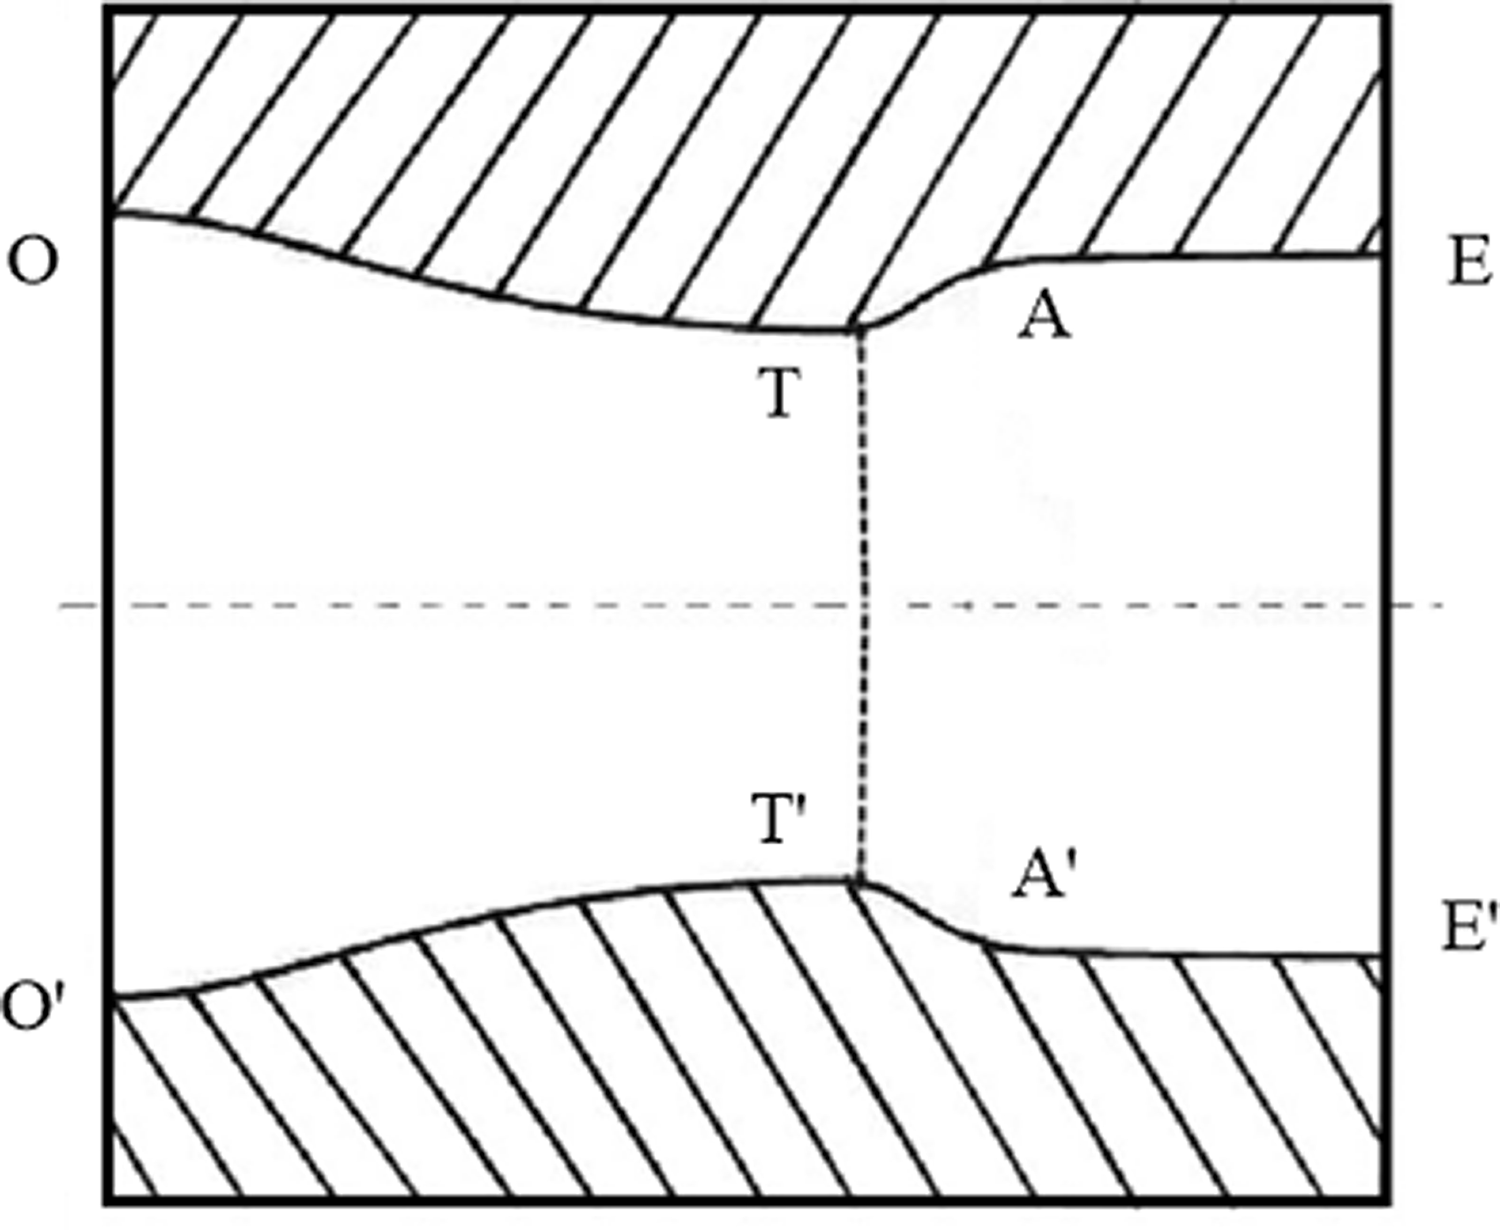
Cross-sectional view of the contraction–expansion structure of the nozzle.
Optimization design of nozzle cross-section curve
Optimization design of nozzle contraction curve
The shape of the contracted section curve of the nozzle after optimization is determined by the Witosynski formula.
23

According to the actual requirements for the operating environment of the equipment, the nozzle outlet area AE was 8.5487 mm2, the outlet pressure PE was 0.1013 MPa, and the outlet velocity vE was 400 m/s. The nozzle inlet pressure was obtained based on the pressure isentropic formula:
24

The throat diameter dT and the inlet diameter dO were calculated based on the area isentropic formula:
24

The length L of contraction section was determined by the empirical formula L = (0.5∼1.0)D, and the value is 3.5 mm.
Optimization design of nozzle expansion section curve
The expansion section included an initial expansion section TA and an expansion wave-absorption section AE, which were designed using the Foelsch method, 25 as shown in Figure 3. In order to ensure that the air flow at the nozzle outlet was parallel and uniform with the axis, the nozzle profile from throat to outlet was designed according to the method of supersonic feature line. The expansion section included an initial expansion section TA and an expansion wave-absorption section AE, and point A was called the turning point. The point M was a random point on the feature line AB, the angle β was its inclination angle, and the maximum curvature was obtained at point A.
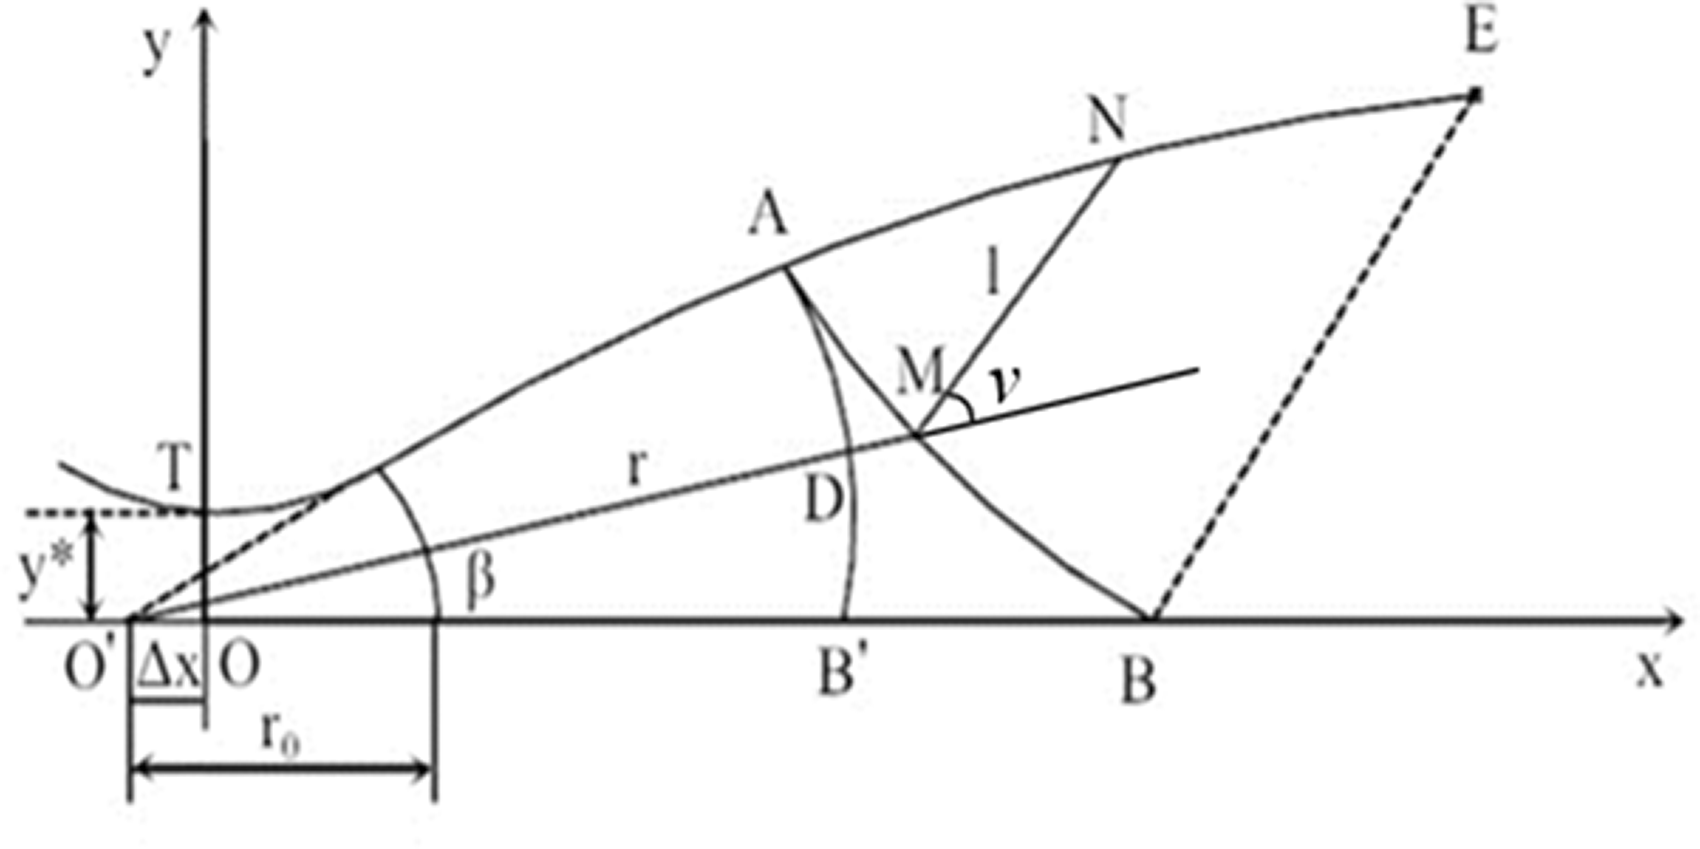
Nozzle contour diagram based on Foelsch analytical method: (a) before optimization; (b) after optimization.
According to the Foelsch method, when the air passes through the initial expansion section, a uniform air flow is formed at the end, so the empirical curve design is adopted between the throat T and turning point A.
26

When determining the shape of the feature line AB, the angle β of the random point M on the AB line was determined by equation (5), and the length r was determined by equation (6).


The air flow deflects after passing through the feature line AB, and the deflection angle ν is determined by equation (7).

The curve of the AE section was calculated, and the coordinates of the point N on the AE line segment can be obtained based on formula (8) and formula (9).
27


Since the nozzle was designed according to the non-viscous flow, and in reality, due to the viscosity of the air, there was boundary layer flow of the nozzle flow in the vicinity of the wall, the boundary layer correction was required.
28
The correction was made using equation (10).

After optimization, the length of the contraction section was 3.5 mm, the length of the initial expansion section was 0.5754mm, the length of the expansion wave-absorption section was 1.9441 mm, the inlet diameter was 3.724 mm, the throat diameter was 2.2618 mm, and the outlet diameter was 3.344 mm. The total length of the nozzle was shortened by 5.8805 mm, which reduced the production cost and weight, and optimized the quality of the flow field.
Numerical simulation results and analysis
Parameter setting
This paper used SolidWorks for modeling, ICEM software for meshing, and importing the mesh into Fluent for solving. The fluid was turbulent based on the Reynolds number. We used the standard k–ε model, proposed by Launder and Spalding,
29
and the expression is as follows:



Nozzle optimization simulation
In order to verify the performance of the optimized nozzle, the stepped nozzle and the contraction–expansion nozzle were compared and analyzed through simulation.
Analysis of velocity vector charts before and after nozzle optimization
The changes of the nozzle outlet velocity vector before and after optimization are shown in Figure 4. It can be seen that the air flow of the nozzles on both sides and the middle is different before optimization, the air flow volume of the middle nozzles is relatively large, and the nozzles were closer to the inlet. The air flow of each nozzle tended to be uniform, which was beneficial to eliminate the foreign fibers in cotton after optimization. The changes of the single nozzle outlet velocity vector before and after optimization are shown in Figure 5. This single nozzle outlet is the middle nozzle because the nozzle outlet with higher velocity vector needs to be studied. It can be seen that the velocity changes dramatically before optimization, and the velocity at the exit is 355.2 m/s. The velocity changes uniform after optimization, and the exit velocity is 371.8 m/s.
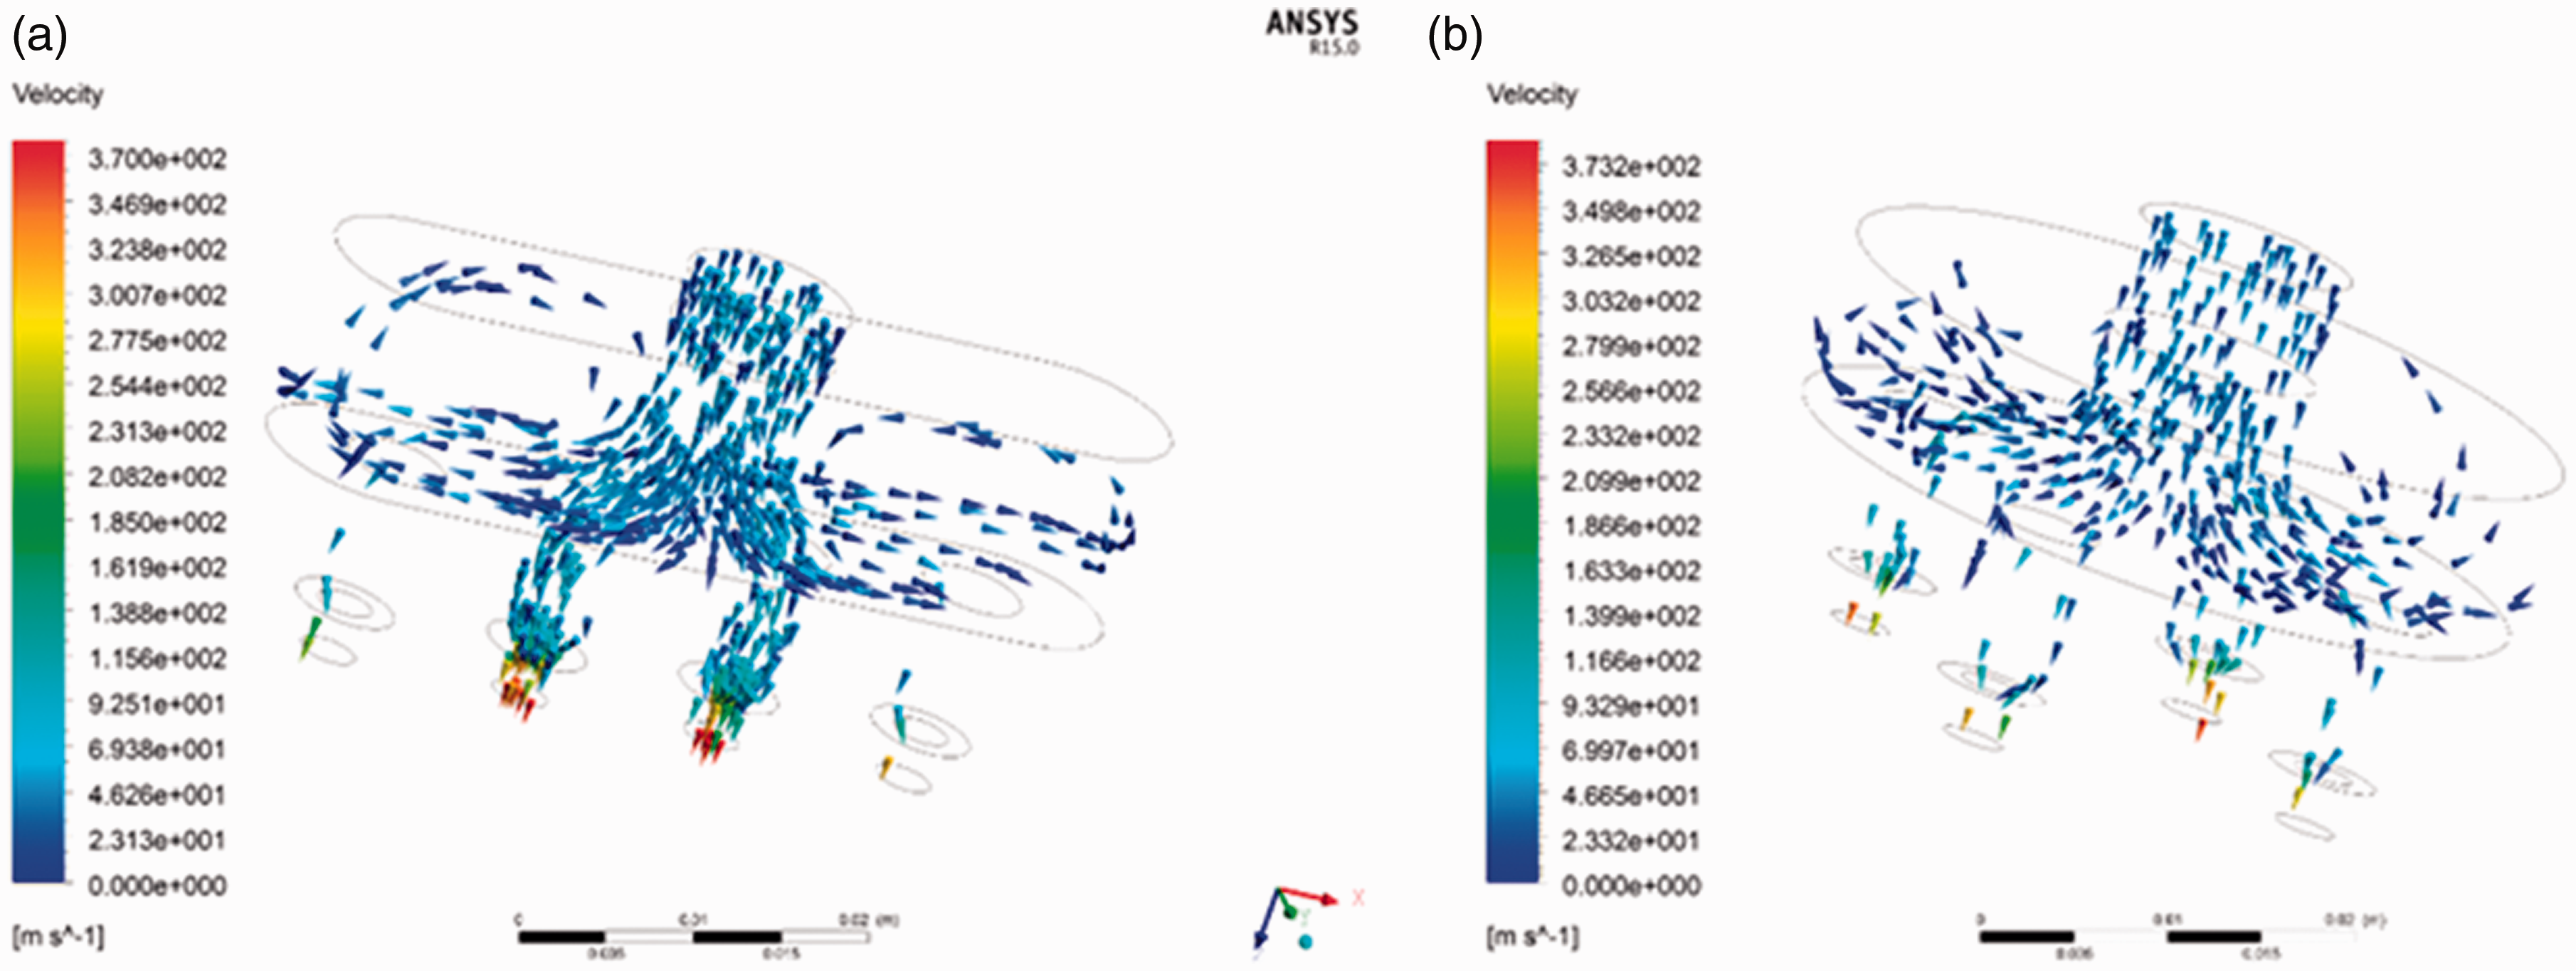
Velocity vector charts of the nozzle before and after optimization: (a) before optimization; (b) after optimization.
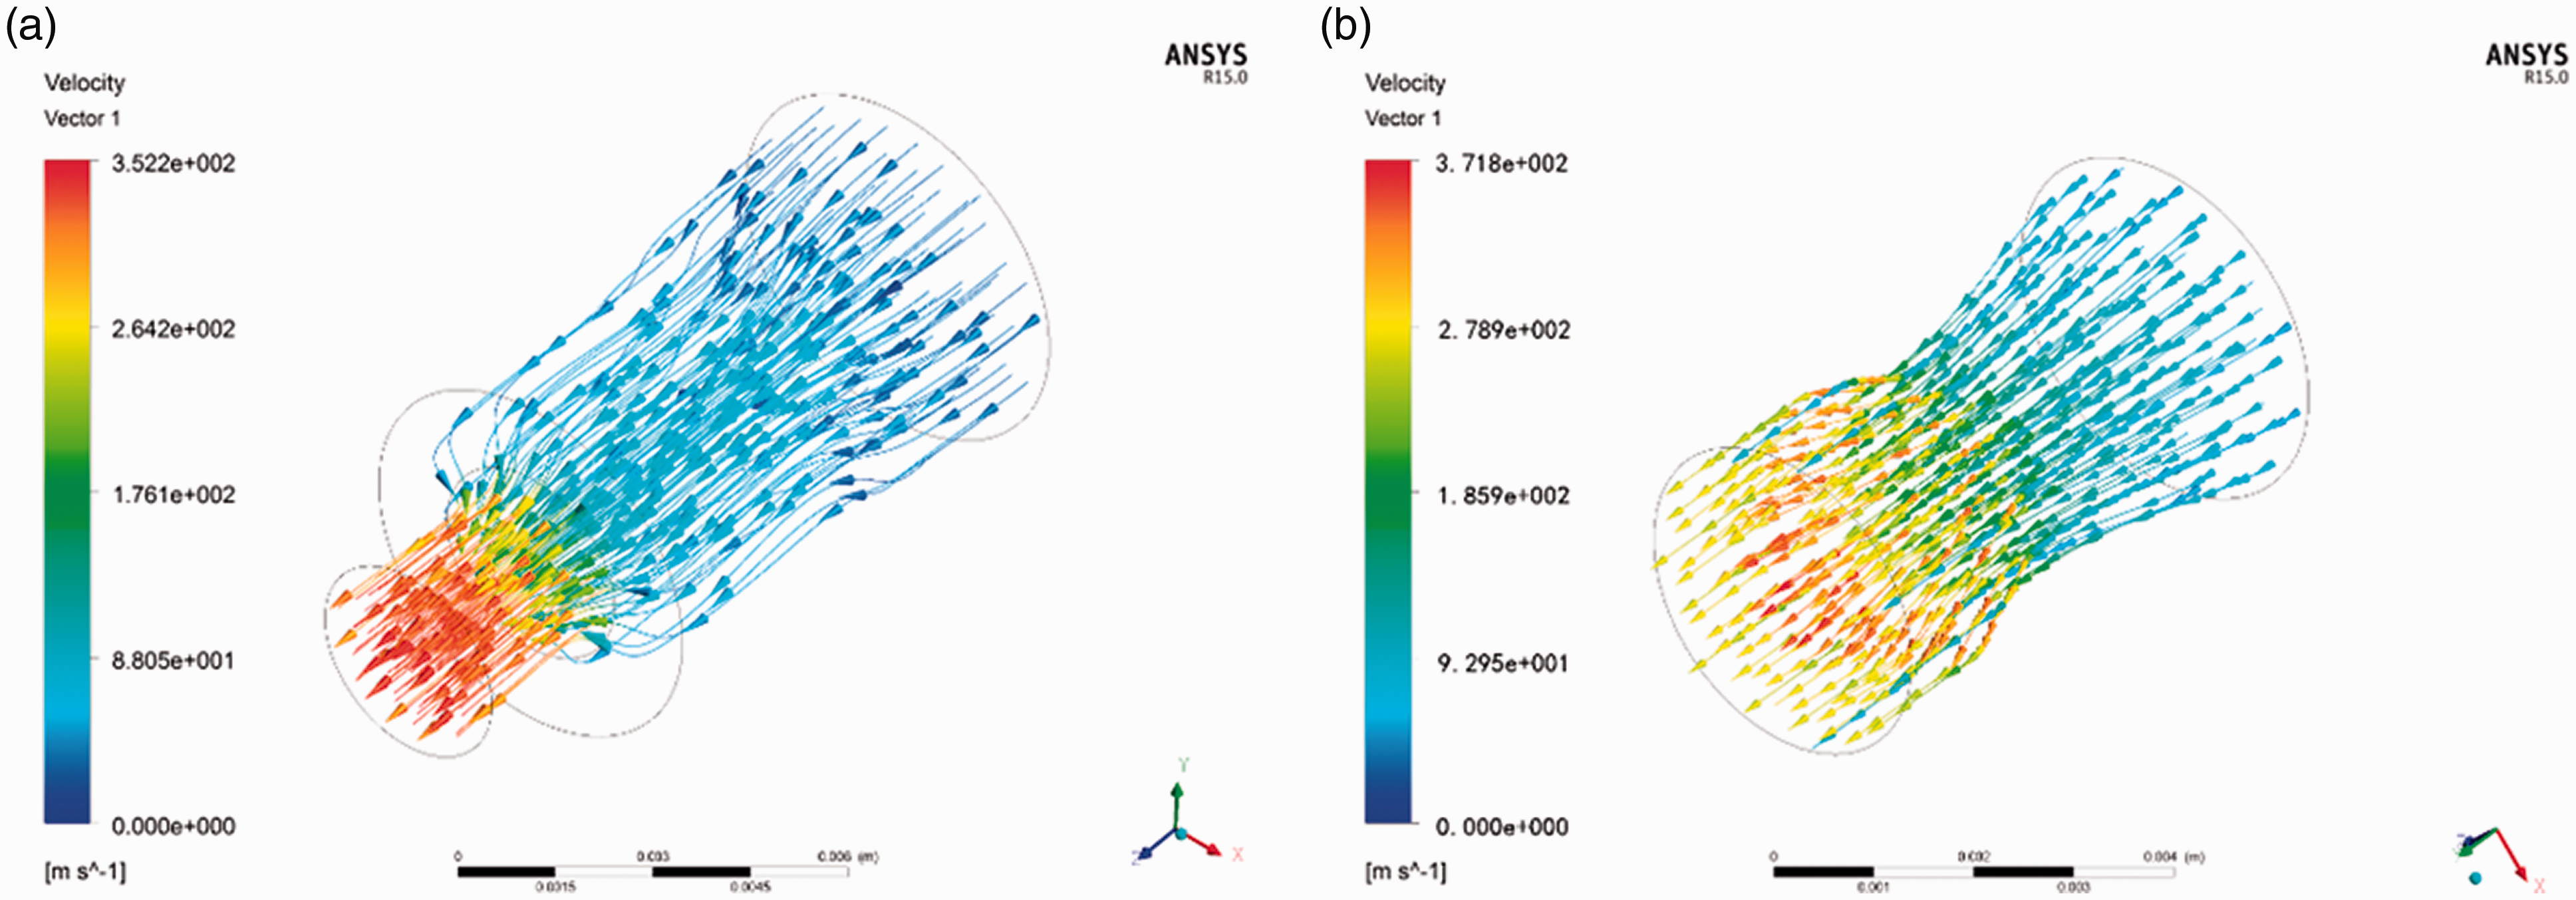
Velocity vector charts of single nozzle before and after optimization: (a) before optimization; (b) after optimization.
Analysis of nozzle velocity nephograms before and after optimization
The changes of the nozzle cross-sectional velocity nephograms before and after optimization are shown in Figure 6. The depth of the color in the figure was related to the flow velocity, where the darker the color indicates the greater the flow velocity. After optimization, the velocity nephograms of the four outlets of the nozzle had the same color pattern, indicating that the velocity is uniform. The nozzle velocity effect after optimization was obviously better than the effect before optimization, which was beneficial to improve the foreign fiber eliminating rate and reduce energy loss. The changes of the single nozzle cross-sectional velocity nephograms before and after optimization are shown in Figure 7. This single nozzle outlet is the middle nozzle because the nozzle outlet with higher velocity nephogram needs to be studied. It can be seen that the velocity continues to increase due to the pressure difference at the inlet and outlet, and the growth rate is the highest where the cross-sectional area changed before optimization. However, the velocity nephogram of single nozzle changes uniform after optimization, reducing the possibility of velocity sudden change.
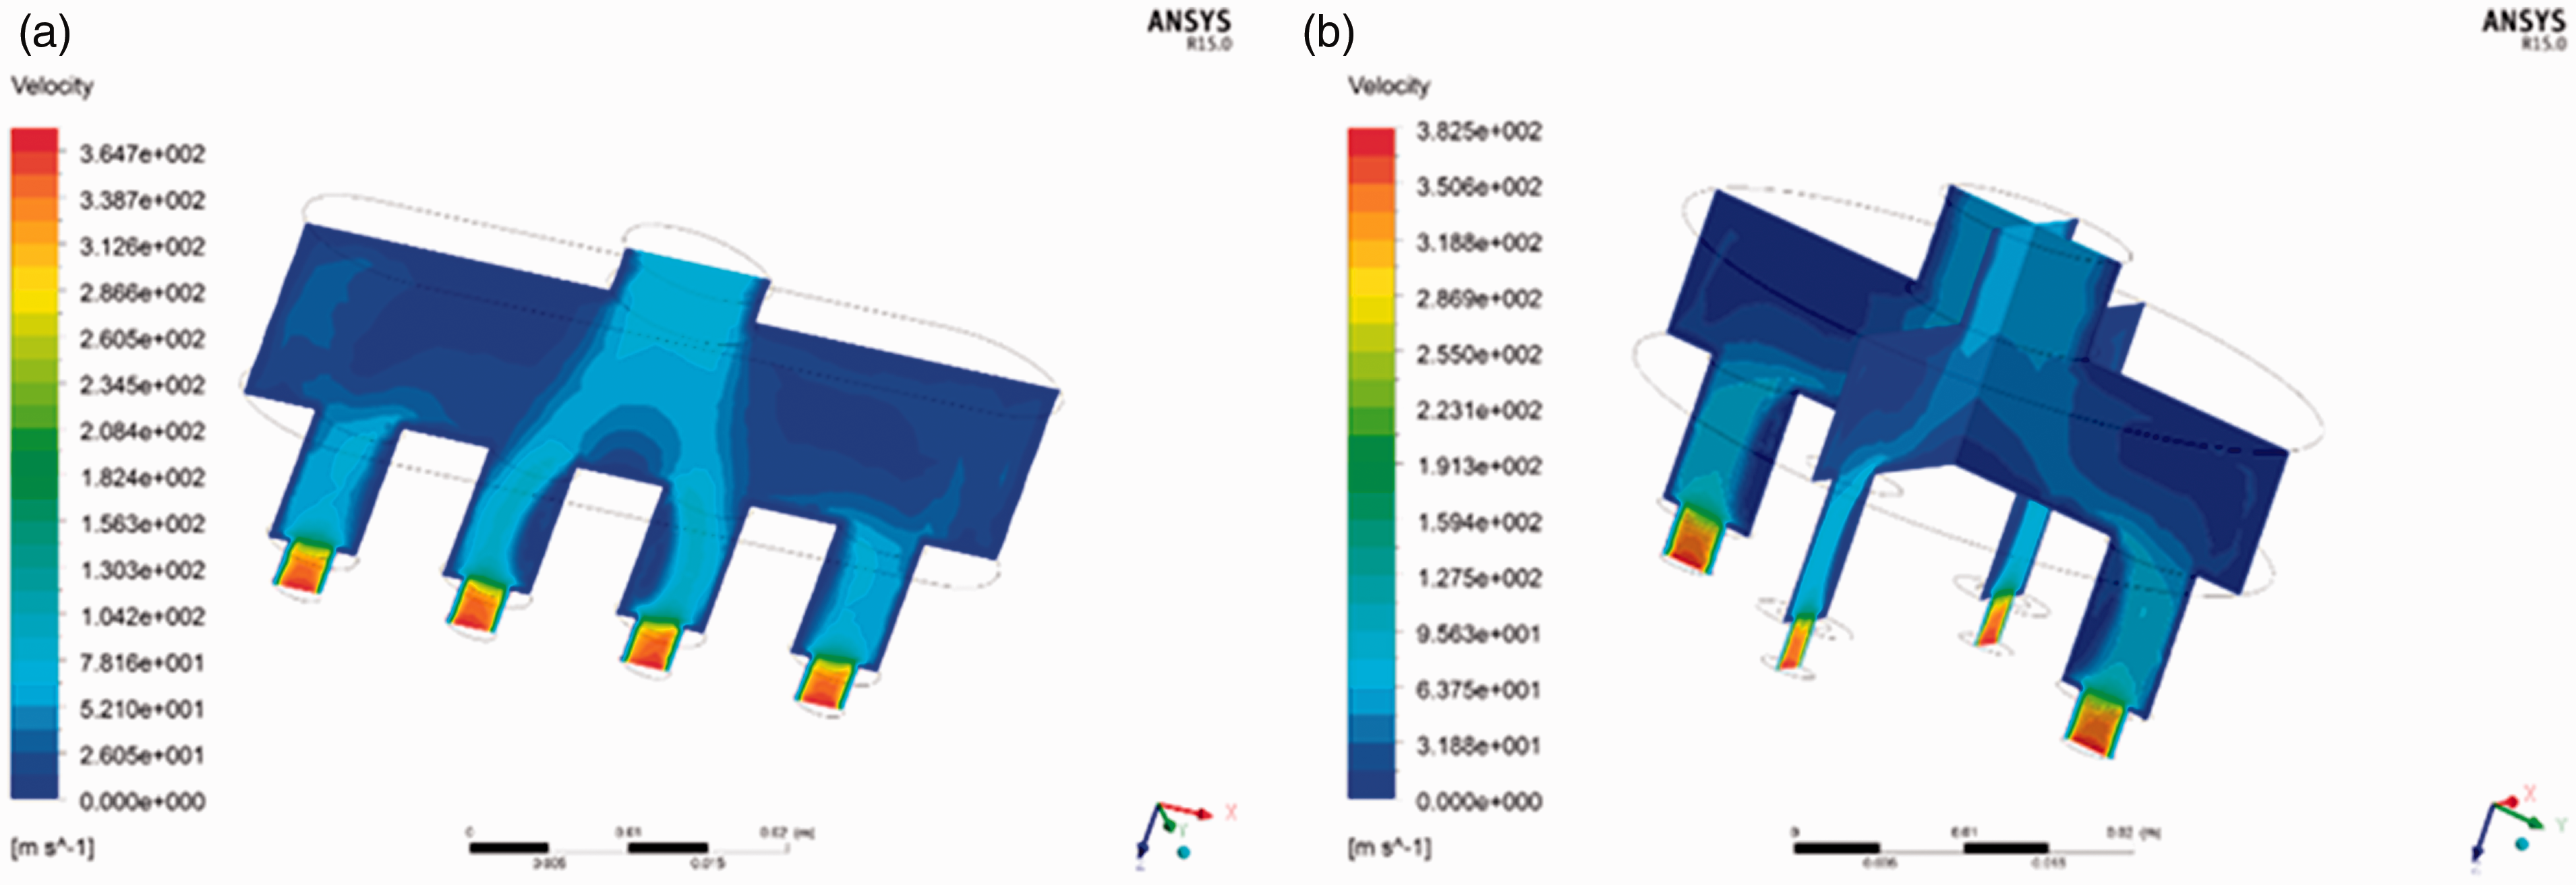
Velocity nephograms of nozzle before and after optimization: (a) before optimization; (b) after optimization.
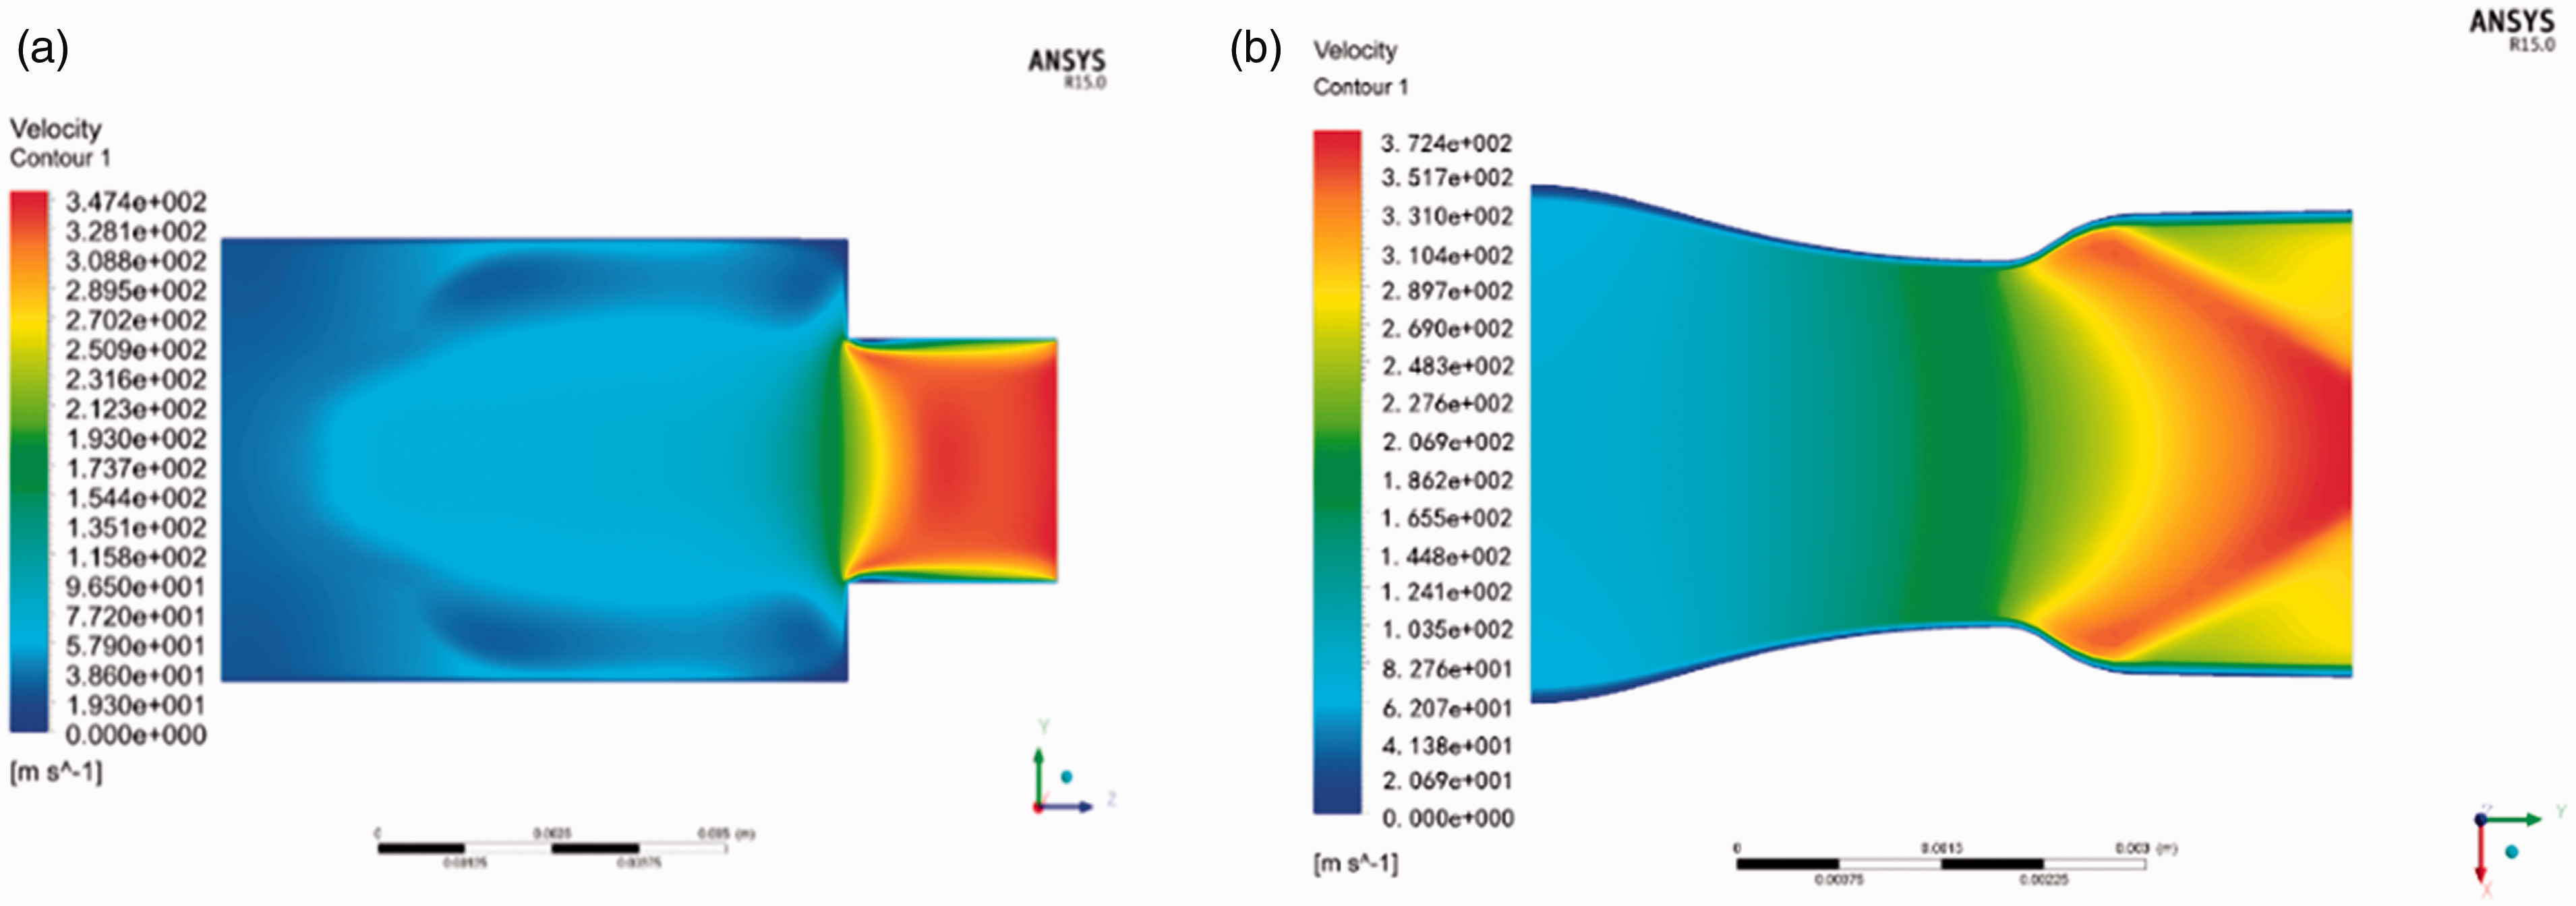
Velocity nephograms of single nozzle before and after optimization: (a) before optimization; (b) after optimization.
Analysis of nozzle pressure before and after optimization
The changes of the nozzle pressure nephograms before and after optimization are shown in Figure 8. The depth of the color in the figure is related to the pressure, where the darker the color indicates the greater the pressure. We can see that there was a high-pressure center in the middle part of the nozzle plate before optimization, which produces different pressure on the four nozzles, and the pressure of the two nozzles on both sides is significantly lower than the middle part. However, the optimized nozzle outlets have the same color depth, which means that the pressure distribution is uniform, and benefits to eliminate foreign fibers. The changes of the single nozzle pressure nephograms before and after optimization are shown in Figure 9. This single nozzle outlet is the middle nozzle because the nozzle outlet with higher pressure needs to be studied. After optimization, the pressure change of the nozzle was relatively gentle, and the energy loss was small. The optimized inlet nozzle required less inlet pressure at the same inlet, outlet velocity, and diameter.
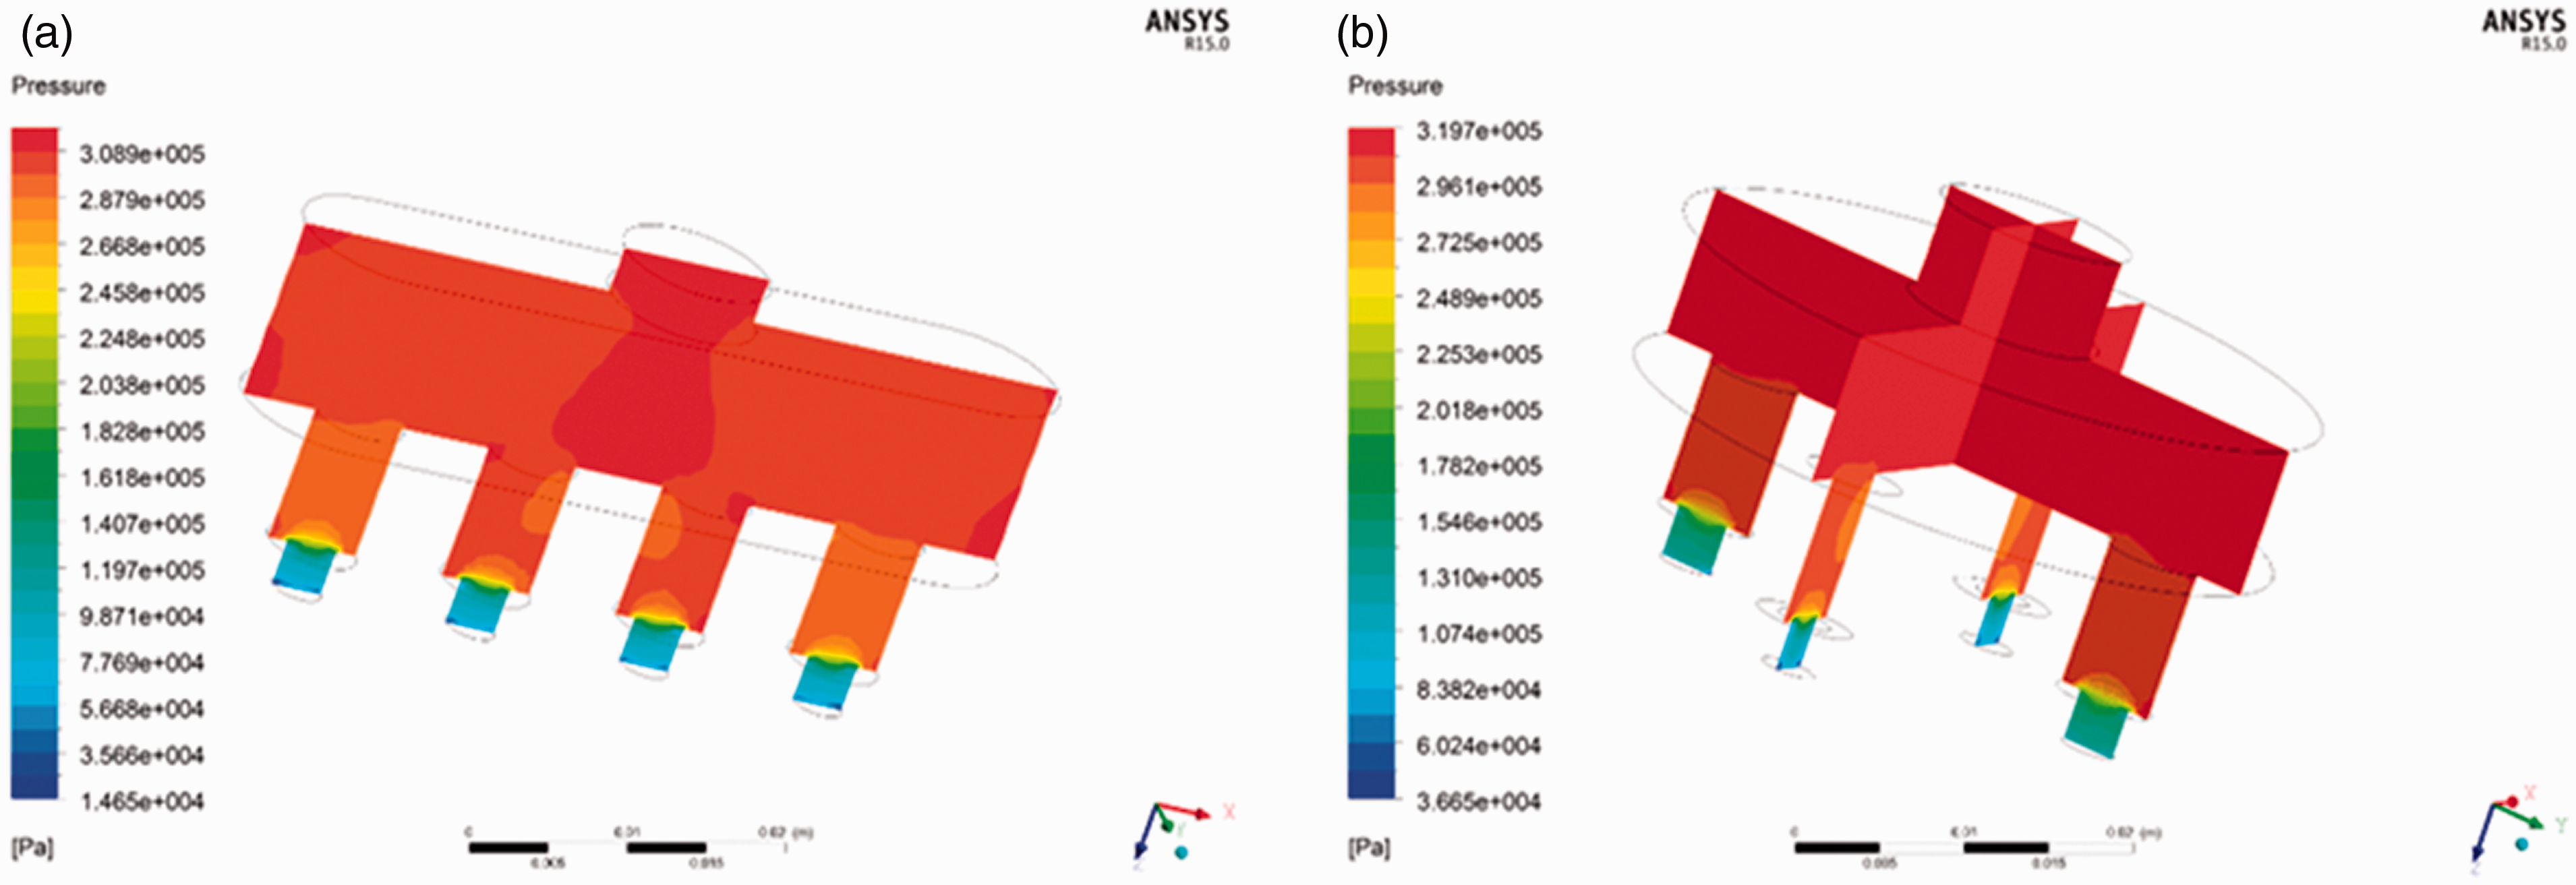
Pressure nephograms of nozzle before and after optimization: (a) before optimization; (b) after optimization.
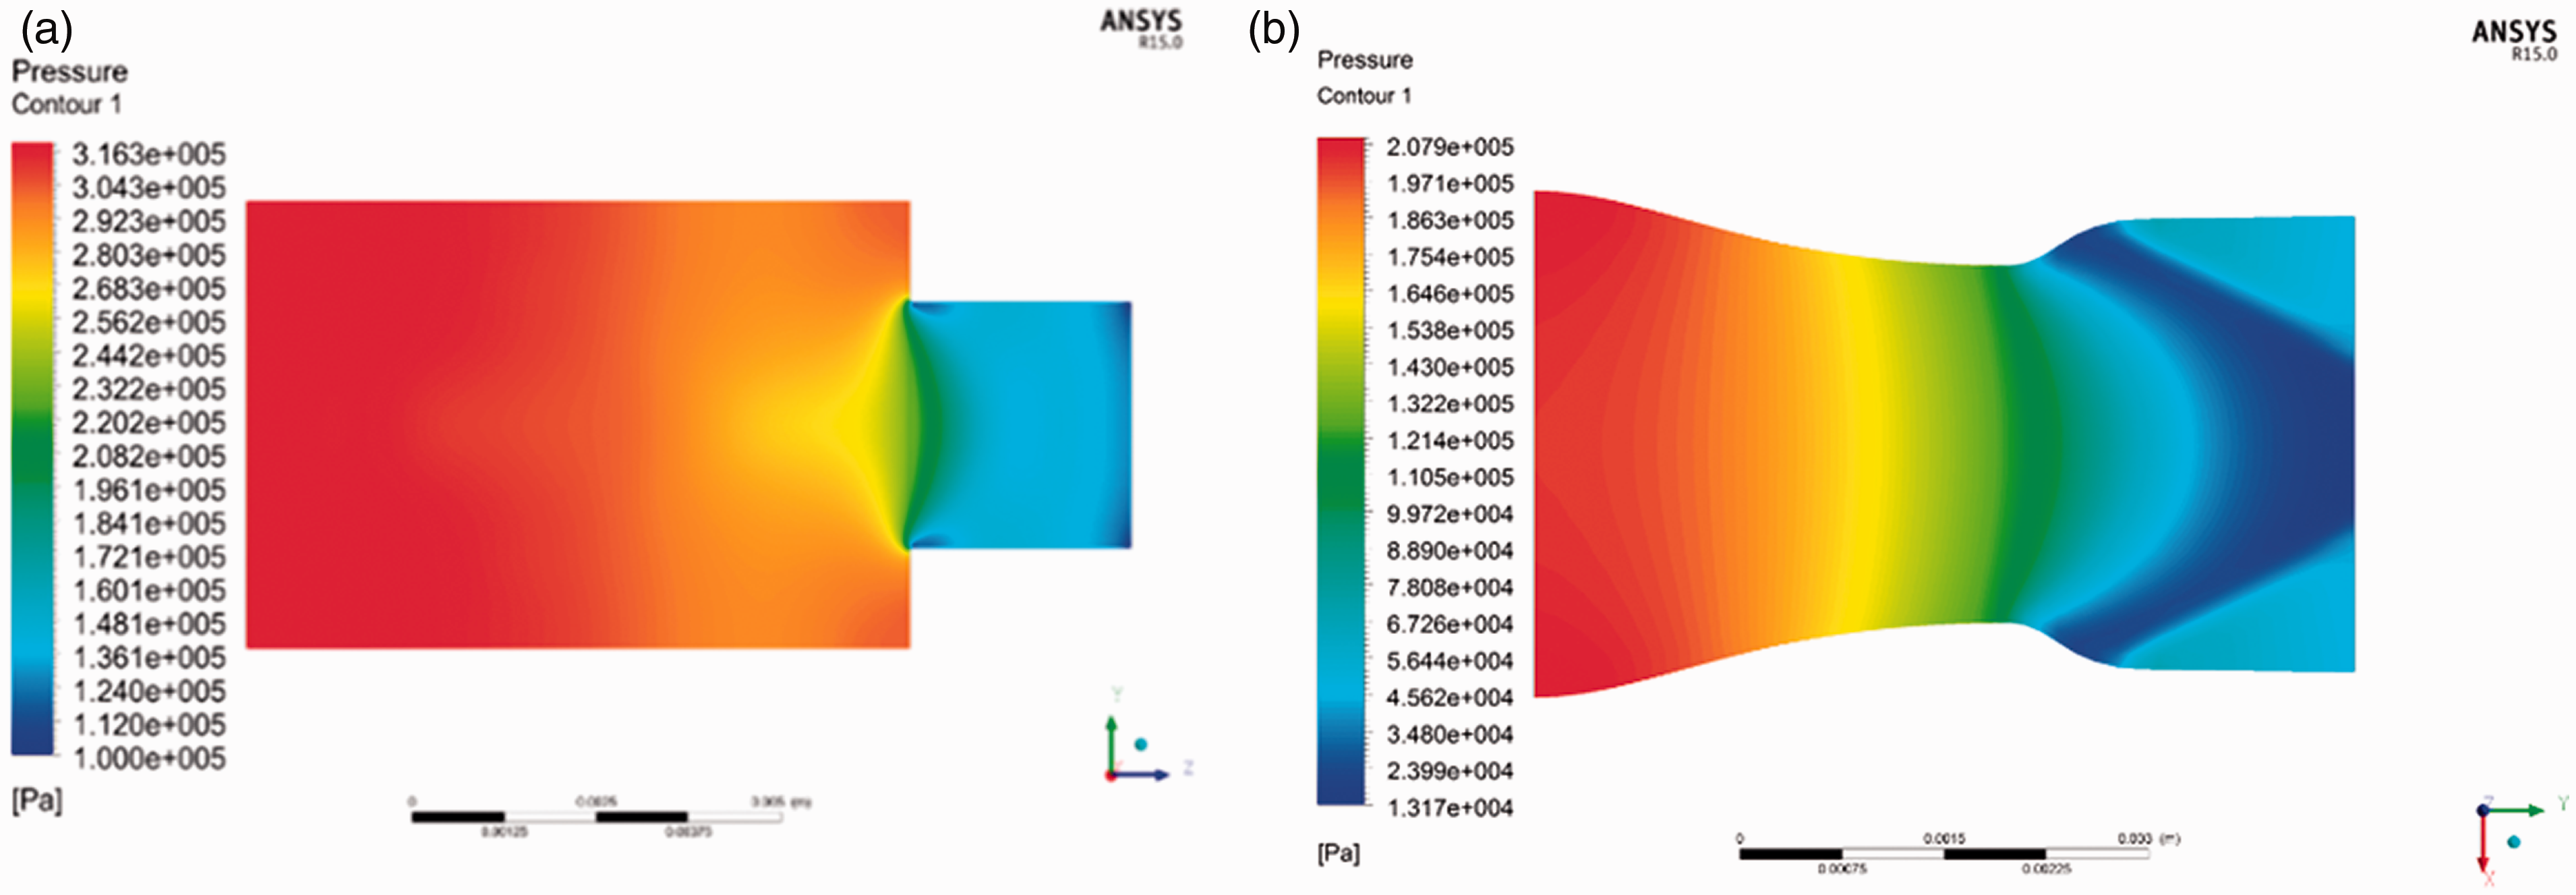
Pressure nephograms of single nozzle before and after optimization: (a) before optimization; (b) after optimization.
Analysis of turbulent kinetic energy nephograms before and after nozzle optimization
The changes of the nozzle turbulent kinetic energy nephograms before and after optimization are shown in Figure 10. The larger turbulent kinetic energy was mainly concentrated at the diameter-changing area of the outlet part of the nozzles, but the turbulent kinetic energy of the nozzle before and after optimization was different. The turbulent kinetic energy on both sides of the nozzle was obviously greater than the middle part before optimization, and the turbulent kinetic energy of the four outlets was more uniform after optimization. The changes of the single nozzle turbulent kinetic energy nephograms before and after optimization are shown in Figure 11. This single nozzle outlet is the middle nozzle because the nozzle outlet with higher turbulent kinetic energy nephogram needs to be studied. It can be seen that the turbulent flow energy in the single nozzle is large at the outlet after optimization, and the maximum is 5.875 × 10³ J/kg.
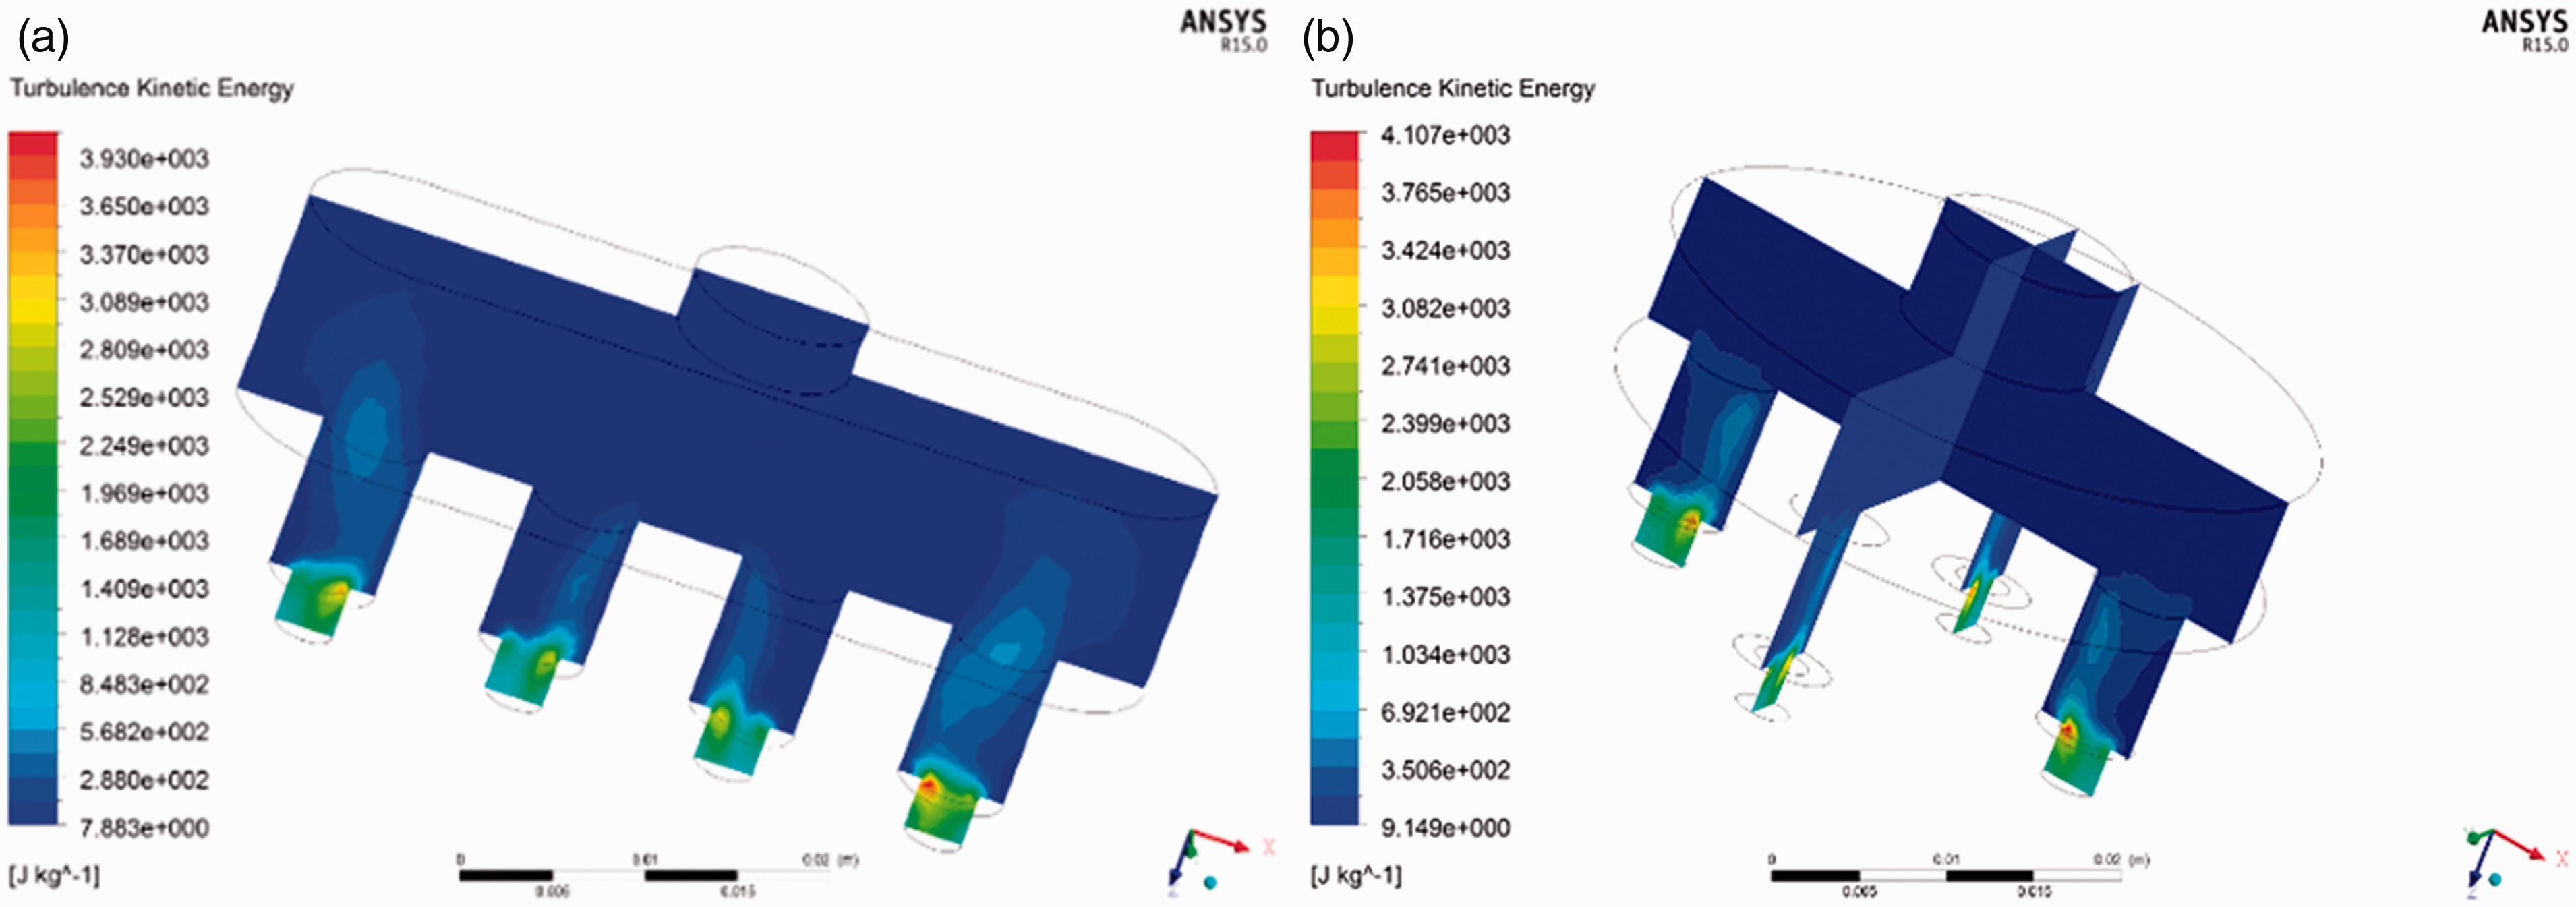
Turbulent kinetic energy nephograms of nozzle before and after optimization: (a) before optimization; (b) after optimization.
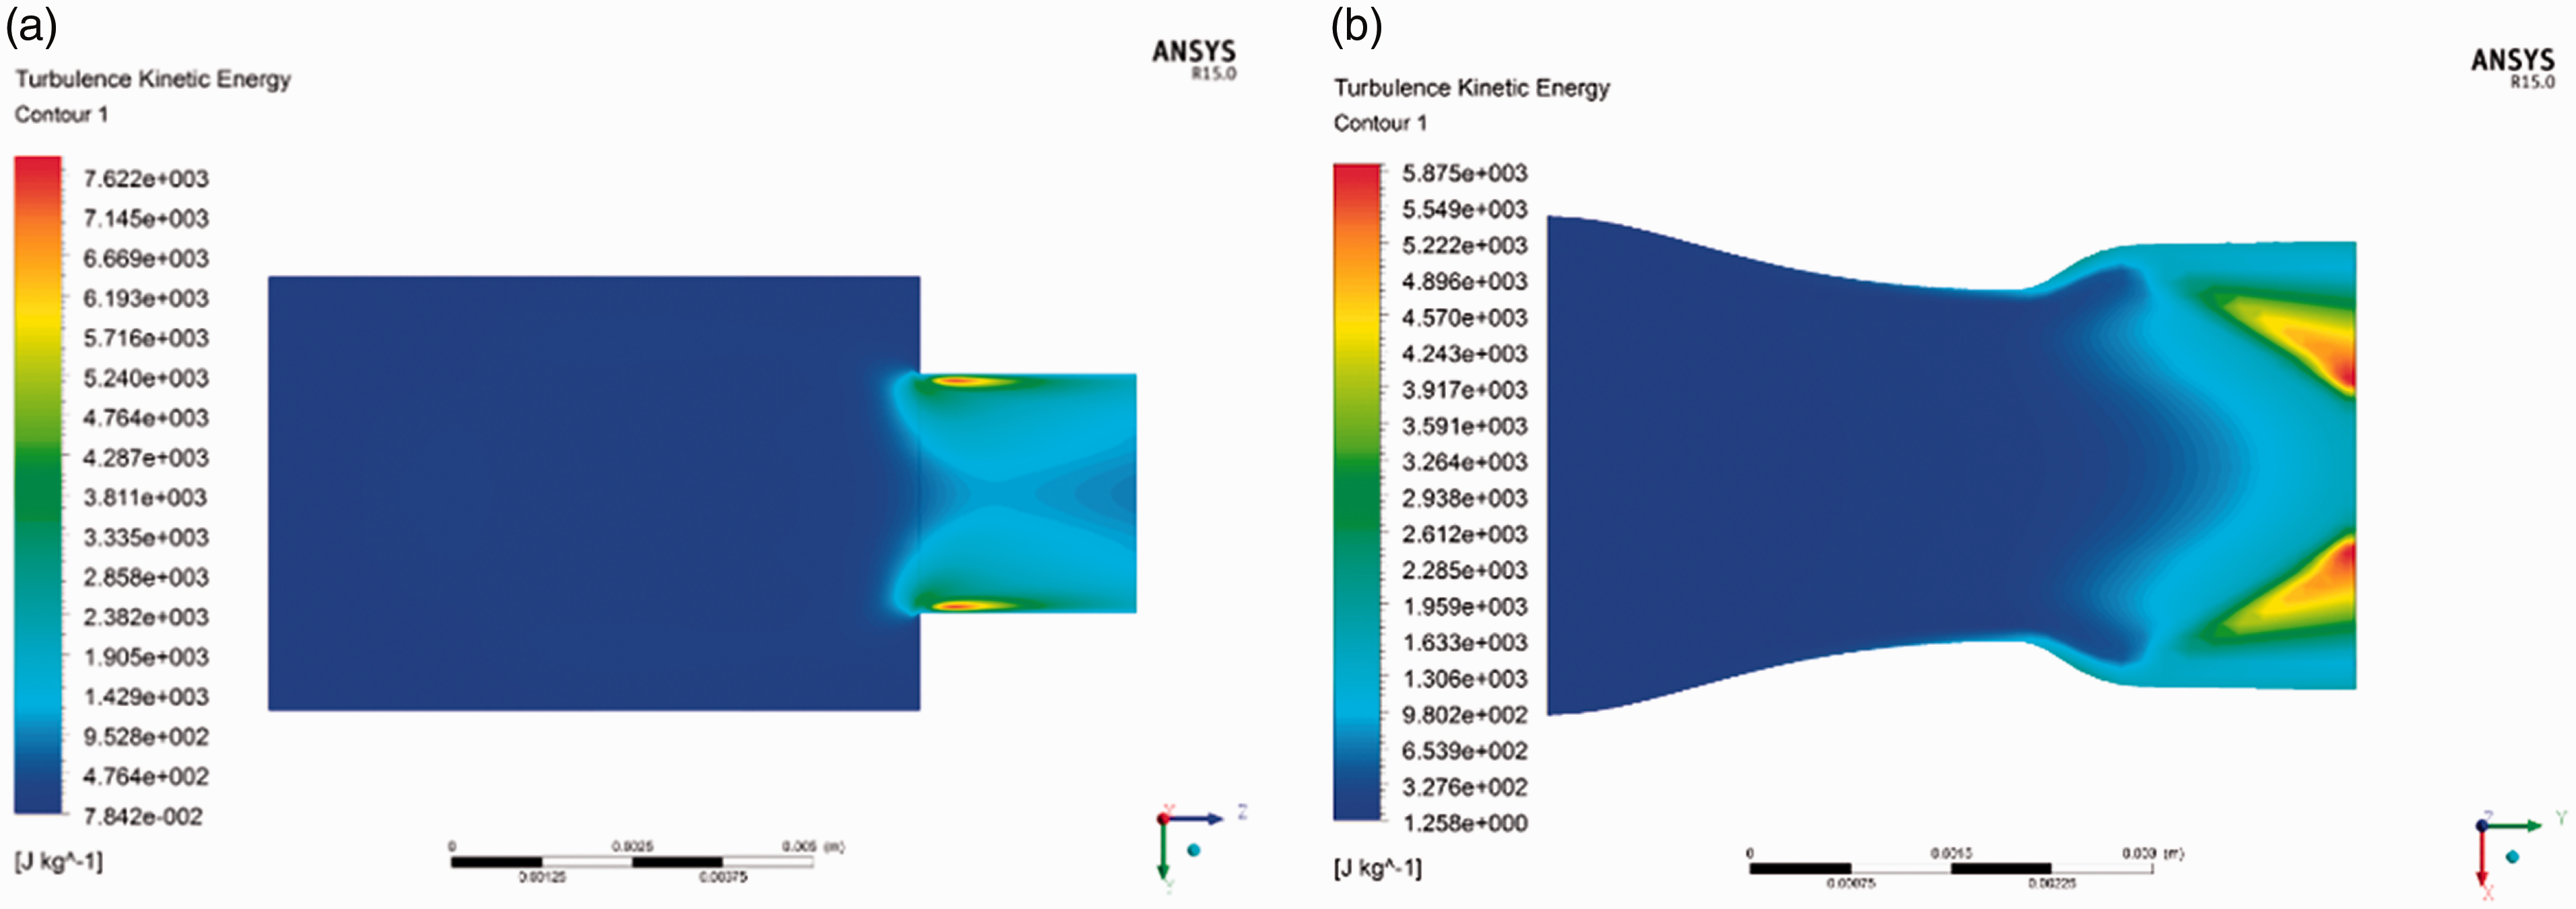
Turbulent kinetic energy nephograms of single nozzle before and after optimization: (a) before optimization; (b) after optimization.
Through the optimization of the nozzle outlet, the optimized nozzle outlet flow velocity was uniform, the spray force generated was also relatively uniform, and the energy loss was smaller. Thus, this showed that the optimized nozzle is more beneficial to eliminate foreign fibers and improving work efficiency.
Analysis of nozzle axial velocity before and after optimization
Considering the influence on the nozzle axis velocity before and after the optimization, the nozzle center axis was used as the observation line, the velocity of each point on the axis was obtained by CFD-Post, and a velocity curve was generated.
The changes of the velocity curve of the nozzles’ central axis before and after optimization are shown in Figure 12. It can be seen that there are three stages before optimization. The slow growth in the initial stage was due to the larger diameter of the nozzle. Then, since the change of the nozzle diameter at the step and the sudden decrease of the cross-sectional area, the air flow velocity increased. There was the largest slope corresponds to the position of the nozzle step change, and the slope was the largest at 9 mm. Finally, the nozzle axis velocity fluctuated within a certain range. When the velocity increased to 340 m/s, due to the sudden change in the cross-sectional area, the air flow collided with the inner wall of the nozzle to produce a part of the reverse air flow, causing the velocity to drop. When the velocity was reduced to 329.2 m/s, there was a slight increase afterwards. After optimization, the velocity of the air flow in the nozzle was always rising, and there was no sudden increase in the slope, which was conducive to the continuous and effective operation of the nozzle. The optimized initial velocity was more than 100 m/s, and the optimization was significantly higher than the optimized velocity, which was beneficial to reduce energy loss and improve work efficiency. Moreover, when the air flow was smoothly accelerated to the sound velocity in the contraction nozzle, the supersonic air flow velocity continued to increase to the intended Mach number at the outlet in the subsequent expansion section.
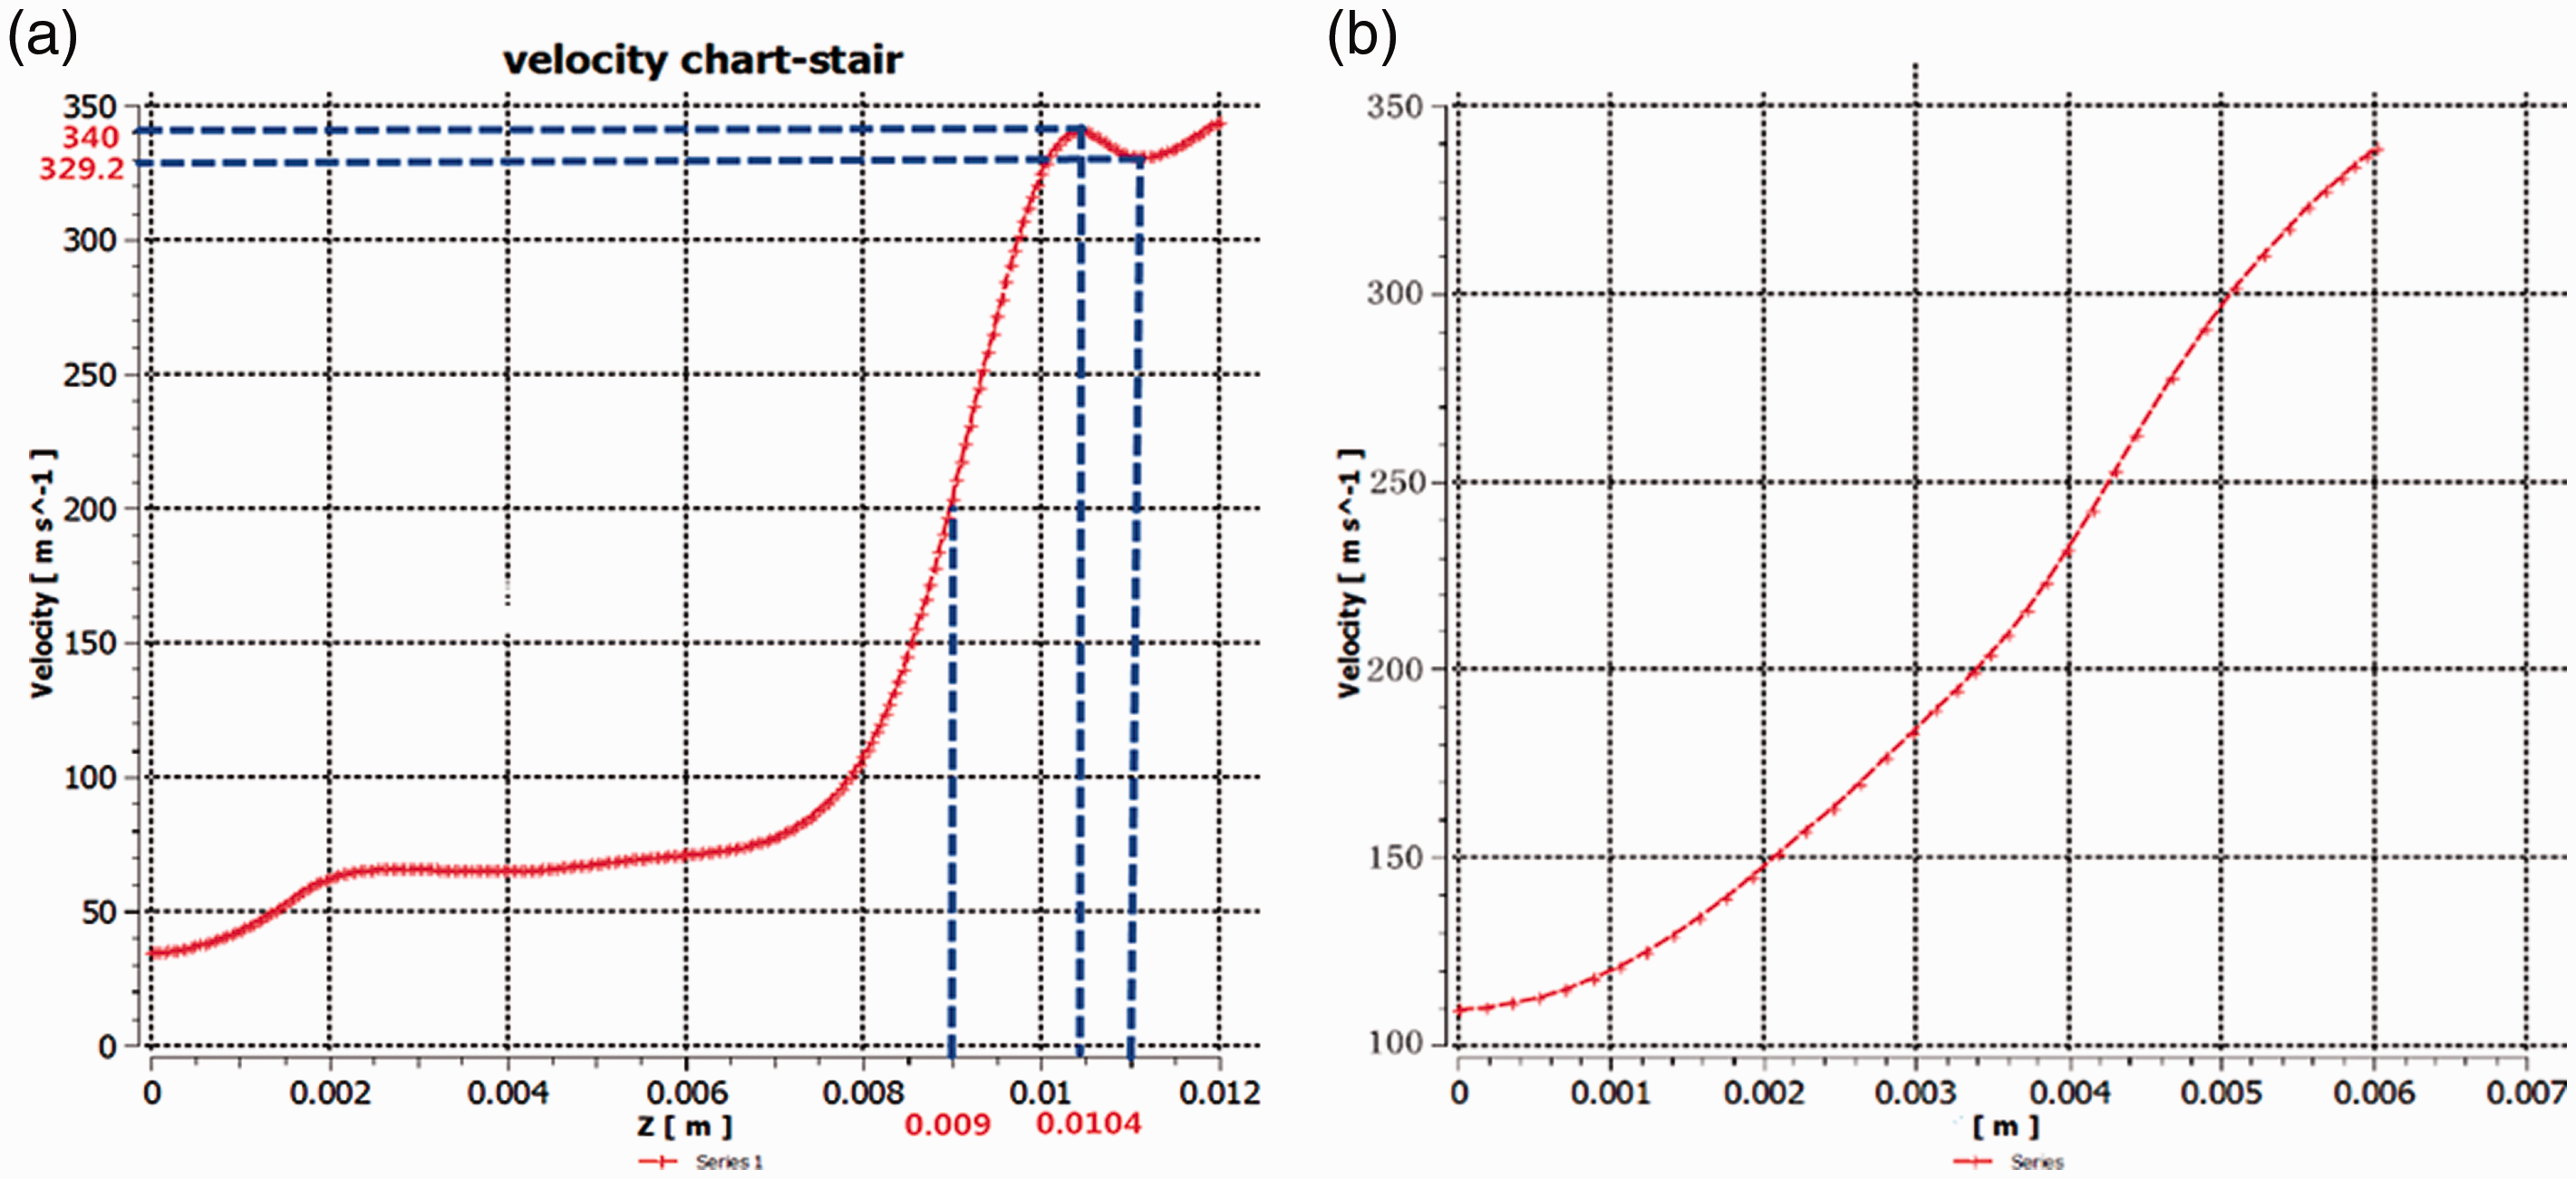
Comparison graph of nozzle axial velocity before and after optimization. (a) Before optimization and (b) after optimization.
Experimental analysis of the velocity before and after nozzle optimization
Nozzle measurement experiment platform
In order to verify the changes of the nozzle axis velocity before and after the optimization, a simple experimental device was designed, as shown in Figure 13. The experimental device includes a nozzle plate model, a time relay, a pressure regulating filter, an air compressor, an air cylinder, a pitot tube velocity-meter and a lead screw platform. The air pressure is adjusted by the pressure regulating filter, the pitot tube velocity-meter is used to measure the flow velocity of the air flow from the nozzle, and the distance between the pitot tube velocity meter and the nozzle outlet is adjusted through the screw device.
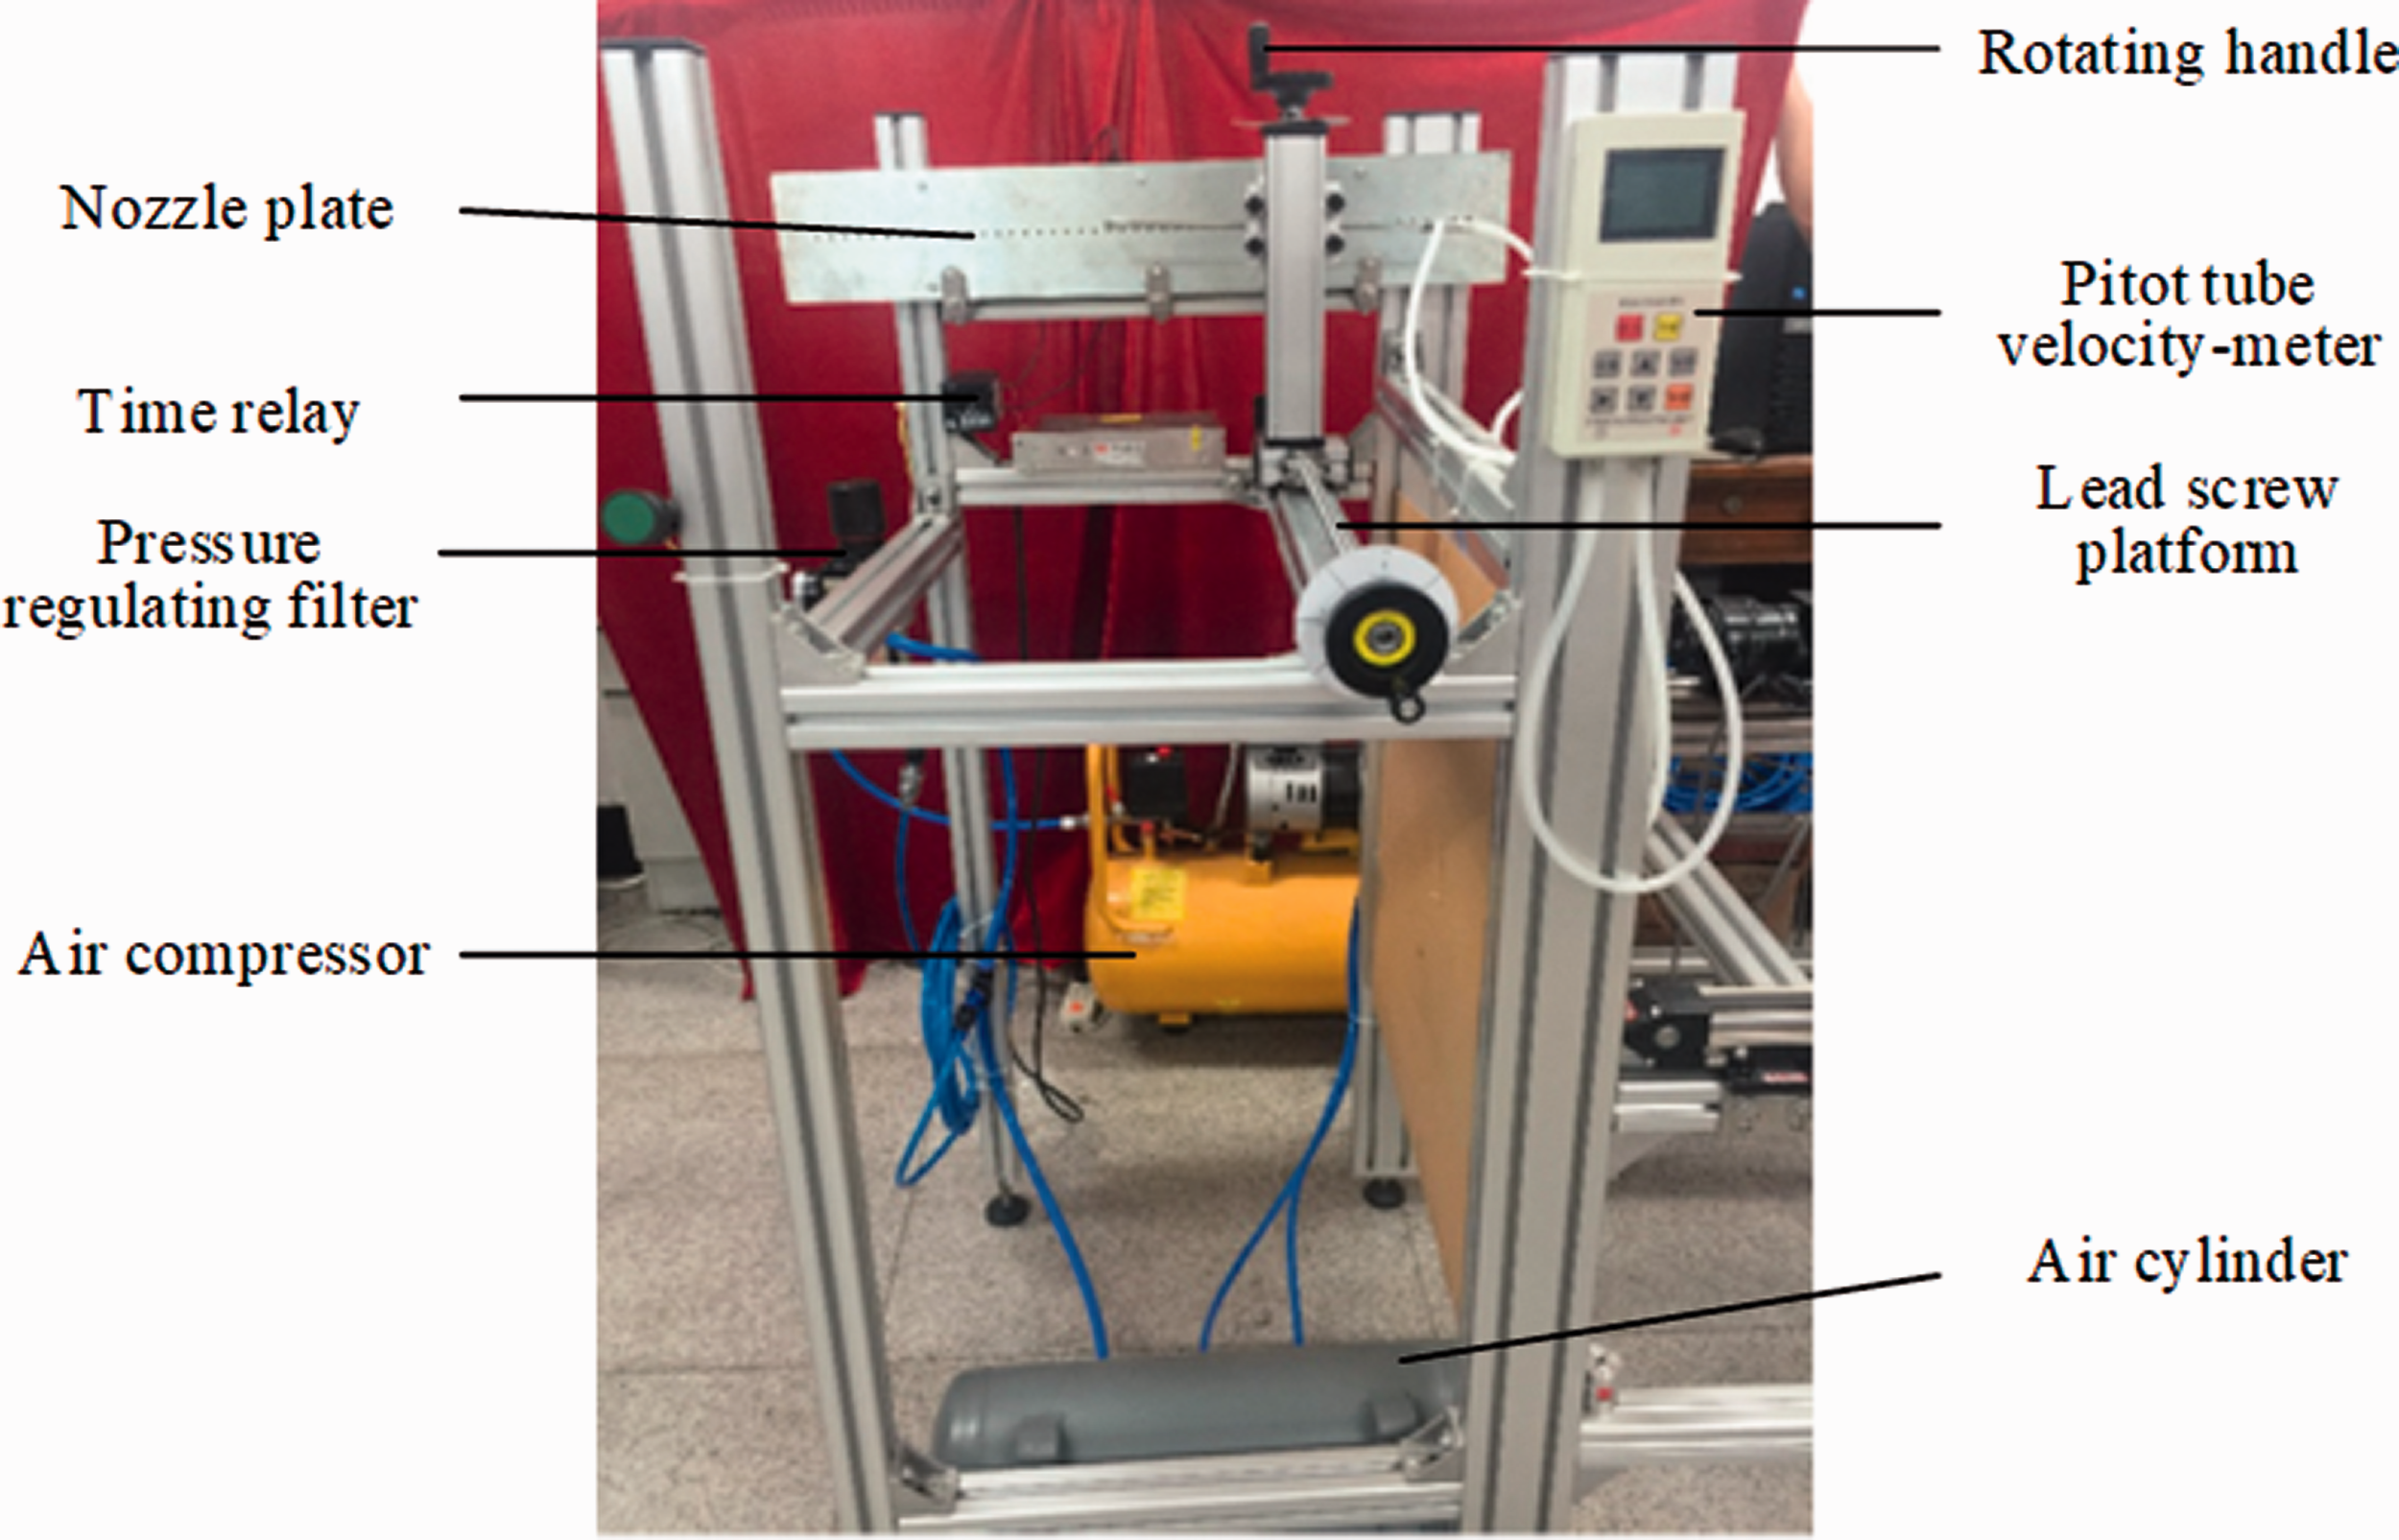
Experimental bench structure.
Nozzle outlet velocity before and after optimization
Since the distance from the nozzle to the cotton is mostly within 70 mm, in order to meet the actual production conditions, this paper measures the change of the velocity on the axis within a range of 70 mm outside the nozzle outlet. The output velocity of the four nozzles before and after optimization was measured 30 times; the average value of each nozzle was used as the experimental result to study the velocity change curves of the four nozzles before and after optimization, as shown in Figure 14.
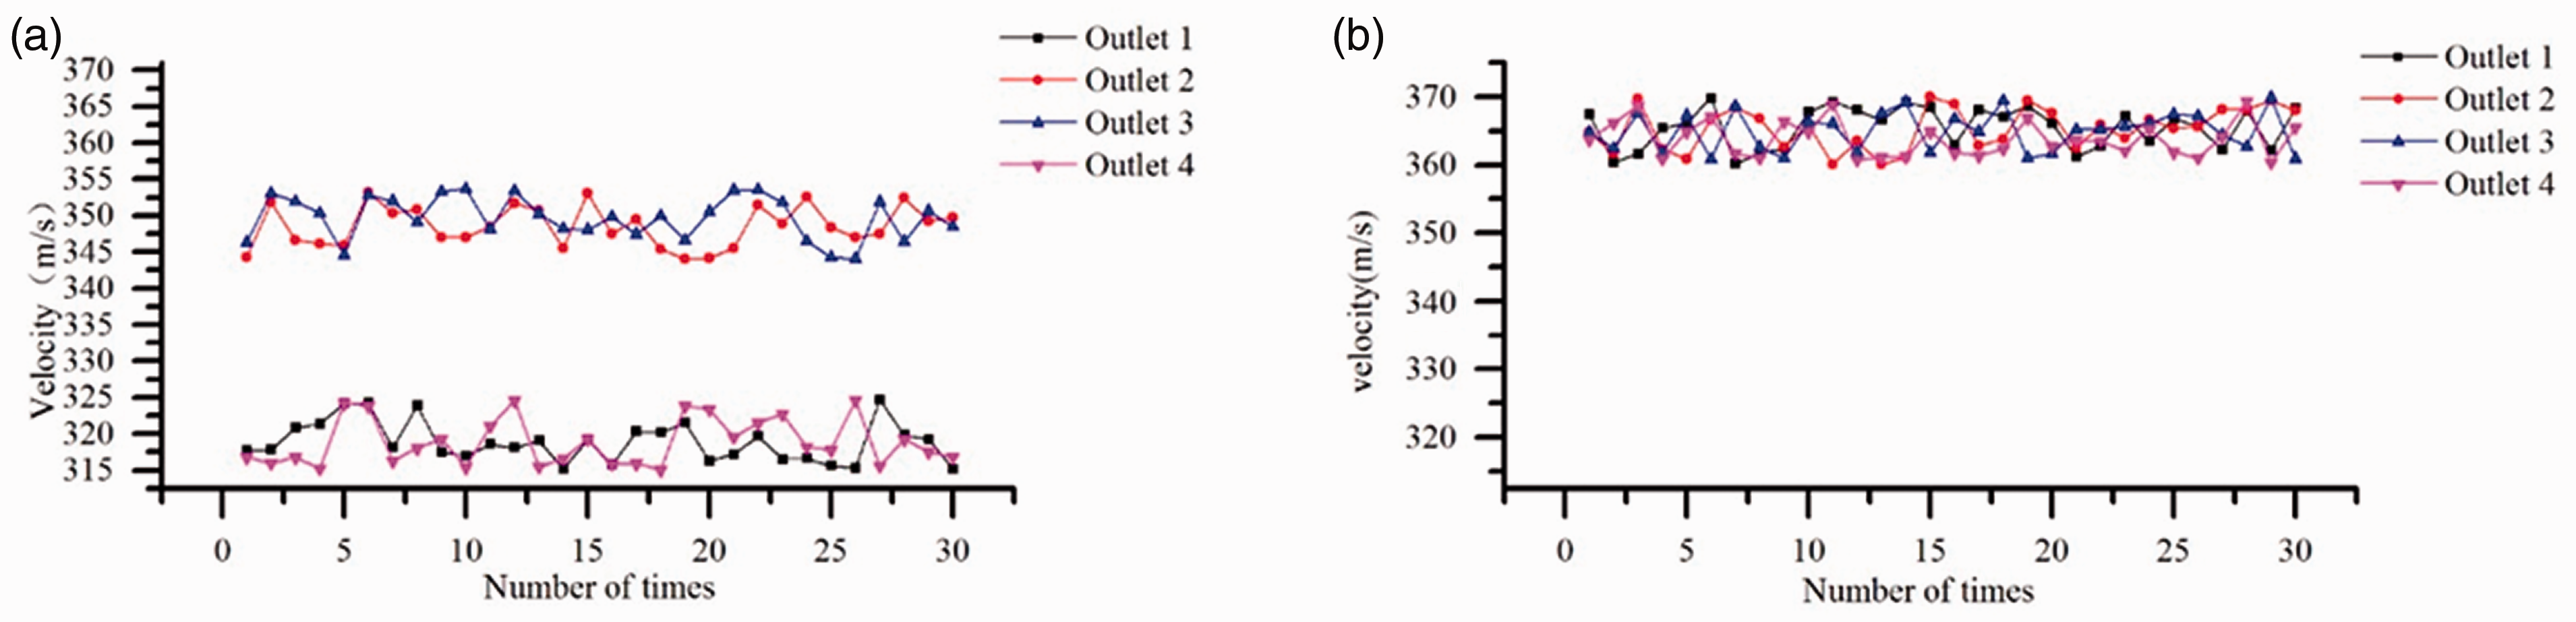
Optimize the outlet velocity of the nozzle before and after. (a) Before optimization and (b) after optimization.
It can be seen from Figure 14 that the average velocities of the four nozzles before optimization are 318.88 m/s, 348.53 m/s, 349.68 m/s, and 319.68 m/s. The velocities of the two nozzles on both sides are similar, and the two nozzles in the middle part have similar velocities. Moreover, the velocities of the nozzles on both sides are significantly lower than the middle part. The average velocities of the four nozzles after optimization are 365.516 m/s, 365.377 m/s, 364.954 m/s, and 363.827 m/s. Thus, we can know that the output velocity of the nozzles is uniform and higher than the average velocity before optimization, which is beneficial to eliminate foreign fibers in cotton.
Conclusion
In order to enhance the elimination efficiency of foreign fibers in cotton, a nozzle with a circular distribution contraction–expansion structure was designed, and the advantages of the optimization scheme were analyzed from the aspects of velocity, pressure, and energy loss. Then, the feasibility and practicability of the proposed method are demonstrated by comparison of simulation and experiment.
Through optimization of the design of the nozzle distribution, the linear distribution was changed to a circular distribution, so that the outlet air flow velocity of each nozzle was uniform, which was good for eliminating foreign fibers and reducing energy loss. The nozzle structure was changed from the stepped contraction type to the contraction–expansion type Laval nozzle, so that the air flow velocity at the nozzle outlet reached the optimum elimination velocity and energy loss was reduced. In Section 4.2, the data simulation effect of a single nozzle outlet is compared with that of four nozzle outlet structures, and the removal effect of foreign fibers is analyzed from the perspective of part and whole, indicating the feasibility of the method. The simulation results show that the axis velocity of the nozzle before optimization is less than 340 m/s, and the maximum axis velocity of the nozzle after optimization is greater than the sound velocity, indicating that the proposed method has better elimination effect on the foreign fiber. It is found through experiments that the average velocity of four nozzles axes before optimization is 334.19 m/s and the standard deviation is 14.92. The average velocity of the nozzles axis after optimization is 364.92 m/s and the standard deviation is 0.77. The average velocity of the optimized axis is increased by 9.2%, and the velocity stability is considerably better than the state before optimization, which illustrates the practicality of the proposed method.
Footnotes
Declaration of conflicting interests
The author(s) declared no potential conflicts of interest with respect to the research, authorship, and/or publication of this article.
Funding
The author(s) disclosed receipt of the following financial support for the research, authorship and/or publication of this article: This research is supported by National Natural Science Foundation of China (No. 51205288) and Natural Science Foundation of Tianjin (No. 17JCYBJC19400 and 18JCYBJC20200).
