



Abstract
In order to achieve accurate color segmentation of printed fabrics, the color segmentation algorithm combining the self-organizing maps neural network and the efficient dense subspace clustering was proposed in this paper. After pre-processing of the fabric image, the primary clustering was implemented by the self-organizing maps algorithm, then the secondary clustering was done by the efficient dense subspace clustering algorithm. The optimal silhouette coefficient is introduced into the clustering process of the efficient dense subspace clustering algorithm to determine the number of clustering centers automatically. Finally, by the post-processing including gray-scale transformation, binarization and open operation, the mis-segmentation of edge color was eliminated, making the algorithm more suitable for industrial application. Experiments were carried out and results show that the algorithm proposed in this paper can recognize the color of small areas accurately and segment the color of complex printed fabric images. The color segmented results of 20 printed fabrics show that the accuracy of the algorithm proposed in this paper reaches 88.3%.
With the rapid development of color diversification for clothes, there is an increasing demand for printed fabrics with complex color patterns. During the production process of the printed fabric, color measurement and segmentation is an indispensable step, which affects the quality of fabric products directly.1–3 At the very beginning, the measurement and segmentation of fabric color relied mainly on human eyes. This method has the disadvantage of high labor intensity and poor color measurement stability.4,5 With the development of spectrophotometry, the spectral imaging and the digital imaging technologies, the fabric color measurement can be realized by electronic equipment,6–9 providing an image basis for color segmentation of printed fabric based on machine vision.
The color segmentation of multicolor fabrics based on machine vision has been studied for many years. Ten years ago, researchers began to segment multicolor fabric images by the unsupervised clustering algorithms (self-organizing maps; SOM) or fuzzy C-means (FCM), and results show that clustering algorithms can realize effectively the color segmentation of multicolor fabric images. 10 Certainly, plenty of researchers have also used the neural network algorithms to separate colors of fabric images.11,12 Whereas compard with the clustering algorithms, the neural network algorithm training process is complicated, resulting in the long color segmentation time, which is difficult to meet the needs of industrial production. In recent years, clustering algorithms have attracted wide attention all over the world and have become the key method for the color segmentation of multicolor fabrics. 13 Kuo et al. 14 have developed a Gustafson–Kessel clustering algorithm for the color segmentation of embroidery images. The results show that compared to traditional clustering algorithms such as K-means and FCM, the Gustafson–Kessel clustering algorithm has higher accuracy for color segmentation on machine embroidery images. Luo et al. 15 have used an improved K-means clustering method to implement the color segmentation of weft and warp yarns in multicolor yarn-dyed fabric images. It has better segmentation accuracy and lower time cost. Zheng 16 has proposed a fabric color segmentation algorithm based on fuzzy regions. In this paper, the effect of fabric texture on color segmentation is eliminated by using the structure-texture decomposition method, and experimental results show that the color segmentation of different fabrics with different texture types was realized such as the woven structure, embroidery structure and knitted structure.
For the multicolor printed fabrics with more patterns and colors, the above methods have some shortcomings in the accuracy of segmentation. Accordingly, in order to solve the color segmentation problem of multicolor printed fabrics with more patterns and more colors, Kuo et al. 17 have combined a genetic algorithm (GA) with the SOM network to implement the color segmentation of multicolor printed fabrics in hue, saturation, intensity (his) color space. The algorithm is time saving and effective for the color segmentation of an image with a simple pattern. Mo et al. 18 have proposed a clustering algorithm based on SOM, and used the SOM density map and U-matrix to identify the main color categories of fabric images first. The algorithm is divided into three steps: coarse segmentation, refined segmentation and cluster merging. The problem of over-segmentation is avoided effectively by merging clusters with similar color characteristics. However, due to the lack of post-processing of edge colors, the mis-segmentation of edge color is prone to occur. Zhang et al. 19 have used the hyperspectral imaging technology to obtain fabric images, and realized the color recognition and region segmentation successfully for multicolor printed fabrics by combining the SOM algorithm with the density peak clustering (DPC) algorithm. Compared with digital camera imaging, spectral imaging operation is more complex, which is more suitable for color measurement in the laboratory. Kumah et al. 20 have used an unsupervised average shift algorithm for the color segmentation of printed fabric. Experimental results show that it can complete the color segmentation of fabric images under diverse textures and illuminations. The algorithm is robust but has a small shortcoming for the industrial application because the fabric should be cleaned before the color segmentation.
From the literature review, although the related algorithms of printed fabric color segmentation are continuously improved and perfected, these methods have some problems of incomplete segmentation or over-segmentation for complex multicolor printed fabrics, and the segmentation accuracy is also relatively low, which cannot meet the requirements of industrial application. Consequently, a color segmentation algorithm integrating the SOM and the efficient dense subspace clustering (EDSC) is proposed in this paper. The pre-processing step with both median filtering and the non-local variations (NLV) algorithm is added to get rid of the image noise caused by the complex textile texture. The second clustering is added after the first clustering to improve the segmentation accuracy. The post-processing step with the open operation is added to solve the problem of mis-segmentation of edge color, making it more suitable for industrial production. Then a series of experiments was carried out. The segmentation results of various colored fabrics were discussed and the comparisons between the proposed methods and the traditional methods were implemented.
Methods
To improve the accuracy of color segmentation for the multicolor fabric and elimination of the mis-segmentation of edge color, the color segmentation algorithm based on clustering for printing fabrics is established in this section. The segmentation algorithm is mainly composed of three parts: pre-processing, SOM-EDSC algorithm, post-processing, as shown in Figure 1.

Block diagram of fabric color segmentation process.
Pre-processing
To improve the accuracy and robustness of the algorithm, the appropriate pre-processing operations were carried out in this section. First, the image noise is reduced by median filtering. Second, the NLV algorithm is used to eliminate the color defects. The pre-processing is shown as follows in detail.
First, the textile surface has a lot of clearly visible bumps and depressions, so the fabric image is very different from other color images such as the flat images. In the collected images of the textile, the concave part between the warp and weft is dark while the bulge part is bright, as shown in Figure 2(a). To minimize the interference from the noise of the fabric image, the noise reduction operation was carried out. The denoising operations of the fabric images include mainly mean filtering, Gaussian filtering and median filtering. Among them, median filtering is used here because there exists mainly the impulse noise and the salt and pepper noise in the fabric image, which has been used for image de-noising of fabric by Yildirim 21 and Wang et al. 22

Pre-processing: (a) original fabric image; (b) pre-processed image.
Second, to eliminate the interference from the color defects and the printing deformation on color segmentation, the NLV algorithm is adopted in the pre-processing. 23 When there are repeated patterns in the fabric images, the NLV algorithm will find the ideal state first and compare the deviation between each repeated part and the ideal state, and then obtain the ideal pattern through the corresponding transformation.
The matrix


After median filtering and the NLV algorithm, the color defects caused by colored wool are eliminated and the texture is suppressed, as shown in Figure 2(b).
The SOM algorithm
The SOM neural network is an unsupervised neural network model, which maps the data samples from a high-dimensional space to a low-dimensional space.
24
The SOM algorithm is a single-layer network structure with only an input layer and an output layer. The output layer is the competition layer. It can map the input data into a one-dimensional or two-dimensional plane at the output layer. The two-dimensional network model is used most widely. In the training process, when the number of pixels in the input fabric image is N, the input is
The main process of the competitive learning of the SOM algorithm is as follows:
Step 1: Normalize the input data xi and the weight vector wj to get yi and wz. Step 2: Calculate the Euclidean distance dz between yi and wz.
Step 3: Find the neuron c with the smallest Euclidean distance, which is the winning neuron.
Step 4: Update the connection weights wp between neurons in the neighborhood of the competing layer and those in the input layer.
Step 5: Update the learning rate α(t).
Step 6: Determine whether it satisfies α(t) = 0 or t = T, otherwise return to step 2.
where α(t) is the learning rate, h(t) is the neighborhood range centered on the winning neuron c at time t.



The EDSC algorithm
The EDSC algorithm is a subspace clustering designed by Pan based on the spectral clustering. 25 The self-expressiveness of observations was used in the image with no noise, while a clean dictionary was learned in the image with noise. Instead of the conventional compressed sensing approach, the algorithm defines the subspace clustering as a Frobenius norm minimization problem, which makes the connections between two data points denser in the same subspace. The algorithm defines each observation data point as a linear combination of clean dictionary elements, uses l2-norm regularization on the combination coefficients, and sets the appropriate responses to the presence of noise data and abnormal data. The EDSC algorithm needs to input the number of clustering centers manually. In other words, for the color segmentation of textiles, the color number of the fabric should be determined manually. The multicolor fabric has complex colors and patterns, and it is extremely inefficient to identify the color number of the fabric manually, so the internal evaluation index silhouette coefficient (SC) is used to determine the number of cluster centers automatically in this paper. 26
In the EDSC algorithm, first the coefficient matrix is calculated based on the input data and the affinity matrix is constructed; Then, the input data were divided into three parts according to the affinity matrix: noise data, noise-free data and outliers. It converts the subspace clustering into an optimization problem of each data point, which is divided into the following cases generally.
When the data are clean,

where X = [x1 x2……xN] denotes the data matrix, C = [c1 c2……cN] is the coefficient matrix.
2. When there is noise in the data, the constraint is relaxed and a clean dictionary is used to represent the data, so the optimized equation of each data point is changed to:

where λ is the parameter to balance the first and second terms, D is the clean dictionary.
3. When the data are mixed with outliers, the optimization equation is changed to:

where λ1, λ2 are the parameters to balance the three items, E is the outliers.
Post-processing
During the process of printing the pattern, the color of the edge part is formed by the mixing of two colors at the junction. In some cases, the color of the edge is quite different from the color of the center pattern. Therefore, it can be seen from Figure 3(b) that the edge color is easy to regard as another color during the image color segmentation step of textiles. The wrong segmentation of edge color is not allowed in the industrial production application. In this paper, the post-processing operation is carried out on the segmented image for eliminating the effects of the mis-segmentation of edge color.

Post-processing: (a) fabric image; (b) color segmentation image; (c) gray image; (d) binary image; (e) anti-color image; (f) morphological opening; (g) coloration.
During the post-processing of the segmented fabric image, the gray process is implemented first. The segmented color images are converted into the gray images (see Figure 3(c)) by the weighted average method. Then, the image binarization process is performed. A suitable threshold was determined automatically by means of the Otsu algorithm to convert the gray images into the binary images (see Figure 3(d)) with a smaller amount of data. The image binarization process can reduce the calculation time and improve greatly the efficiency of the algorithm.
Finally, the open operation is carried out to realize mainly the elimination of the mis-segmentation of the edge color. The open operation is based on the morphological operations of expansion and corrosion. 27 It is a filter that can remove the isolated dots, burrs and break narrow connections by the geometrical calculation, but do not destroy the integrity of the pattern. The open operation is used mainly to eliminate the noise of the bright color in the image, but the segmented color after binarization is dark, as shown in Figure 3(d). Therefore, the reverse color operation is implemented, changing the segmented color from dark to bright (see Figure 3(e)). After the reverse color operation, the open operation is carried out to remove the mis-segmentation color edge (see Figure 3(f)), and the color is assigned to the corresponding color area in the original image to complete the whole post-processing process (see Figure 3(g)).
Acquisition of high-quality fabric images
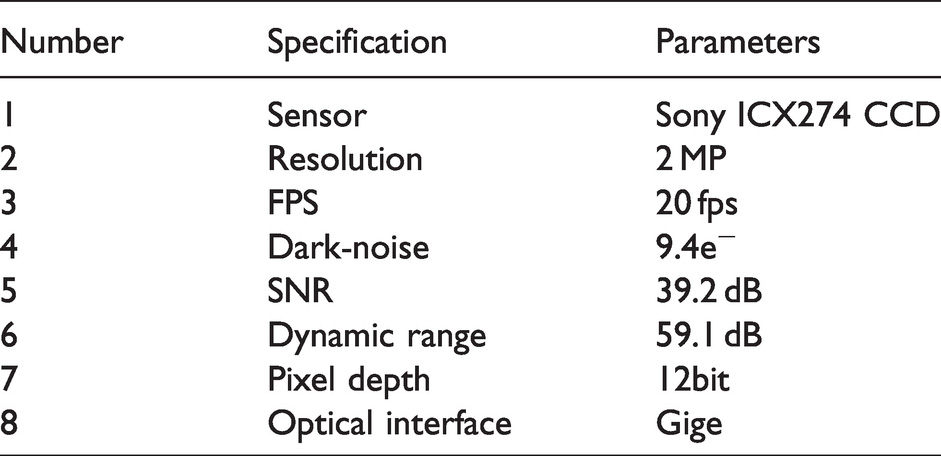
Before the color segmentation of fabric, the high-quality fabric images need to be obtained. In this paper, an image acquisition system is designed including mainly a LED ring light source, a brightness controller, a CCD camera, the device connection platform and a computer. The CCD camera is connected to the computer, which is controlled through the computer to obtain the fabric images. Compared with other cameras, CCD color industrial cameras have stronger anti-noise ability and good signal output consistency. The LED ring light source is added between the fabric sample and the industrial camera. Compared with the monochromatic light source, the ring light source can illuminate the surface of the fabric sample uniformly, effectively avoiding the brightness difference of the fabric image. The specific parameters of the CCD camera are shown in Table 1. The schematic diagram of the image acquisition system is shown in Figure 4.
acA1600-20gm major parameter

Fabric image acquisition system.
Results and discussion
Determination of cluster validity index
Through the image acquisition system above, three kinds of the printed fabric images with a clear number of colors are selected (see Table 2) to determine the cluster validity index. The color numbers used here are 4, 5, and 7, respectively. In this paper, the SC, the Davies–Bouldin index (DBI) and the Dunn validity index (DVI) were used to determine the number of cluster centers, and then realize the color clustering. For estimating the accuracy of these three cluster validity indexes, an indicator SSE is calculated, which is used widely in the field of color image segmentation. The SSE value is obtained by calculating the square sum of the difference between the real value and the predicted value. The calculation formula is shown in equation (10):19

Color number of printed fabrics determined by evaluation index

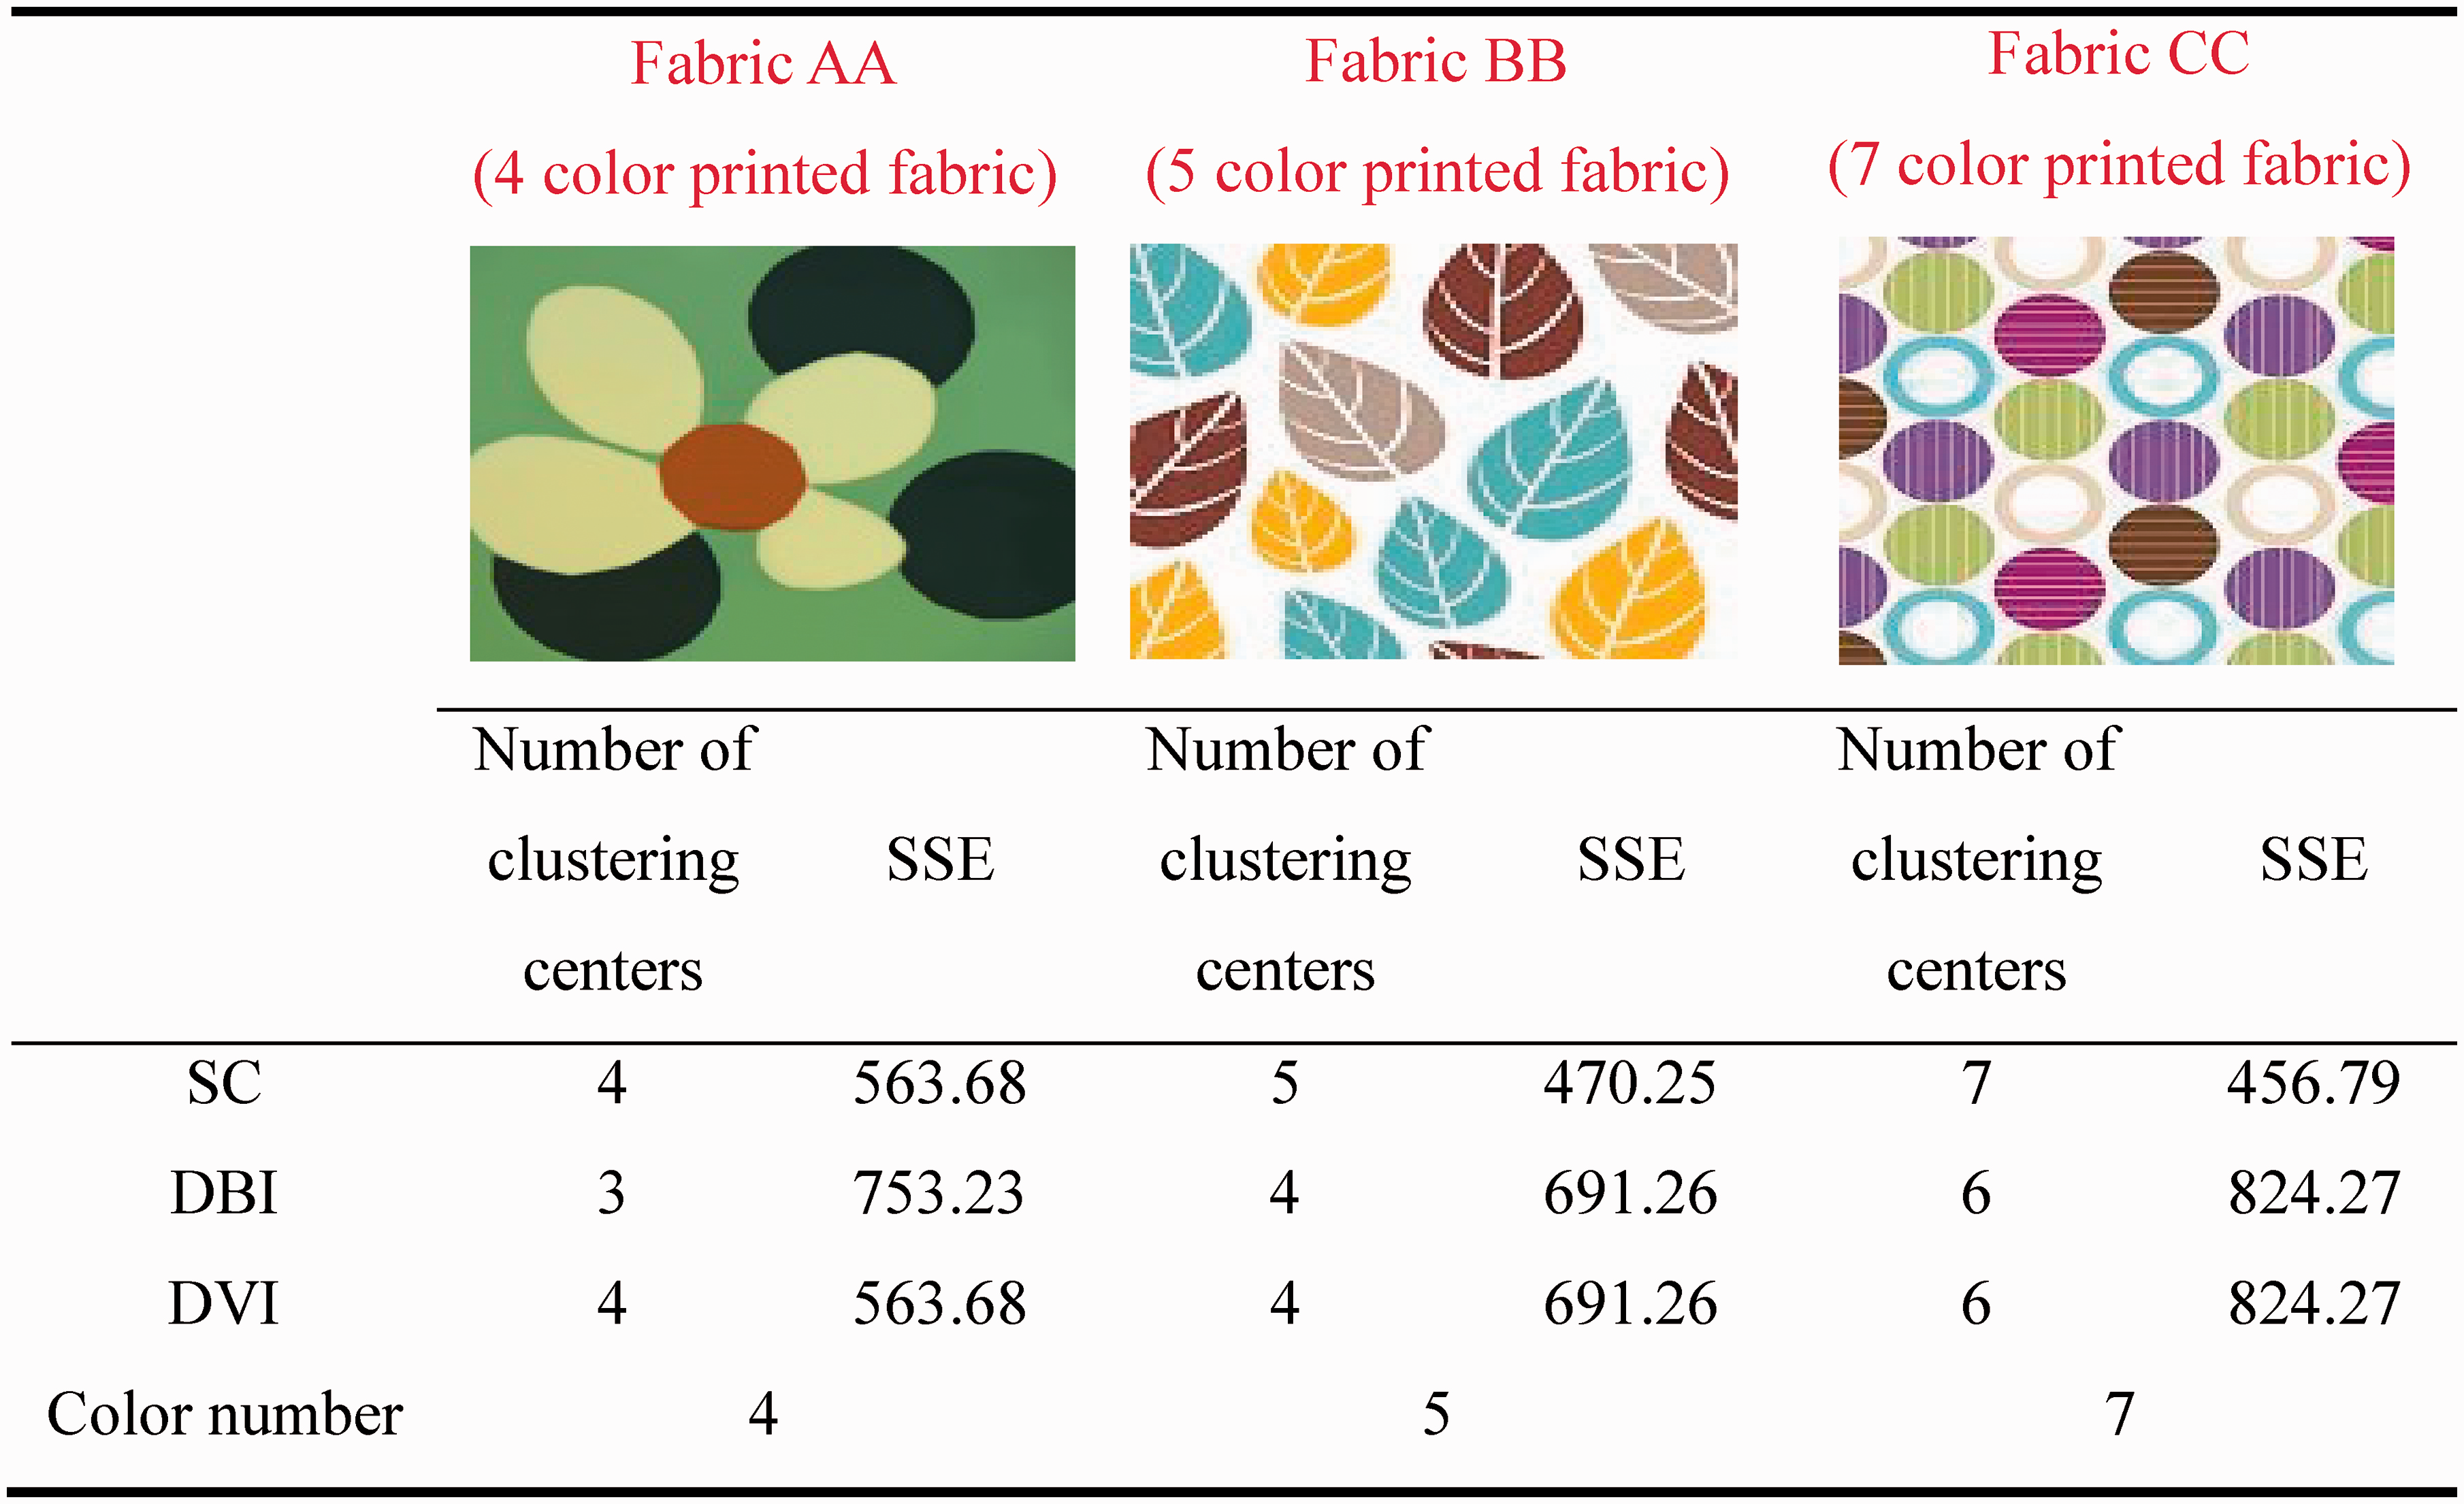
The smaller value of SSE means better clustering effect and fewer errors. It can be seen from Table 2 that the number of clustering centers determined by the optimal SC is consistent with the actual color number of the printed fabric. Among these three cluster validity indexes, the SSE value calculated by the optimal SC is minimum. Therefore, the optimal SC is selected to determine automatically the number of cluster centers. The color number determined by the optimal SC is used for the process of color segmentation.
Set of the learning rate, the neighborhood radius and the total learning time
In this paper, the initial learning rate of the SOM-EDSC algorithm is set as 0.5. The initial neighborhood should include all or most neurons. The neighborhood radius then shrinks continually and finally shrinks to 0 after learning. In this paper, in order that the initial neighborhood can contain most neurons of the SOM network, the initial neighborhood radius is set as 6.
As the number of the total learning step has a key effect on the clustering result, the determination of the total learning step number was discussed in this paper. The effects of the number of the total learning step on the evaluation indicators (compactness (CP) and separation (SP)) of color segmentation for printed fabric samples (fabric AA, BB, and CC) with different total learning steps are shown in Figure 5. CP is the average distance between each point and its cluster center, while SP is the average distance between cluster centers. It can be found from Figure 5 that when the number of iterations is more than 100, the CP becomes small and SP becomes large. The average values of CP and SP for the three printed fabric samples are calculated and shown in Table 3. The average value of CP reaches the minimum value, the second minimum value and the third minimum value when the total learning step numbers are, respectively, 600, 200 and 400, while the average value of SP reaches the maximum when the total learning step number is 400. Because a better clustering algorithm has smaller CP and bigger SP, 8 the total learning step size of 400 is chosen in this paper as a tradeoff between accuracy and computed time.

Evaluation results of color segmentation with different total learning step numbers for (a) fabric image AA, (b) fabric image BB and (c) fabric image CC shown in Table 2.
Average values of evaluation indicators CP and SP for fabrics (AA)–(CC)
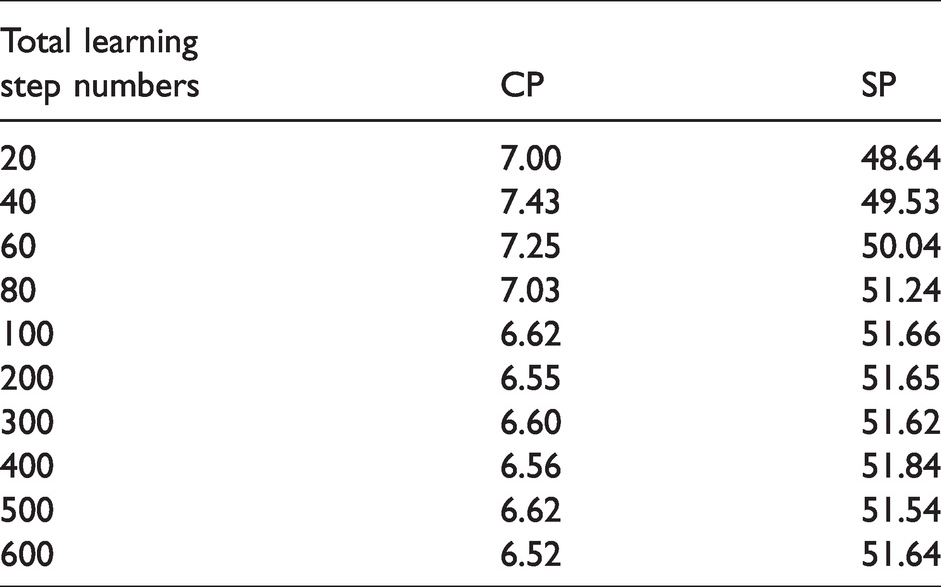
Image segmentation of fabrics
In this paper, for realizing the color segmentation of multicolor fabric, first the images of three kinds of the printed fabrics (A, B and C) were obtained by the image acquisition system developed in this study. Then, the process of the color segmentation by the SOM-EDSC algorithm proposed is implemented using MATLAB 2020A. The calculated segmented images are shown in Figures 6–8.

Color segmentation results of printed fabric A.

Color segmentation results of printed fabric B.

Color segmentation results of printed fabric C.
As can be seen from Figure 6, the fabric A has seven different colors, and there are two similar colors about red and pink. Also, there are plenty of the very slender flower stalks, which is hard to segment. It can be seen from Figure 6 that the flower stalks and the edge details were segmented accurately for the porous printed fabric. Neither over-segmentation nor mis-segmentation emerged. From the results of cluster 1 and cluster 5, red and pink colors are distinguished well. From the result of cluster 7, the background color of the porous fabric was also segmented accurately.
Compared with fabric A (see Figure 6), there are more complex color types and scattered color distribution in the image of fabric B shown in Figure 7. The flower pattern of fabric B has up to five colors, and several colors of flower patterns are similar to the background color, which are difficult to segment. From the result of cluster 1, the edge profile of the white petals in the pattern were segmented well, as well as the tiny white petal areas in the lower left corner. From cluster 5 and cluster 10, the difference of similar colors is distinguished and segmented accurately.
The pattern color on fabric C is a gradient as shown in Figure 8. It is difficult to distinguish. It can be seen from Figure 8 that the red regions with gradient colors are segmented into cluster 1, cluster 2 and cluster 3, as well as the blue region with gradient colors. From the results of cluster 1 and cluster 7, the edge profile of gradient color is also segmented clearly. From the result of cluster 5, the obscure yellow domain at the upper left and lower right corners of the fabric image are also segmented accurately.
Comparison with other color image segmentation algorithms
Twenty printed fabric images of high quality were collected by the image acquisition system. The comparisons of their color segmentation results by the SOM-EDSC algorithm proposed in this paper were done with that by the K-means algorithm, the SOM-K algorithm and the SOM-DPC algorithm for estimating the feasibility. It can be seen from the color segmentation of fabric A in Figure 9 that the SOM-EDSC algorithm completely and accurately segmented the red areas of the flower in the fabric, but the SOM-DPC algorithm misclassifies red and pink as the same color. Although the K-means algorithm and the SOM-K algorithm can distinguish red color and pink color, they cannot identify the patterns with small size. From the color segmentation results of fabric A, the algorithm proposed in this paper can segment the background image completely and accurately as well as the K-means algorithm, but the other two algorithms cannot deal with the problems of incomplete segmentation.

Algorithm comparison results.
For fabric B, it can be seen that the white petal pattern of the image was segmented completely by the SOM-EDSC algorithm, but other colors were identified as white by the SOM-DPC algorithm, the K-means algorithm, and the SOM-K algorithm.
The image of the fabric C in Figure 9 is more complex than the other two images. The color variation of fabric C is gradual. As can be seen from Figure 9, the SOM-EDSC algorithm segmented the yellow part of the image accurately, while the SOM-DPC algorithm and the K-means algorithm cannot.
In the image of fabric D, yellow was identified as brown by the SOM-DPC algorithm and the K-means algorithm. The difference between yellow and brown was found by the SOM-K algorithm, but the edge of the yellow pattern was identified as another color and was classified as brown.
The segmentation results of the four algorithms shown in Figure 9 show that the SOM-EDSC algorithm proposed in this paper has a better segmentation effect on the complex printed fabrics.
To compare the segmentation accuracy of 20 printed fabric images for the four algorithms, an indicator ac to calculate the segmentation accuracy was addressed in this paper. Its calculated process is as follows: first, the color segmentation of the 20 fabric samples was carried out by using the SOM-EDSC algorithm and the other three methods. After segmentation, each sample image will be divided into several clusters. The total number of clusters of the 20 fabric samples was counted. Then the correct segmented clusters were decided by comparing each cluster with the original sample images and their number was also counted. Finally, ac is calculated by dividing the correct segmented clusters by the total number of clusters. The calculated formula is:

The result is shown in Table 4. From Table 4, the accuracy of the color segmentation algorithm proposed in this paper reaches 88.3%, which is higher than other algorithms.
Comparison of segmentation accuracy among different color segmentation algorithms

Conclusions
The color segmentation algorithm conjugating the SOM algorithm and the EDSC algorithm is proposed in this paper. First, the pre-processing step with both median filtering and the NLV algorithm is added to get rid of the image noise and defects. Second, the SOM algorithm is used to divide the feature vectors with the same or similar nature in the input data into a category, which reduces the computation amount for the subsequent EDSC algorithm. Then, the EDSC algorithm was used for the secondary clustering. The optimal SC is introduced into the EDSC algorithm to determine the number of clustering centers automatically. Finally, the post-processing step is carried out to complete the whole color segmentation process. The open operation is added in this step to eliminate mis-segmentation of edge color. The main conclusions of this paper include that:
Through the post-processing, including the process of gray-scale transformation, binarization, anti-color display, open operation and color rendering, the mis-segmentation of edge color is eliminated, making the SOM-EDSC algorithm proposed in this paper more suitable for industrial applications. The SOM-EDSC algorithm can identify the color number in the image of printed fabrics, distinguish accurately the close colors and realize color segmentation of small and fragmented color areas completely and accurately. Compared with the SOM-DPC algorithm, the K-means algorithm and the SOM-K algorithm, the SOM-EDSC algorithm is more accurate in color segmentation of multicolor printed fabrics, whose segmentation accuracy reaches 88.3%.
Footnotes
Declaration of conflicting interests
The author(s) declare that there is no conflict of interest with respect to the research, authorship, and/or publication of this article.
Funding
The author(s) disclosed receipt of the following financial support for the research, authorship, and/or publication of this article: This work was supported by the National Natural Science Foundation of China (grant numbers 62173307, 51505420); the Natural Science Foundation of Zhejiang Province (number LQ21E050006); and the Zhejiang Provincial Public Projects of China (grant number LGG18E050022).
