
Abstract
The accuracy of color reproduction of digital printed fabric is affected by fabric structural characteristics and treatment, and the adjustment of color management is required for reducing the color difference. To study the mechanism of color presenting, the interaction of ink droplets diffusing on polyester knitted fabric with different structures and treatment was investigated. The result showed that the smaller the porosity, the larger the diffusion area. Besides that, the pretreatment alleviated the edge blurring of color blocks on fabric, and the diffusion area of hydrophilic finished fabric was larger due to the hydrophilic film. In terms of color presenting, the smaller the porosity, the smaller the K/S and C* values are, and the pretreatment could have a better effect on color presenting, while the color appeared more pastel on the finished fabric. Due to errors in the process of color transfer, the adjustment of color management in fabric digital inkjet printing was also studied. The manuscript correction method and the ink volume control method were proposed for color management in comparison with the original color management. Through the analysis of color differences, the optimized methods were able to provide an improved color reproduction effect, in which the ink volume control method had the best reproduction effect among the three. The improved color reproduction effect of the ink volume control method on finished fabric was also verified, and the difference of effects between finished fabric and ordinary fabric was explained with the diffusion law of ink droplets.
Keywords
The color of patterns on printed textiles is the decisive factor in the development trend of fashion, and digital inkjet printing is a convenient way to produce a variety of patterns, which has developed from paper printing. However, the color presenting mechanism of printed textiles is different from that of printed paper products. Important factors such as fabric structure, pretreatment, and finishing process play a key role in the color presenting of printed textiles, so research on the coupling mechanism of ink droplets with fabrics of different structures and different treatments combined with targeted color management methods is the key step to optimize the accuracy of color reproduction for digital printing.
The digital inkjet printing machine processes a large amount of data quickly under the control of a computer system, and alternately ejects different colors of tiny ink droplets on to the surface of a textile substrate through the inkjet printhead to print patterns consisting of a mixture of multiple tiny color dots.1,2 Once in contact with the fabric surface, the ink droplets are wicked due to the capillary effect of fibers and diffusing on the fabric. The precise distribution of ink droplets on the fabric, the cross-sectional shape of the yarn or fiber, and the surface modification of fabric will affect the interaction between the ink droplets and the fabric.3,4 The current research on the coupling mechanism of the fabric structure, fabric treatment, and ink droplets has mostly focused on the influencing factors of printing fineness; a few pieces of research have focused on knitted fabric, while most of the research has focused on woven fabric. Nevertheless, having greater extensibility than woven fabric, polyester knitted fabric adapts to the broad market in sports and directly promotes the rapid development of digital printing on polyester knitted fabric. Research by Park et al. 5 demonstrated that the fabric structure affects the diffusion area of ink droplets. An et al., 6 Han et al., 7 and Yang et al. 8 pointed out that once the diffusion area of ink droplets decreased, the color depth was correspondingly deeper and the color performance was better. For theoretical research, Hossain et al. 9 and Lim and Chapman 10 discussed the physical and chemical changes caused by surface treatment and found that the ink droplet diffusion was slowed down and the deposition of dyes on the fabric was increased, resulting in the increase of color depth, color richness, and color intensity. There are a few pieces of research on color presenting of digital printing. Ding et al.11,12 studied the mechanism of color presenting from the perspective of fabric penetration and structure by comparing the effects of various pretreatment methods and agents.
Allen and Triantaphillidou 13 summarized the reasons for the large color difference in textile digital printing. Since the coloration mechanism of devices is different than computer monitors adopting the red, green, blue (RGB) mode while the printing machine adopts the cyan, magenta, yellow, and black (CMYK) mode, the color difference will be caused due to the transfer of chromatic values. To achieve the maintenance of color consistency between devices, the CIE L*a*b* color space, which is the largest color space, can be used as the intermediate to transfer the chromatic value, and each color presented by any device can be mapped to it. 14 The key point to ensure the accuracy of color transfer in inkjet printing lies in the color management of the printing system, which refers to the use of combining software with hardware and the interconversion of different color spaces (Figure 1) for solving the problem of color gamut mismatch in the process of transferring the digital color information between devices, and thus the color consistency throughout the production process could be ensured. 15 At present, most of the systems and evaluation methods of textile inkjet printing are formulated based on paper printing standards, but lack pertinence for textiles. To maintain a stable environment for textile digital printing, it is necessary to refine the International Color Consortium (ICC) profile for improving the color presenting and printing quality. 16 Javoršek et al. 17 and others considered the influence of the pretreatment and finishing process on printing quality and optimized the color management process. Wu 18 and Guan et al. 19 respectively used the color selection method and the reversing verification method to study the effect of fabric finishing and structure and improved the color reproduction effect to an extent. Peng et al. 20 studied the influence of diethylene glycol on the dye solutions and the color performance of dyes to improve the quality of printed fabrics.

Conversion of color space. RGB: red, green, blue; PCS: Profile Connection Space; CMYK: cyan, magenta, yellow, and black.
The main purpose of this research is to achieve accurate color reproduction, and the processes that may have an impact on color reproduction during printing should be taken into consideration. Color presenting on polyester knitted fabric influenced by the fabric structure and treatment needs to be investigated from the viewpoint of the interaction of color ink droplets being ejected and diffusing on the fabric. In addition, the distortion of color reproduction also impacts the result of color presenting, and thus the adjustment of color management in digital inkjet printing was studied. In this study, different amounts of disperse dye were dripped on fabrics with different structures and different treatments to analyze the law of ink droplet diffusion and explore the color presenting mechanism of structural characteristics of fabric combined with ink droplet diffusion. The single-channel ink volume control method and the manuscript correction method were used for color management, and the reproduction effect of the two methods was compared with the effect of the original color management as a contrast. Therefore, the reasonable and effective color reproduction method for digital inkjet printing of polyester knitted fabric could be able to achieve the precise control of color and further be improved to achieve the effect of expanding the color gamut and transferring accurate chromatic values.
Experimental details
Materials and pretreatment
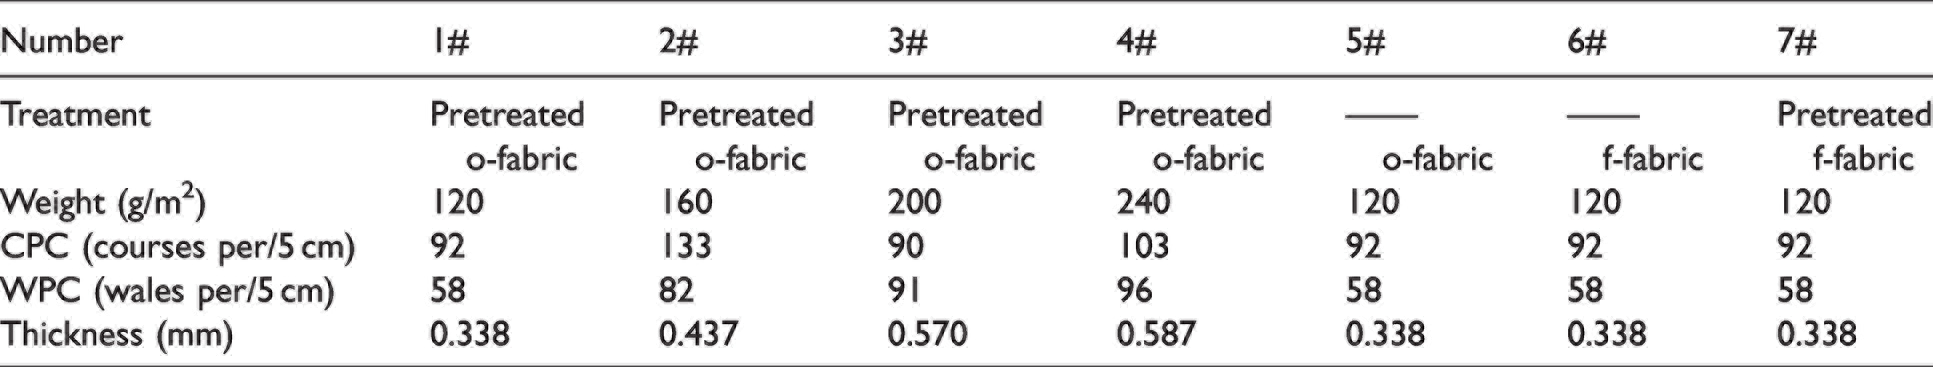
The plain stitch polyester knitted fabrics (raw white) utilized for the experiment were divided into two types: ordinary fabric (hereafter called o-fabric) and hydroscopic and moisture transmitting polyester fabric (hereinafter called finished fabric and abbreviated as f-fabric). The o-fabrics were four kinds of fabrics with the same yarn size of 75D/36F but different fabric densities, corresponding to different fabric weights of 120, 160, 200, and 240 g/m2, respectively. The f-fabric has the same fabric structure as the o-fabric of 120 g/m2, which was chosen to study the effect of the hydrophilic film with moisture wicking function 21 on color performance. All of the above-mentioned fabrics were provided by Shanghai Jialinjie Textile Co., Ltd, and the fabric thickness was measured by a YG141N Digital Fabric Thickness Tester (Nantong Hongda Experimental Instrument Co., Ltd) with standard GB/T1380-1997.
To investigate the relationship between ink droplet diffusion and color presenting, the samples were numbered 1#–7#, with the specifications shown in Table 1. Among the samples, 1#–4# were the pretreated four kinds of o-fabrics and sample 7# was the pretreated f-fabric, while sample 5# was the unpretreated o-fabric with the weight of 120 g/m2 and sample 6# was the unpretreated f-fabric.
Specifications of the samples
The specific parameters shown in Table 2 were used for pretreatment. A pretreating agent solution with 2% sodium alginate (Shanghai Duancai Digital Technology Co., Ltd) was applied to the fabrics by using an LP Series Pneumatic Laboratory Mangle (Nantong Sansi Electromechanical Science & Technology Co., Ltd) and then fabrics were baked with the use of a DHG-9145A Oven (Shanghai Qixin Scientific Instrument Co., Ltd).
Pretreatment process parameters

For comparing the different surface morphologies of the pretreated fabric and unpretreated fabric, samples 1#, 5#, 6#, and 7# were sputter-coated, and the surface morphology of the samples was observed through a FlexSEM1000 scanning electron microscope (Hitachi, Ltd), with the magnification being set as 2.0k.
Four-color disperse dyes (CMYK) were prepared as the test ink.
Ink diffusion experiment
In order to analyze the influence of fabric structure and treatment on the diffusion performance and characteristics of disperse dye with different amounts of ink on fabric, 0.02, 0.05, 0.1, 0.2, and 0.5 μL inks were respectively dripped by a micro-syringe (Shanghai Gaoge Co., Ltd) from 30–40 mm height onto samples 1#–7#. The dynamic diffusion behavior of ink droplets on fabric was observed through an HC-300A Digital Video Microscope (Shenzhen Boshida Optical Instrument Co., Ltd), and then the ink droplet diffusion area and the wale-direction and course-direction diffusion width (dc, dw) on the fabric surface were calculated with ImageJ software. The average value was obtained after 10 points dripping on each piece of fabric. Also, the ImageJ software with the image processing method shown in Figure 2 was used for fabric porosity measurement.

Process schematic of the ImageJ software. (a) Image processed by 8-bit grayscale; (b) threshold adjusted image and (c) porosity statistics chart.
Furthermore, for the observation of the effect of pretreatment on lines composed of ink droplets on fabrics, 10 parallel lines were respectively printed on the wale direction and course direction of samples 1# and 5# with a A3-P400 Micro-voltage inkjet printing machine (Shanghai Duancai Digital Technology Co., Ltd), the width of which starts from 0.1 mm and increases to 1 mm with an increment of 0.1 mm, as shown in Figure 3.

Schematic diagram of the 10 parallel lines.
As for the influence of fabric structural characteristics and treatment on the color presenting of disperse ink, four-color blocks separately designed with 100% C, M, Y, K colors in Photoshop CS6 were printed on samples 1#–7# with the A3-P400 Micro-voltage inkjet printing machine.
A Datacolor 850 Spectrophotometer was utilized for measurement, with measuring conditions of D65 illumination and CIE 10° standard observer angle. The fabrics were folded into four layers, and the average value was calculated after five different test points were dripped on each sample being measured.
Ink volume control method and manuscript correction method
The ink volume control method and the manuscript color correction method were used to optimize the original color management. Samples 1# and 7# were chosen to perform color management as the representative samples of o-fabric and f-fabric, and the samples were printed with the use of the A3-P400 inkjet printing machine equipped with RIP software. The chromatic value of each color block was measured by an X-Rite i1Pro3 Spectrophotometer equipped with i1Profiler software, while the color difference was calculated with the CIE2000 formula.
The IT8.7-3CMYK color checker, which contains 928 color blocks, was used to generate ICC profiles for the experiment. The color blocks cover a wide area, including the dark area and the overprint area required for checking the overprint effect, the saturated area without black or with 20% black, the gray area for checking the gray balance, and the solid color block area for checking the solid density. These color blocks can be representative to show the basic color performance. 22 The color checker is shown in Figure 4, and the ICC profile generation process is shown in Figure 5.

IT8.7-3CMYK color checker.

Color management workflow. ICC: International Color Consortium.
The polyester color checker for the textile industry launched by PANTONE was used as the basic color to design the color blocks due to its targeted color performance function for the color management of polyester fabric. Based on this, the PANTONE-TSC color checker (Figure 6) was designed for representing and comparing the color reproduction effect of samples with different color management methods.
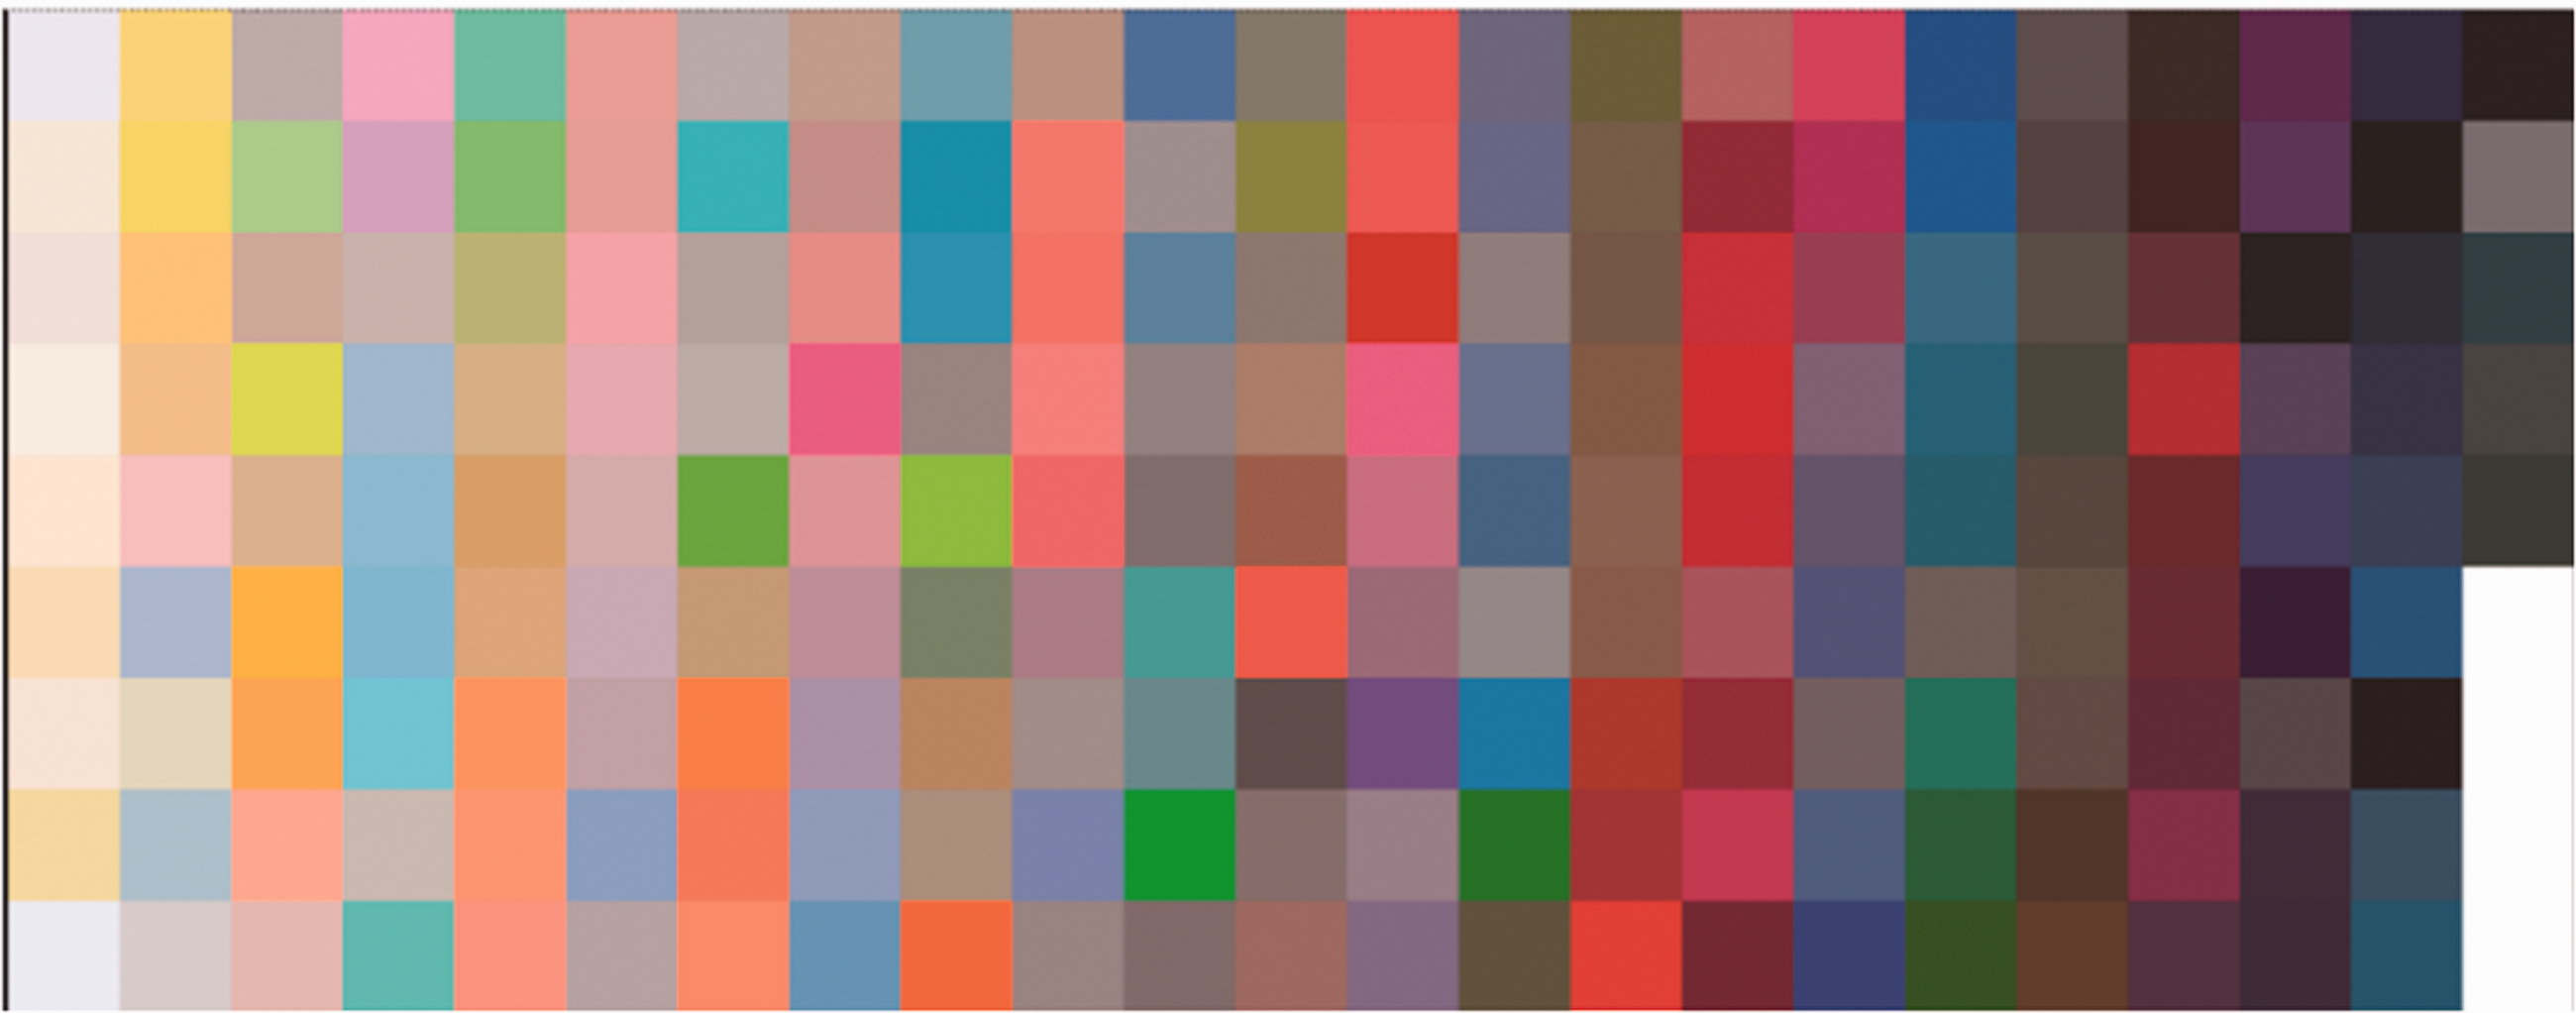
PANTONE-TSC Standard Color Checker.
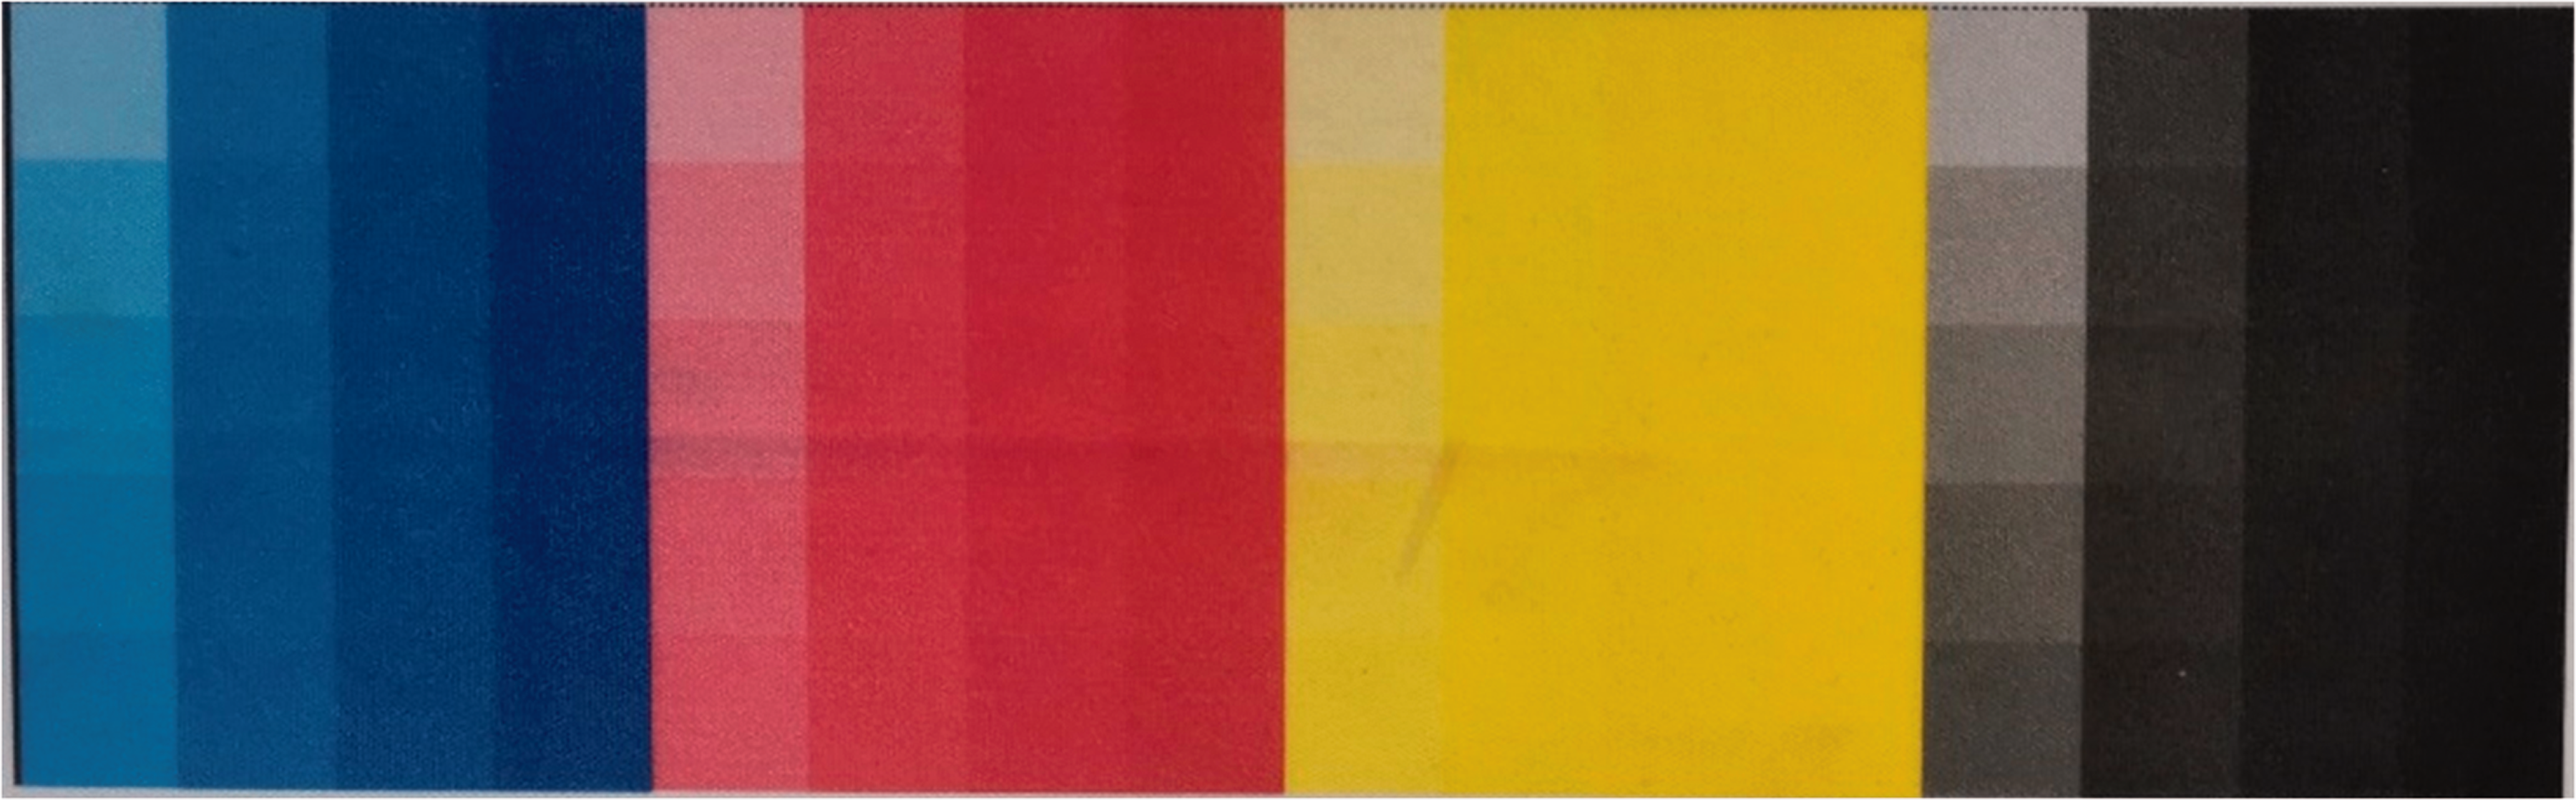
For the ink volume control method, the maximum amount of dye ink volume that a fabric can hold is different due to the difference in fabric structural characteristics and treatments. 15 The maximum single-channel ink volume should be determined by the ink volume when each primary color of CMYK reaches the maximum color density on the fabric. A large amount of ink volume exceeding a certain range will not cause the color density to increase significantly, while a small amount of ink volume will result in low saturation. Therefore, it is necessary to control the single-channel ink volume of the printing machine to perform color management and achieve better results. The density gradient color card of the four primary colors shown in Figure 7 was adopted as the standard color card, 23 in which each color had 20 color blocks with dot area coverage being set from 5% to 100% with increments of 5%. After the color density value of each color block printed on samples was measured, the single-channel ink volume value was determined as the regression point in the relation curve between dot area coverage and color density.
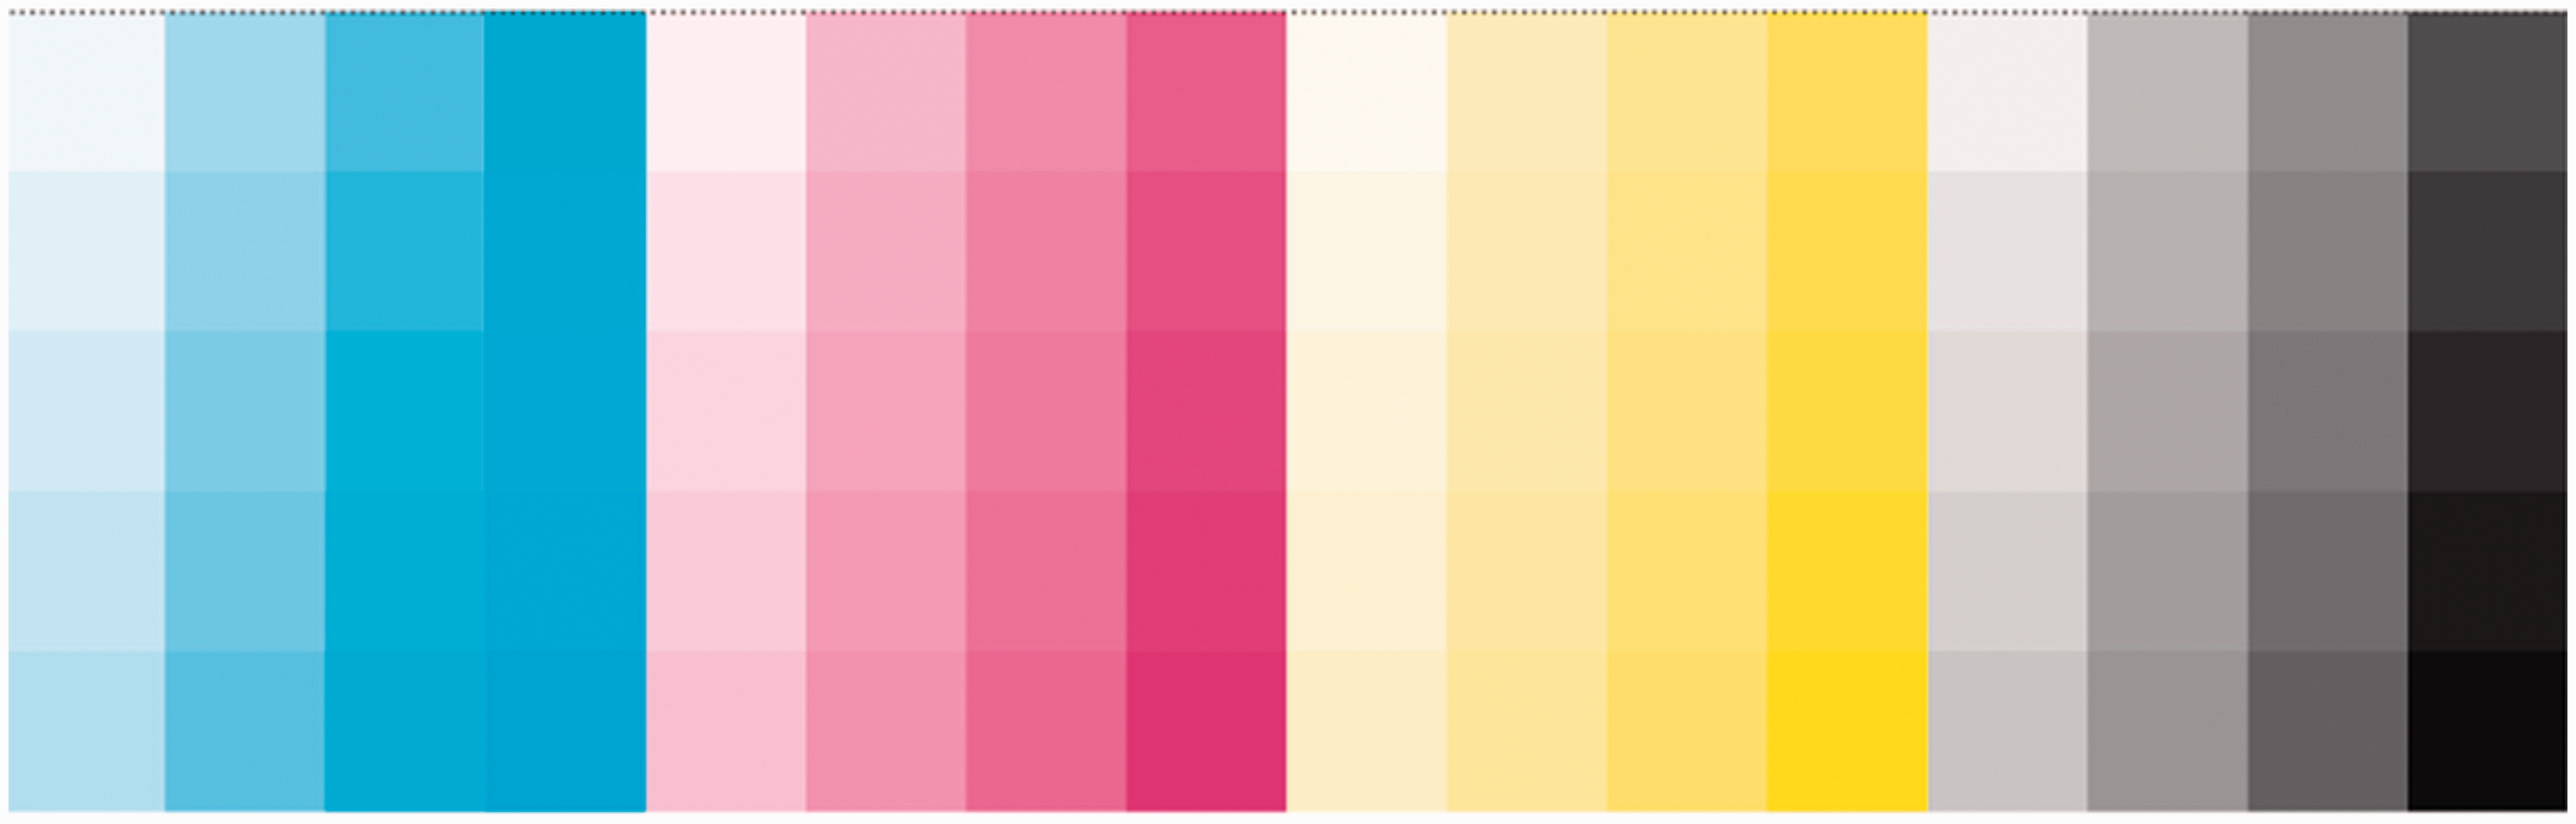
Gradient color card.
Figure 8 shows the experimental process of the original color management and the two optimized color reproduction methods.
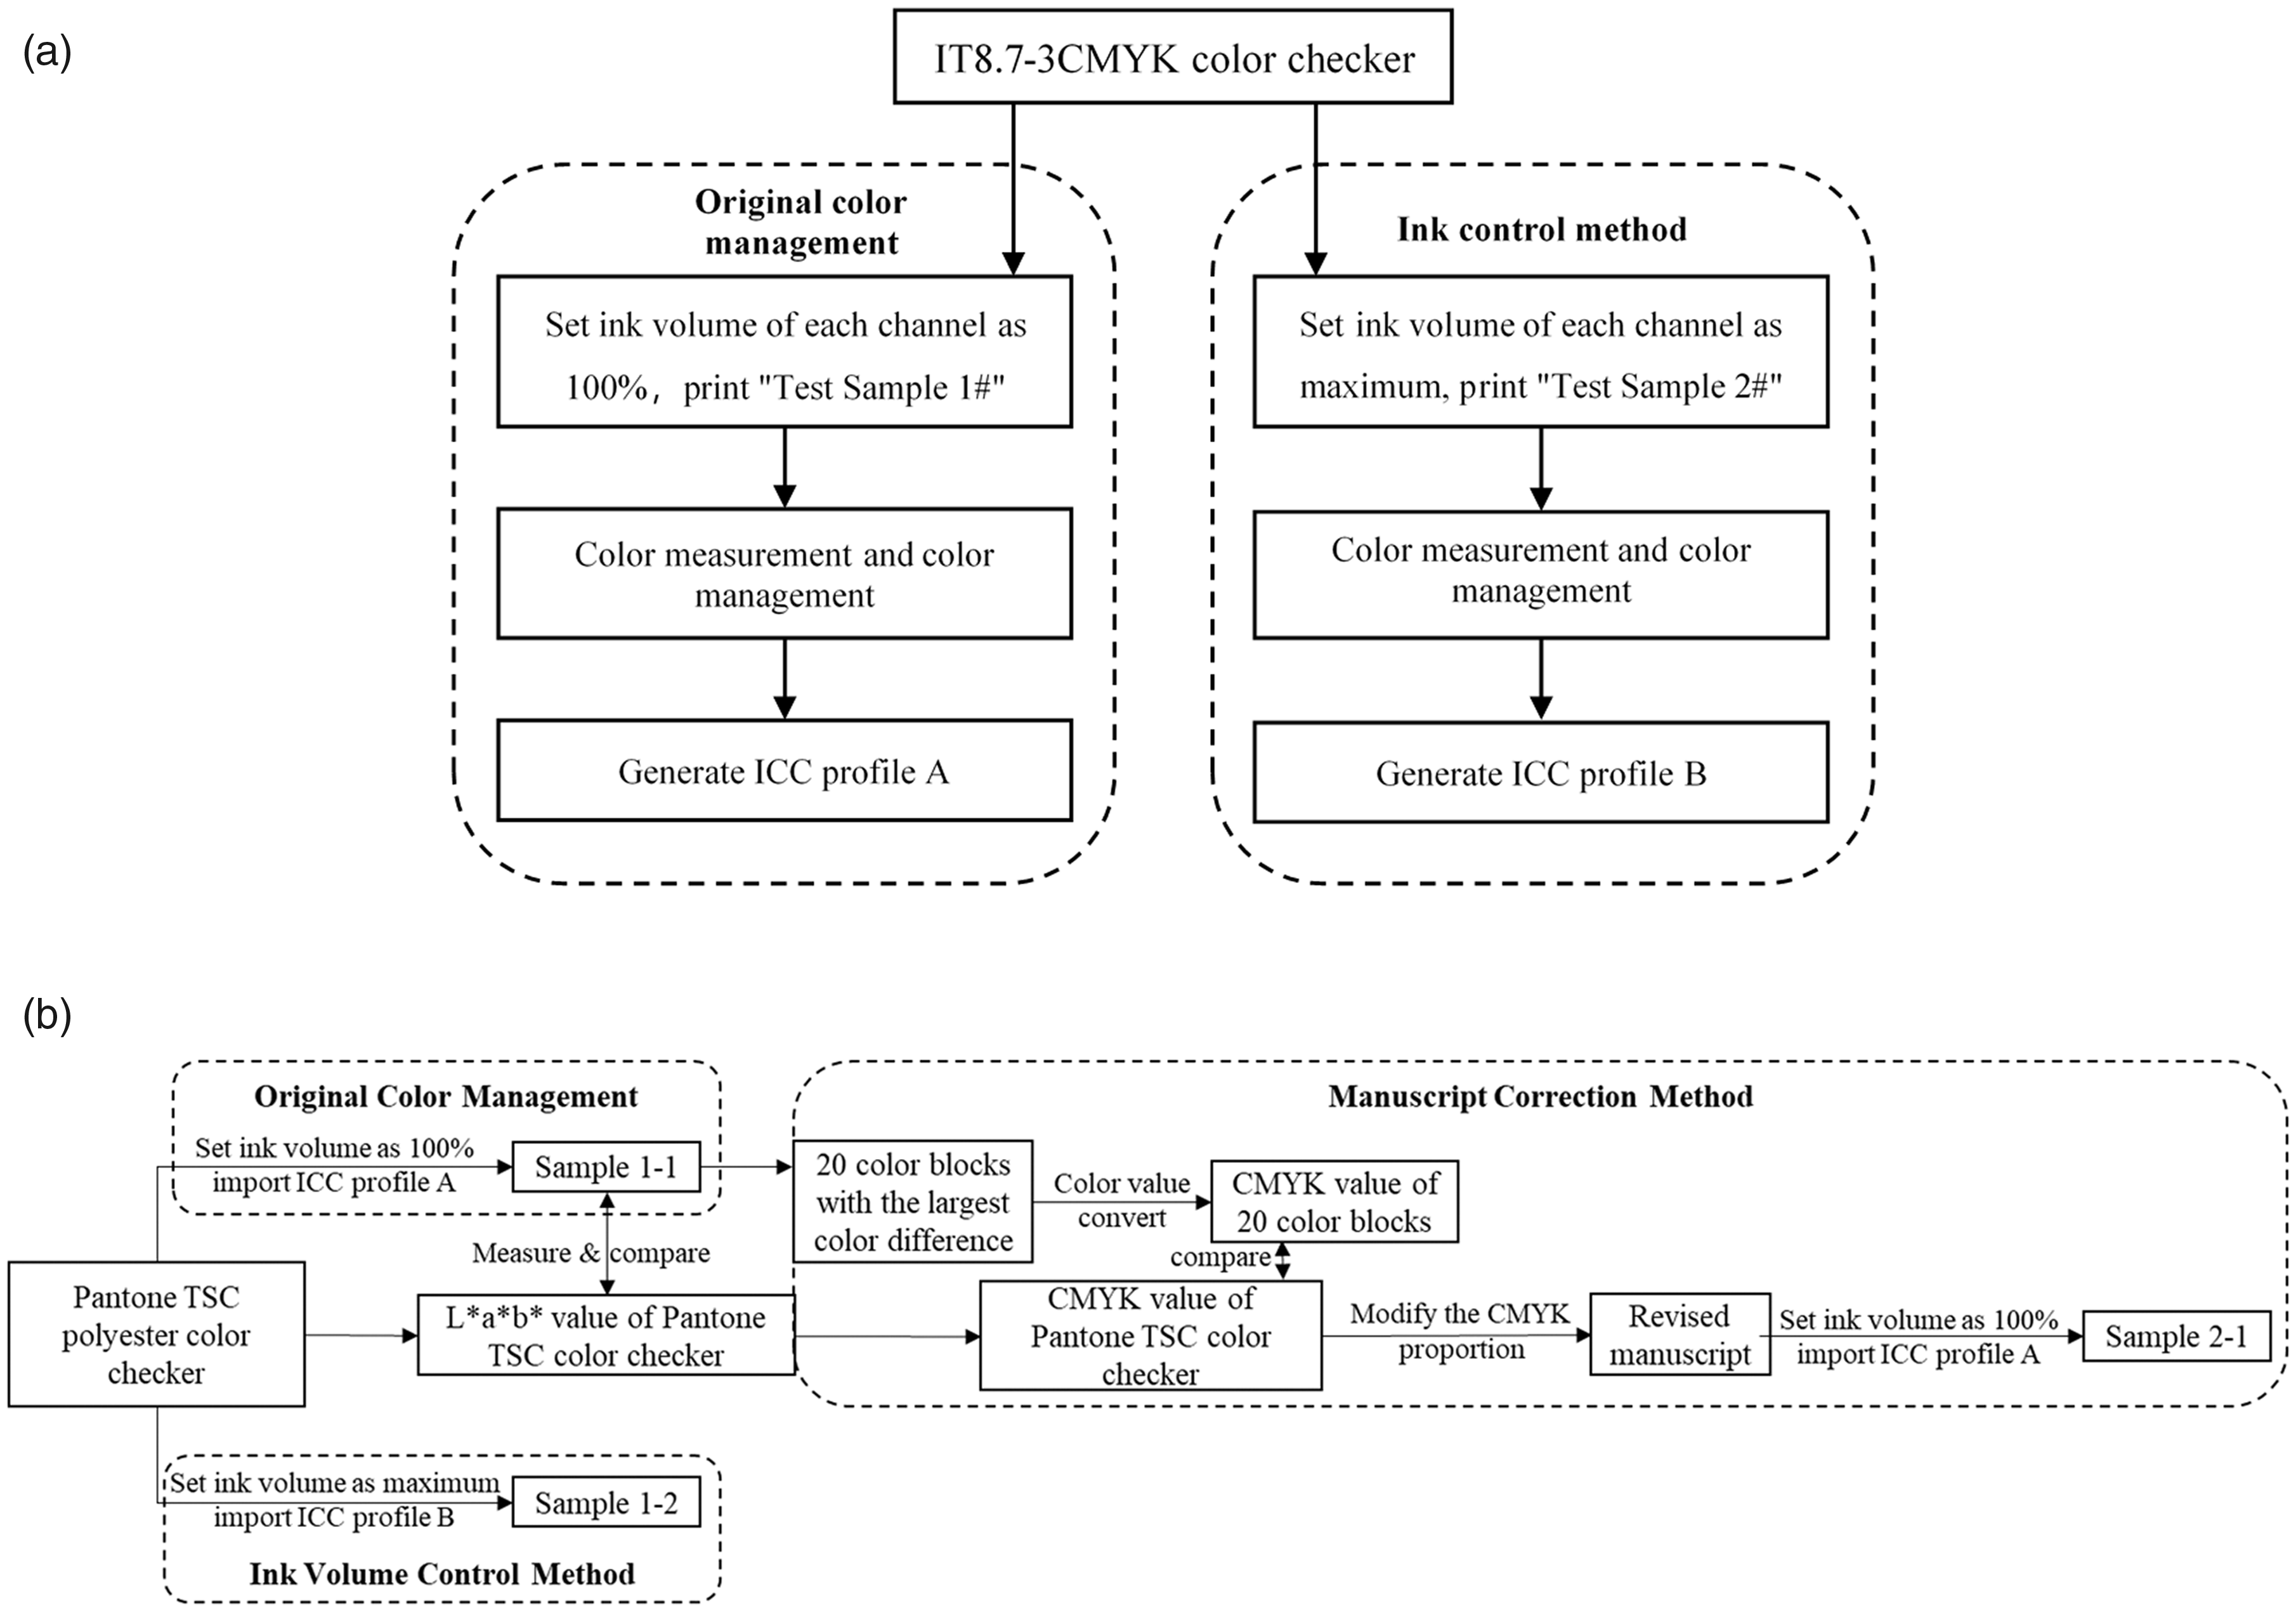
The experimental process of color management and optimized methods: (a) the first step and (b) the second step. CMYK: cyan, magenta, yellow, and black; ICC: International Color Consortium.
Results and discussion
Effect of fabric structural characteristics on the diffusion of ink droplets
To study the effect of fabric structural characteristics and ink volume on the anisotropy of ink droplet diffusion, the diffusion shapes of different ink droplets on samples 1#–4# are shown in Figure 9. It can be seen that the diffusion shapes of 0.5 μL ink droplets were nearly circular, whereas the others were irregular.
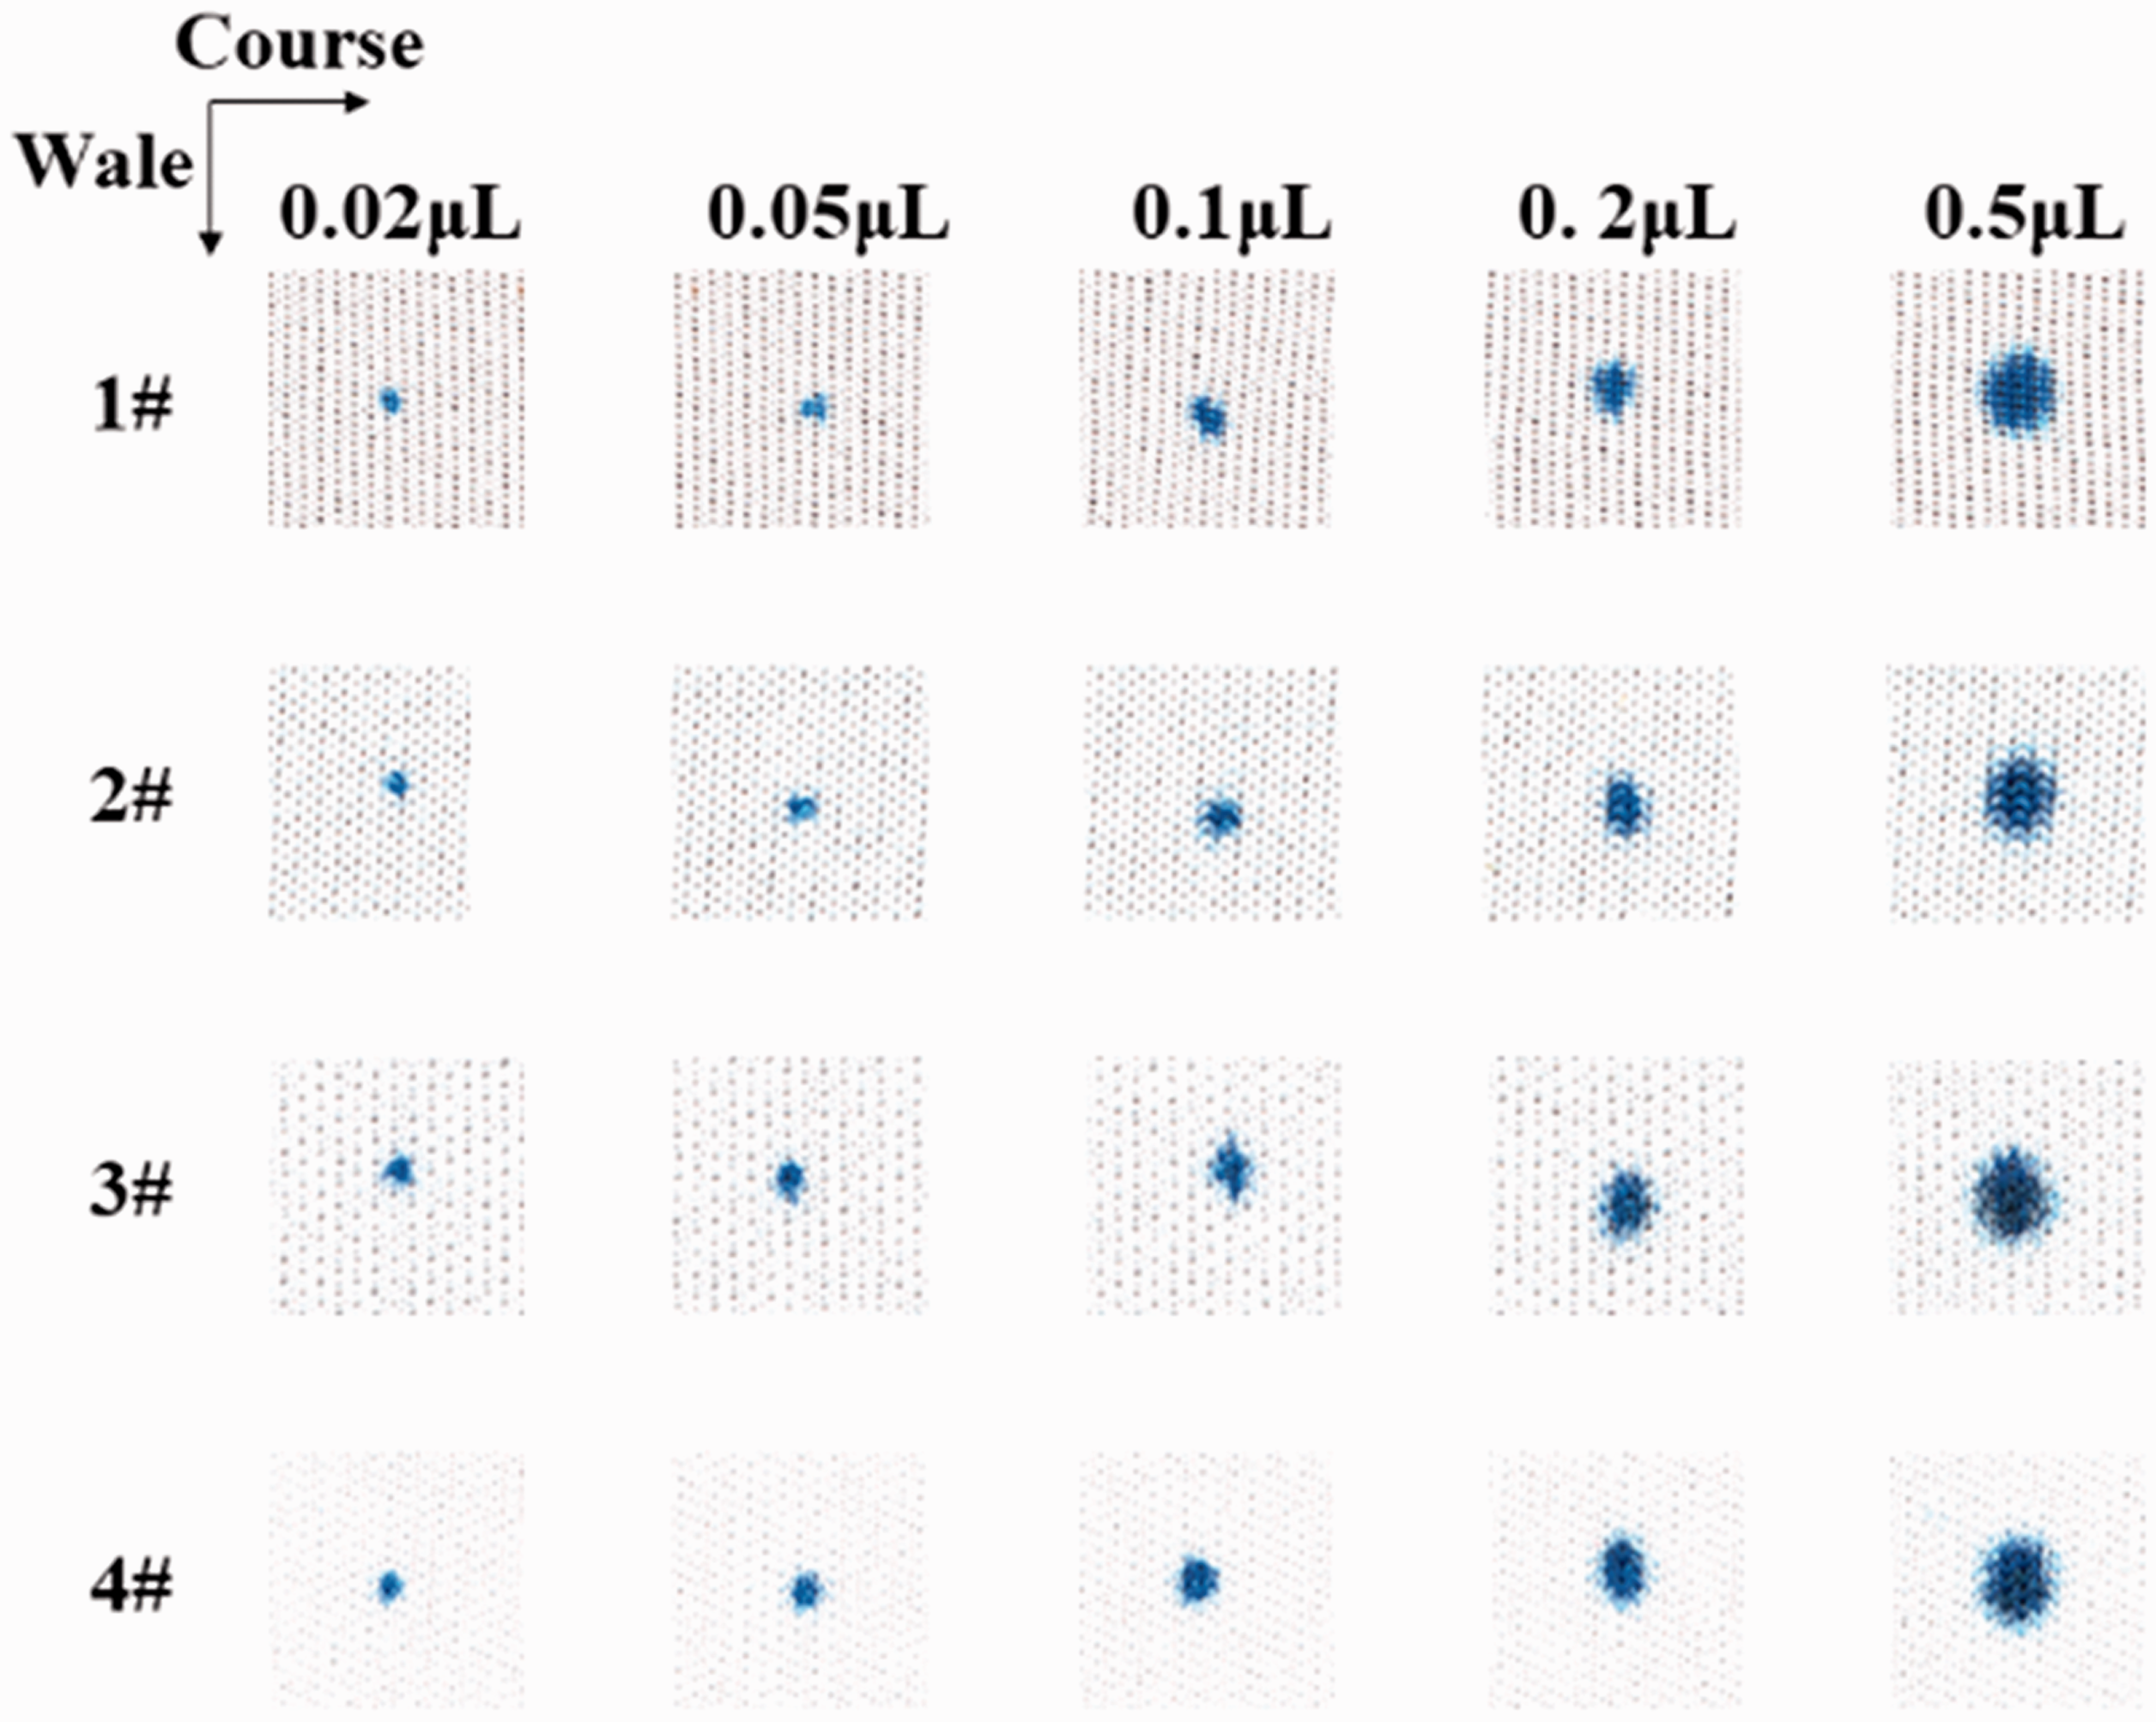
Diffusion shapes of ink droplets on samples.
Figure 10 shows the relation between the ink droplet volume and the ratio (dc/dw) of diffusion width in both the wale and course directions on fabrics. After an overall comparison, the dc/dw values of ink droplets on sample 1# were greater than 1 and close to 1, while the dc/dw values of other samples were mostly less than 1, which means the diffusion width of ink droplets on sample 1# in the course direction was slightly larger than that in the wale direction, but the anisotropy of ink droplets on sample 1# did not appear to be significant. Beyond that, when the ink droplet volume was 0.5 μL, the dc/dw values on samples were generally closer to 1, meaning the anisotropy was not shown strongly.
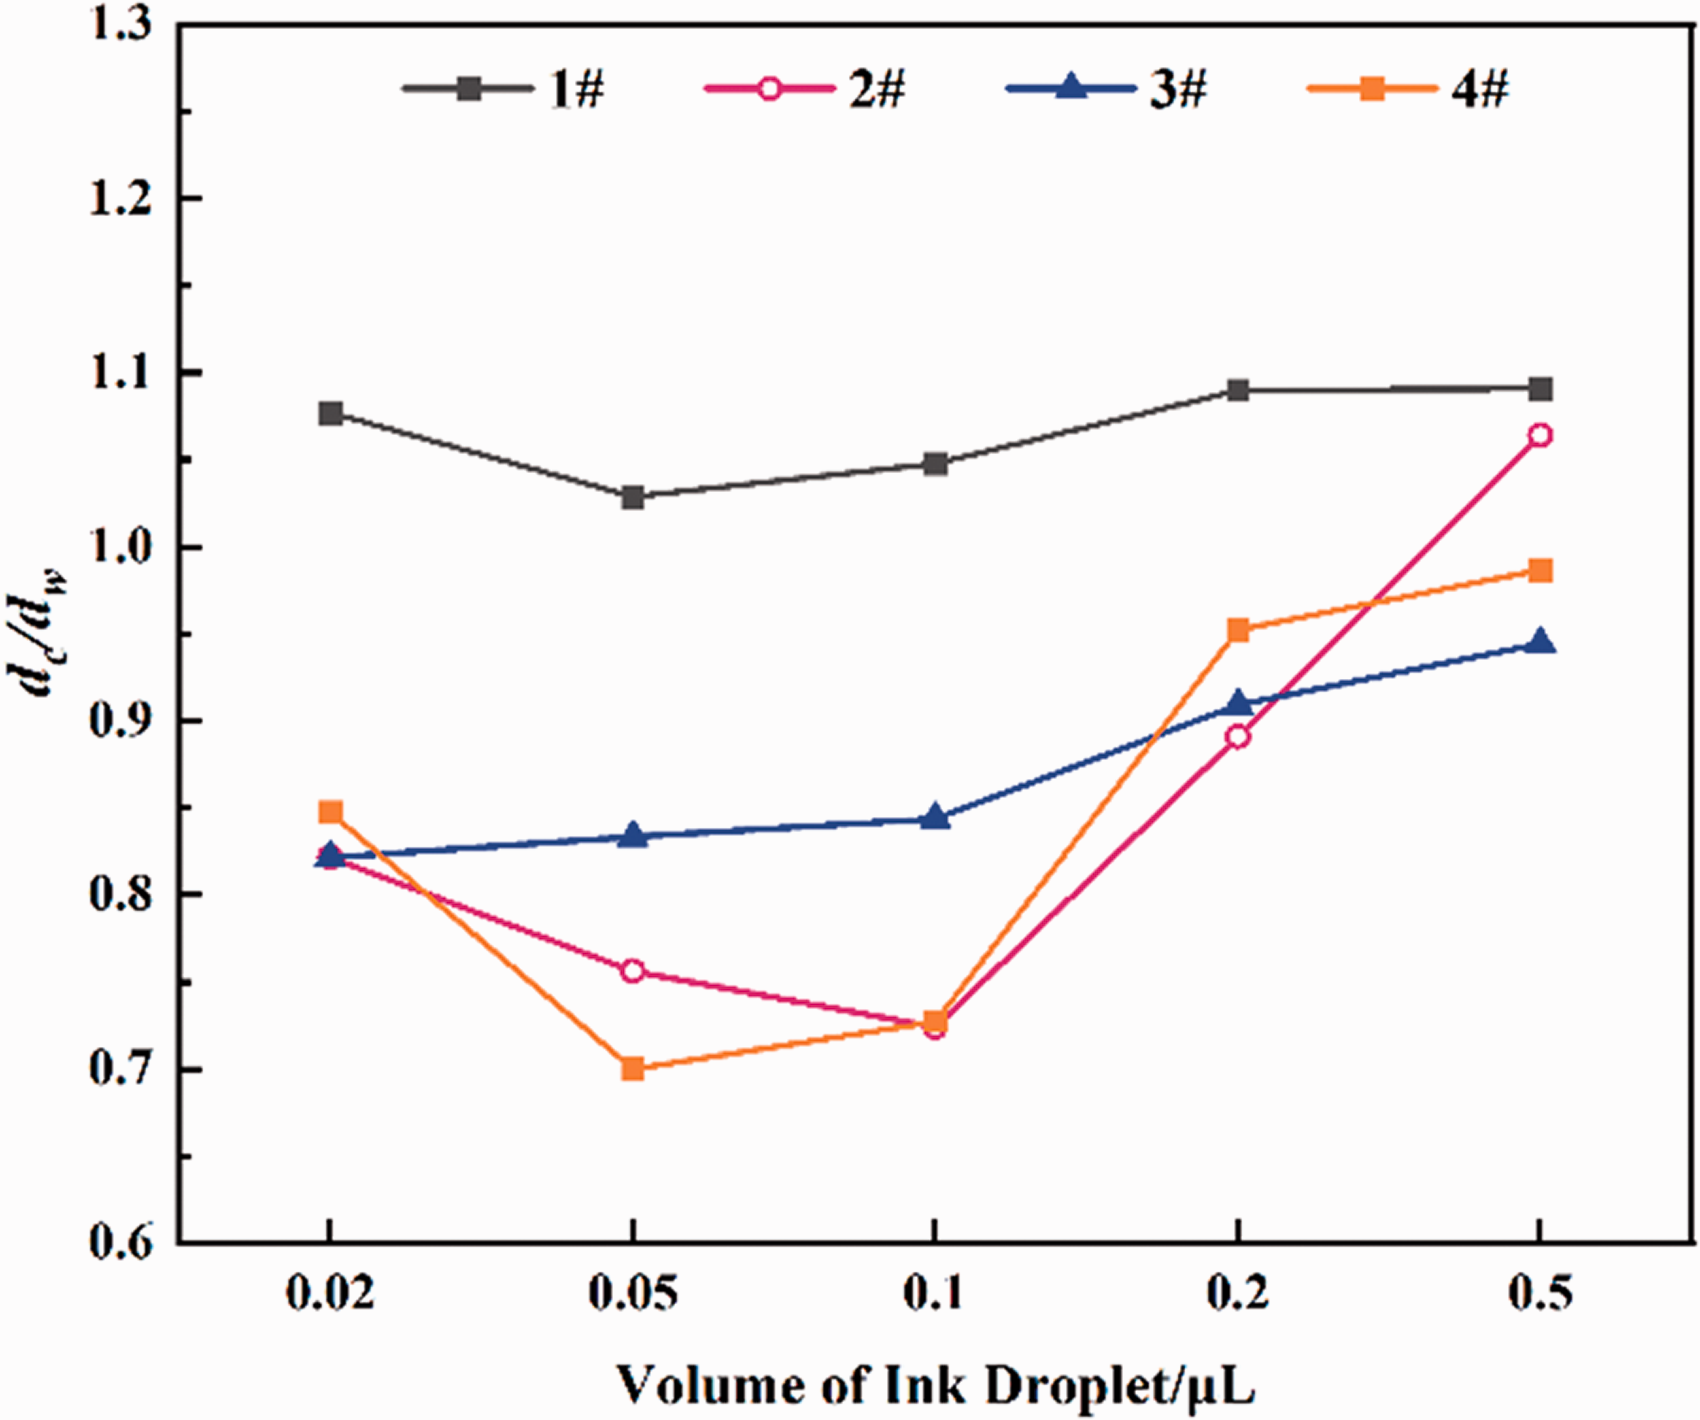
The diffusion anisotropy of ink droplets on fabrics of different weights.
Considering the effect of samples and ink droplets on anisotropic behavior, for diminishing the impact of anisotropy, the ink droplet with a volume of 0.5 μL was chosen to study the influence of fabric structural characteristics on ink droplet diffusion, and fabric porosity was selected as a comprehensive characterization of the fabric structure due to the complexity of fabric structural parameters.
According to observation through an optical microscope, the diffusion behaviors of ink droplets on four samples were almost the same, probably because of the same fabric construction of plain stitch and the same yarn size. Taking the picture of the 0.5 μL ink droplet diffused on sample 1# as an example, shown in Figure 11, in the wale, the ink diffused along the yarns due to the capillary effect of fibers; in the course, the ink not only diffused through the underlap but also diffused to the adjacent loop by contacting. This is consistent with the research of Calvert and Chitnis,24 Öztürk et al.,25 and Yanılmaz and Kalaoğlu 26 that the ink spreads along the yarn on the surface of knitted fabric, which is caused by the capillary effect or wicking effect of yarns.
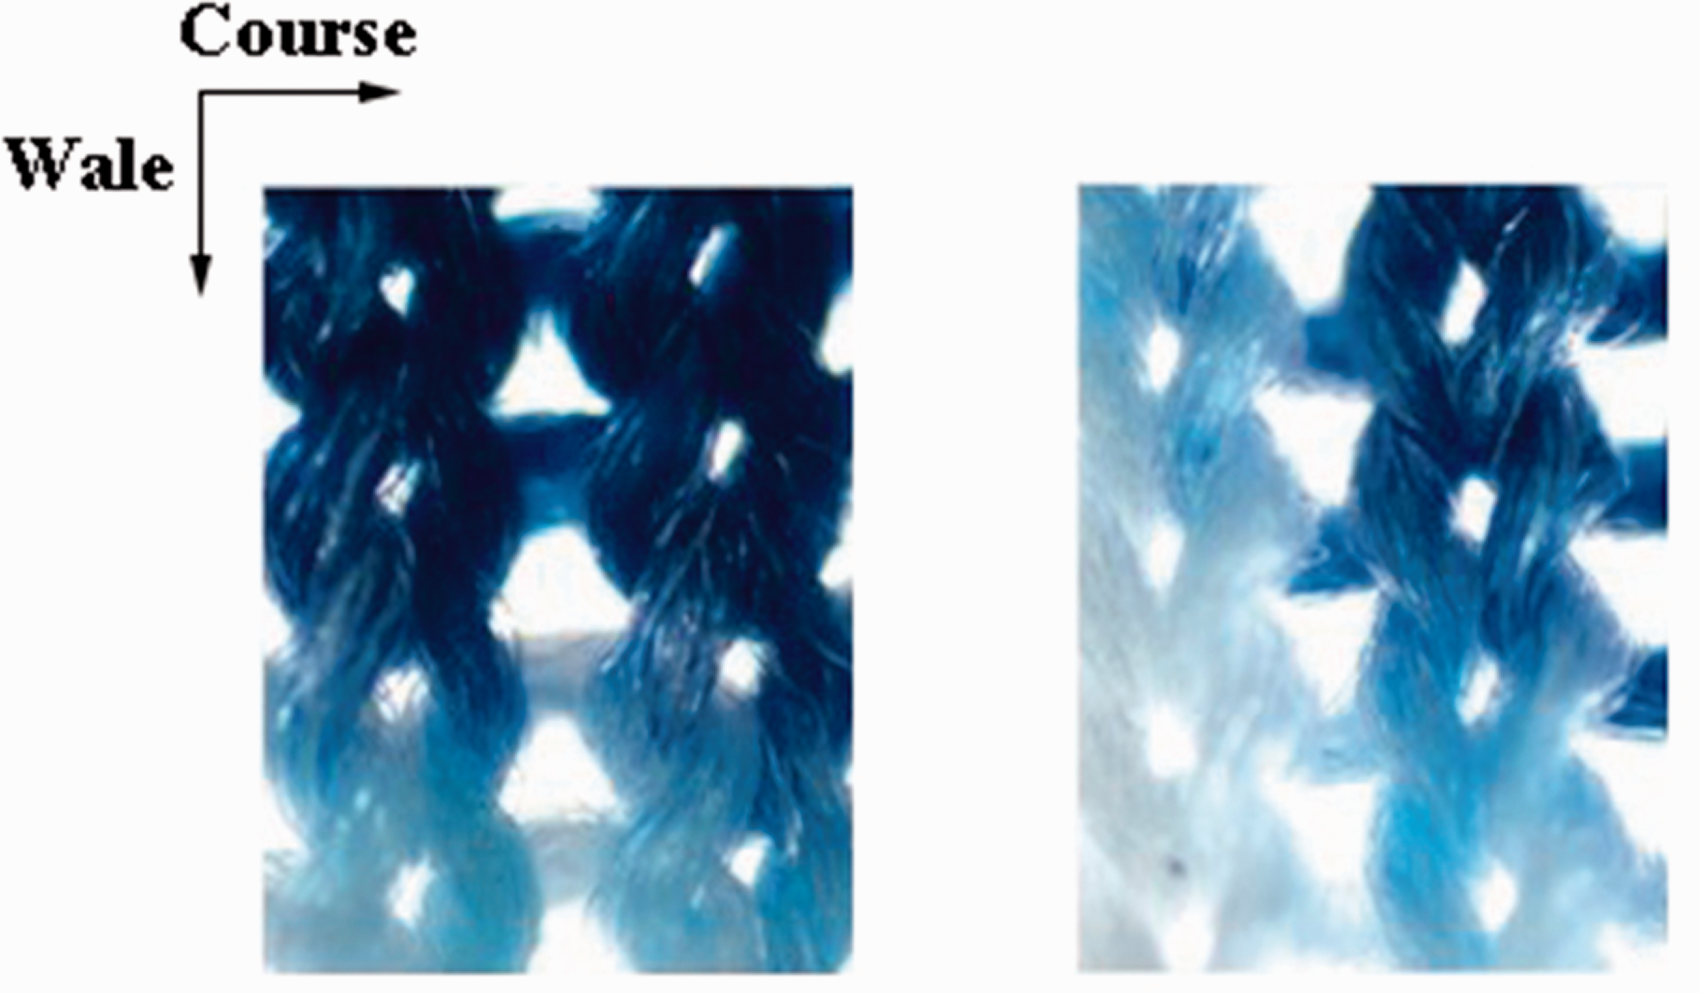
The diffusion of ink droplets on sample 1#.
The relation between fabric porosity and diffusion area is shown in Figure 12. The fabric porosity of the samples could be ordered as 2# < 4# < 1# < 3#, while the diffusion area of the samples could be ordered as 2# > 4# > 1# > 3#, which indicates that the smaller the porosity, the tighter the yarn arrangement, and the stronger the capillary effect would make the liquid spread easier on the fabric surface to cause the larger diffusion area.
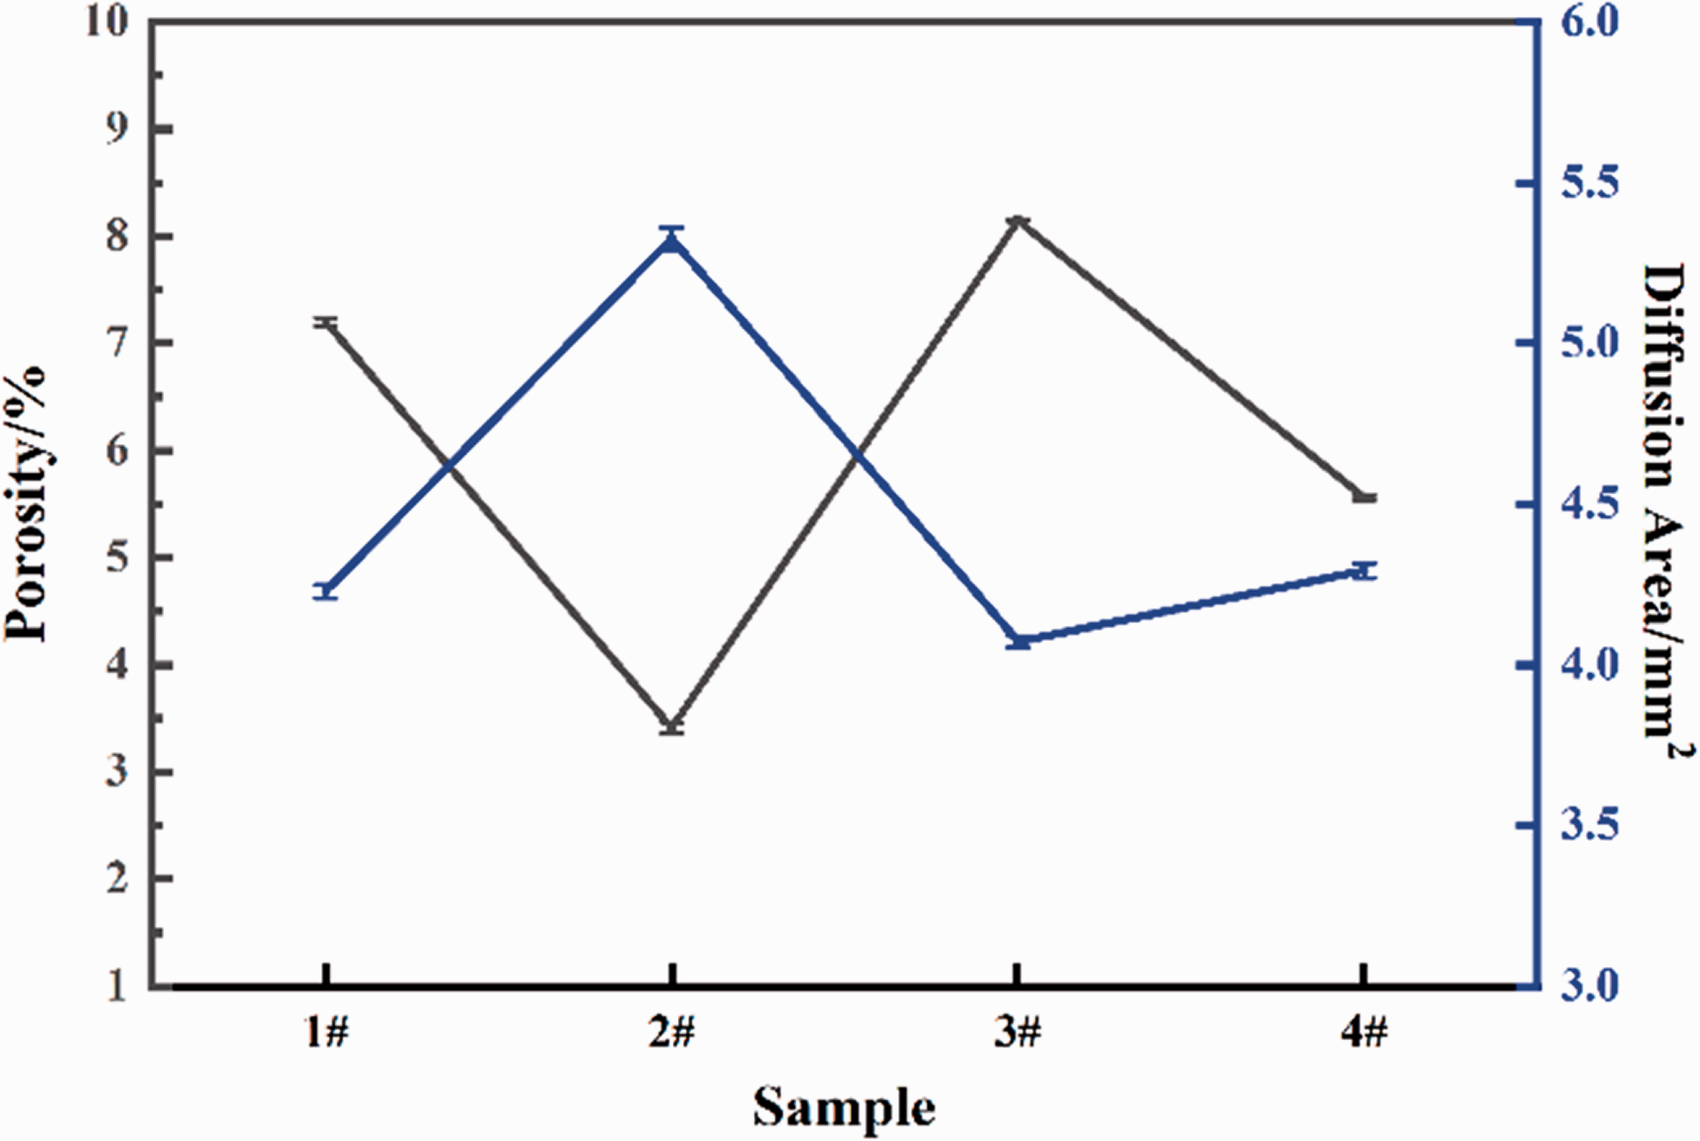
The relation between fabric structural characteristics and the diffusion property.
Effect of fabric treatment on the diffusion of ink droplets
The diffusion shapes of ink lines on fabrics with different treatment methods are shown in Figure 13. Taking 0.4 and 0.8 mm printing lines as examples, the ink diffusion range on the unpretreated fabric was wider than that of pretreated fabric, and the boundary of the lines was blurred. No matter whether in the wale direction or in the course direction, the ink arrayed in parallel lines on the pretreated fabric, and there were few sawtooth diffusion points formed.
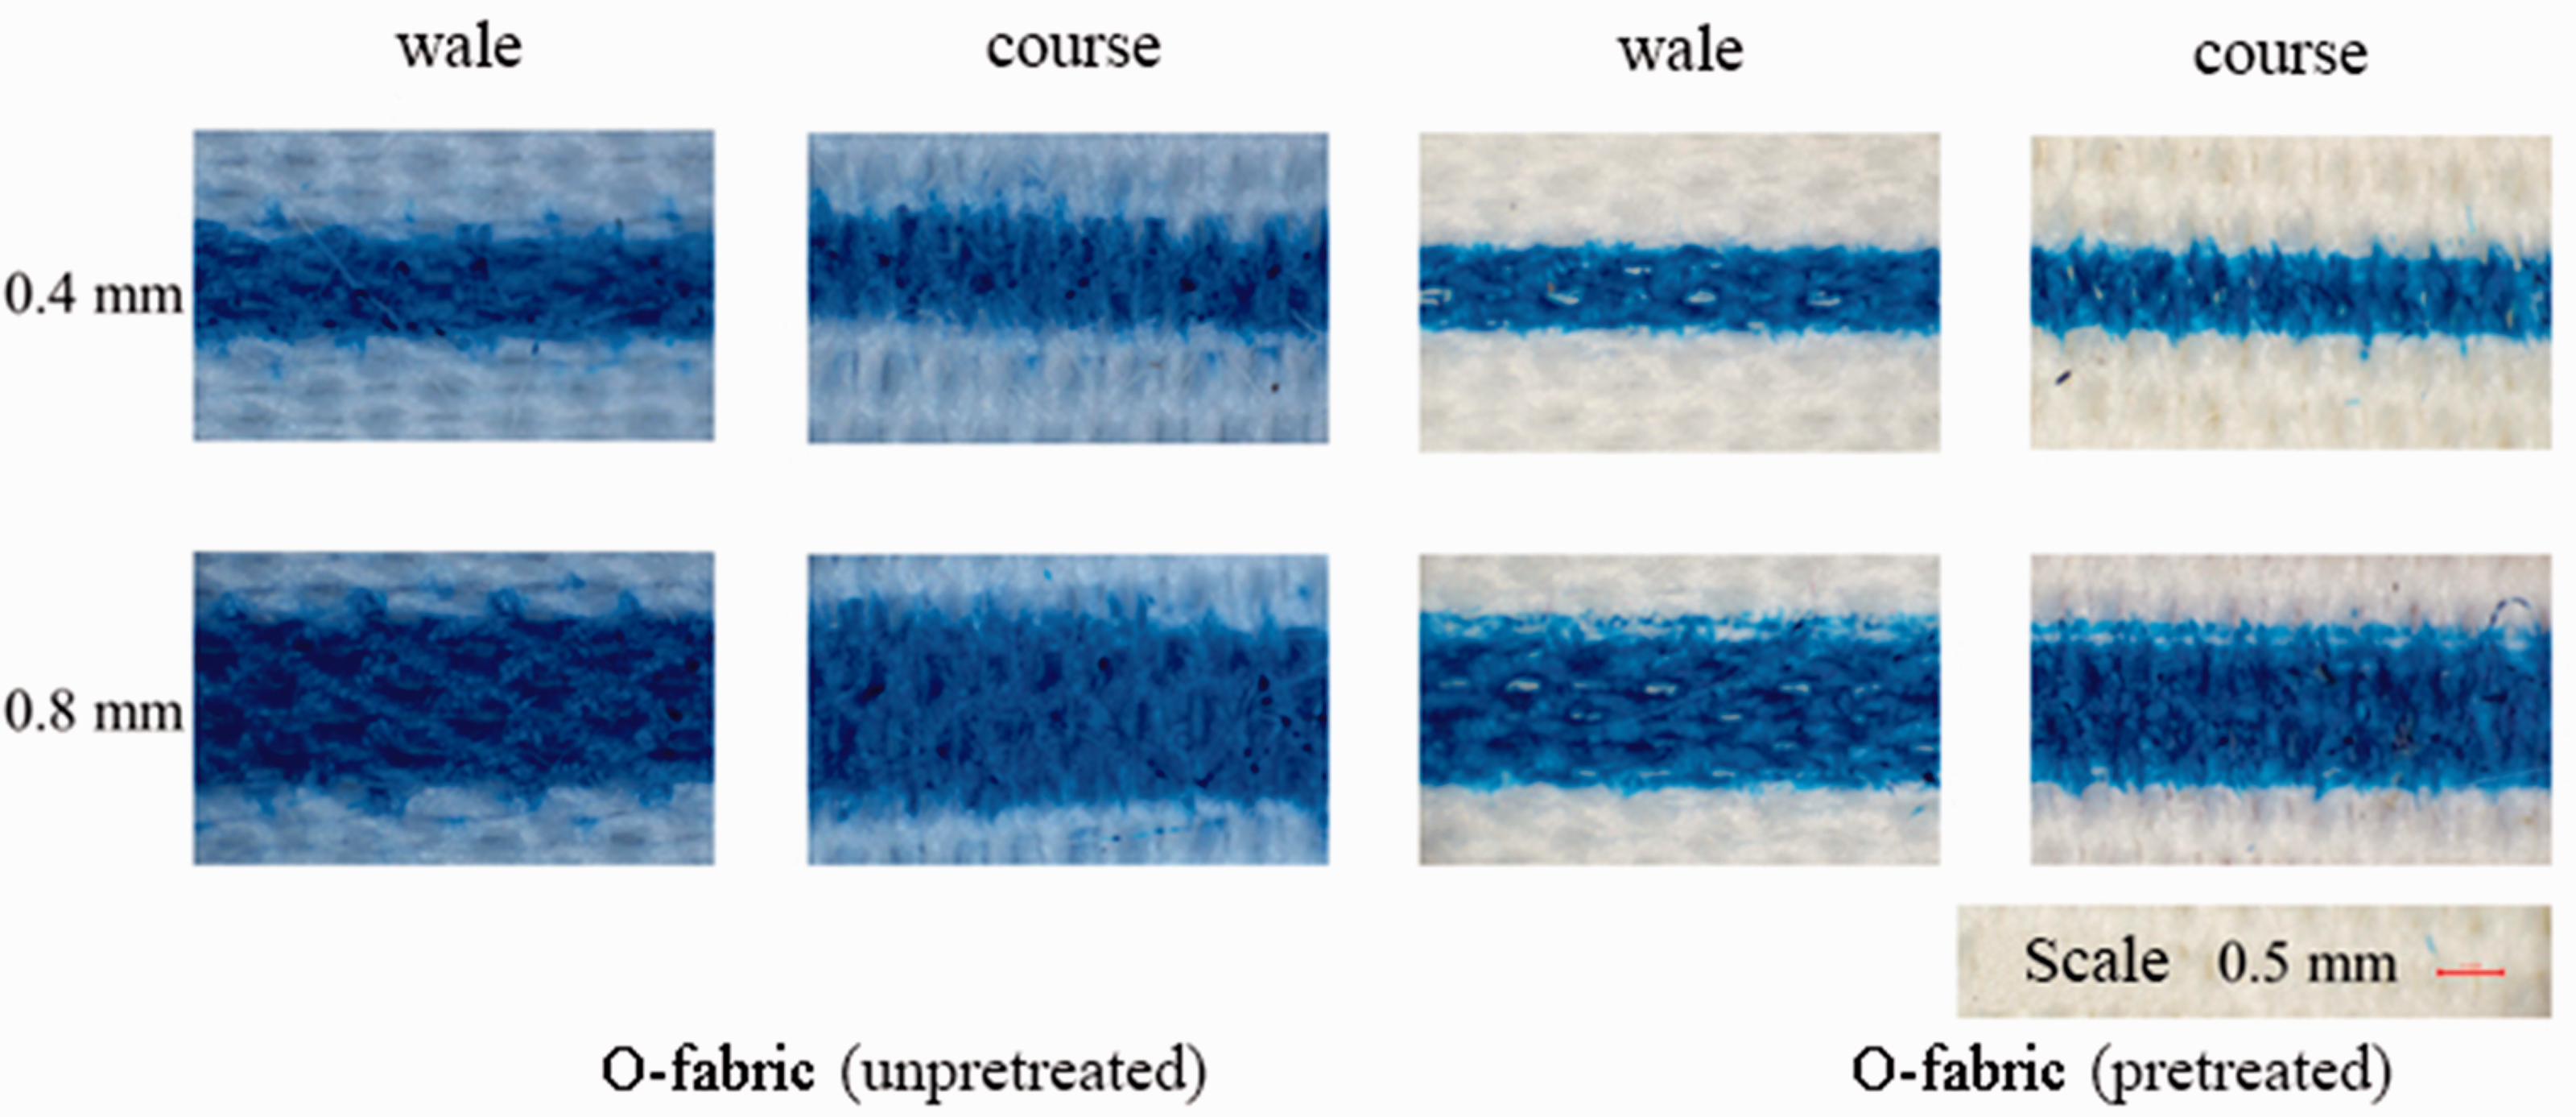
Dynamic diffusion behavior of ink on fabrics with different treatments.
The pretreatment agent formed film on fibers as Figure 14 shows, which indicates that the capillary channels may be diminished and the resistance of ink transporting between fibers might be increased. Thus, the diffusion speed of ink droplets could be decreased, which means the anti-permeability of the fabric might be improved. The finish also affected the surface morphology of the fibers, but this was not as significant as the pretreatment effect.
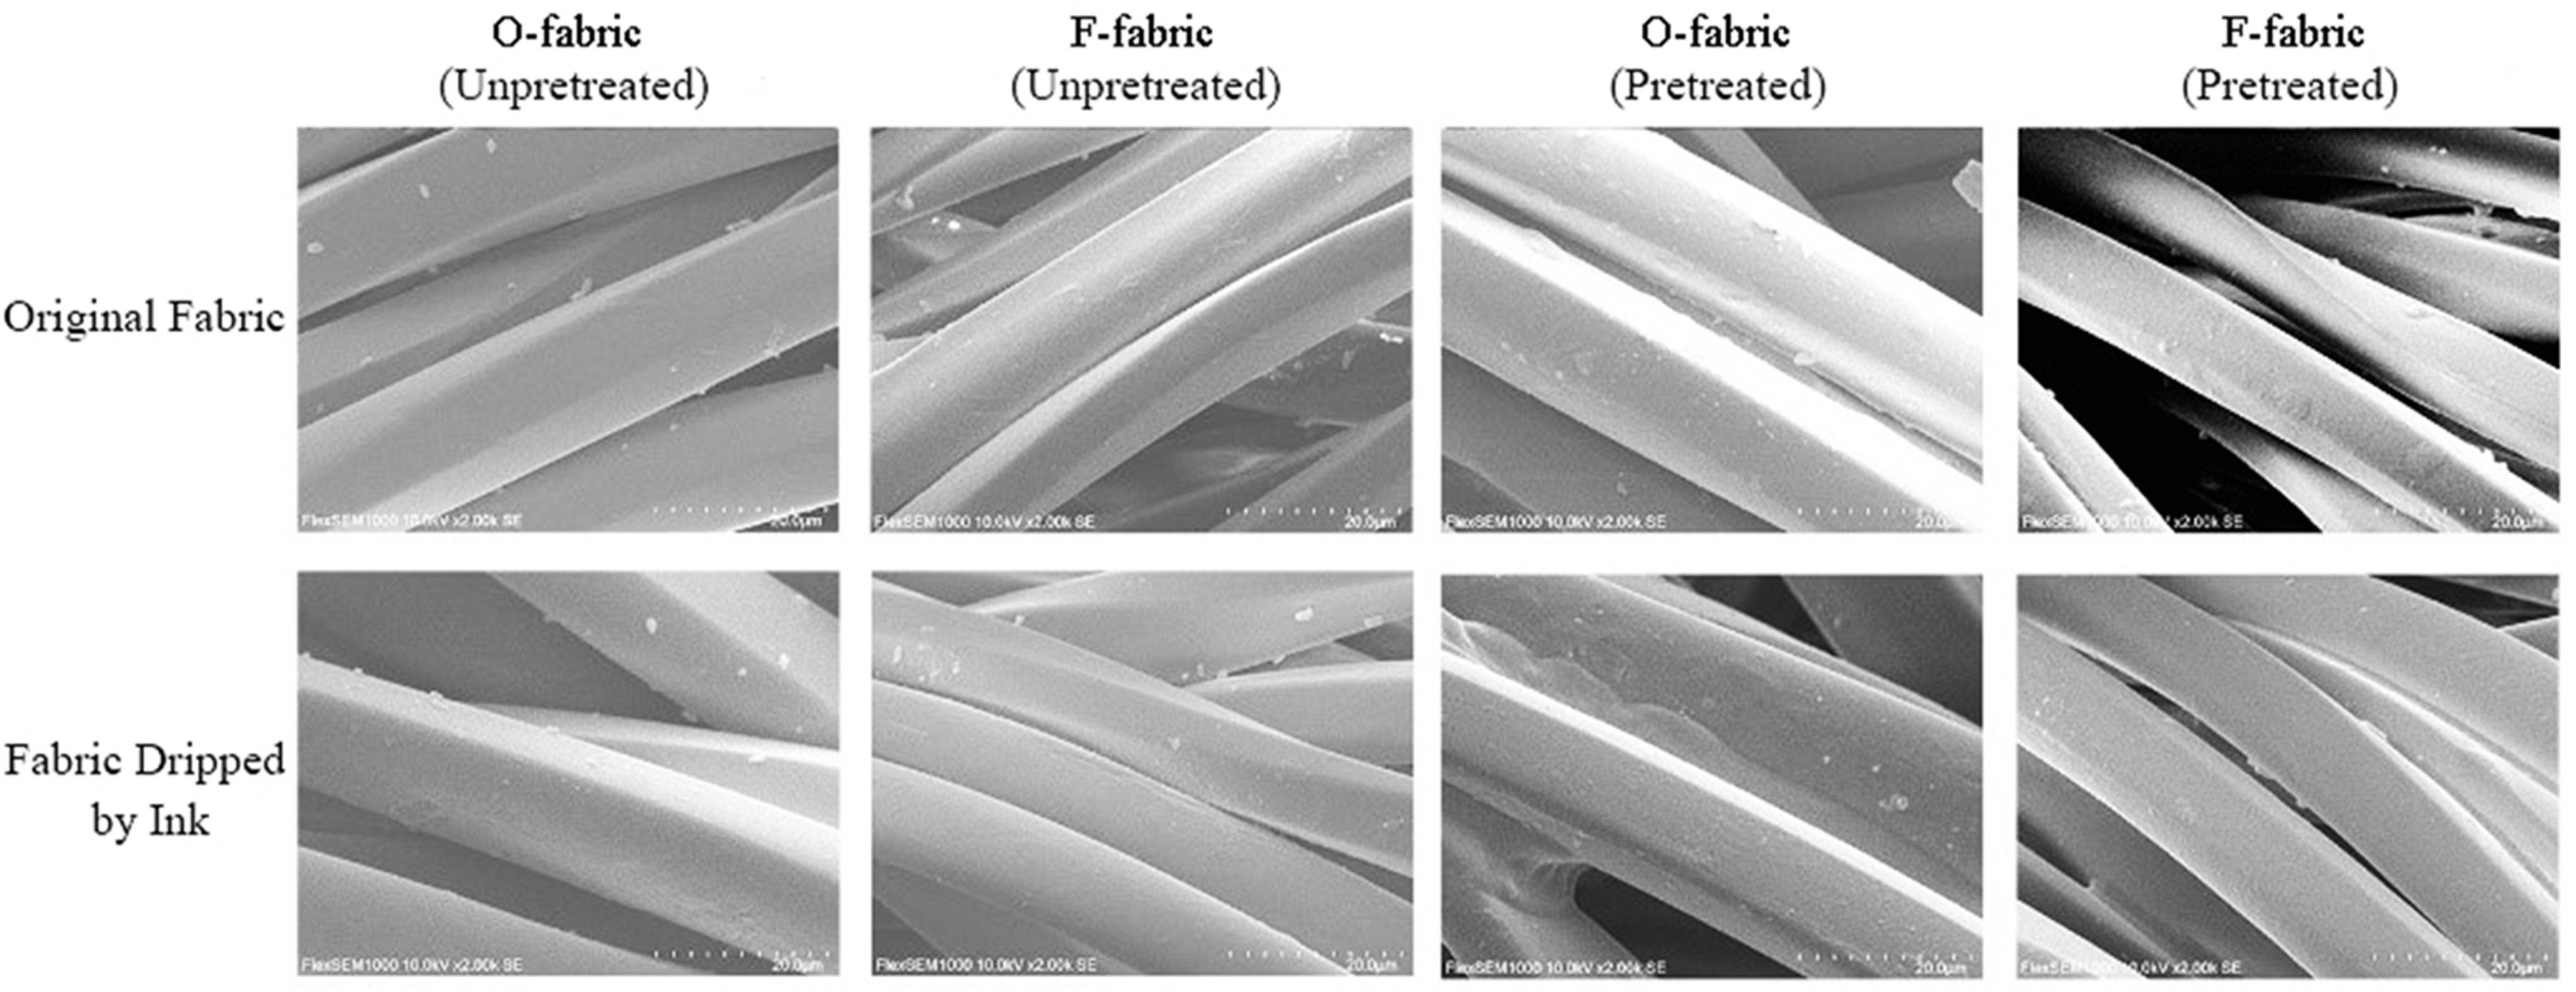
Scanning electron microscopy photographs of fabrics.
The diffusion area and the anisotropy of 0.5 μL ink droplets on samples 1#, 5#, 6#, and 7# are shown in Figure 15(a), while Figure 15(b) shows the effect of treatment on the diffusion width of different volumes of ink droplets. It can be seen that the diffusion area of the ink droplets on the o-fabric was reduced exponentially after pretreatment, indicating that the anti-permeability of the fabric surface might have been greatly improved. Likewise, the anti-permeability of the f-fabric, which had a wider diffusion area of ink droplets than that of o-fabric, probably because of the hydrophilic film, had also been greatly improved. The f-fabric showed larger diffusion width in the wale and course than the o-fabric, and dc/dw was closer to 1, which means the diffusion anisotropy on the f-fabric in two directions was not as obvious as in the o-fabric. At the same time, the diffusion width of ink droplets on pretreated fabric was reduced in two directions, and the permeation might be weakened, but the diffusion anisotropy did not change significantly.
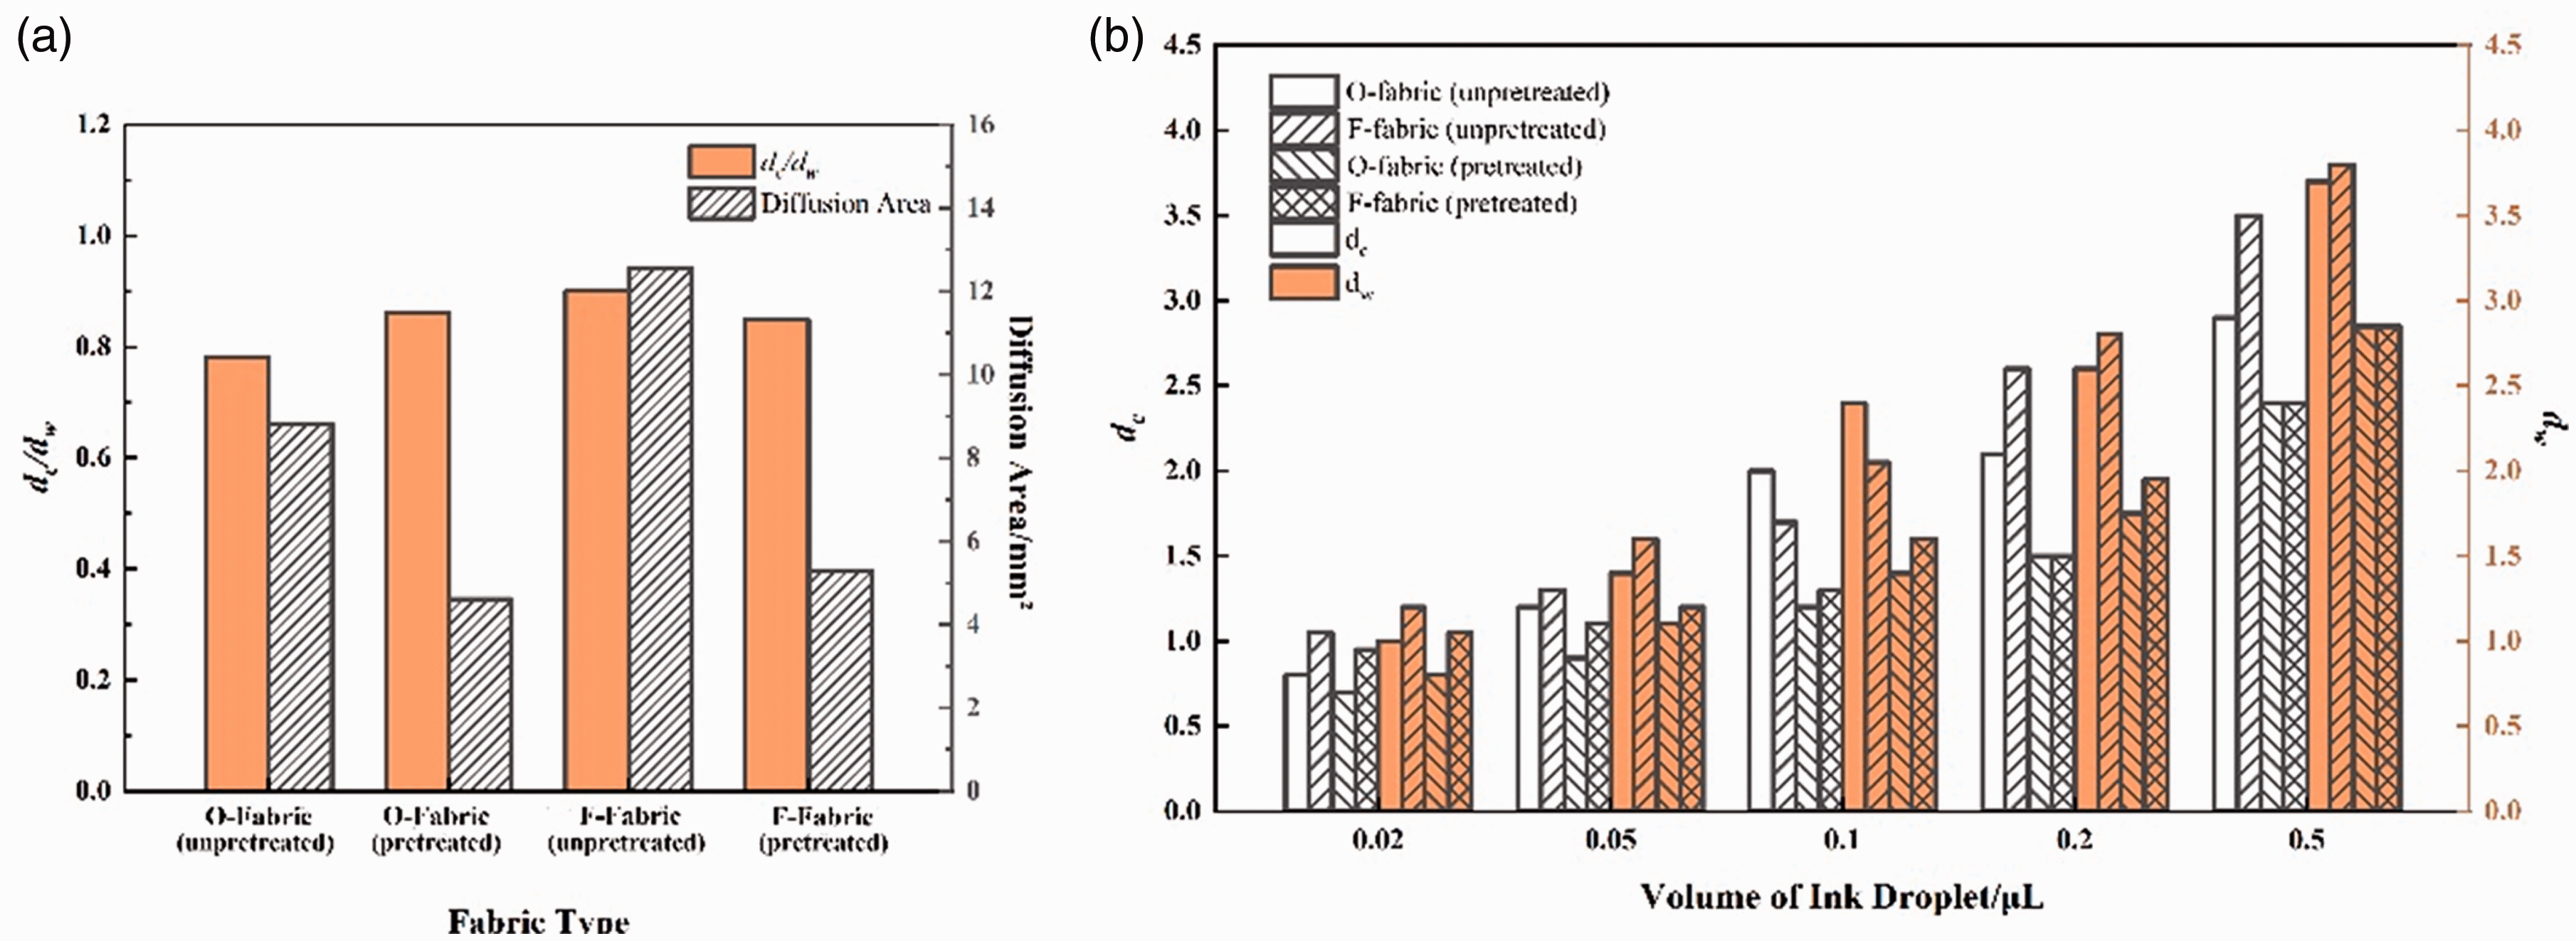
The diffusion characteristics of ink droplets on fabrics: (a) the diffusion area and anisotropy and (b) the diffusion width.
Correlation between diffusion and color presenting of ink droplets
Effect of fabric structural characteristics on the color presenting of ink droplets
For the study of fabric structural characteristics impacting on the color presenting of disperse ink on samples 1#–4#, the chromatic values of the color blocks are shown in Table 3 and Figure 16.
Chromatic value of the different weights of fabrics
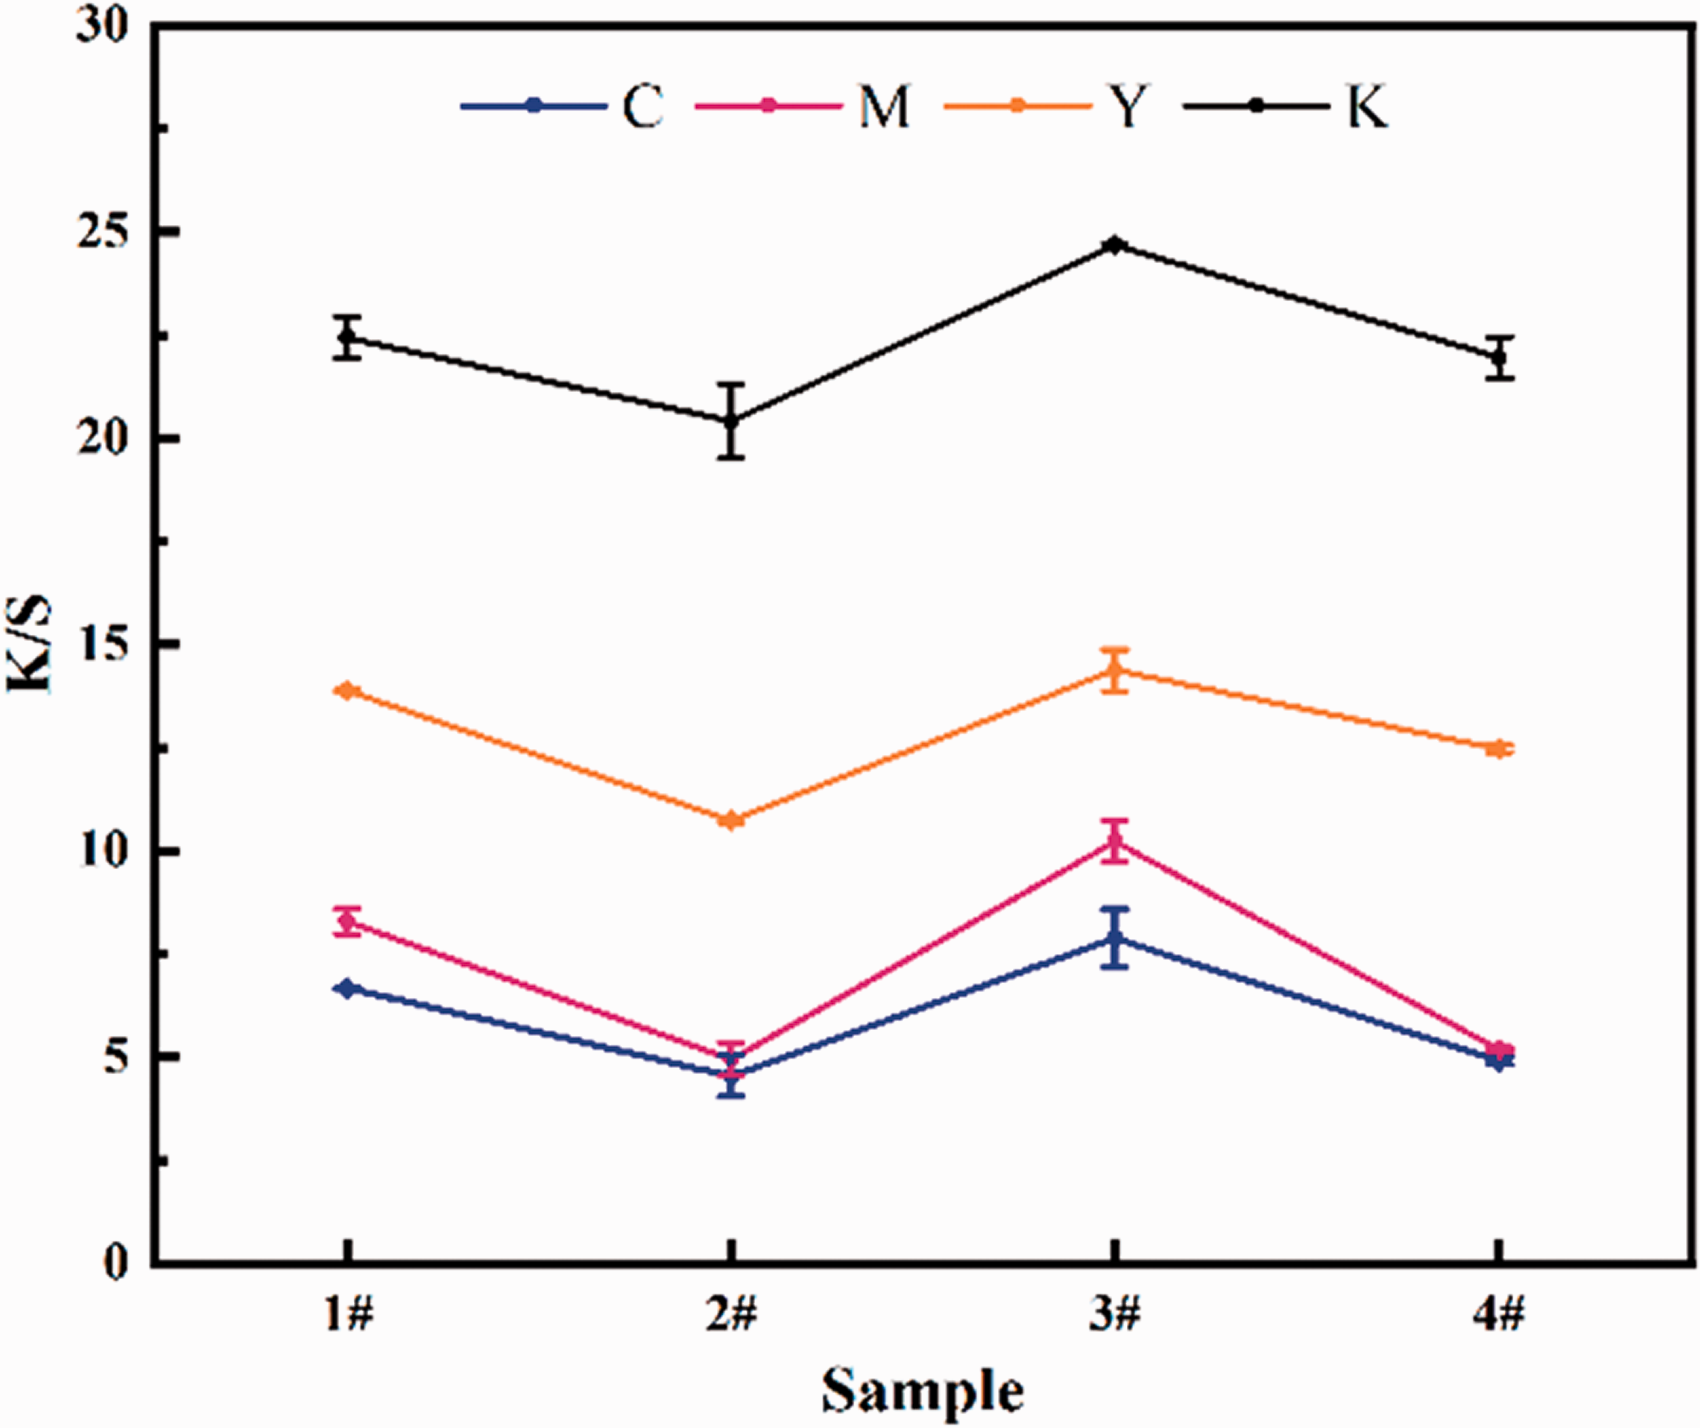
The K/S values of four-color blocks on samples with different fabric structures.
It can be seen from the table and figure that the L* value of the samples could be ranked as 2# > 4# > 1# > 3#, while the K/S value of the samples showed the opposite trend. Combining with Figure 12, the K/S values of the four samples had a trend of decreasing with the increase of diffusion area. This might be because the smaller the fabric porosity is, the stronger the capillary effect would be, and the ink could diffuse more easily to cause a larger diffusion area with less ink gathering together, resulting in the decrease of the absorption constant and the increase of the scattering constant with a small K/S value, which indicates that the color block appears light. As to the L* value for the lightness of the color blocks, the smaller the fabric porosity, the greater the lightness, and the brighter the color appears. Since the color appearance of fabric is a mixture effect of various factors, the change law of the a* value and b* value could not be found. The C* value for the saturation of color blocks increased with the increase of the fabric porosity, indicating that the color component of the color blocks increased because of the decrease of the diffusion area.
Effect of fabric treatment on the color presenting of ink droplets
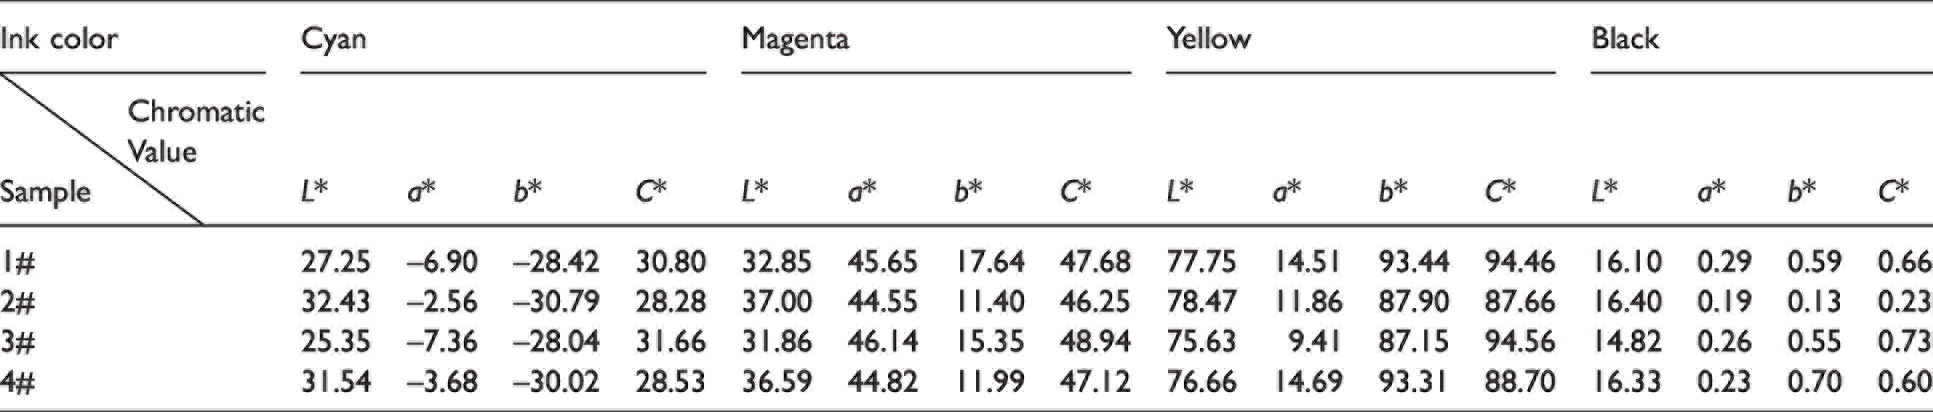
For the study of treatment impacting on color presenting of disperse ink on samples 1#, 5#, 6#, and 7#, the chromatic value of the color blocks is shown in Table 4 and Figure 17.
Chromatic value of fabrics with different treatments
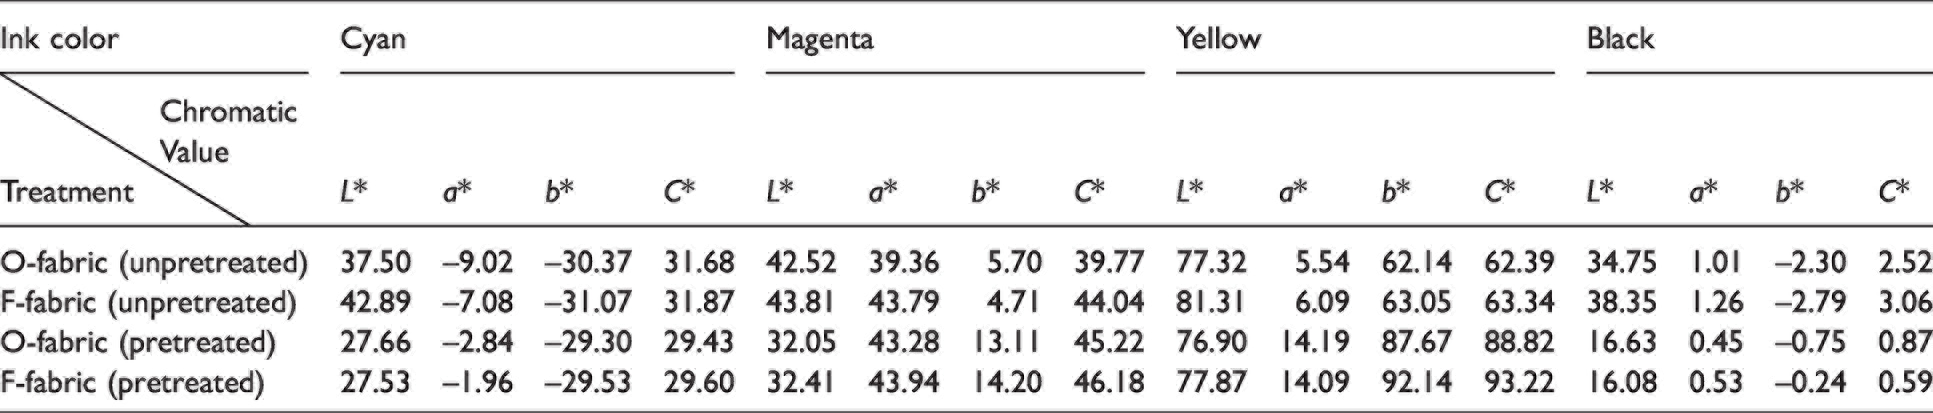
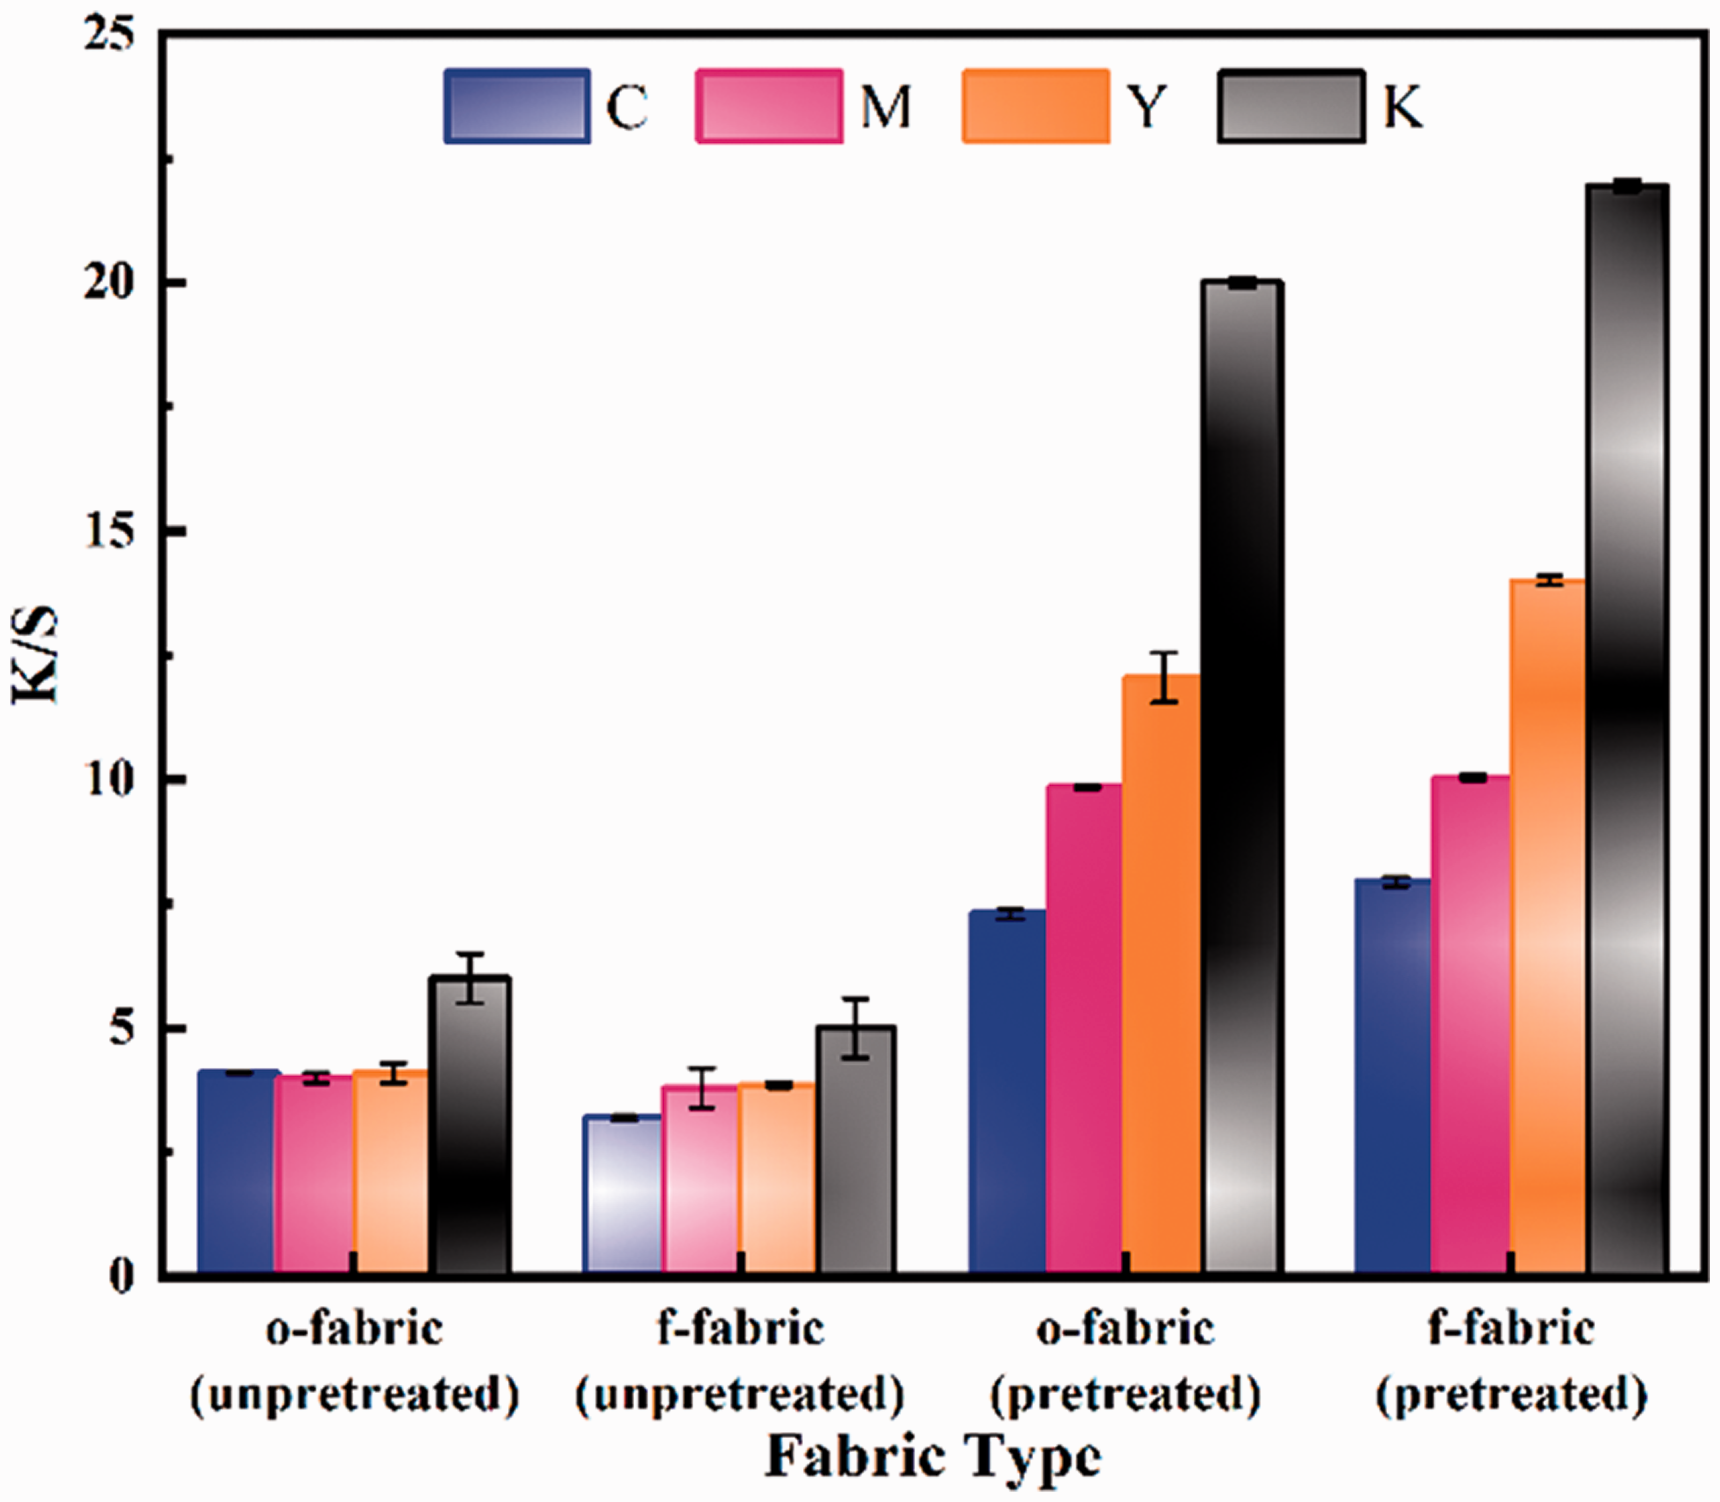
The K/S values of four-color blocks on samples with different treatments.
It can be seen from the table and figure that for both the o-fabric and f-fabric, after being pretreated, the L* value of the four-color blocks reduced while the K/S value increased, which indicates that the pretreated fabric had deeper color as well as better color appearance. Meanwhile, the L* value of the f-fabric was larger than that of the o-fabric, while the K/S value was smaller, corresponding to the lighter color on the o-fabric. Combined with Figure 15(a), this might be because the hydrophilic behavior of hydrophilic film and the preventative effect of the pretreatment film would make more ink penetrate along the thickness direction. This phenomenon led to the increased absorption and the decreasing scattering of light on fabric and then resulted in the decrease of the L* value and the increase of the K/S value. For black blocks, the C* value of the fabric was reduced after being pretreated, which means that the pretreated fabric showed a purer black than the unpretreated fabric. For the other three colors, the C* value of the f-fabric was larger than that of the o-fabric, and the C* value generally increased after pretreatment. Therefore, the color of the f-fabric presented better, and the pretreatment improved the color presenting for high saturation.
Considering all of the above analysis results, there is an important correlation between fabric characteristics and ink diffusion such that the color presenting of ink droplets on fabrics could be affected by fabric structure and treatment.
Color reproduction effect of the manuscript correction method
The color reproduction effect of the original color management could not provide a satisfactory result, so the study for improving the color reproduction effect started off with the use of the manuscript correction method. For the original color management, each of the single-channel ink volumes was set as 100%, and the IT8.7-3CMYK color checker was printed on sample 1# as Test Sample 1 (Figure 18), whose chromatic value was measured by a spectrophotometer with ICC profile A being generated by i1Profiler software. After that, Sample 1-1 was printed on sample 1# with the original color management by importing ICC profile A into the RIP software of the printing machine. The comparison of Sample 1-1 and the Pantone-TSC Standard Color Checker is shown in Figure 19. By the subjective evaluation of the human eye, a great deal of color information in the light tone of Sample 1-1 was missed, and the color performance in the dark tone was also quite different from that of the Standard Color Checker.
Test Sample 1.
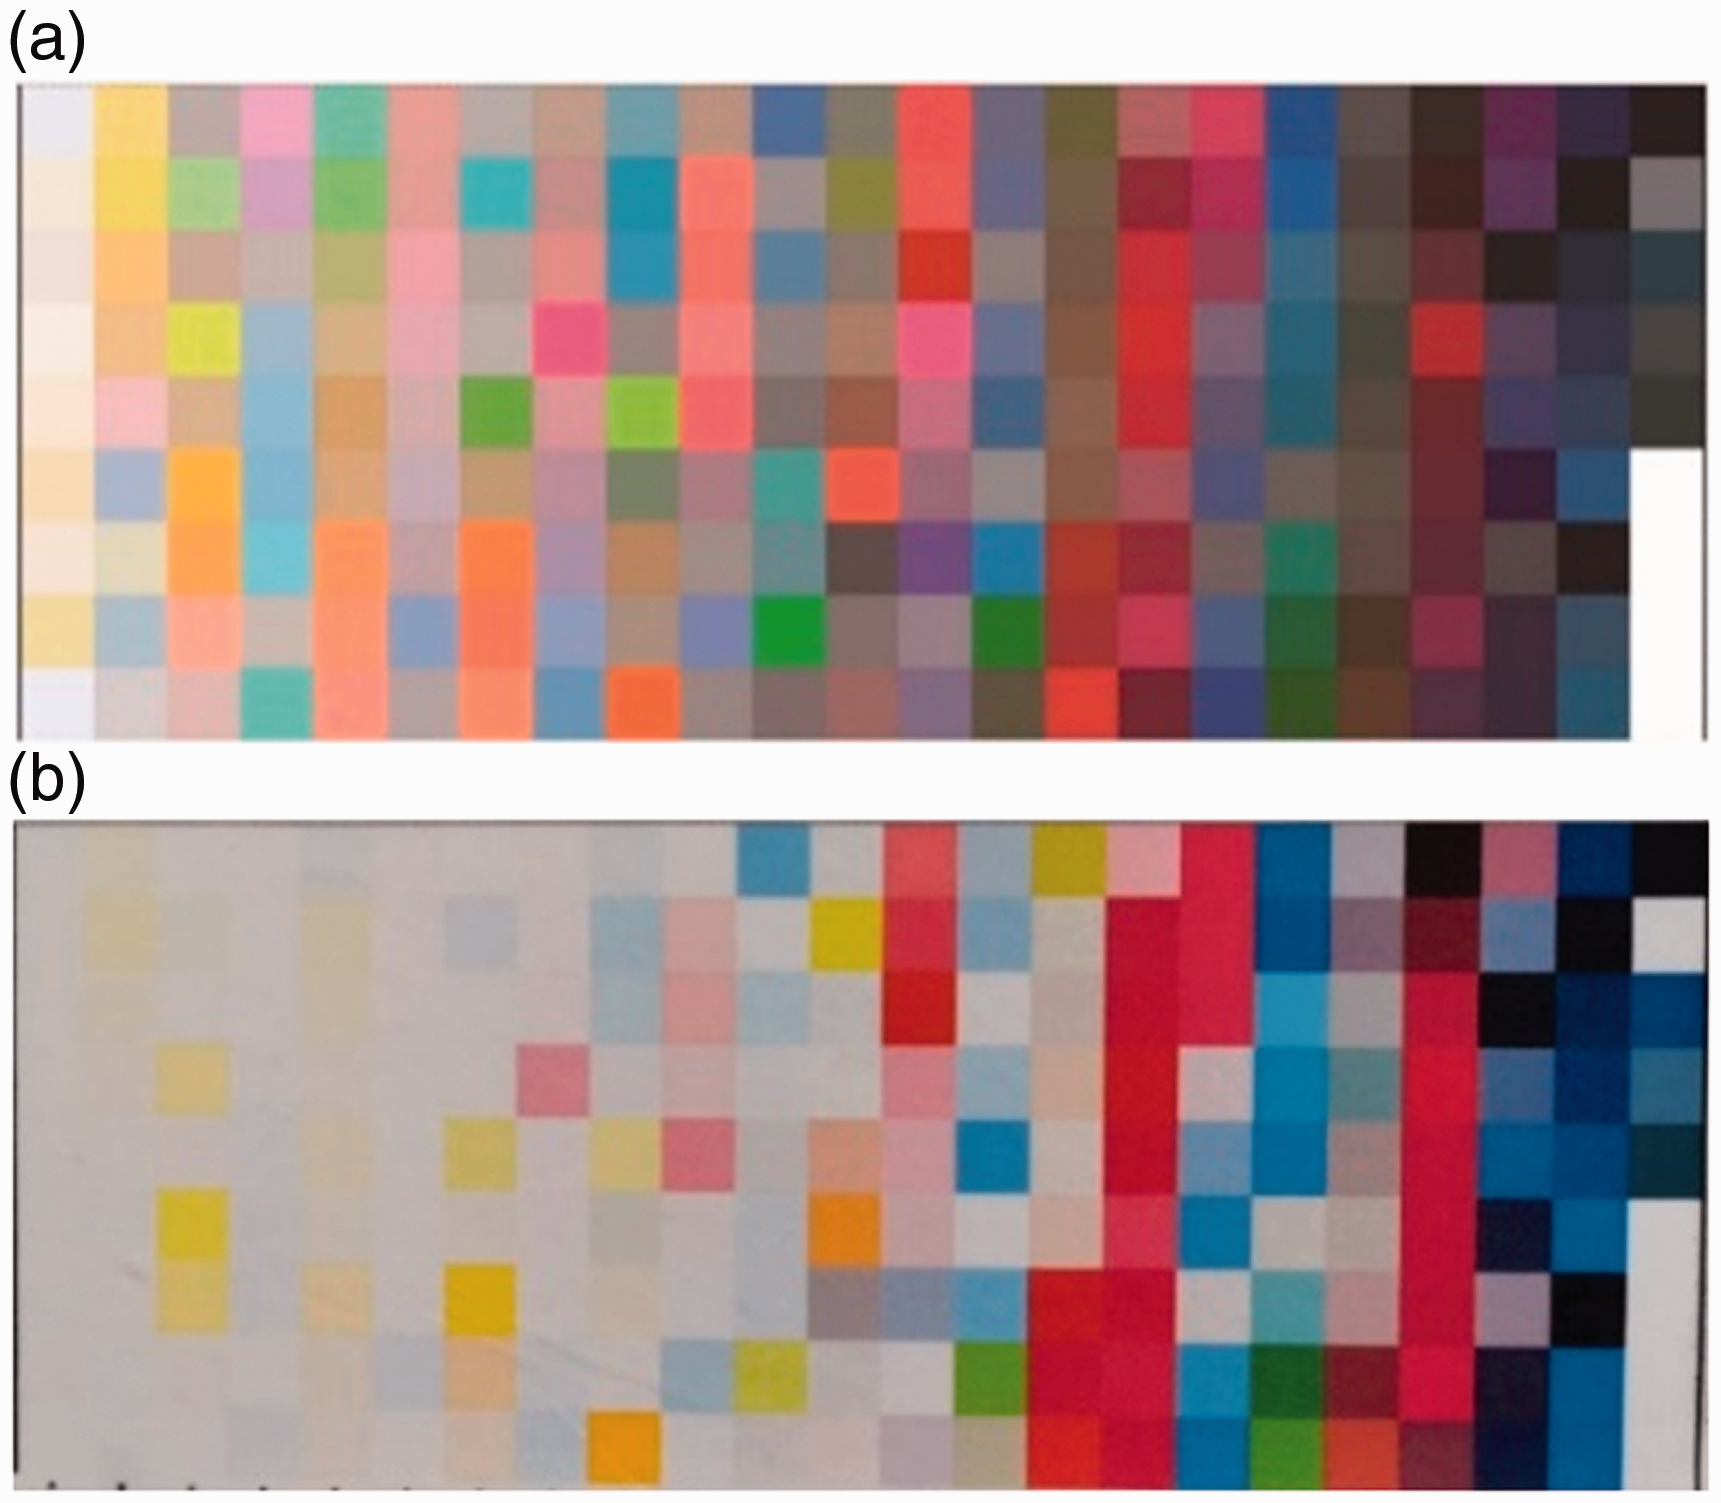
Comparison of the standard color sample and Sample 1-1. (a) Standard Color Card and (b) Sample1-1.
The chromatic value of Sample 1-1 was measured and compared with the Standard Color Checker, and the color difference of each color block was calculated. The 20 color blocks of the top 10% color difference in Sample 1-1 were selected and the corresponding 20 color blocks in the Standard Color Checker were listed as the original manuscript in Figure 20(a), whose chromatic value was then converted into a CMYK value. The revised manuscript of the 20 color blocks was obtained by modifying the CMYK-color proportion of the original manuscript according to the color difference between Sample 1-1 and the Standard Color Checker, shown in Table 5. Thus, the comparison between the original manuscript and the revised manuscript is shown in Figure 20(b).
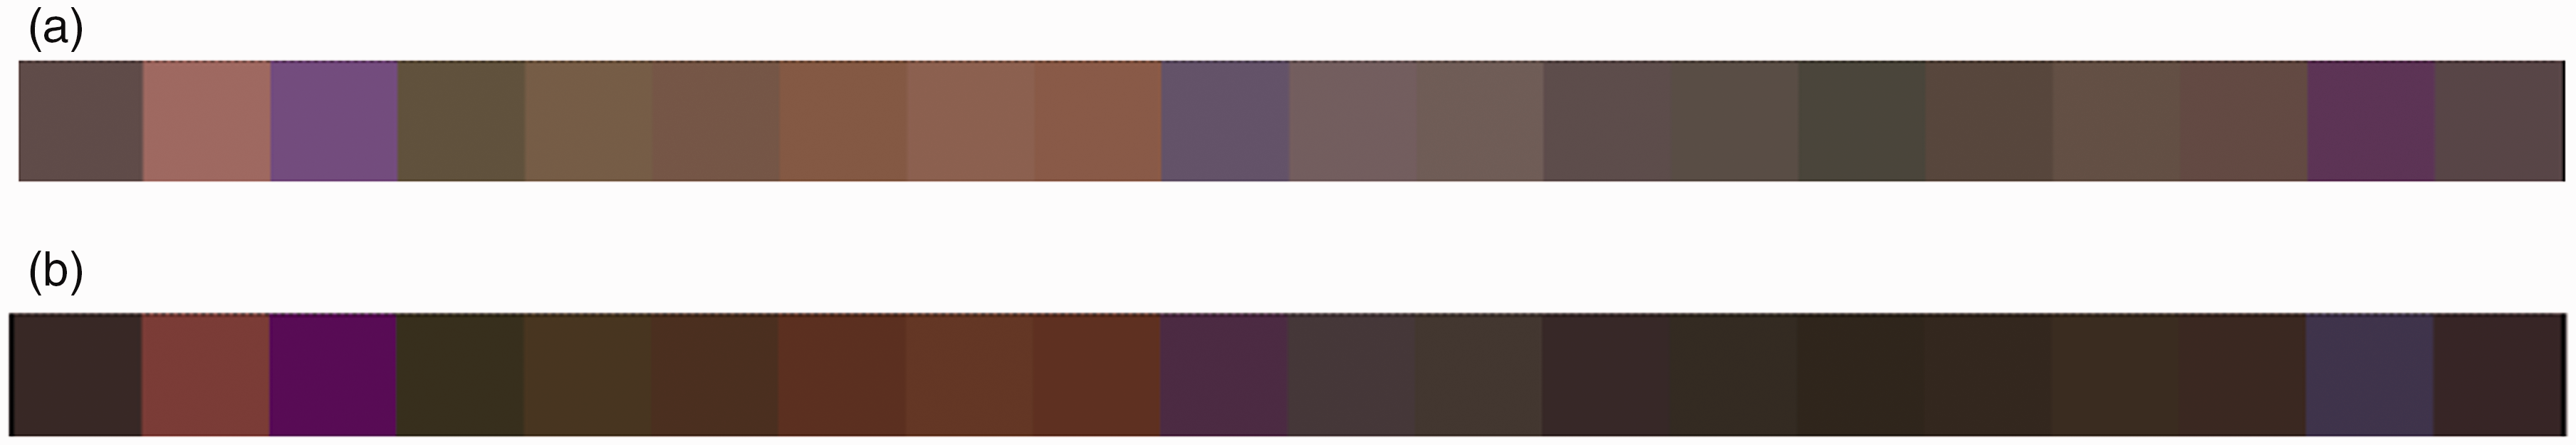
Comparison of the original manuscript and the revised manuscript: (a) original manuscript and (b) revised manuscript.
Chromatic value of the 20 color blocks of the top 10% color difference
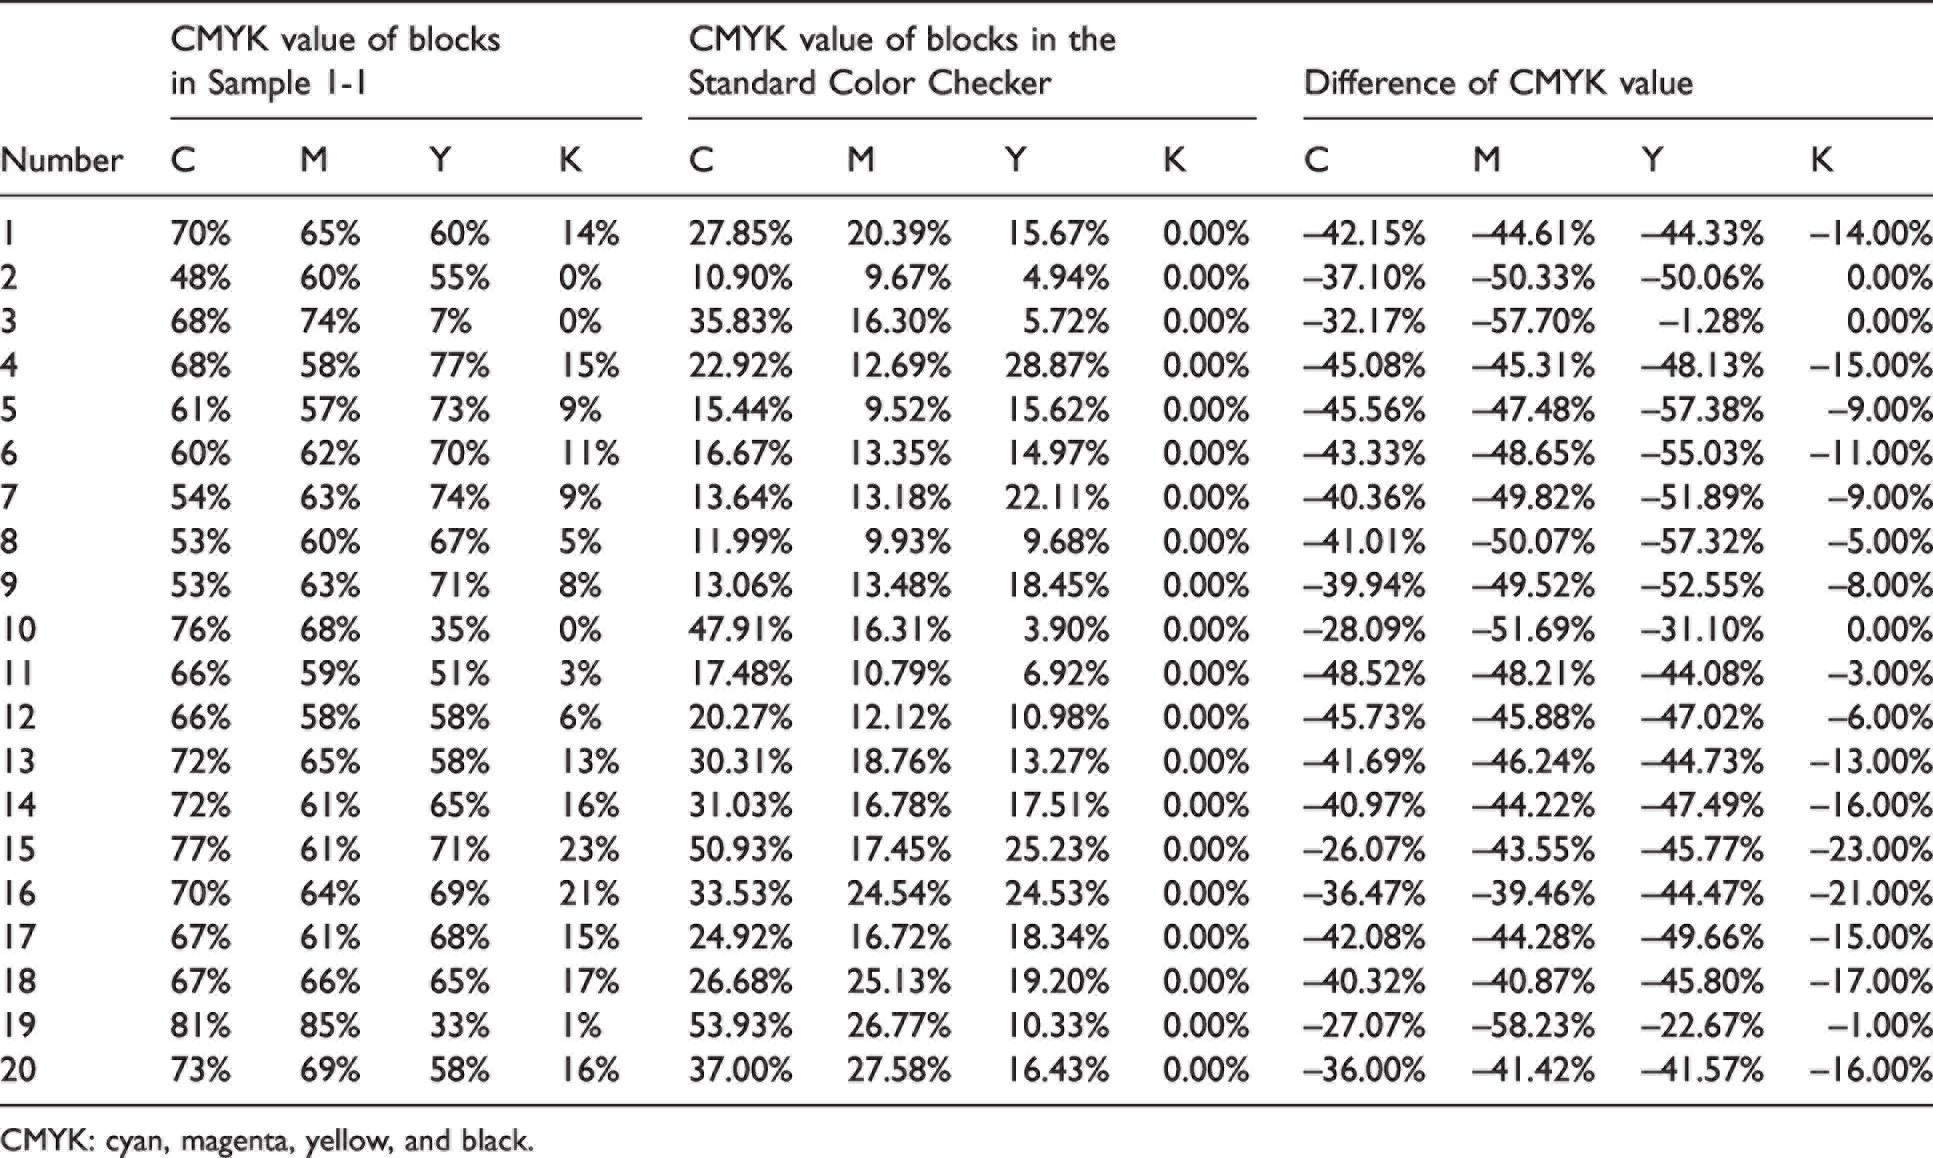
CMYK: cyan, magenta, yellow, and black.
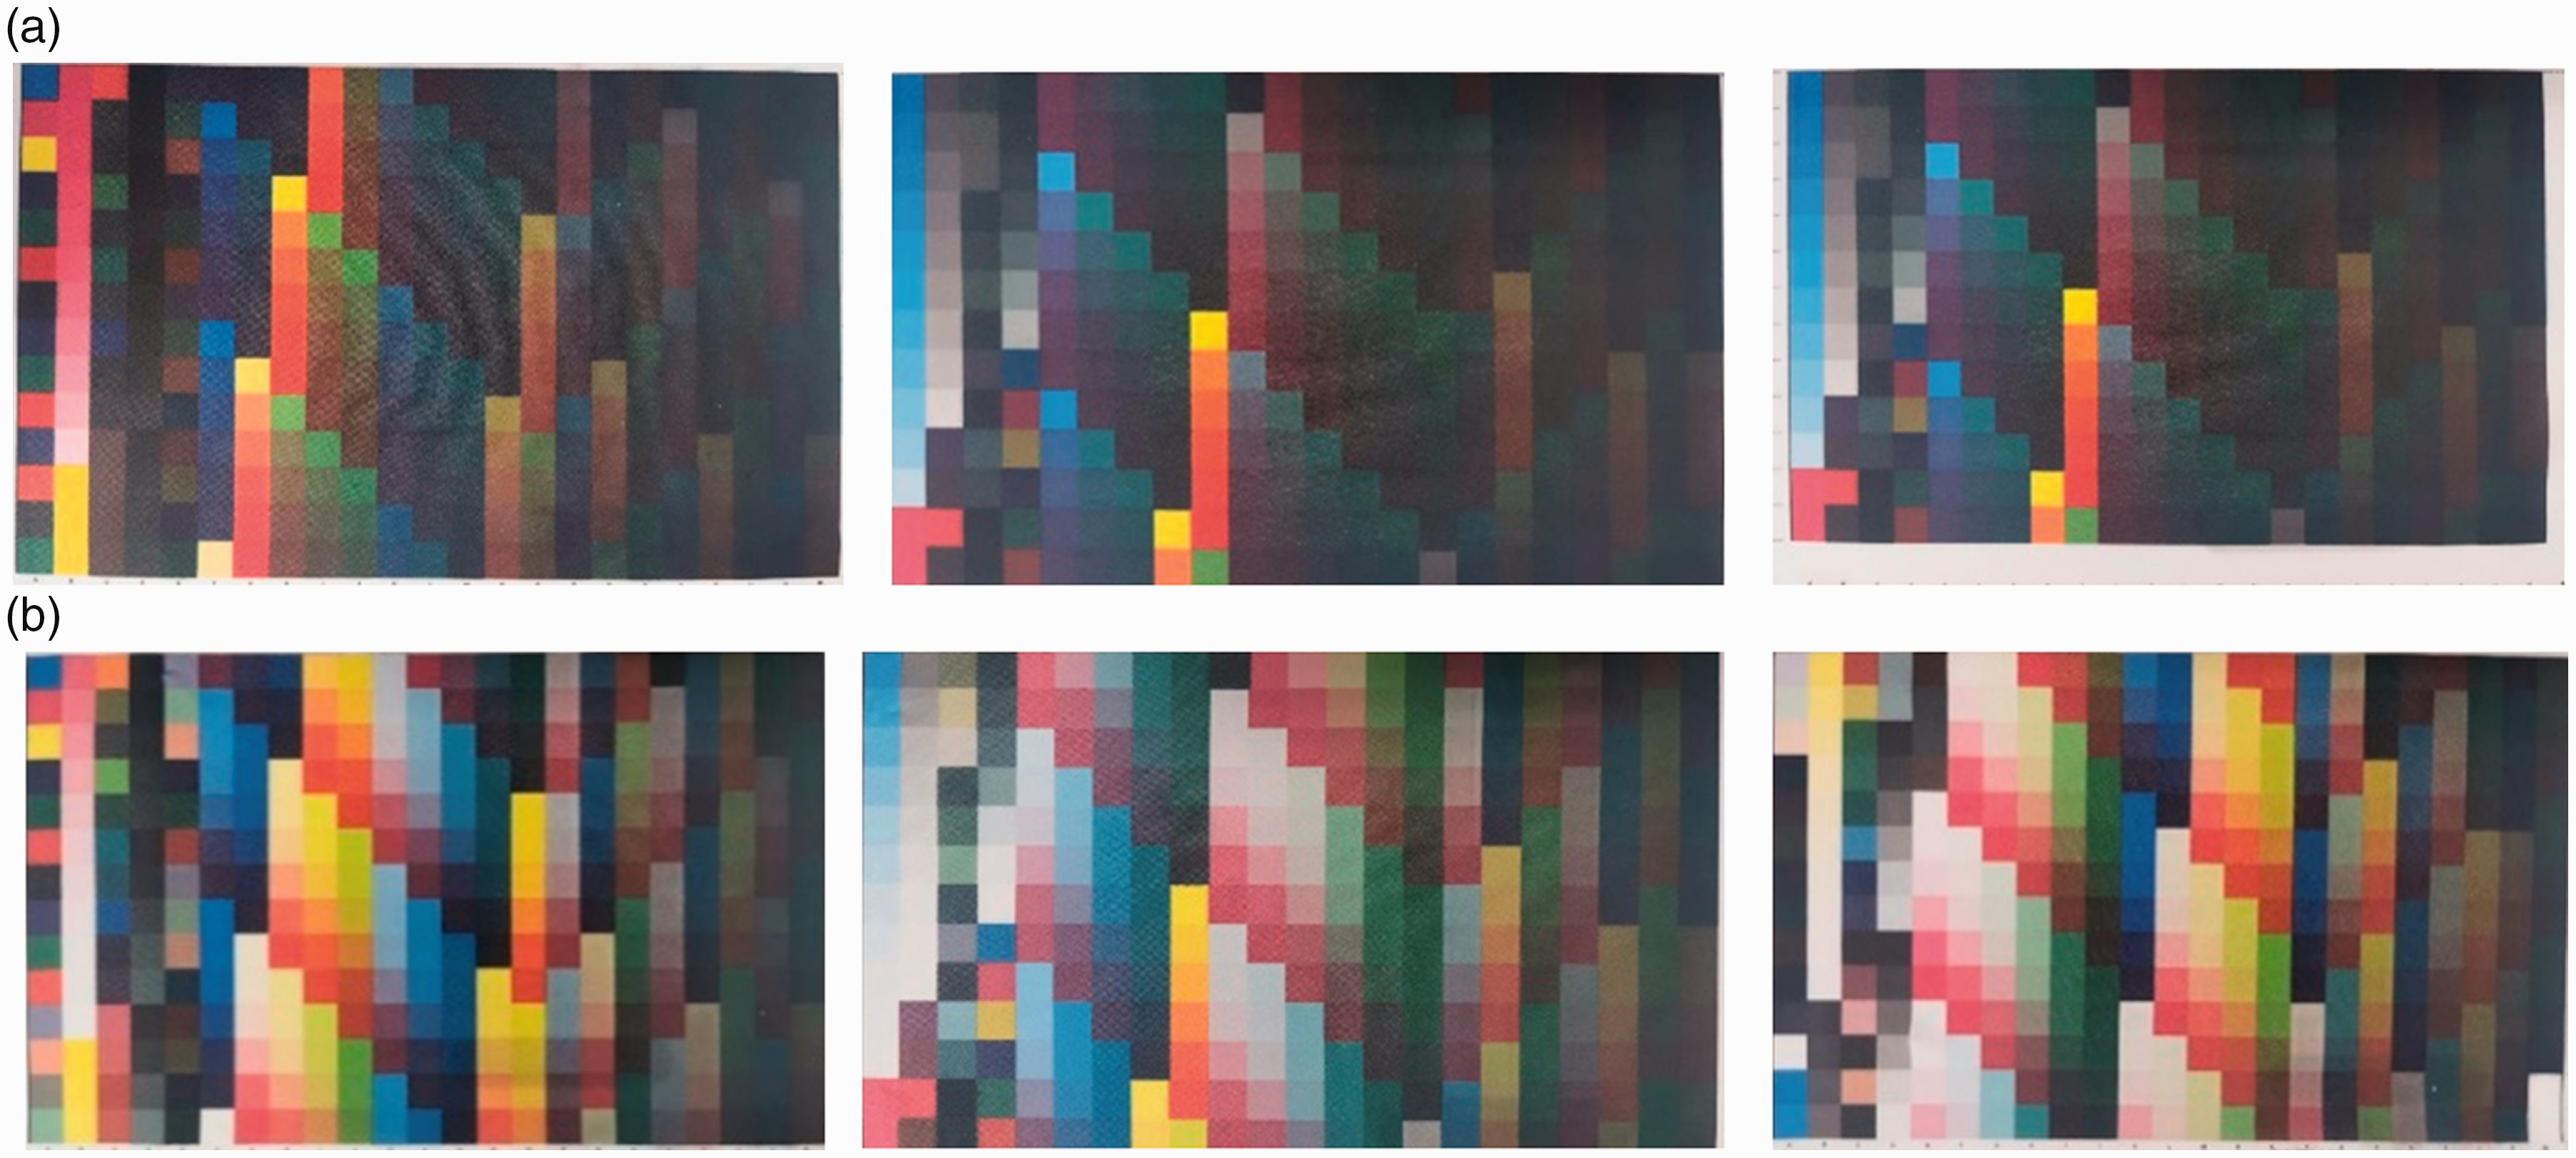
With the ink volume of each channel in the printing machine being set as 100%, ICC profile A was imported to print the revised manuscript on sample 1# as Sample 2-1. In addition, the original manuscript (the 20 color blocks in Sample 1-1) was printed on sample 1# by using the original color management, which was named Sample 2-2. Judging by the visual effect in Figure 21, Sample 2-2, whose appearance color was far away from the original manuscript, presented light color with high brightness, while Sample 2-1 showed an improved reproduction effect. The L*a*b* value of the samples was measured and compared with the L*a*b* value of the original manuscript to calculate the color difference. The overall average color difference of the 20 blocks in Sample 2-1 was 13.73, while the overall average color difference of the 20 blocks in Sample 2-2 was 33.96, which indicated that the manuscript correction method had worked for improving the color reproduction effect.
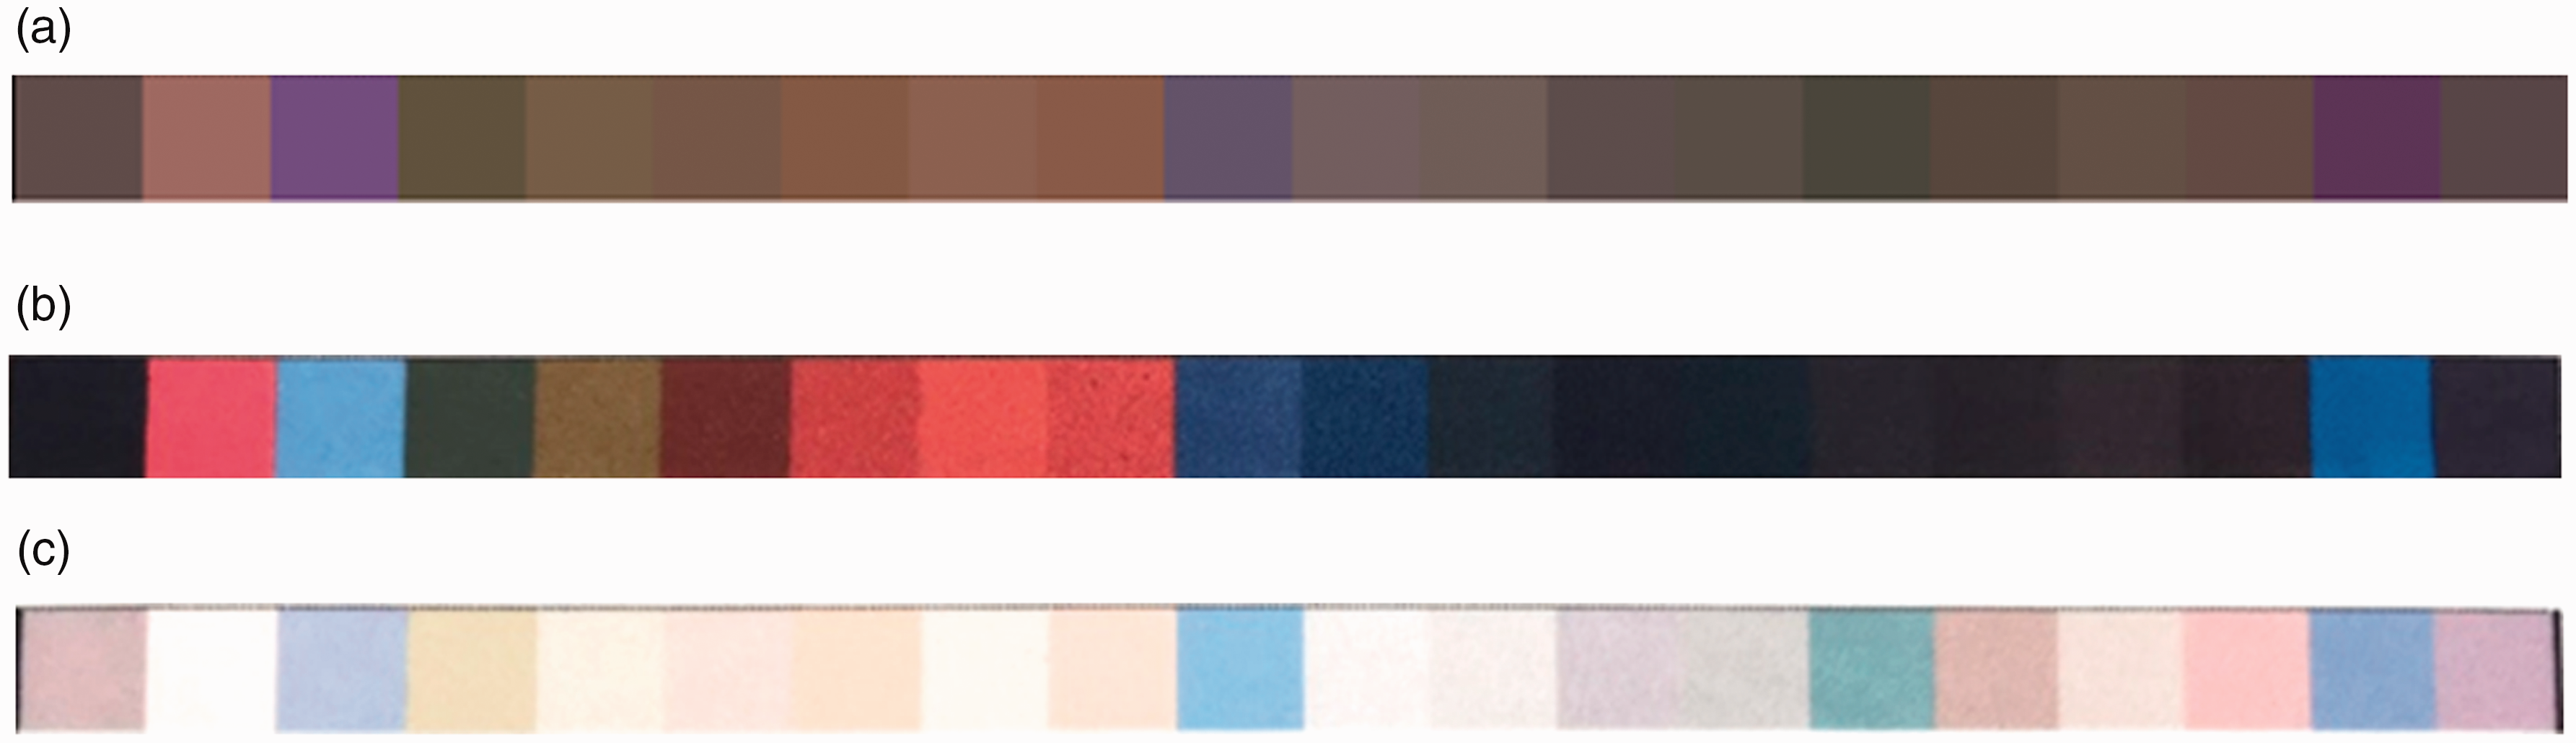
Comparison of the original manuscript and the revised manuscript: (a) original manuscript; (b) Sample 2-1: manuscript correction method and (c) Sample 2-2: original color management.
Color reproduction effect of the ink volume control method
The other method, named the ink volume control method, was proposed to improve the color reproduction effect and compared with the manuscript correction method. In order to determine the single-channel ink volume, a sample of the density gradient color card was printed on sample 1# with the original color management (Figure 22). The regression curves, as shown in Figure 23, were made according to the relation between the dot area coverage and the color density of each color block. At the initial stage, with the increase of the dot area coverage of the color blocks, the color density value increased as well. However, when the dot area coverage of the color blocks increased to a certain extent, the color density value gradually tended to be saturated and tended to return. Therefore, corresponding to the regression point, the maximum single-channel ink volume was exhibited as 70% of cyan, 70% of magenta, 80% of yellow, and 95% of black.
Gradient color card printing sample.

The relation curves between chromaticity and color density. (a) Cyan; (b) Magenta; (c) Yellow and (d) Black.
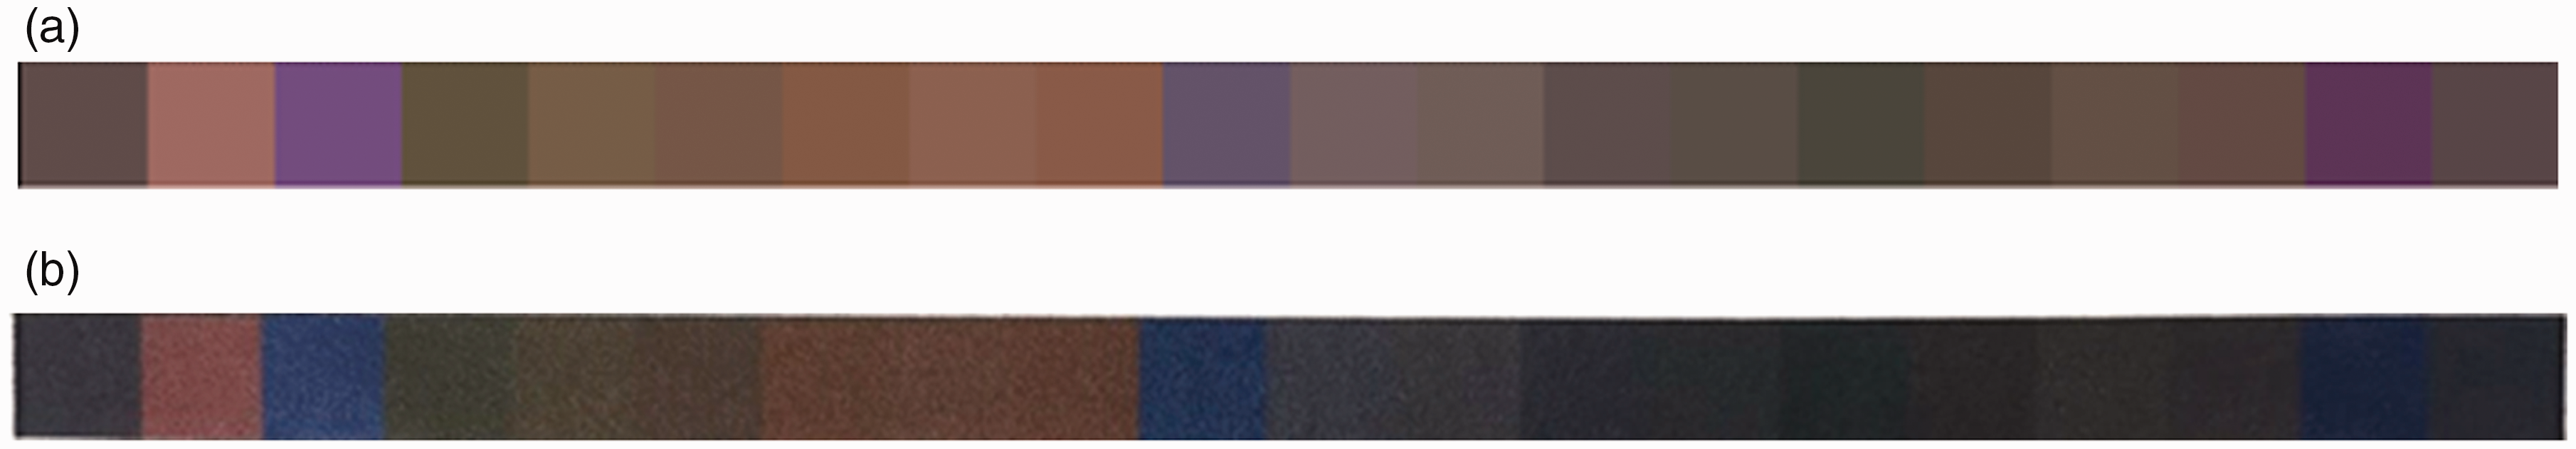
Each of the single-channel ink volumes was set as the calculated maximum ink volume, then the IT8.7-3CMYK color checker was printed on the sample 1# as Test Sample 2 (Figure 24), whose chromatic value was measured with ICC profile B being generated. From the visual effect, compared with Test Sample 1, which was printed by using the original color management, Test Sample 2 was lighter than Test Sample 1, and the appearance color in the dark tone of Test Sample 1 was more blurred with an unclear boundary.
Comparison of test samples. (a) Test Sample 1 and (b) Test Sample 2.
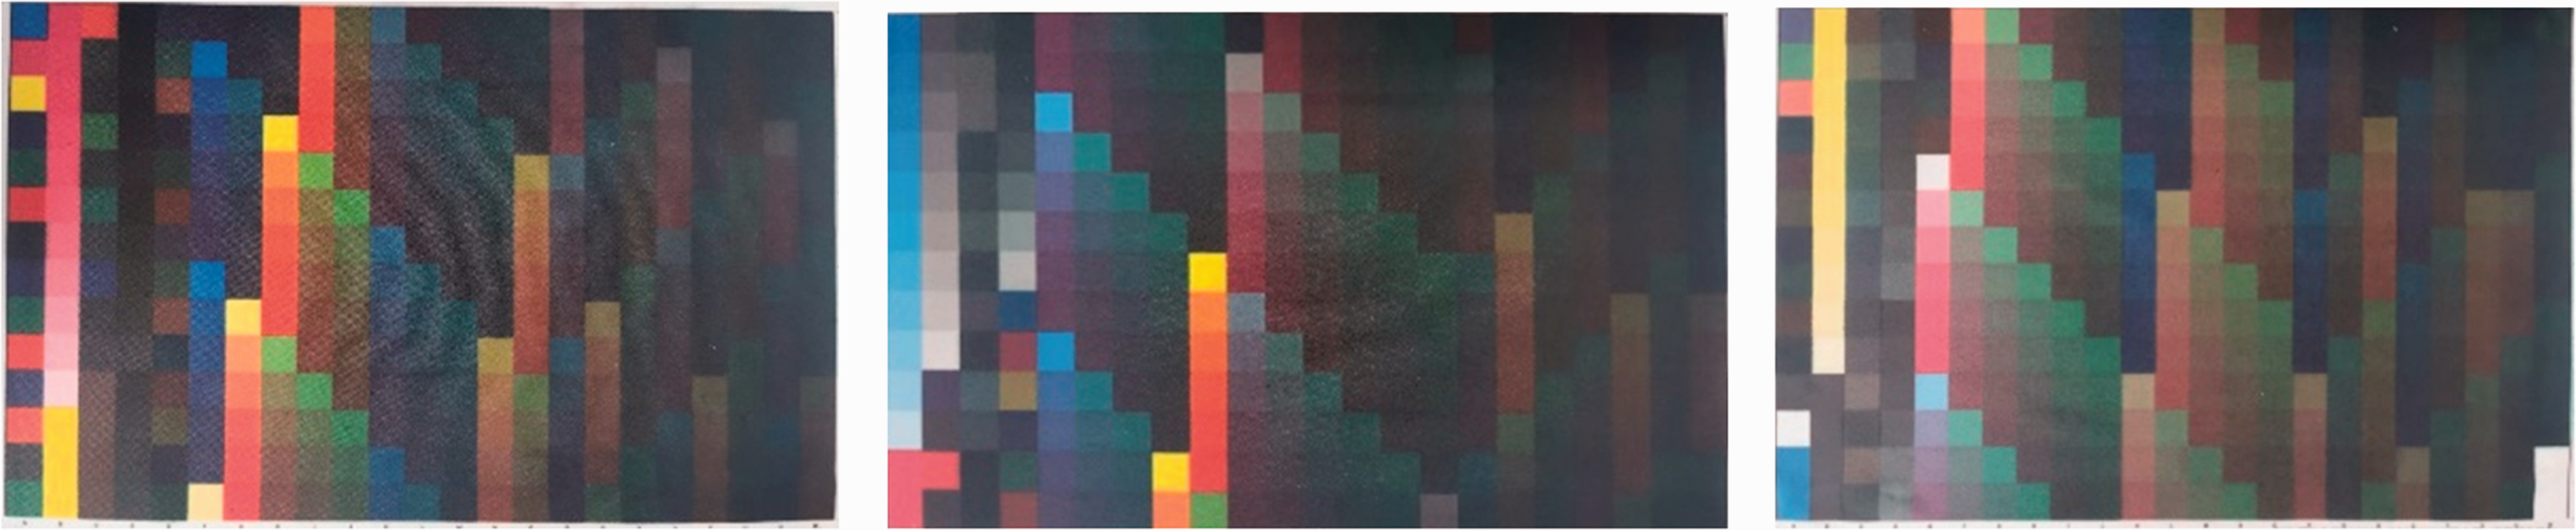
After that, Sample 1-2 was printed on sample 1# with the ink volume control method by importing ICC profile B. A comparison of the two samples and the Pantone-TSC Standard Color Checker is shown in Figure 25. By comparison with Sample 1-1, which used the original color management, the appearance color of Sample 1-2 was closer to the Standard Color Checker.
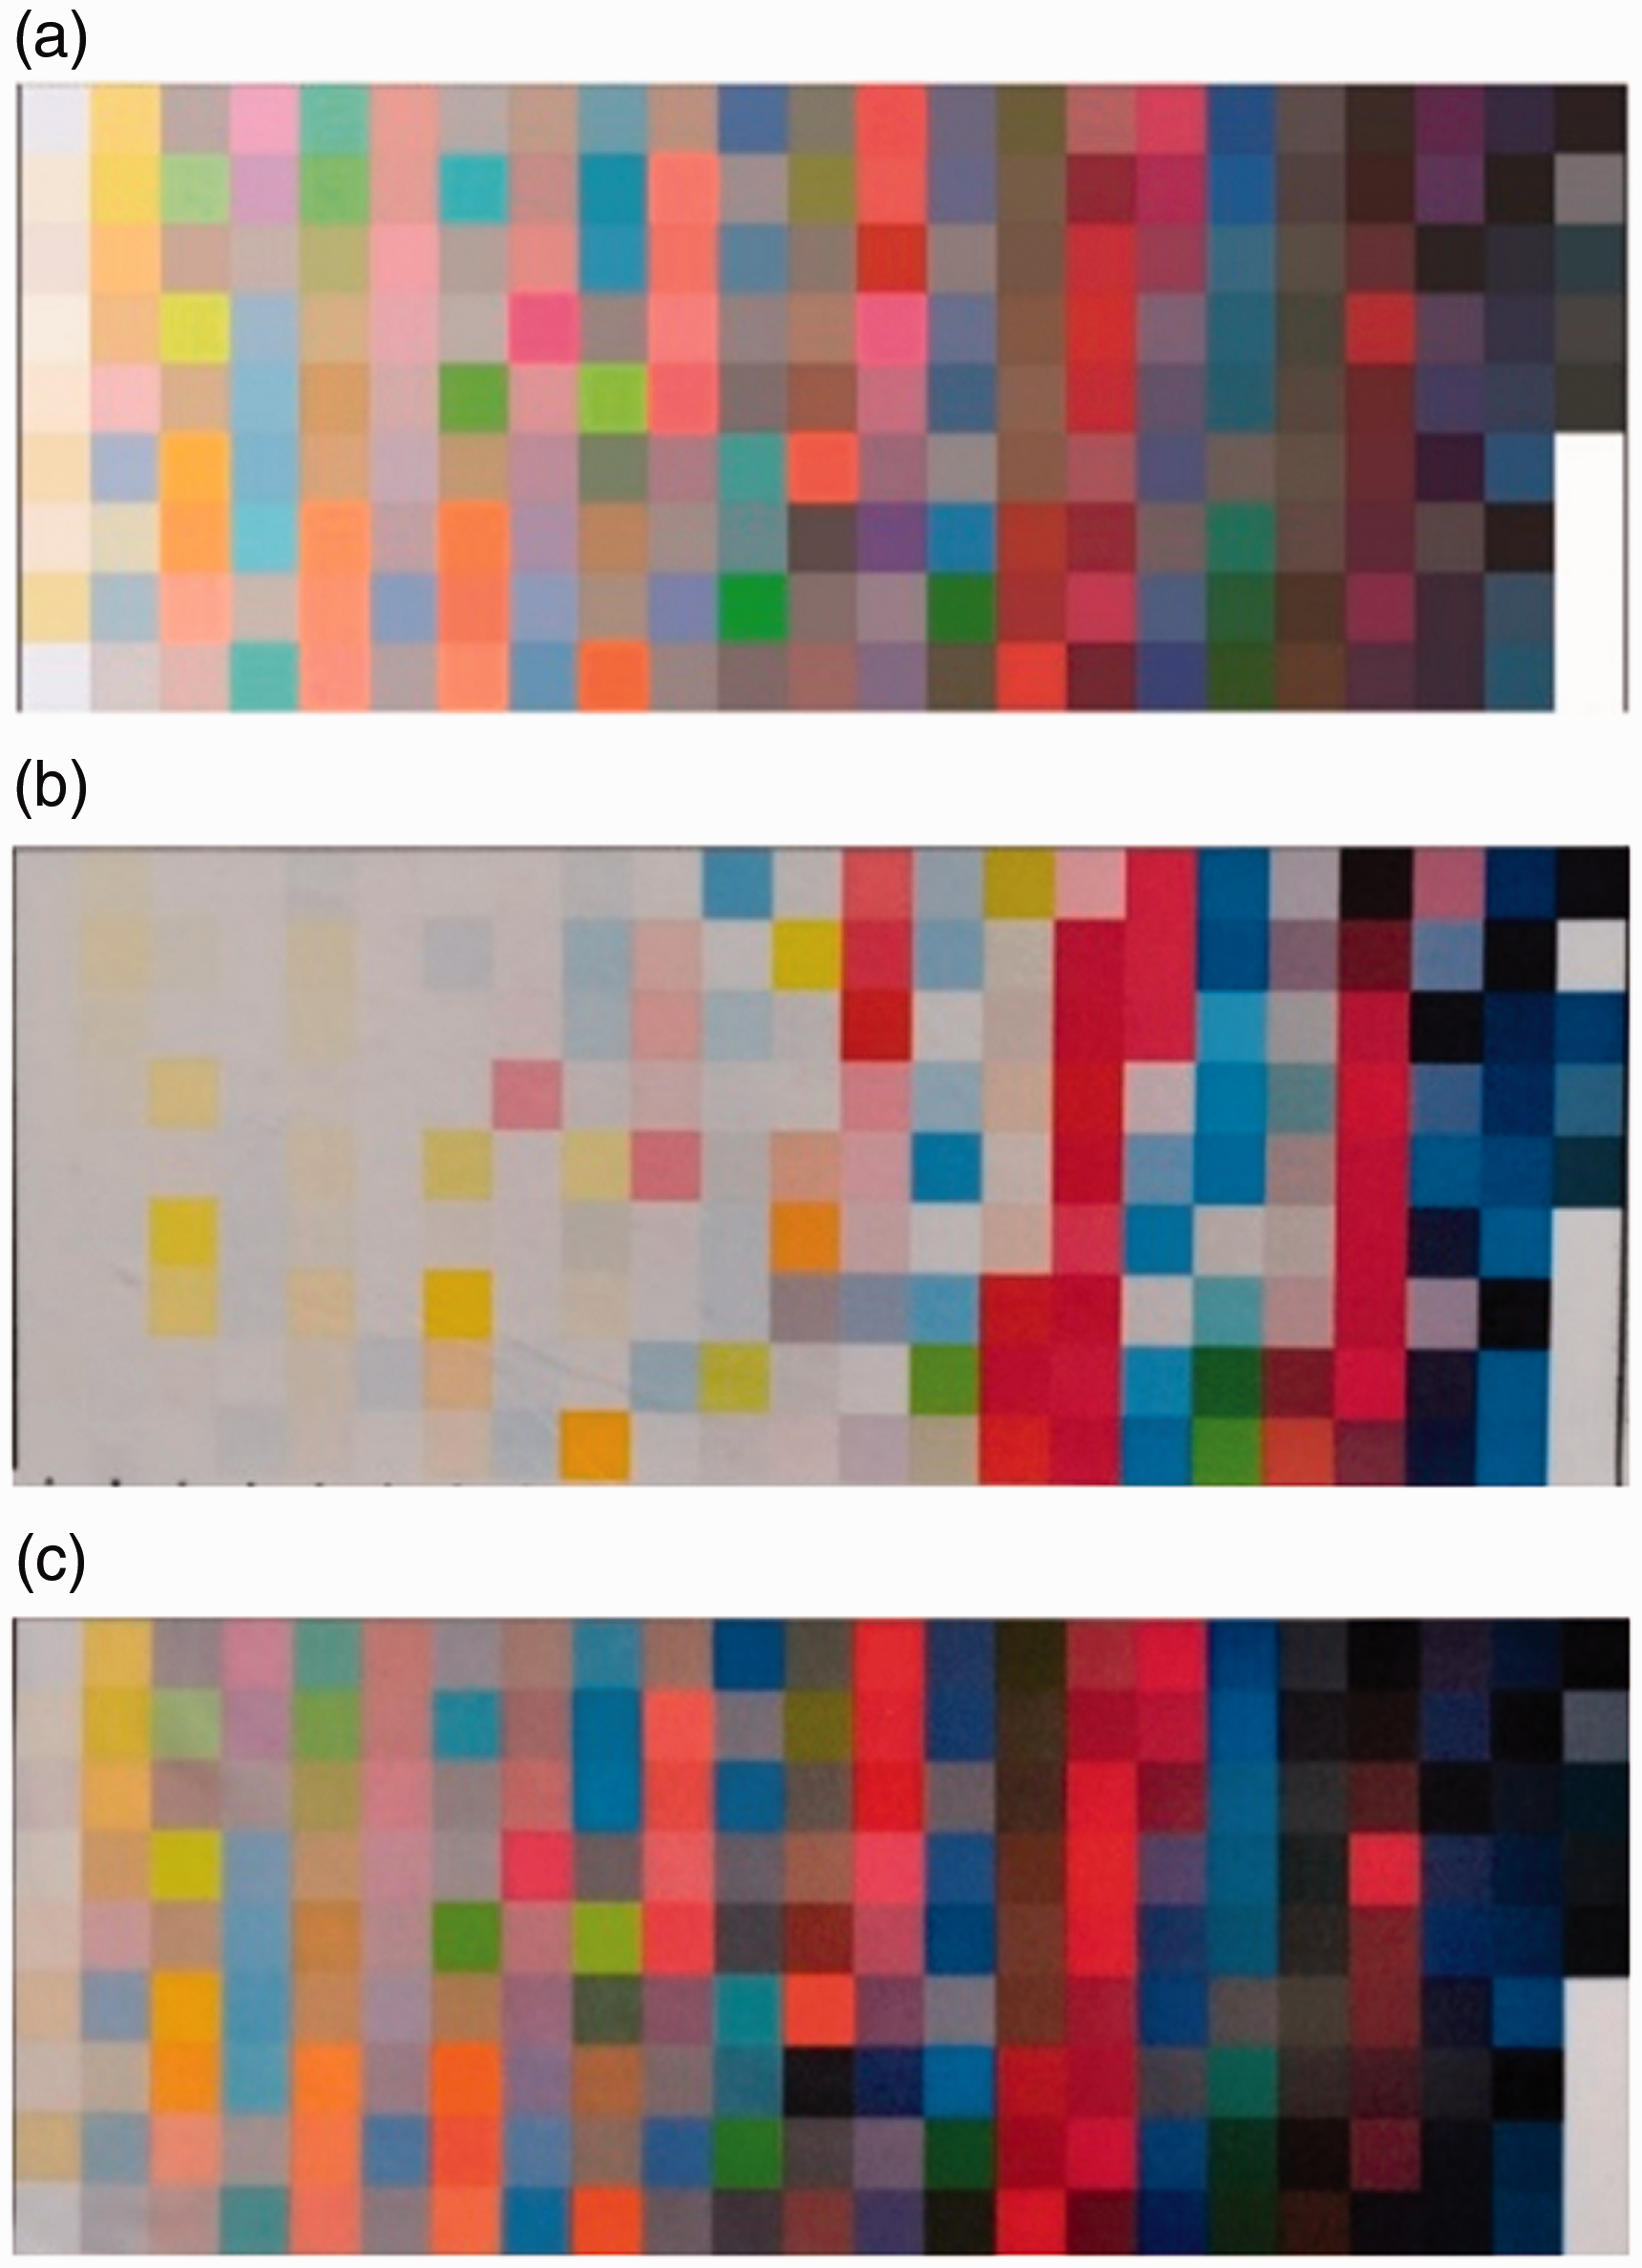
Comparison of the standard color sample and the printing samples. (a) Standard Color Checker; (b) Sample 1-1 and (c) Sample 1-2.
The chromatic value of Sample 1-2 was measured and compared with the Standard Color Checker to calculate the color difference. The average color difference of all color blocks, the average color difference of the 20 color blocks with the top 10% color difference, the average color difference of the rest color blocks, and the standard deviation of the above-mentioned color differences of Samples 1-1 and 1-2 are summarized into Table 6.
Color difference on sample 1# with the original color management and the ink volume control method

As seen in the table, the total average and the standard deviation of color difference in Sample 1-2 were both smaller than those of Sample 1-1, which was a good demonstration of the fact that the ink volume control method performed a greater color reproduction effect than the original color management, and the color presenting of Sample 1-2 was greatly improved.
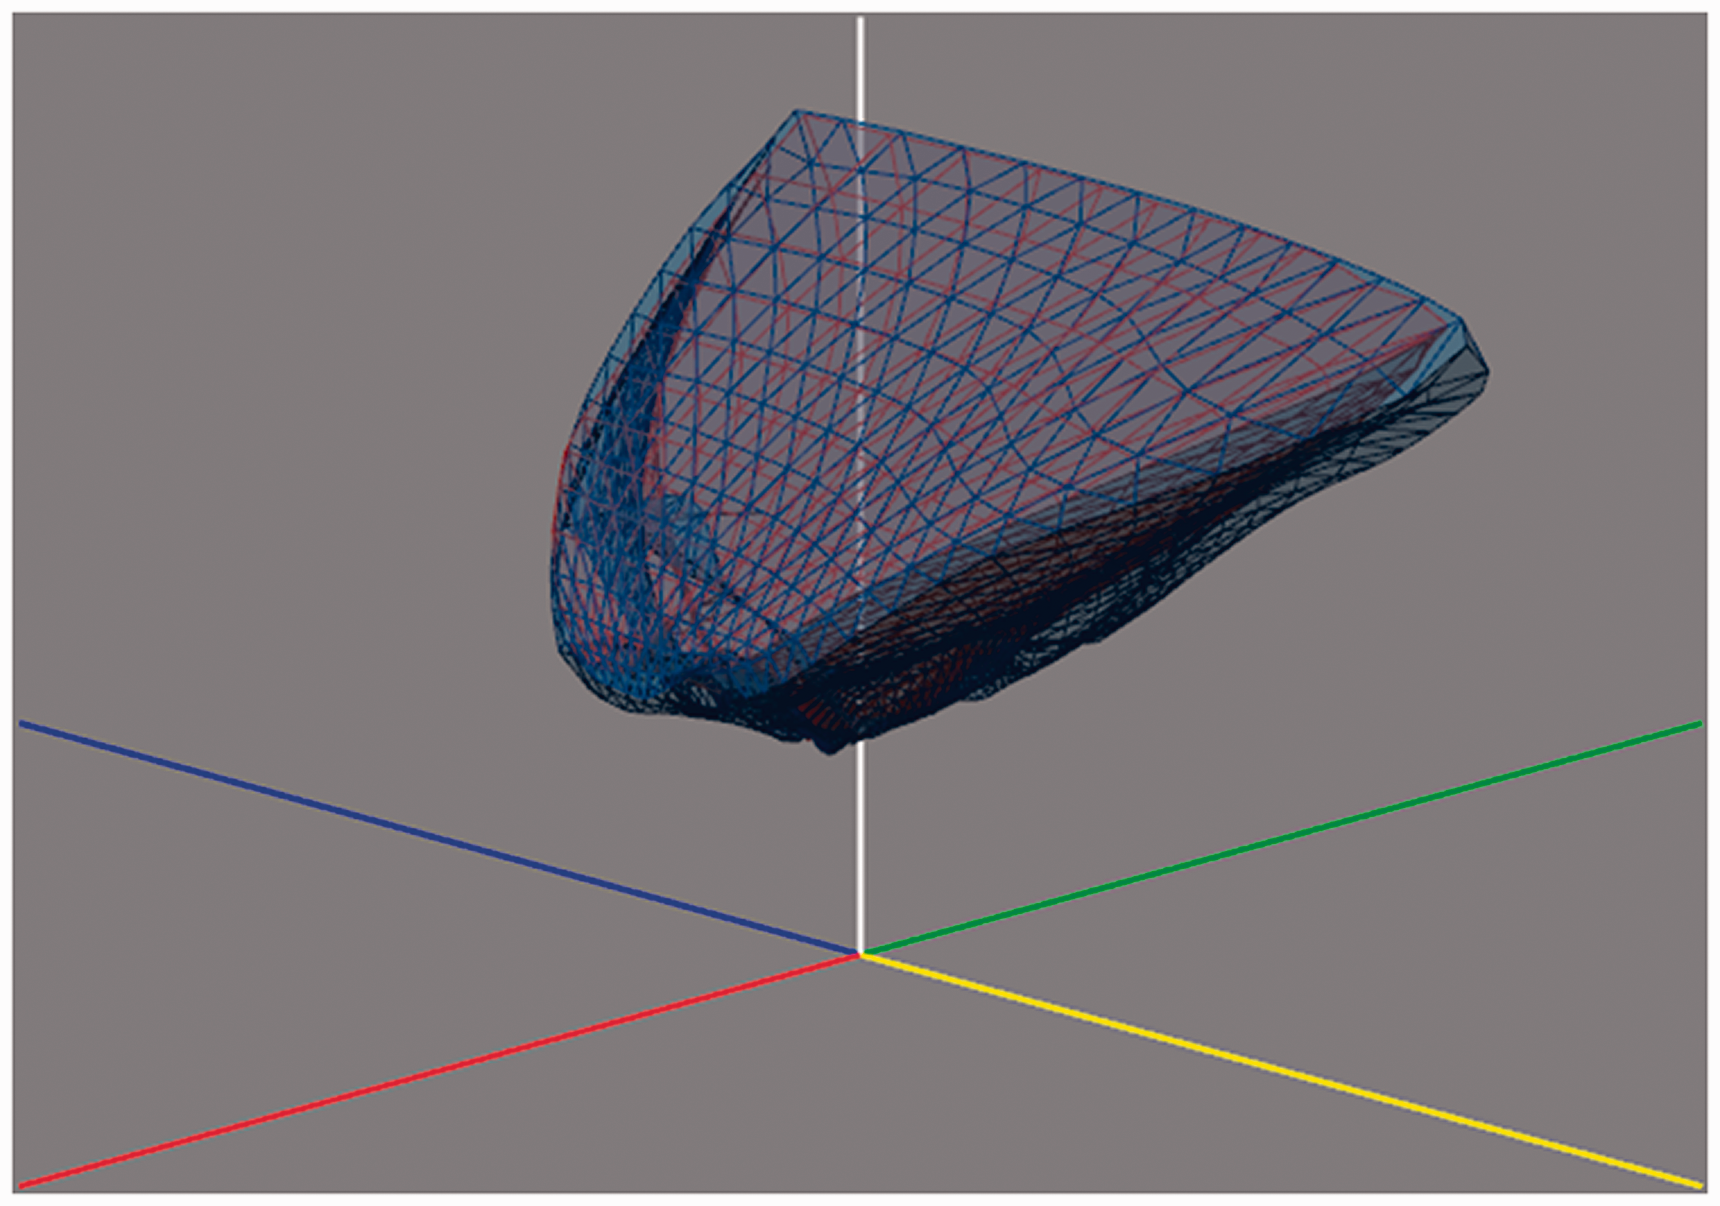
Figure 26 shows a three-dimensional color gamut comparison between the original color management and the ink volume control method, where blue represents the ICC color gamut generated by the ink volume control method and orange represents the ICC color gamut generated by the original color management. It can be seen from the figure that the ICC color gamut generated by the ink volume control method was slightly larger than that of the original color management, which indicated that the optimized method could perform color management on a wider color gamut and the color reproduction effect of the ink volume control method was more precise.

ICC color gamut comparison between two color management methods on the o-fabric. (Color online only.)
In order to compare the color reproduction of the three methods, the original manuscript in Figure 21 was printed on sample 1# by using the ink volume control method and is shown as Sample 2-3 in Figure 27. Compared with Samples 2-1 and 2-2 in Figure 21, Sample 2-3 showed the closest color appearance to the original manuscript. Therefore, the ink volume control method played the most effective color reproduction role, in which the color fidelity was the best among the three methods.
Comparison of the manuscripts: (a) original manuscript and (b) Sample 2-3: ink volume control method.
Compared with the L*a*b* value of the Standard Color Checker, the color difference of Samples 2-1, 2-2, and 2-3 corresponds to the three methods, as shown in Table 7. In conclusion, the order of the color difference of samples under the three methods was the ink volume control method < manuscript correction method < original color management, which indicated that the ink volume control method and the manuscript correction method both achieved an improved color reproduction effect and the ink volume control method was the most effective. The reason for this result may be that the manuscript correction method had subjective influence factors of human assessment in modifying the manuscript, while the ink volume control method was relatively more objective so achieved a more accurate color reproduction effect.
Color difference of the color management methods

Color reproduction effect of the ink volume control method on the f-fabric
The above study of color management on sample 1# showed that the color reproduction effect of the ink volume control method was the best of the three methods on the o-fabric, then the sample 7# fabric was chosen to further verify the effect of the ink volume control method on the f-fabric. The evaluation of the result was not only used to prove the effect of the ink volume control method but also it was combined with the result of the o-fabric to distinguish the different effects, with the correlation between fabric porosity and ink diffusion explaining the difference.
The maximum single-channel ink volume on the f-fabric was respectively 70% of cyan, 70% of magenta, 80% of yellow, and 95% of black. In a similar way of printing Sample 1-1, Sample 1-3 was printed on sample 7# with the original color management. In a similar way of printing Sample 1-2, Sample 1-4 was printed on sample 7# with the ink volume control method. The color difference between the samples and the Standard Color Checker is summarized in Table 8.
Color difference on sample 7# with the original color management and the ink volume control method

The data of the f-fabric showed the same result as that of the o-fabric in that the color difference reduced after applying the ink volume control method, suggesting that the ink volume control method was also able to produce a good reproduction effect and improve the color appearance on the f-fabric.
However, by comparison with Table 6, the ink volume control method could not perform a color reproduction effect on the f-fabric as great as that of the o-fabric. The reason probably was that ink droplets diffused more easily on the surface of the f-fabric because of the hydrophilic film, while the ink volume control method only prevented diffusion to some degree but could not solve the problem of the color appearance on the surface of the fabric being lightened.
A three-dimensional color gamut comparison between the original color management and the ink volume control method on the f-fabric is shown in Figure 28. The ICC color gamut generated by the ink volume control method was larger than that of the original color management, the same as the result of the o-fabric, indicating that the color reproduction effect of color management has been improved after using the ink volume control method.
ICC color gamut comparison between two color management methods on the f-fabric.
Conclusion
This research aims to study the color presenting mechanism of polyester knitted fabric from the perspective of the diffusion law of ink droplets on fabric and reduce the color difference between the original manuscript and the printed samples by using optimized methods for color management. The results showed that the color presenting of fabric digital inkjet printing could be related to the diffusion law, which may be influenced by fabric structure and treatment. For color reproduction, two optimized methods for color management were proposed. Compared with the original color management, the two methods both showed an improved reproduction effect, and the color difference of samples under the three methods could be ordered as the ink volume control method < manuscript correction method < original color management, which indicated that the ink volume control method had the best color reproduction effect. Furthermore, the improved color reproduction effect of the ink volume control method could work well on both the o-fabric and the f-fabric, and the difference of effect was explained with the diffusion law in that the hydrophilic film caused by the finishing treatment made the ink diffuse more easily on the surface of the f-fabric than on the o-fabric. The proposed optimized color reproduction method is proved to be promising for transferring more accurate chromatic value in digital inkjet printing. However, there are only two factors being considered in the study; further work is still required to be taken into account to elucidate the decisive role of other factors in color presenting, combining with color management methods, to build a wider range of color gamut.
Footnotes
Declaration of conflicting interests
The author(s) declared no potential conflicts of interest with respect to the research, authorship, and/or publication of this article.
Funding
The author(s) disclosed the receipt of the following financial support for the research, authorship, and/or publication of this article: This work was supported by the International Cooperation Fund of Science and Technology Commission of Shanghai Municipality (Grant NO. 21130750100) and the Fundamental Research Funds for the Central Universities (CUSF-DH-D-2018038).