
Abstract
Using the binary coupled mixing algorithm as the foundation, the full color phase mixing mode of six primary colored fibers is proposed, a full color phase mixing model containing 60 grid points is established, and the corresponding color mixing chromatography is provided. Inside the construction of the full color phase mixing model, 30 grid points are chosen in a gradient of 20%, and 30 colored yarns of six color systems are spun according to the mixing ratios of the binary primary colored fibers corresponding to the grid points. Taking 30 colored yarns as samples, the approach of determining the reflectance conversion coefficient (M value) with the spectral wavelength and the mixing ratios of binary primary colored fibers as independent variables is derived by the Stearns–Noechel algorithm; a method for predicting the colors of fabrics by the mixing ratios of fibers and predicting the mixing ratios of fibers by the colors of fabrics is proposed. It is demonstrated that the reflectance conversion coefficient in the Stearns–Noechel color prediction equation is related to both the spectral wavelength and the mixing ratios of the primary colored fibers; the colors of the forming yarns can be forecasted using the mixing ratios of the primary colored fibers in the full color phase mixing model, and the mixing ratios of the primary colored fibers in the model can also be predicted by the colors of the yarns.
Keywords
Different colored fibers, such as dyed fibers, dope-dyed fibers, natural colored fibers, and structural colored fibers, are blended to prepare colored spun yarns and their products; this is considered to be a short, energy saving, emission reduction, and high-quality process for the manufacturing of textiles, with significant development potential.1–3 The production of colored yarns is the procedure of turning different colored fibers into slender and twisted fiber assemblies by the spinning process. The colors of colored yarns are formed by a spatial juxtaposition mixing of different primary colored fibers in the yarn.4,5 In order to form a favorable mixing effect, the fibers of adjacent colors with a hue difference of about 60° or a saturation and lightness difference of about ±0.3 can be used as the fibers for spinning, and a higher color fusion effect can be acquired.
As the crucial technique of manufacturing colored yarn, it is essential to establish a practical color mixing theory to guarantee the fabrication of products and to implement the control and reproduction of color. Usually, color mixing is mainly divided into three categories: additive color mixing, subtractive color mixing, and spatial juxtaposition color mixing. Additive color mixing includes the superposition of red (R), green (G), blue (B) light in the display, while subtractive color mixing includes the color matching of cyan (C), magenta (M), yellow (Y) dyes in the printing and dyeing industry; these two types of color mixing have relatively more color matching models and application foundations. 6 However, there are also some colored products in the color industry that belong to spatial juxtaposition mixing, which are neither fully compatible with the principle of additive mixing nor subtractive mixing, bringing great difficulties to the reproduction of color mixing, typically such as colored yarns for factories and the colored yarns fabricated by a three-channel computer numerical control (CNC) ring spinning frame in this research.7–9
The major color mixing theories for textiles are the Kubelka–Munk theory, Friele model, Stearns–Noechel formula, and neural networks.10–13 Among them, the Kubelka–Munk theory has been widely used for the prediction of dye compositions or paint formulations, but rarely for the forecast of mixed colors of colored fibers. 14 The Friele model and the Stearns–Noechel model have been well studied in the application of color mixing of colored fibers. Although the Friele model is a theoretical model derived from Beer's law for color matching of colored fibers, its formulation prediction accuracy is too low. 15 The Stearns–Noechel formula is an empirical formula, and although its modified formulas have favorable prediction accuracy, they are all used for forecasting the specific fibers and are not universally applicable. 16 Neural networks are widely used for their powerful nonlinear mapping ability. Whether using the neural networks alone or combining traditional models of neural networks, they can improve the prediction accuracy of the mixed color spectrum, but they require a large number of training samples, otherwise the generalization ability is relatively inferior; there also exists a black box issue, which is not conducive to theoretical analysis.17–20
According to the intelligent algorithm and computer control techniques, the three-channel CNC ring spinning frame can achieve the regulation of the mixing ratios of the three primary colored fibers of the forming yarn by regulating the coupled drafting of the three drafting channels to the three rovings, and the control of the colors of the forming yarn by controlling the mixing ratios of the three primary colored fibers, which provides an equipment platform for the realization of the spinning of the yarn of the full color phase.21,22 In order to enhance the function of color matching and color prediction of CNC spinning, it is essential to construct a digital mixing model for six primary colored fibers, to design a full color phase mixing model for six primary colored fibers according to binary coupled mixing, and to establish a mechanism for regulating the mixed colors within the range of full color phases in accordance with the mixing ratios of six primary colored fibers; for enhancing the accuracy of predicting colors of yarns by the mixing ratios of colored fibers, the solution method for the reflectance conversion coefficients of grid points and arbitrary points in the Stearns–Noechel formula needs to be improved for the prediction of the color of yarn; to implement the capability of predicting the mixing ratios of colored fibers according to colors of yarns and to improve the color matching accuracy, an improved reflectance conversion coefficient approach together with the least squares method is used for forecasting the mixing ratios. 23
In this paper, using binary coupled mixing as the foundation and incorporating the three-channel CNC mixing spinning mechanism, we formulate the full color phase mixing mode of six primary colored fibers, build the full color phase mixing model, and provide the color matrix of full color phase mixing chromatography. On this premise, the Stearns–Noechel formula was used to carry out research on the prediction of colors of yarns in three-channel CNC spinning. To increase the color prediction accuracy of mixed yarns, the issue concerning the large difference of deviation distribution brought by the previous Stearns–Noechel correction formula using a single constant or wavelength function is addressed by adding dimensional correction of the mixing ratios of colored fibers and building the multidimensional reflectance conversion coefficients of the Stearns–Noechel formula with gridded full color phase data of six primary colored fibers. Meanwhile, the feasibility of forecasting the mixing ratios by least squares on the basis of the color of yarn and improved reflectance conversion coefficients is investigated. Overall, it is desirable to provide theoretical support for the development of a spinning technique with accurate color prediction algorithms and agile and fast processing methods.
Construction of the full color phase mixing model and its chromatography
Preparation of six primary colored fibers and their color values
Assuming that the colored fibers α, β, γ, δ, ε, ω are acquired by dyeing, the masses are
Discretization of six primary colored fibers
By discretizing the masses of the six primary colored fibers separately, the general formulas for the six groups of sequences can be attained as follows:

Construction of the full color phase mixing mode
The formula of pairwise coupled color mixing is obtained according to Equation (1) as follows:

Here, when
The resulting formula for the full color phase mixing model is derived as follows:
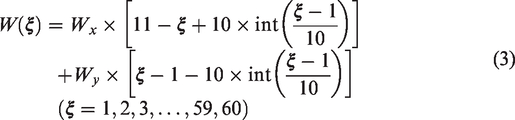
Here, when
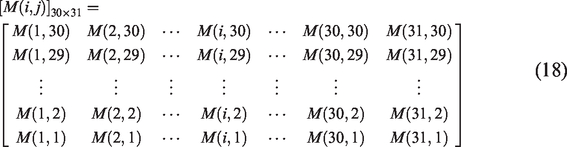
The resulting mass matrix of mixed samples of the full color phase is as follows:

Mixing ratios of mixed samples of the full color phase
From Equation (3), the mixing ratios formula can be determined as follows:
If

Colors of mixed samples of the full color phase
The following formula can be acquired from Equation (5)
The resulting chromatography matrix of mixed samples of the full color phase is displayed below

Spinning colored yarns according to the full color phase mixing model
The rollers in each channel of the CNC spinning are independently driven by the corresponding servo motors to achieve online speed control.
24
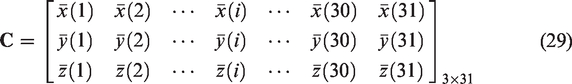
Assuming that the linear densities of the rovings corresponding to the two primary colored fibers are
Then the formula for the drafting ratios of the two primary colored fibers is as follows:

If

The drafting ratio matrix for the spinning of colored yarns with the full color phase is shown below

Stearns–Noechel color prediction model constructed from a full color phase mixing model
Sample space of colored yarns in the full color phase constructed from grid points
On the basis of the three-channel CNC spinning frame and six primary colored rovings, a pairwise coupled colored yarn is prepared in its adjacent colors. The resultant mixing ratios of mixed samples of the full color phase are presented in Table 1.
Mixing ratios of mixed samples of the full color phase

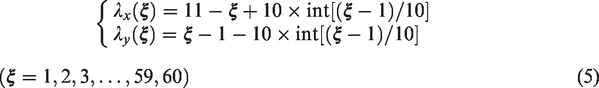
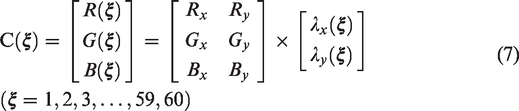
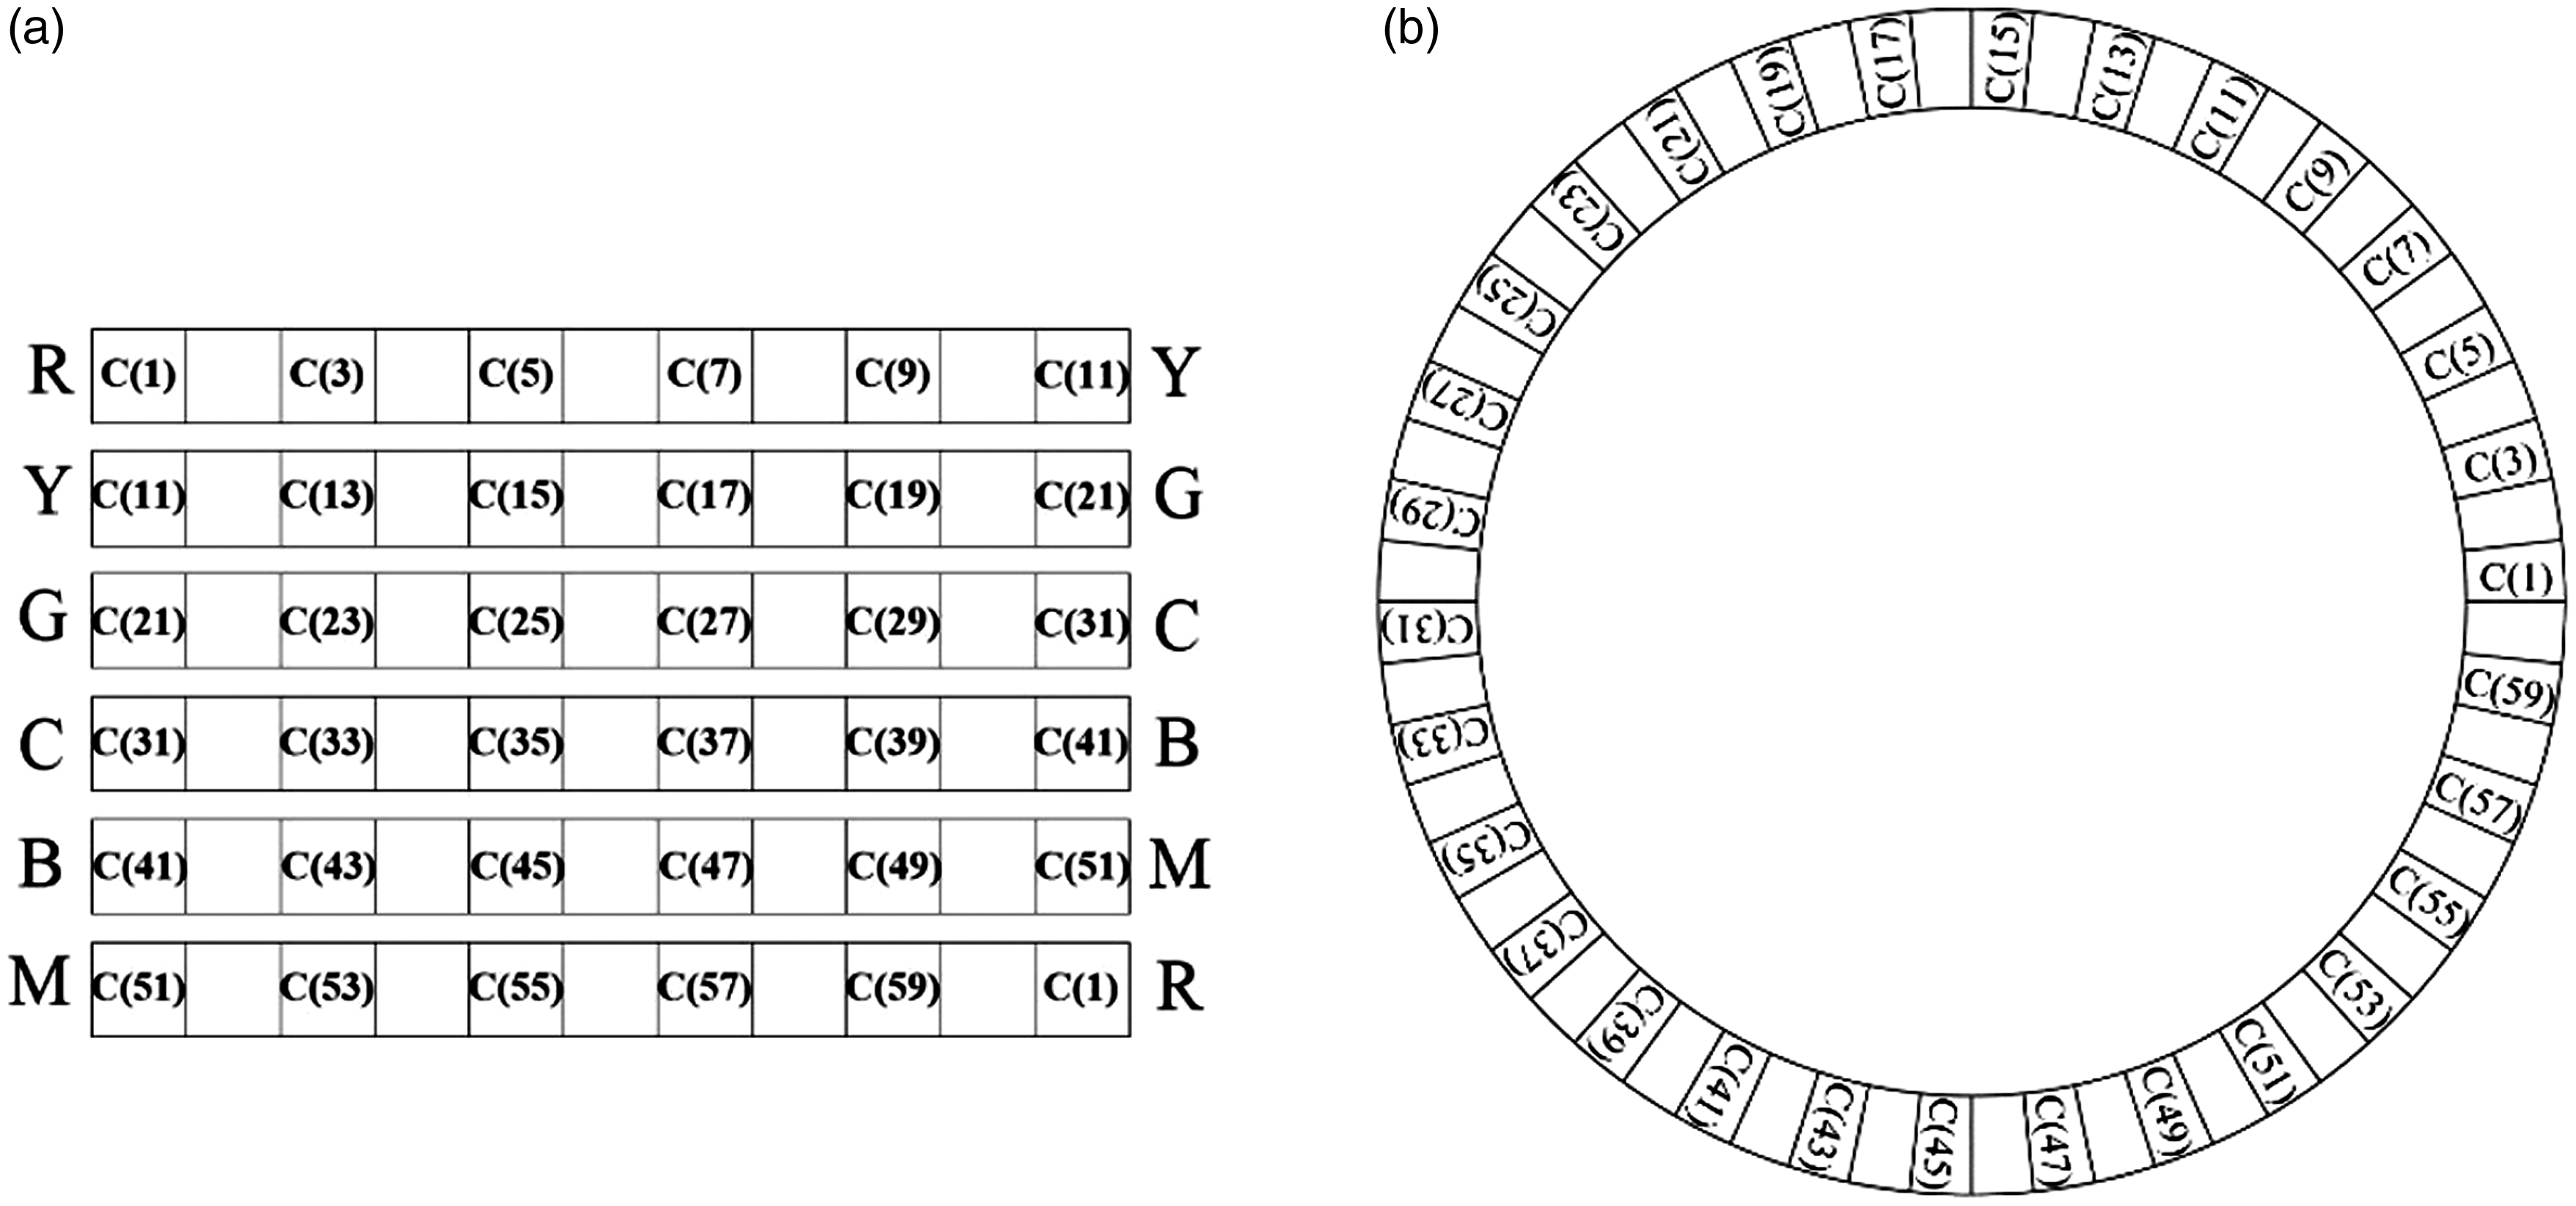
Assuming that the colors of the six primary colored fibers are R(255,0,0), Y(255,255,0), G(0,255,0), C(0,255,255), B(0,0,255), and M(255,0,255), the rectangular and circular chromatography of mixed samples of the full color phase can be acquired according to Equation (7), as illustrated in Figure 1.

Full color phase mixing chromatography. (a) Rectangular chromatography and (b) circular chromatography.
Using the mixing ratios of the mixed samples in Table 1, the chromatography data structure of the 30 samples chosen for the Stearns–Noechel color prediction model with a 20% gradient are presented in Figure 2.
Data structure of color values of mixed samples with a gradient of 20% in the full color phase mixing model. (a) Rectangular chromatography data structure and (b) circular chromatography data structure.
Serialized colored yarns for color prediction and their reflectance
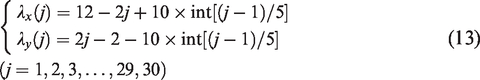
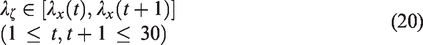
In order to use the Stearns–Noechel formula for color prediction, the reference grid point with 20% as the mixing ratio gradient is chosen from the full color phase sample. If 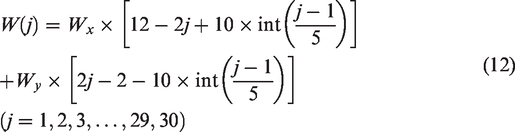
From Equation (12), the mixing ratio formula can be determined as follows:
Adopting a JWF1551 three-channel CNC ring spinning frame and an HC21K small circular knitting machine, 30 colored yarns and their fabrics were prepared according to Equations (10) and (13). Using a 3nh YS6010 spectrophotometer to perform testing on the chosen fabrics with 30 mixing ratios, the reflectance at 31 wavelengths from 400 to 700 nm were achieved as follows:

Reflectance conversion coefficients of binary coupled mixed samples of six primary colored fibers
Assuming that 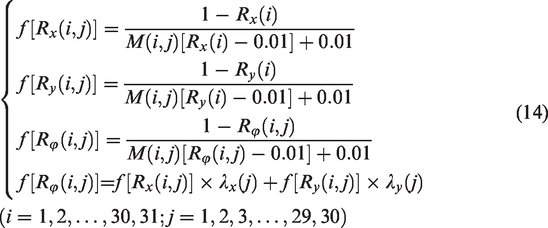
Here,
The relationship between the reflectance function and the reflectance conversion coefficient of the six primary colored fibers is thus derived.
According to Equation (14), the following equation can be obtained

Using MATLAB software, the reflectance conversion coefficients were derived by calculating and removing invalid solutions according to Equation (15) as follows:

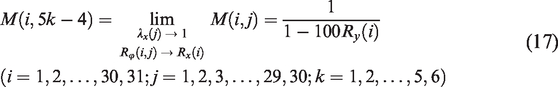
Analyzing Equation (16), it can be seen that the reflectance conversion coefficient is related to the wavelength and also to the mixing ratios. Corresponding to different mixing ratios and wavelengths, the corresponding reflectance conversion coefficients are available. According to Equation (14), the reflectance function
Reflectance conversion coefficient of six primary colored fibers
The reflectance conversion coefficient of the six primary colored fibers is indirectly available using Equation (16), and the results are as follows:
Therefore, all reflectance conversion coefficients corresponding to the 31 wavelengths of the 30 mixing ratio samples are as follows:
Prediction of color values at arbitrary points within the gridded color mixing model and their color differences
Construction of reflectance functions at arbitrary points within the color mixing model
Assuming an arbitrary point 
Equation (16) provides a method to acquire the reflectance function of grid points according to the reflectance conversion coefficient corresponding to the mixing ratio of grid points, but it cannot be directly used to perform the solution of the reflectance function of non-grid points. For this purpose, using the reflectance conversion coefficients of the adjacent grid points as a foundation, an interpolation method is applied to obtain the average of the reflectance conversion coefficients
Acquisition of reflectance conversion coefficients at arbitrary points within the color mixing model
To improve the prediction accuracy, the grid point interval into which the sample mixing ratio falls is first determined, and then it is corrected by the reflectance conversion coefficients of the two endpoints of the interval. Assume that the mixing ratio of a sample belongs to the following interval
The weighting factor p is determined from the difference between the mixing ratio of the sample falling into the above interval and the mixing ratios of the two endpoints. The weighted arithmetic mean 
The formula of the reflectance conversion coefficients 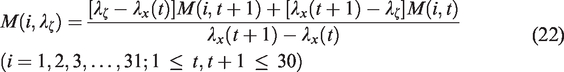
The values of 
Color prediction and color difference according to the full color phase mixing model
Color prediction at arbitrary points within the full color phase mixing model
A full color phase gridded mixing model was constructed using the six primary colored fibers, and 30 colored yarns were produced by the three-channel CNC ring spinning frame. Using the Stearns–Noechel color prediction model, 930 reflectance conversion coefficients were obtained for 30 mixing ratios of colored yarns and 31 wavelengths from 400 to 700 nm, and a reflectance fitting function with the mixing ratios and the wavelengths as the independent variables was established, by which the reflectance of mixed samples with arbitrary mixing ratios could be determined. As a result of color optics theory, the color value XYZ of this mixed sample can be acquired.
An arbitrary mixed sample 
Using color optics theory,
Color difference of color prediction values at arbitrary points within the color mixing model
According to the constructed Stearns–Noechel color prediction model, the color difference between the predicted and measured values of the mixed samples is determined as follows:
18

Here,
Prediction of the mixing ratios of binary primary colored fibers by the color values of the full color phase mixing model
Assume that the color value of sample 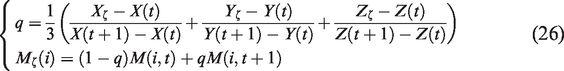
The first-order derivative of the theoretical reflectance and its matrix formula are as follows:


The standard colorimetric observer tri-stimulus value matrix formula is as follows:
The formula for the relative spectral power distribution matrix of the standard light source is as follows:

The reflectance function matrix of binary primary colored fibers is as follows:

The reflectance function matrix of sample 
The mixing ratios of sample 
where
Experimental analysis
Colored yarns and their fabrics
The material is long-staple cotton, the six primary colored fibers of red (R), yellow (Y), green (G), blue (B), cyan (C), and magenta (M) were dyed by reactive dyes, and the colored rovings with a linear density of 450 tex were obtained by opening, carding, combing, drawing, and roving processes.
The linear density of the 30 colored yarns was 27.76 tex, the yarn twist was 600 twist/m, the yarn twist coefficient was 316.13, and the yarn twist direction was Z twist. The machine was a JWF1551 three-channel CNC ring spinning frame with a spindle speed of 7500 rpm, front roller linear velocity of 12.50 m/min, ring type PG1-4254, traveler type UDR 5/0, ring lifting speed of 0.8 mm/s, level-rise distance of 0.5 mm, and ring descending speed of 2.5 mm/s.
The HC21K small circular knitting machine was used to weave the above yarns with a coil length of 0.6 mm, a fabric wale density of 98 rows/10 cm, and a fabric course density of 160 rows/10 cm.
Measurement of the spectral reflectance of samples
The reflectance values of the yarns were obtained using a 3nh YS6010 spectrophotometer under a D65 light source, 10° field of view, 25.4 mm aperture, and in the SCI mode; each sample was measured five times and the average value was determined. 26
Results and discussion
As illustrated in Figure 3, the resulting fabric was divided into six rows and six columns, and the two primary colors of each row were RY, YG, GC, CB, BM, and MR, respectively, and the mixing ratios of each row were varied in a gradient of 20% and were 10:0, 8:2, 6:4, 4:6, 2:8, and 0:10, respectively. The first row of fabrics changes gradually from red to yellow through a variation of mixing ratios of red and yellow fibers; the second row of fabrics changes gradually from yellow to green through a variation of mixing ratios of yellow and green fibers; the third row of fabrics changes gradually from green to cyan through a variation of mixing ratios of green and cyan fibers; the fourth row of fabrics changes gradually from cyan to blue through a variation of mixing ratios of cyan and blue fibers; the fifth row of fabrics changes gradually from blue to magenta through a variation of mixing ratios of blue and magenta fibers; the sixth row of fabrics changes gradually from magenta to red through a variation of mixing ratios of magenta and red fibers.
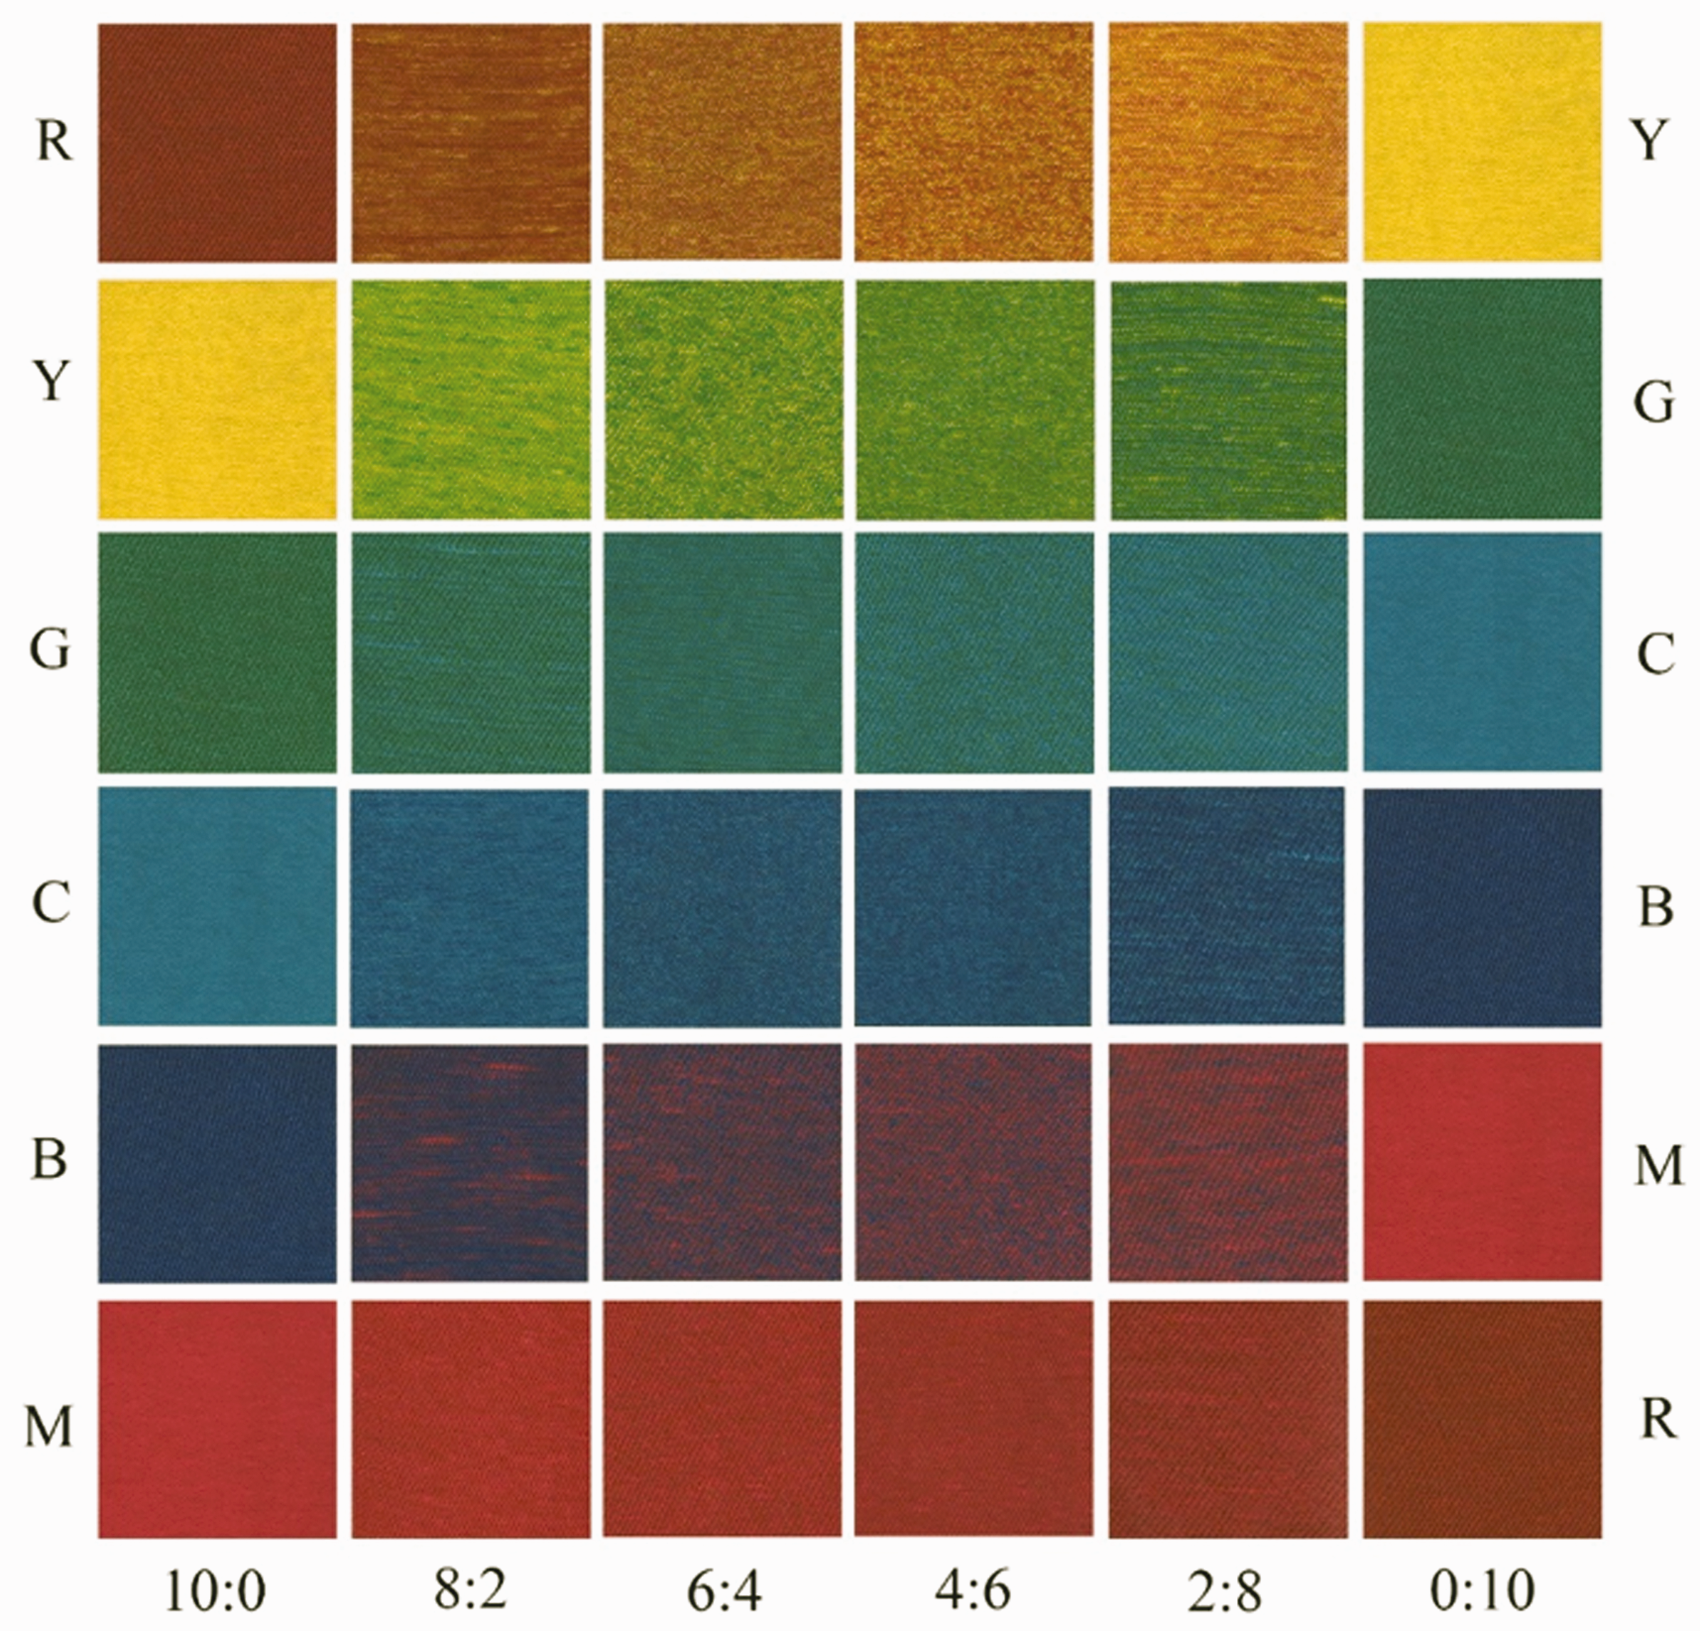
Different mixing ratios of colored fabrics.
As a result of selective absorption and scattering of light, the fabric generates its own color. The reflectance curves under different proportions and primary colors obtained from the above fabrics are presented in Figure 4. As can be seen from the figure, the reflectance of different mixing ratios of fabrics at various wavelengths all exhibit a uniform trend. The reflectance of the fabric for any of the mixing ratios in the figure cannot be derived by linear summation of the reflectance of the binary primary colored fabrics, and an intermediate function needs to be constructed to form a new equation to indirectly resolve it. Therefore, it can be solved by means of the Stearns–Noechel color prediction formula to attain the reflectance conversion coefficient.

Reflectance curves of colored fabrics: (a) RY; (b) YG; (c) GC; (d) CB; (e) BM and (f) MR.
According to the Stearns–Noechel formula, the correlation between the wavelength and the reflectance conversion coefficients of the above fabrics is displayed in Figure 5. As a result, it can be observed that the wavelength and the reflectance conversion coefficient affect each other, and it varies at different wavelengths, which is mainly concentrated between –0.5 and 0.5.

Scatter diagram of the wavelength to reflectance conversion coefficient.
According to the Stearns–Noechel formula, the relationship between the mixing ratio and the reflectance conversion coefficient of the above fabric is demonstrated in Figure 6. As can be seen from the figure, the reflectance conversion coefficients at different proportions are more dispersed and mainly converged between –0.5 and 0.5. The mixing ratio interacts with the reflectance conversion coefficients, with its median fluctuating around 0 within the range of 0–80%.

Boxplot of the mixing ratio to reflectance conversion coefficient.
Instead of forecasting the color of the fabric whose mixing ratio falls on the grid point by fitting the reflectance conversion coefficient to yield the function of the wavelength or mixing ratio and reflectance conversion coefficient, the color of the fabric can be calculated by directly substituting the corresponding 31 reflectance conversion coefficients, which can improve the prediction accuracy and enable the color difference of the grid point fabric to approach 0.
Using six primary colored fibers as an illustration, the mixing ratios of 9:1, 7:3, 5:5, 3:7, and 1:9 were adopted for the spinning of colored yarns, respectively, the corresponding fabrics were fabricated, and the reflectance and its color values of the 30 samples were measured by the 3nh YS6010 spectrophotometer. Then, the prediction of reflectance and its color values for the samples were carried out according to Equations (23) and (24), respectively. A comparison of the predicted and measured reflectance curves is shown in Figure 7. A comparison of the predicted color values with the measured color values is demonstrated in Table 2. A comparison of the predicted colors with the actual images is illustrated in Figure 8.

Comparison of actual and predicted reflectance curves of fabrics at arbitrary proportions: (a) RY; (b) YG; (c) GC; (d) CB; (e) BM and (f) MR.
Comparison of actual and predicted values of colored fabrics


Comparison of the images of the colored fabrics with the predicted colors: (a) RY; (b) YG; (c) GC; (d) CB; (e) BM and (f) MR.
Taking six primary colored fibers as an example, their mixing ratios of 9:1, 7:3, 5:5, 3:7, and 1:9 were used for spinning and manufactured into corresponding fabrics, and then they were measured with a 3nh YS6010 spectrophotometer to attain the reflectance curves and their color values. The forecasting of mixing ratios for the 30 samples was carried out separately according to Equation (33), and the prediction of reflectance and its color values was performed according to Equations (23) and (24) and the predicted mixing ratios, respectively. A comparison of the predicted reflectance curves with the actual ones is presented in Figure 9. The predicted color values are compared with the actual ones in Table 3. A comparison of the predicted colors and the actual images is illustrated in Figure 10.

Comparison of reflectance from predicted mixing ratios and actual ones: (a) RY; (b) YG; (c) GC; (d) CB; (e) BM and (f) MR.
Comparison of actual and predicted values of colored fabrics


Comparison of the images of the colored fabrics with the predicted colors: (a) RY; (b) YG; (c) GC; (d) CB; (e) BM and (f) MR.
Conclusion
In this research, a three-channel CNC spinning frame is used as a platform to construct a full color phase mixing model for six primary colored fibers, and the color and proportion prediction of the full color phase colored yarn is investigated. Firstly, a gridded color mixing model was established by the six primary colored fibers, and the mechanism of regulating colors of forming yarns within the range of the full color phase was determined according to the variations of mixing ratios of multiple primary colors. Secondly, by adopting a gradient of 20% to choose the grid points of the full color phase mixing model, we prepared the colored yarns corresponding to the mixing ratios of the grid points, and combined the color data of the fabrics with the empirical formula to provide an approach for solving the reflectance conversion coefficient with the spectral wavelength and the mixing ratios of colored fibers as the independent variables for the Stearns–Noechel formula. Furthermore, the method of solving the reflectance conversion coefficient between grid points and arbitrary points in the Stearns–Noechel formula is improved, and the approach of forecasting the color value of yarn according to the mixing ratios of the colored fibers and the method of predicting the mixing ratios of colored fibers in the forming yarn from the colors of the yarns in the full color phase mixing model is constructed, and the formula of calculating the color difference between the predicted value and the actual value is provided. The above theory was experimentally confirmed with the following outcomes: using the improved Stearns–Noechel color prediction formula, color and mixing ratio predictions can be performed for samples consisting of arbitrary primary colored fibers within the range of full color phases, with color differences between predicted and actual values remaining reasonable. This research will provide new approaches and innovative perspectives for color matching and prediction of three-channel CNC spinning.
Footnotes
Declaration of conflicting interests
The author(s) declared no potential conflicts of interest with respect to the research, authorship, and/or publication of this article.
Funding
The author(s) disclosed receipt of the following financial support for the research, authorship, and/or publication of this article: This work was supported by the Fundamental Research Funds for the Central Universities (JUSRP12029 and JUSRP52007A) and the “Jian Bing” and “Ling Yan” Research Fund in Zhejiang Province (2022C01188); this work was also supported by the Fundamental Research Funds of Zhejiang Natural Science Foundation (LGG20F020019), and the Science and Technology Bureau of Jiaxing City (2019AY11020).