
Abstract
A full color gamut mixing model including 166 grid points was constructed based on a ternary coupled mixing algorithm. Using 31 grid points as standard samples and preparing colored yarns and their fabrics, the 961 groups of spectral reflectance curves of 31 fabrics were obtained by spectrophotometer, and the reflectance conversion coefficient solution approach with spectral wavelength and mixing ratios of colored fibers as independent variables was provided by Stearns-Noechel formula. The method of predicting colors of yarns using colors and mixing ratios of three primary colored fibers and predicting color values and mixing ratios of three primary colored fibers by devised colors is proposed. Experiments show that solving the reflectance conversion coefficient according to the spectral wavelength and mixing ratios of colored fibers may improve the prediction accuracy of the Stearns-Noechel formula. The application of an improved reflectance conversion coefficient in the Stearns-Noechel formula enhances the prediction accuracy of both the colors and the mixing ratios.
Keywords
The colored yarns and fabrics are prepared by mixing several kinds of colored fibers, and the fabrics or apparel are endowed with special visual styles and effects by controlling the state of uniform or non-uniform mixing of colored fibers, which is an essential approach to textile innovation.1,2 At present, the theoretical issues and critical process techniques that need to be addressed in the product designing, development, production, and distribution of colored spun yarns are as follows: firstly, regulating the mixing state of the colored fibers to enable them to present a uniform, stable, and harmonious hybrid color; secondly, predicting the colors of the uniformly mixed fibers from the available colored fibers and their blending ratios; lastly, the color values and their mixing ratios of the colored fibers used for blending and spinning are forecasted from textile colors.3,4
According to the three-channel computer numerical control (CNC) spinning technique, the blending ratios of the forming yarns are adjusted by regulating the drafting ratios of the three primary colored rovings, and furthermore, the color control of the forming yarns is accomplished. A gridded color mixing stereo for full color gamut is built using ternary coupled color mixing of colored fibers, and the full color gamut control is achieved by regulating the mixing ratios of the colored fibers within the color stereo to modulate the variation in hue from 0° to 360°, saturation from 0 to 1, and lightness from 0 to 1. The combination of three-channel CNC spinning technique and color mixing theory of full color gamut regulation of color stereo enables the spinning of colored yarns of full color gamut into a potentiality.5,6
Using multiple primary colored fibers for spinning, two to five primary colored fibers are added simultaneously for blending and spinning, and the colors of the forming yarns are regulated by altering the blending ratio.7–9 In the process of spinning and color mixing, two to five different primary colored fibers are preferably chosen, and the mixing ratios of each primary colored fibers are controlled to innovate the colors of the forming yarn, which is the critical element in developing the colored yarn. For the purpose of predicting the colors of forming yarns by mixing ratios of multiple primary colored fibers, two colored fibers with a hue difference of 120° are usually used in combination with other gray fibers, and the gridded color mixing of multiple primary colored fibers is carried out with discrete masses. A full color gamut gridded mathematical model and its algorithm are established with the concept of big data to attain a full color gamut database of all colored yarns corresponding to the mixing ratios of all grid points so as to complete the construction of color stereo of color mixing within the full color gamut.10,11 By establishing a color stereo of full color gamut, it is feasible to predict the color of a mixed sample by determining its position in the color stereo from arbitrary mixing ratios, and also to forecast the mixing ratios of a textile by assessing the position in the color stereo from its color.
However, during the construction of the color stereo of the full color gamut and the prediction of the color value of the mixed sample by the color values and mixing ratios of the colored fibers, it is essential to establish the mapping correlation between the color values of the colored fibers and their mixing ratios and the color value of the mixed sample. 12 If the impacts of the mixing method on the color values of the mixed samples are not considered for the time being, the color values of the mixed samples can be evaluated in two approaches. One approach is to acquire the mass mixing ratios of colored fibers according to the grid point coordinates of the multiple primary color mixing model, and to use the sum of the product of the color value of each colored fibers and its mixing ratios as the color value in the mixing sample, which conveys the nominal color achieved after linear transmission of multiple primary colors through the mixing sample. The other approach is to access the spectral reflectance of colored fibers by measurement, and then utilize one of the Stearns-Noechel model, Kubelka-Munk theory, Friele model, and neural network algorithm to predict the color of the mixed sample.13–16 These two methods both have existing deficiencies, using the mass mixing ratio as the weighting coefficient of linear transmission of multiple primary colors in the mixed sample to calculate the mixed colors, without taking into account the non-linear characteristics of the reflectance superposition of multiple primary colors, and this method of calculating the color value does not reveal the true color of the mixed sample. The color values of mixed colors are derived by nonlinear superposition using the reflectance curves of colored fibers as the foundation, which does not consider the implications of variations in the mixing ratios of colored fibers on the reflectance curves, and cannot be employed to predict the color values of samples with arbitrary mixing ratios.17,18
This article focuses on the critical issues of color designing, color reproduction, and color reappearing in the design, development, production, and distribution of colored yarns and their products. Firstly, a full color gamut coupled mixing model containing 166 grid points was constructed and the corresponding color mixing chromatography was provided as a standardized database for the mixed samples by incorporating the three primary colored fibers with the ternary coupled mixing algorithm. Secondly, representative grid points from the full color gamut mixing model were chosen and applied to the three-channel CNC spinning to achieve 31 colored yarns and their fabrics, which were used as training samples for the Stearns-Noechel formula. The matrix solution of the reflectance conversion coefficient with wavelength and mixing ratios of colored fibers as independent variables was established and the Stearns-Noechel algorithm was improved to implement accurate color prediction for fabrics with arbitrary mixing ratios, thereby overcoming the issue of color reproduction. The improved Stearns-Noechel formula was combined with the least squares method to achieve bidirectional prediction of color values and mixing ratios from fabric colors, including an approach to implement forward forecasting of color values of mixed samples from three primary colored fibers and their mixing ratios, as well as a reverse anticipation of color values of three primary colored fibers and their mixing ratios from arbitrary fabric colors.19–21
Construction of full color gamut mixing model and its chromatography
Preparation of three primary colored fibers and their color values
The three colored fibers
Discretization of three primary colored fibers
By discretizing the masses of fibers
Construction of full color gamut mixing mode
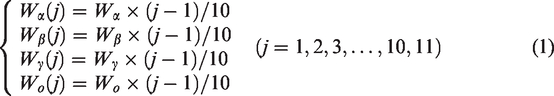
Using the above method, the four primary colors can be acquired, and the mixing of the four primary colors can be used as a foundation to control the hue, saturation, and lightness of the mixed samples. Choosing

To simplify the discussion, the result after bringing

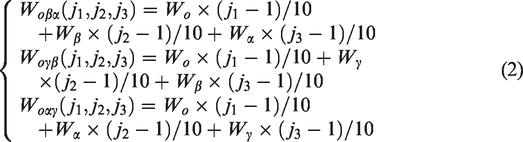
According to the definition of ternary coupled color mixing, let


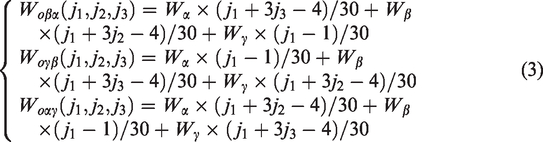
Substituting formula (4) into formula (3), the masses of the ternary coupled mixed samples are derived as follows.
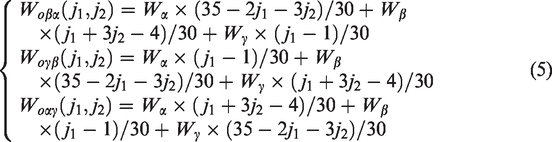

For the purpose of consistent expression of

Mixing ratios of full color gamut mixing samples
The formula for the mixing ratios of colored fibers in the mixed sample is as follows.


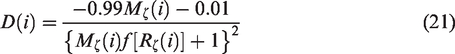
Colors of the full color gamut mixed samples
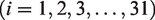
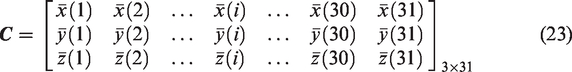
Assuming that the colors of the mixed samples are

Spinning colored yarn by full color gamut mixing model
The rollers in each channel of the three channel CNC spinning are independently driven by the corresponding servo motor to achieve online speed control.22,23 Assuming that the corresponding roving linear densities of the three primary colored fibers are

If

Assuming that

Stearns-Noechel color prediction algorithm constructed from the full color gamut mixing model
Full color gamut yarn sample space built from grid points
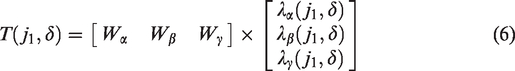
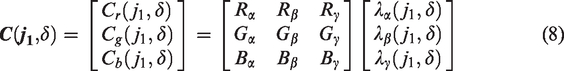
The colors of the three-channel rovings are chosen from cyan (C), magenta (M), and yellow (Y), and their colored yarns are fabricated by a three-channel CNC ring spinning frame. Assuming that the color values of the three primary colors are C(0,255,255), M(255,0,255), and Y(255,255,0), the matrix chromatography of full color gamut mixing samples can be derived according to formula (8) as illustrated in Figure 1. As can be noticed from Figure 1, C→M→Y→C reflects the hue variation among C, M, and Y; C→O, M→O, and Y→O reflect the lightness variation of C, M, and Y; (C+M) → O, (M+Y) → O, and (Y+C) → O reflect the saturation variation of (C+M), (M+Y), and (Y+C).
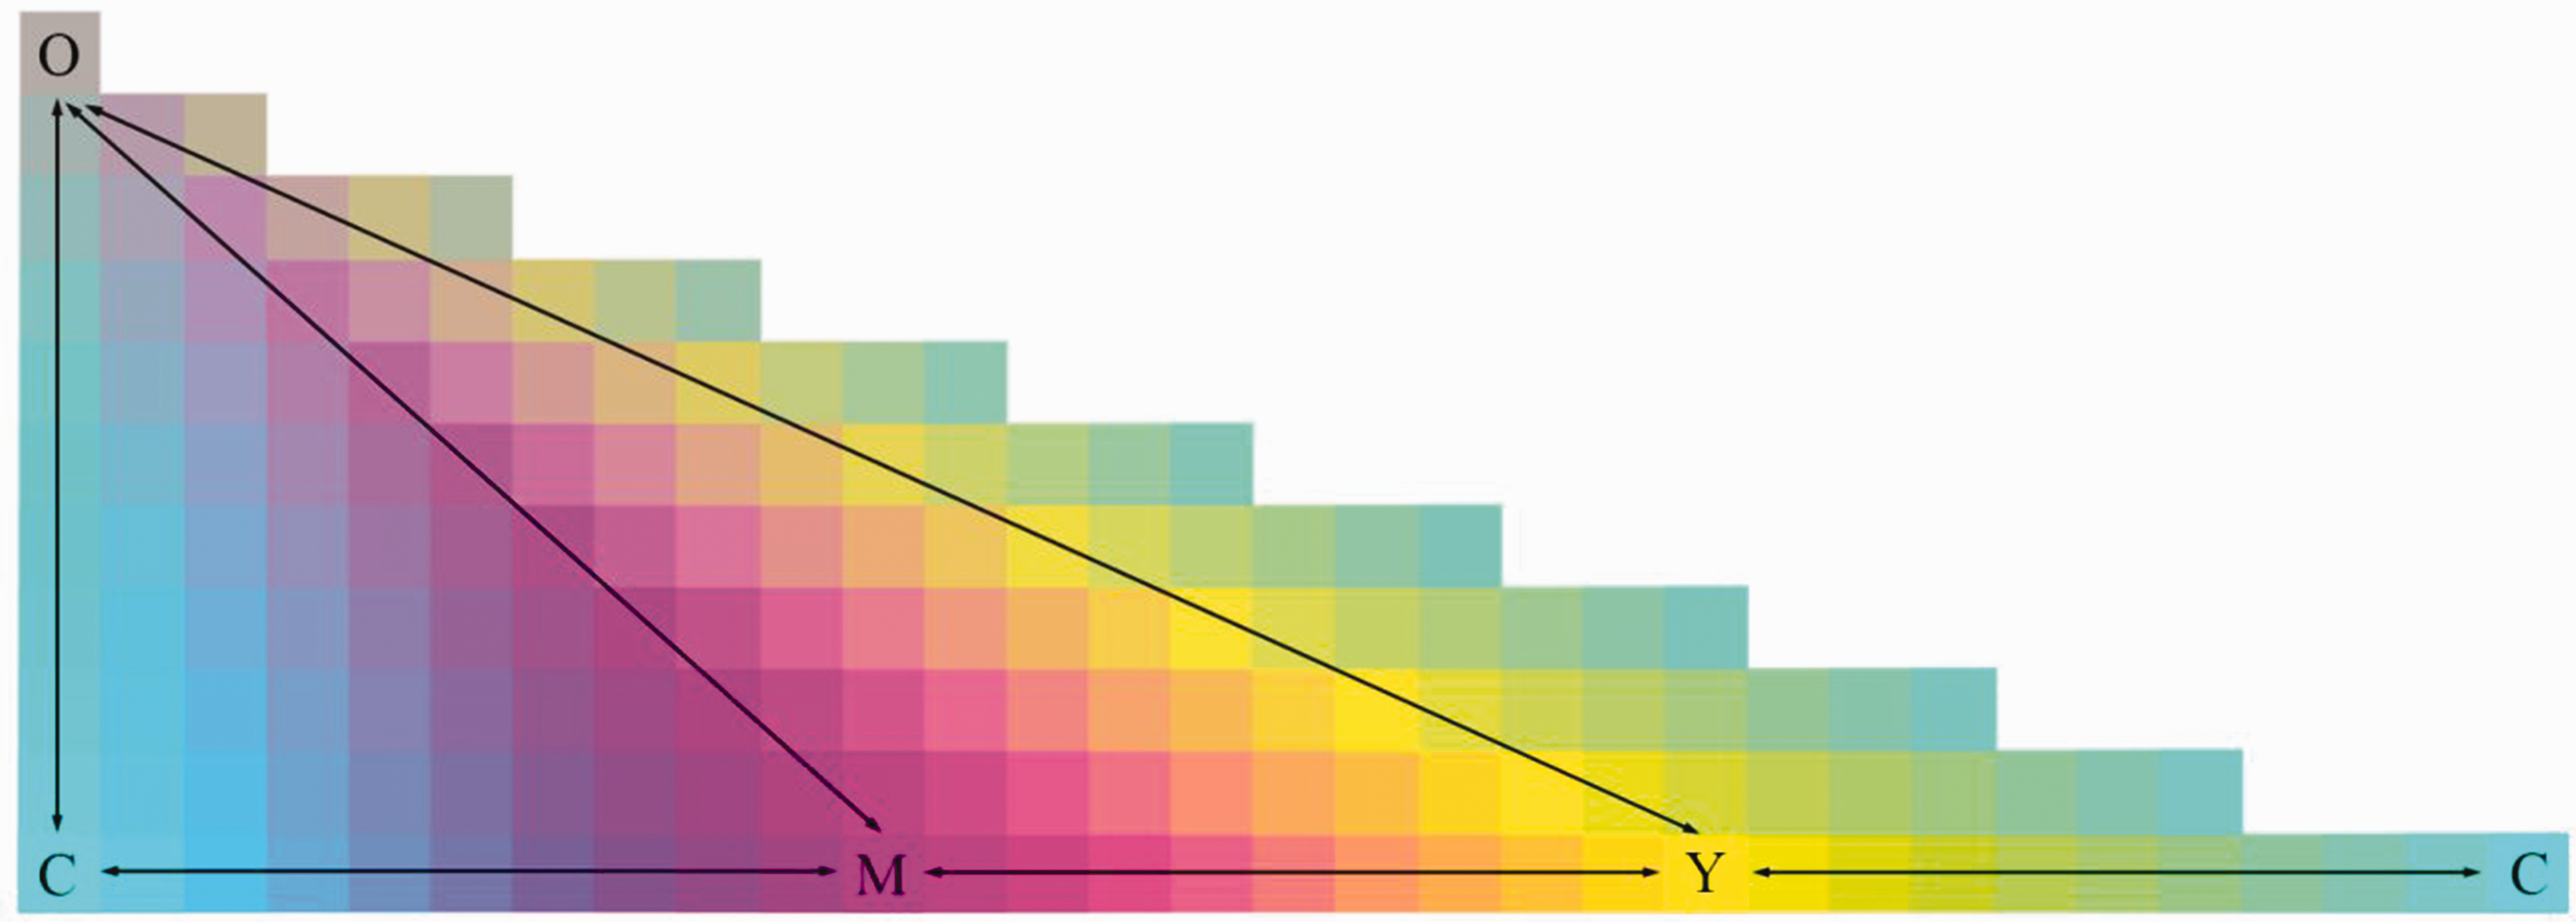
Color variation of matrix chromatography of full color gamut mixing samples. C: cyan; M: magenta; Y: yellow.
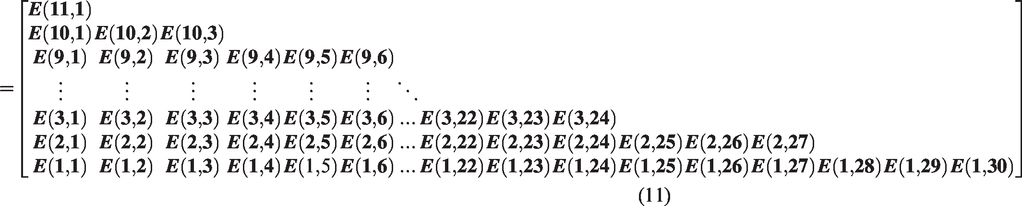
According to the measured color values C(0,114,135), M(151,20,71), and Y(220,175,0) of the three primary colored fabrics, the full color gamut matrix chromatography can be attained by formula (8) as indicated in Figure 2. With the intention of construction of the Stearns-Noechel prediction model for full color gamut mixing samples, the colors and mixing ratios of the colored yarns represented by the 31 grid points from Figure 2 were chosen as the standard sample data.
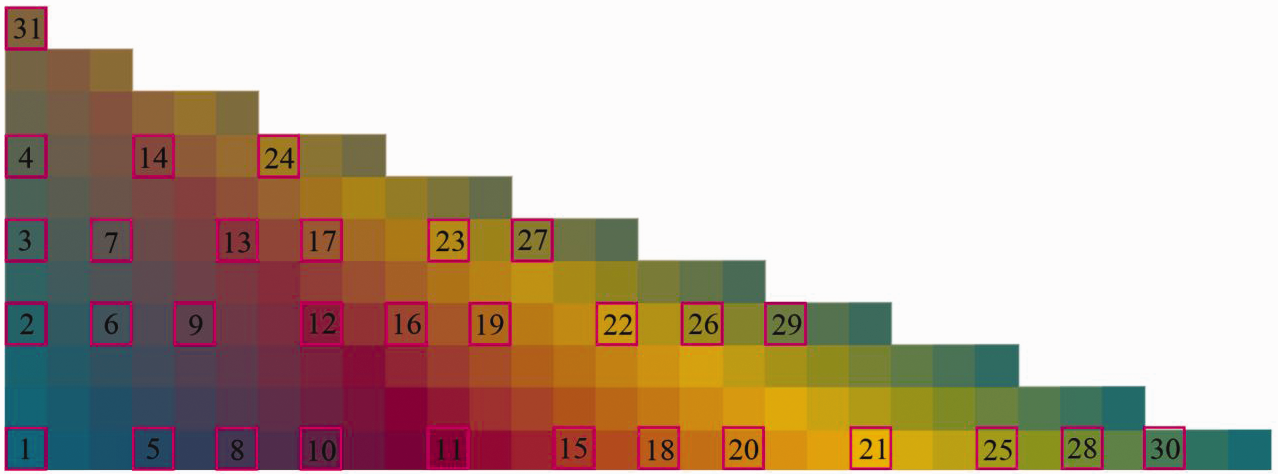
Selection of 31 colored yarns for the Stearns-Noechel prediction model.
Assuming that the mixing ratio of the standard sample is
Comparison of the coordinates corresponding to the mixing ratios of colored yarns in two coordinate systems
Serialized colored yarns for color prediction and their spectral reflectance
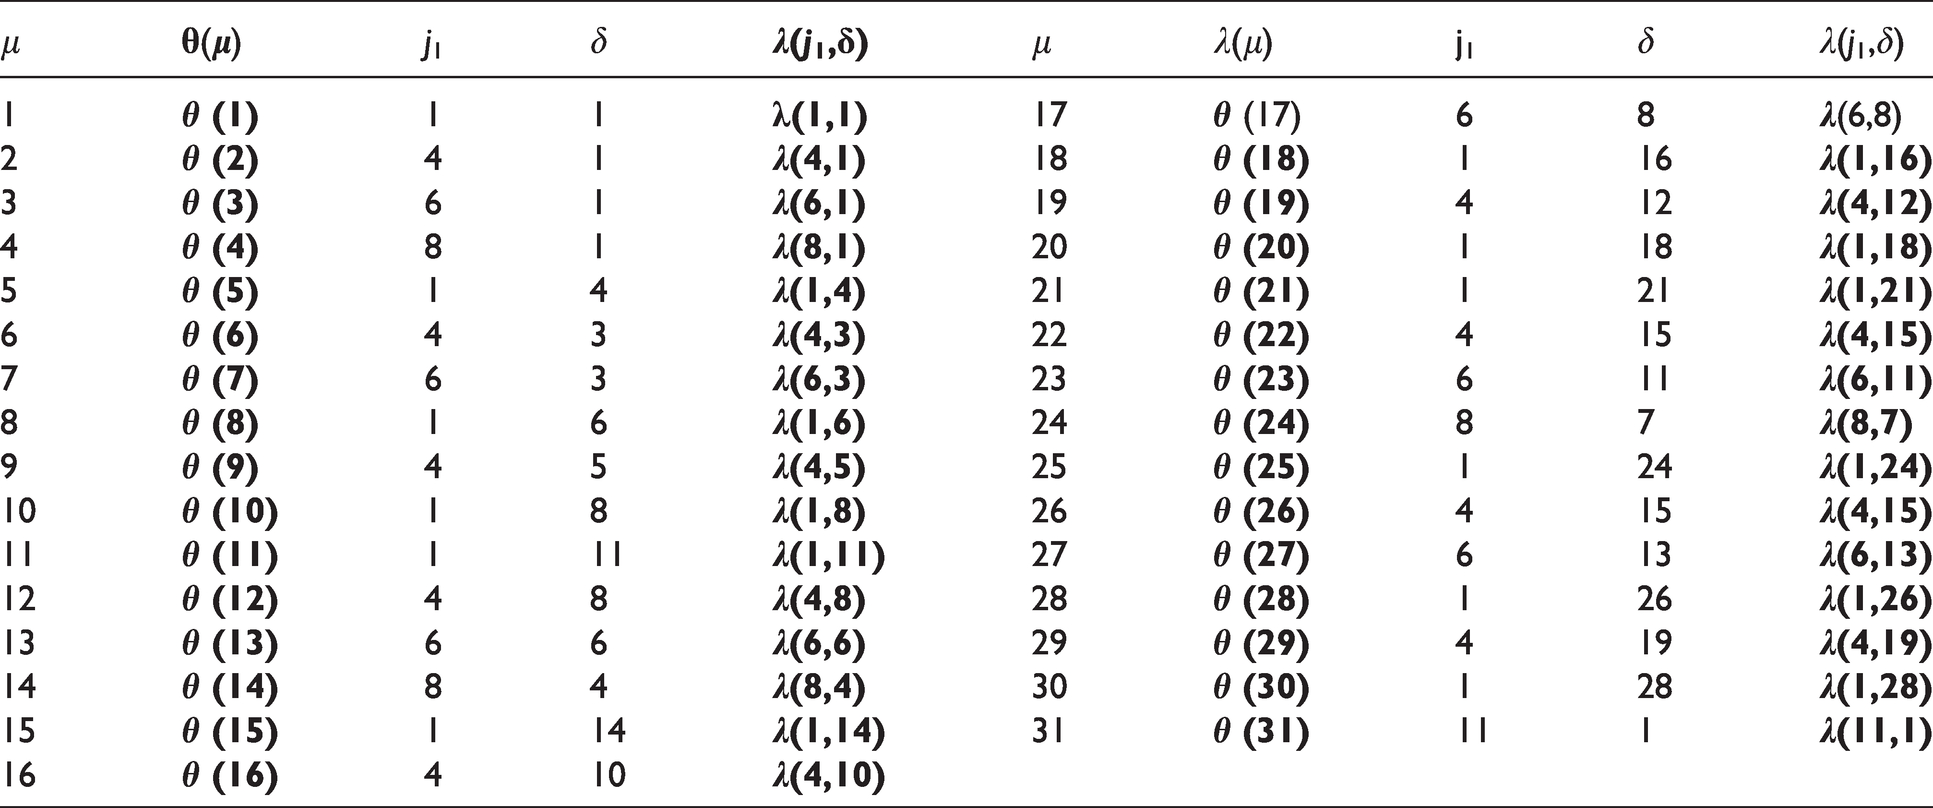
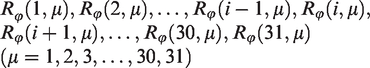
According to Table 1, 31 colored yarns and their fabrics can be prepared in accordance with the JWF1551 three-channel CNC ring spinning frame. Using the 3nh YS6010 spectrophotometer to perform tests on 31 fabrics with different blending ratios, spectral reflectance could be accessed for 31 groups of mixing ratios at 31 wavelengths from 400 nm to 700 nm. The resulting reflectance values for 31 wavelengths of the certain yarn are as follows.
Reflectance conversion coefficients of mixed samples of three primary colored fibers
Assuming that 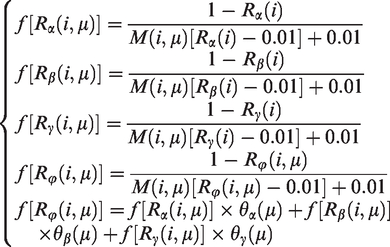

The correlation between the reflectance function of the three primary colored fibers and the reflectance conversion coefficient is thus established. In fact,
Using MATLAB software, the reflectance conversion coefficients can be calculated according to formula (12) and eliminating invalid solution as detailed in the Supplementary Material. Analyzing the formula in the Supplementary Material reveals that the reflectance conversion coefficient is related to the wavelength and simultaneously to the blending ratios. Corresponding to different blending ratios and wavelengths, the corresponding reflectance conversion coefficients are available. Therefore, according to formula (12), the reflectance functions
Reflectance conversion coefficients of three primary colored fibers
Although the reflectance conversion coefficient of the three primary colors cannot be calculated directly with the reflectance function weighting formula, it can be determined indirectly with the reflectance conversion coefficient formula. The process of acquiring the reflectance conversion coefficients for the three primary colored fibers is detailed in the Supplementary Material.
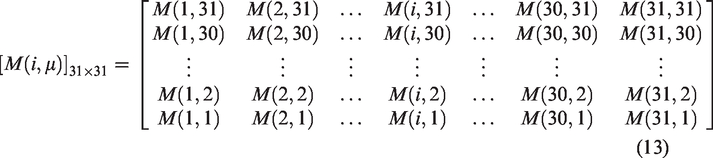
Therefore, all reflectance conversion coefficients corresponding to 31 wavelengths of the samples with 31 blending ratios can be attained as follows.
Prediction of reflectance at arbitrary points within the gridded color mixing model
Construction of reflectance function for arbitrary points within the color mixing model
Assuming that the mixing ratios of the three primary colored fibers at an arbitrary point 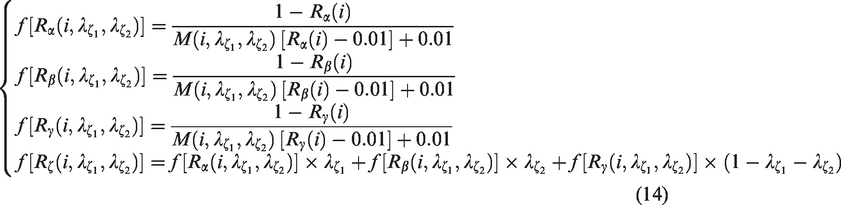

An approach to acquire the value of the reflectance function of grid points by using the reflectance conversion coefficients corresponding to the blending ratios of grid points is provided in the Supplementary Material, but it cannot be applied directly to the solution of the reflectance function of arbitrary points. For this end, using the reflectance conversion coefficients of a number of grid points within the full gamut color mixing model as a foundation, the nearest grid point to that one is accessed and its reflectance conversion coefficient is adopted as the value of
Acquisition of reflectance conversion coefficients at arbitrary points within the color mixing model
With the intention of acquiring the reflectance conversion coefficient for arbitrary point, it is essential to initially obtain the closest grid point 
By taking the value of 

According to formula (14) and (16), then the formula of reflectance of mixed samples is as follows.


Color prediction for a full color gamut mixing model and its color difference
Color prediction at an arbitrary point within the full color gamut mixing model
The full color gamut mixing model was established using three primary colored fibers, and 31 colored yarns were prepared by three-channel CNC ring spinning, by which the Stearns-Noechel algorithm was applied to achieve 961 reflectance conversion coefficients for their 31 colored fabrics with 31 mixing ratios and 31 wavelengths from 400–700 nm, and a reflectance fitting function was constructed with the mixing ratios as the independent variable, through which the reflectance of mixed samples with arbitrary mixing ratios could be calculated. According to the color optics theory, the color value XYZ of this mixed sample can be available.
An arbitrary point within the full color gamut gridded mixing model is 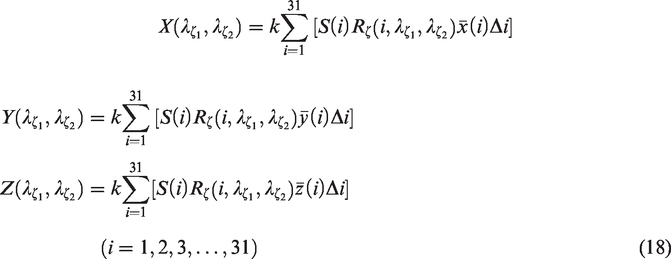
Using color optics theory,
Color difference of predicted colors at arbitrary points within the color mixing model
According to the proposed Stearns-Noechel color prediction model, the color difference between the predicted and actual values for the mixed samples is determined by the following formula.
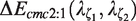
Among them,
Prediction of mixing ratios of three primary colored fibers from colors of full color gamut mixing model
Assuming that the color value of sample 

The theoretical first derivative of the spectral reflectance and its matrix formula are as follows.

The matrix formula for the standard colorimetric observer tristimulus values is as follows.
The relative spectral power distribution matrix formula of the standard light source is as follows.

The reflectance function matrix of the three primary colored fibers is as follows.
The reflectance function matrix of sample 
Assuming that the mixing ratios of sample 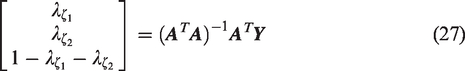
Among them,
Experimental analysis
Colored yarns and their fabrics
The material is long-staple cotton, and reactive dyes are employed to yield C, M, and Y fibers respectively, and the colored rovings with a linear density of 450 tex are achieved through the opening, carding, combing, drawing, and roving processes.
The linear density of the 31 colored yarns is 27.76 tex, the twist is 600 twists/m, the twist coefficient is 316.13, the twist direction of the yarn is Z-twist, the machine is JWF1551 three-channel CNC ring spinning frame, the spindle speed is 7500 rpm, the surface linear velocity of the front roller is 12.50 m/min, the ring type is PG1-4254, the ring lifting speed is 0.8 mm/s, the level rise distance is 0.5 mm, and the ring descending speed is 2.5 mm/s.
The HC21K small circular knitting machine was used to weave the above yarns with a coil length of 0.6 mm, a fabric wale density of 98 rows/10 cm and a fabric course density of 160 rows/10 cm.
Measurements of sample spectral reflectance
The reflectance values of the yarns were obtained using a 3nh YS6010 spectrophotometer under D65 light source, 10° field of view, 25.4 mm aperture, and SCI mode, and each sample was measured five times and the average value was determined.24–26
Results and discussion
Reflectance of colored fabrics and their reflectance conversion coefficients
Thirty-one colored yarns were prepared according to Table 1 using a three-channel CNC ring spinning frame and fabricated into the corresponding fabrics by the knitting machine as indicated in Figure 3.
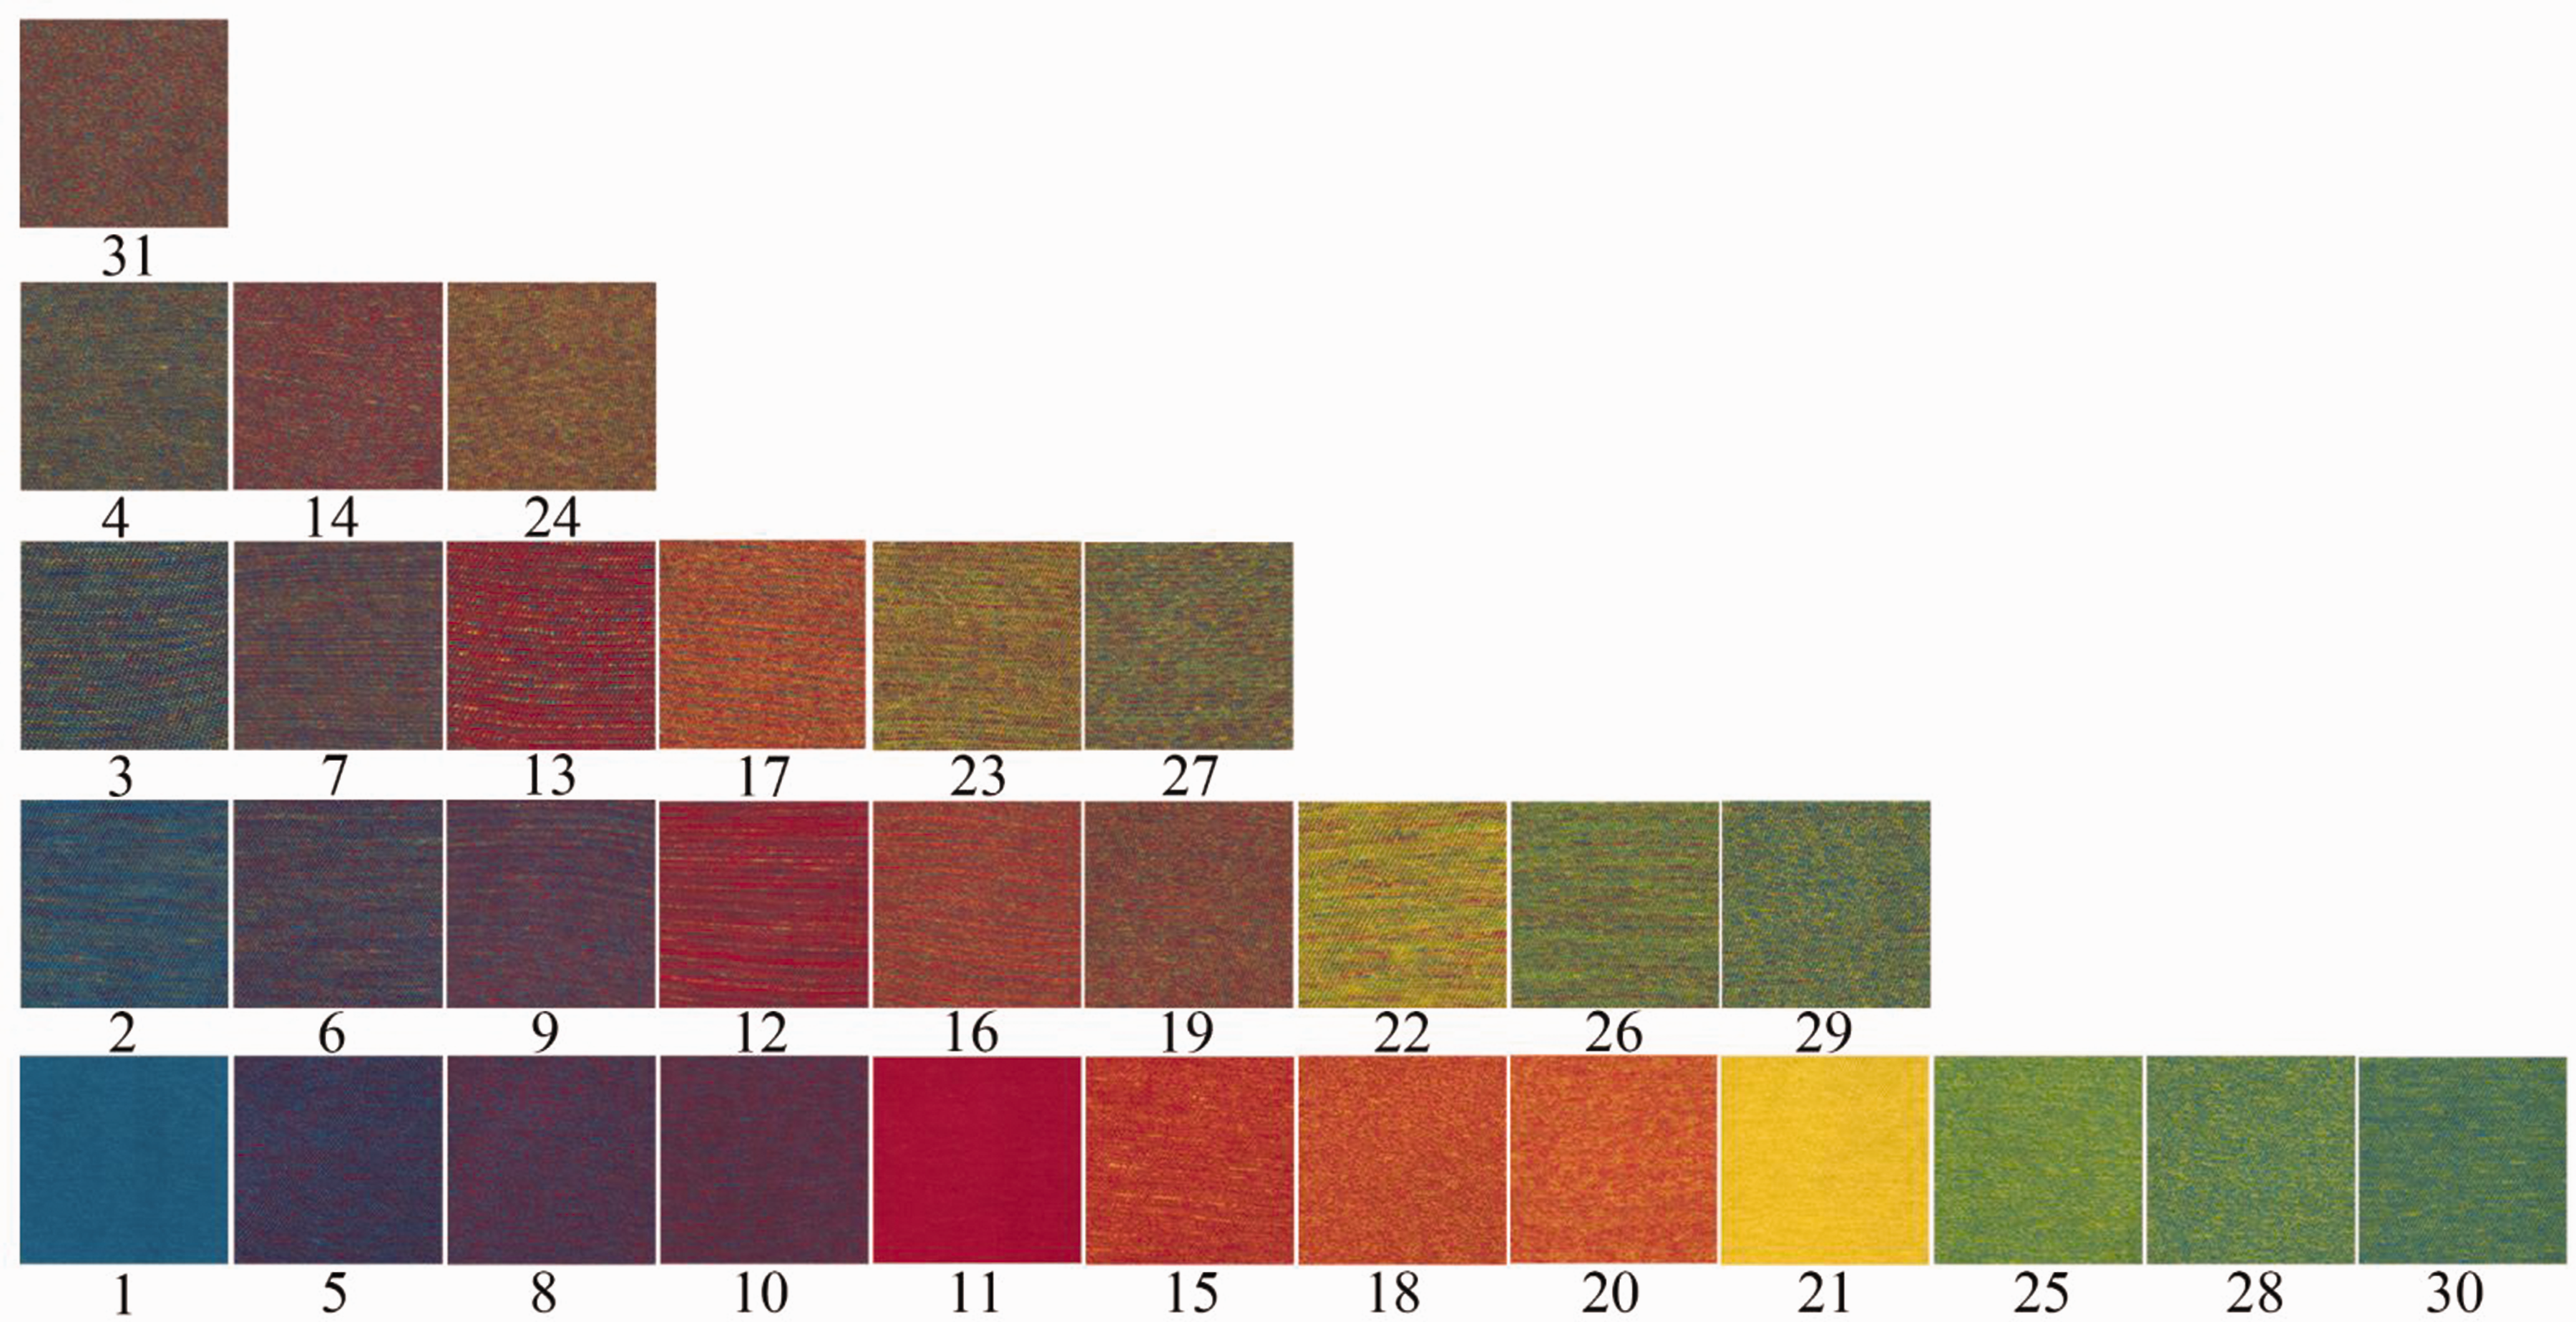
Sample space of 31 colored fabrics for the Stearns-Noechel prediction model.
The above fabric was measured and the color values obtained were plotted, and the results are presented in Figure 4. As can be seen from Figure 4, the colors of the 31 fabrics are more dispersed in the L*a*b* color model, and the points of their projections on the plane a*b* constitute a triangle-like appearance.
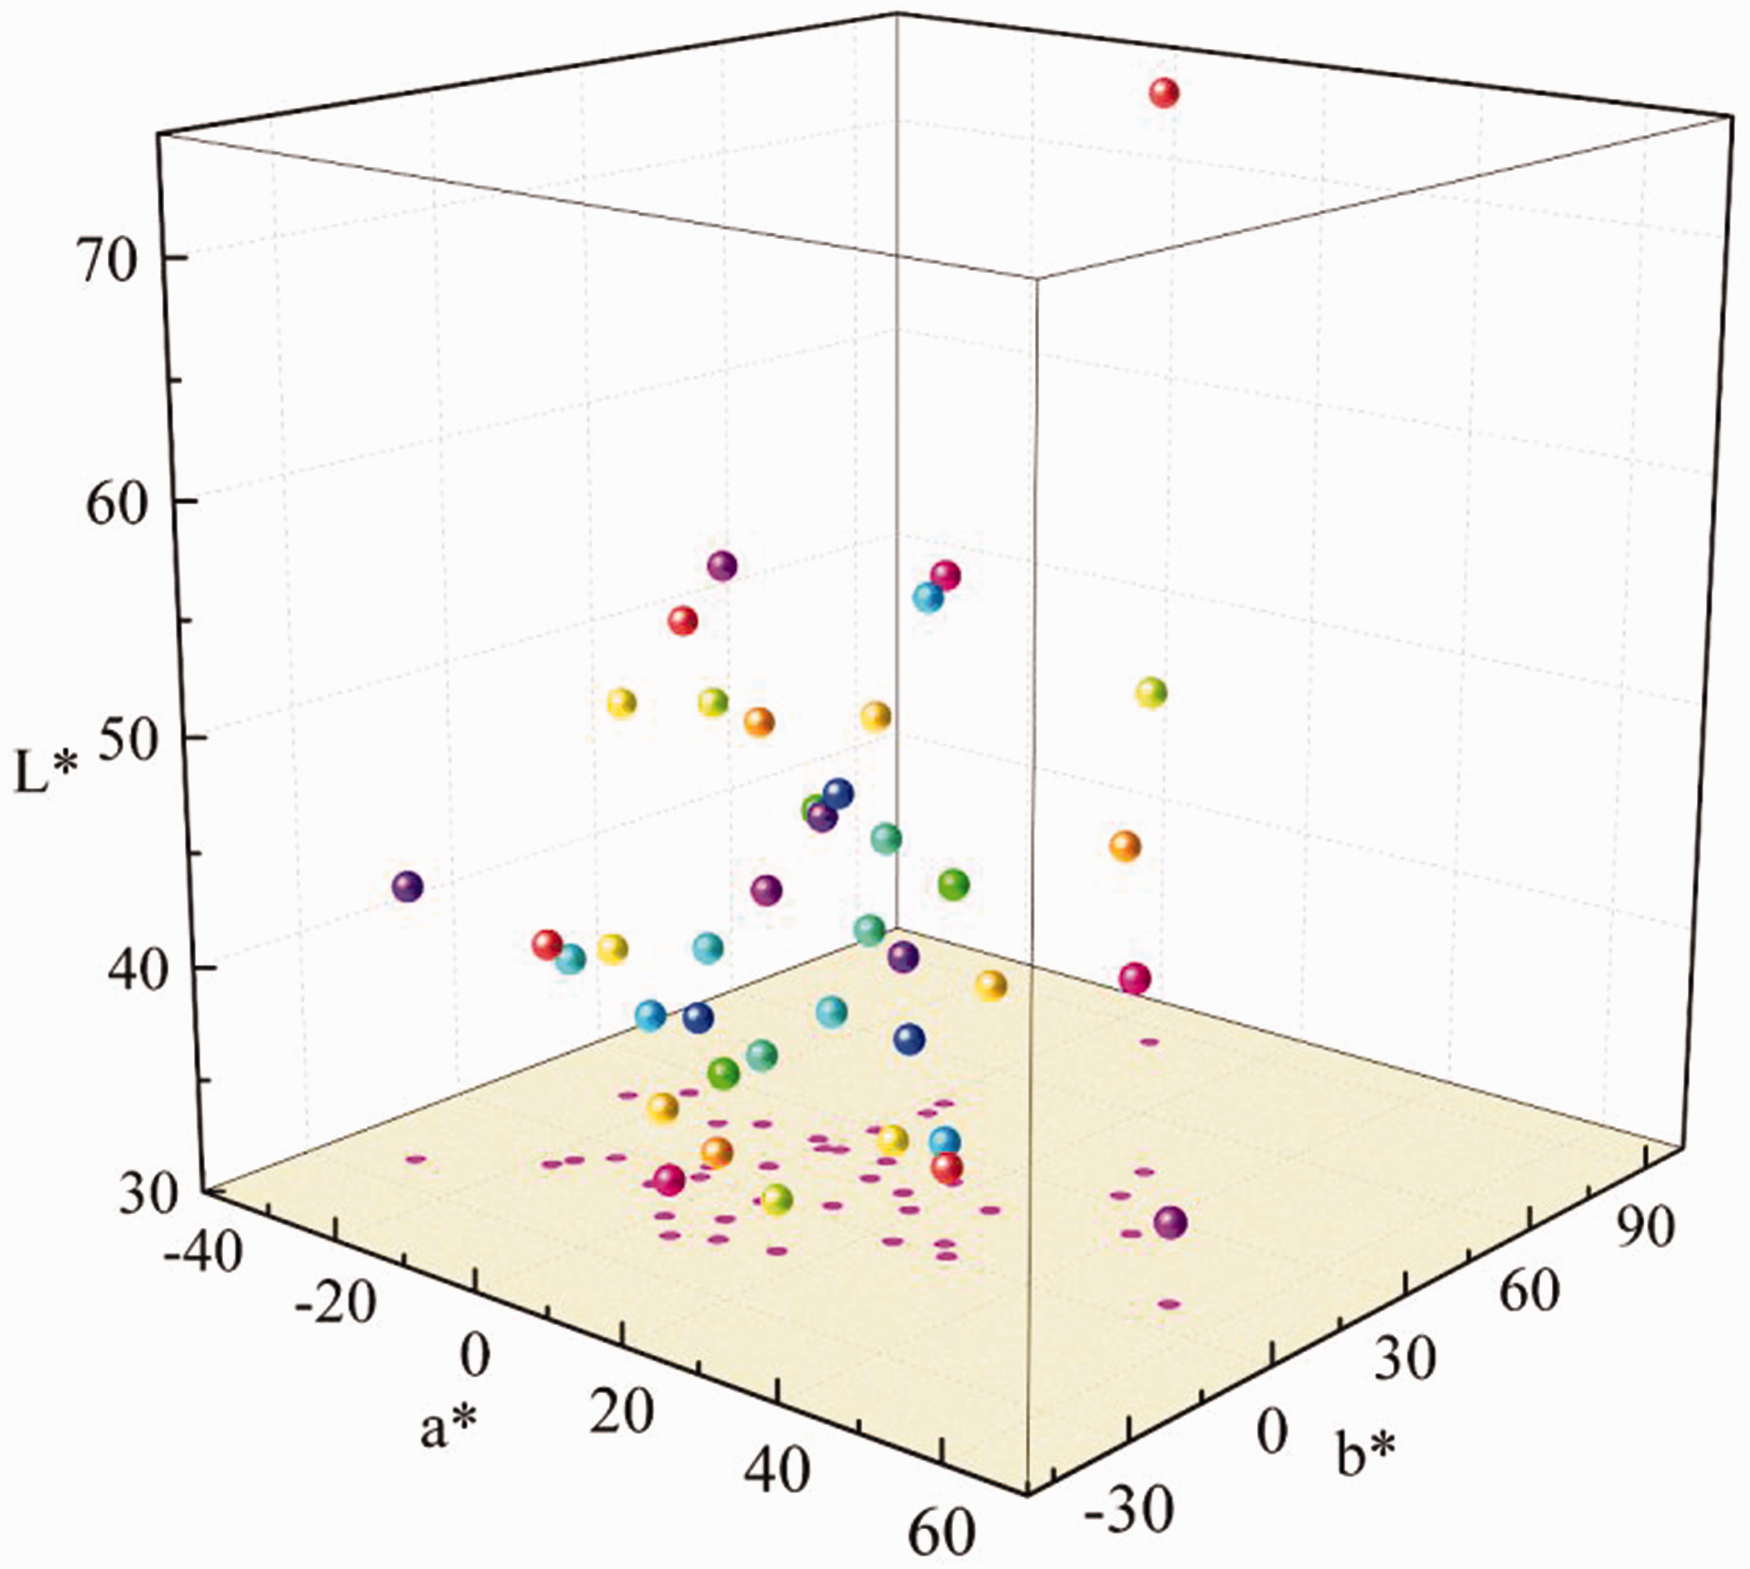
Distribution of fabric colors in the L*a*b* color model.
The spectral reflectance can be attained according to the above fabrics, and their reflectance curves are displayed in Figure 5. As can be observed from Figure 5, the reflectance of different proportions of fabrics at different wavelengths all exhibit a uniform trend.
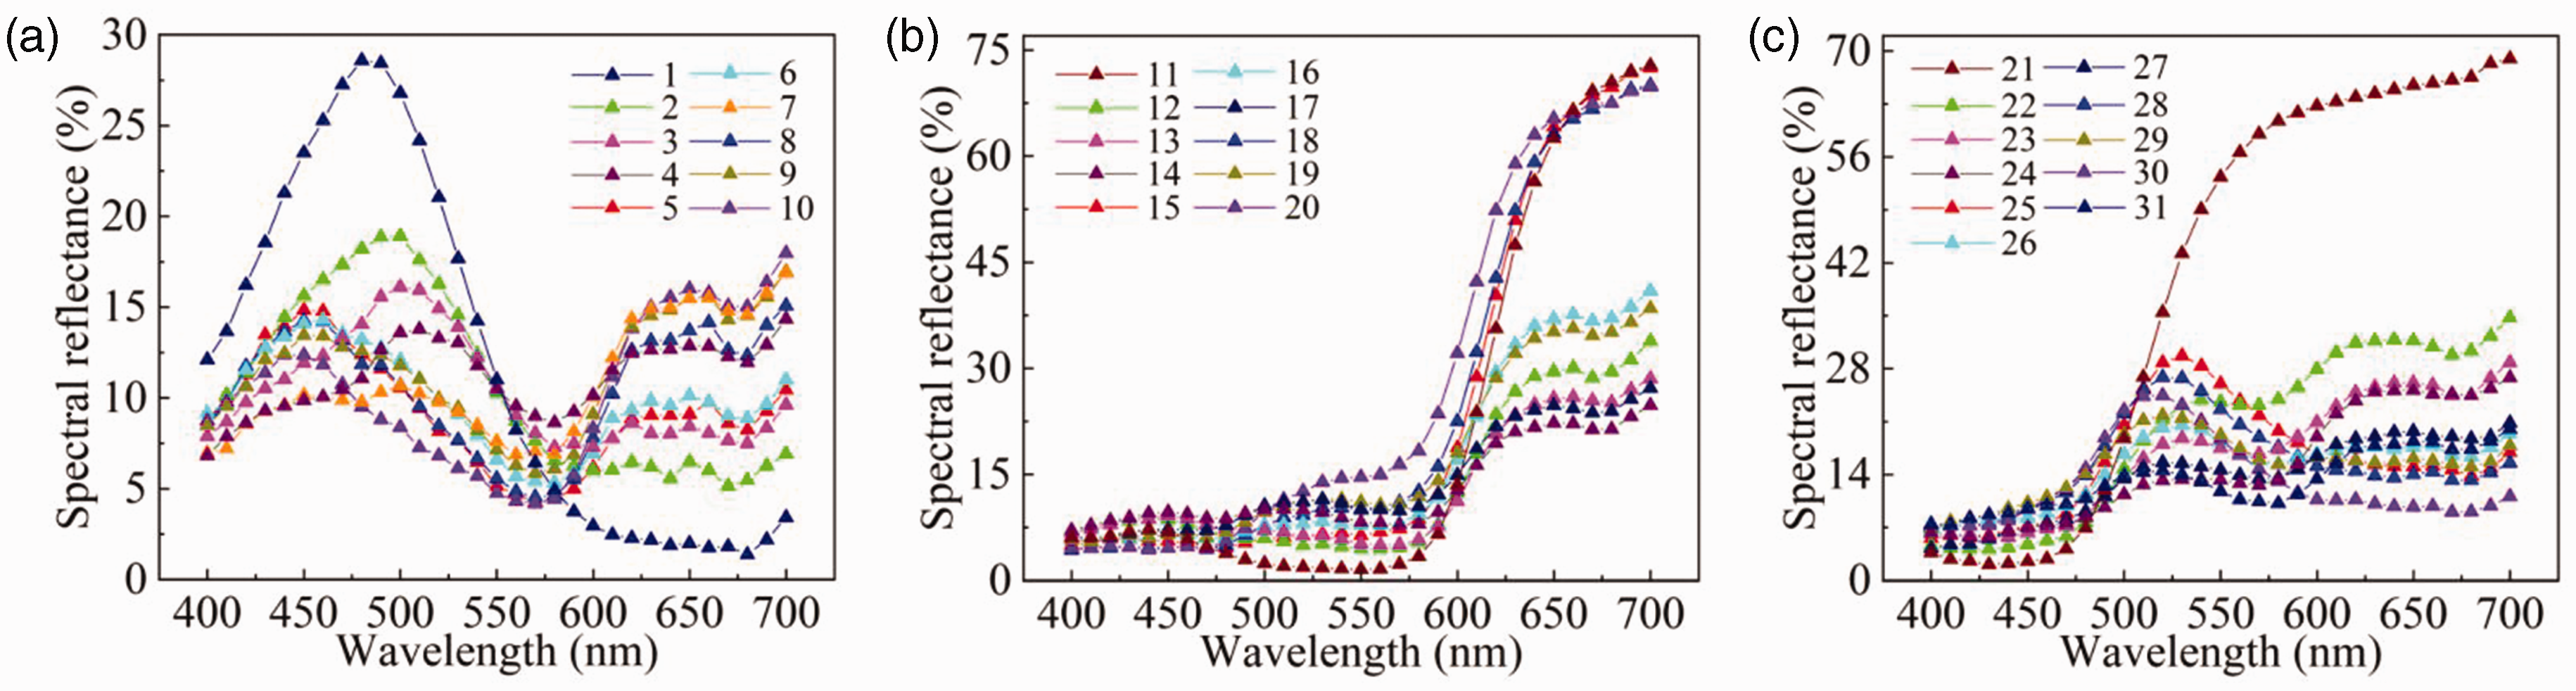
Spectral reflectance curves of 31 colored fabrics: (a) μ = 1–10; (b) μ = 11–20 and (c) μ = 21–31.
According to the Stearns-Noechel formula, the correlation between wavelength and reflectance conversion coefficients of the above fabrics is illustrated in Figure 6, which shows that the values of wavelength and reflectance conversion coefficients affect each other, and the reflectance conversion coefficients are varied at different wavelengths, and are mainly concentrated between 0–0.2, with a positive correlation trend.
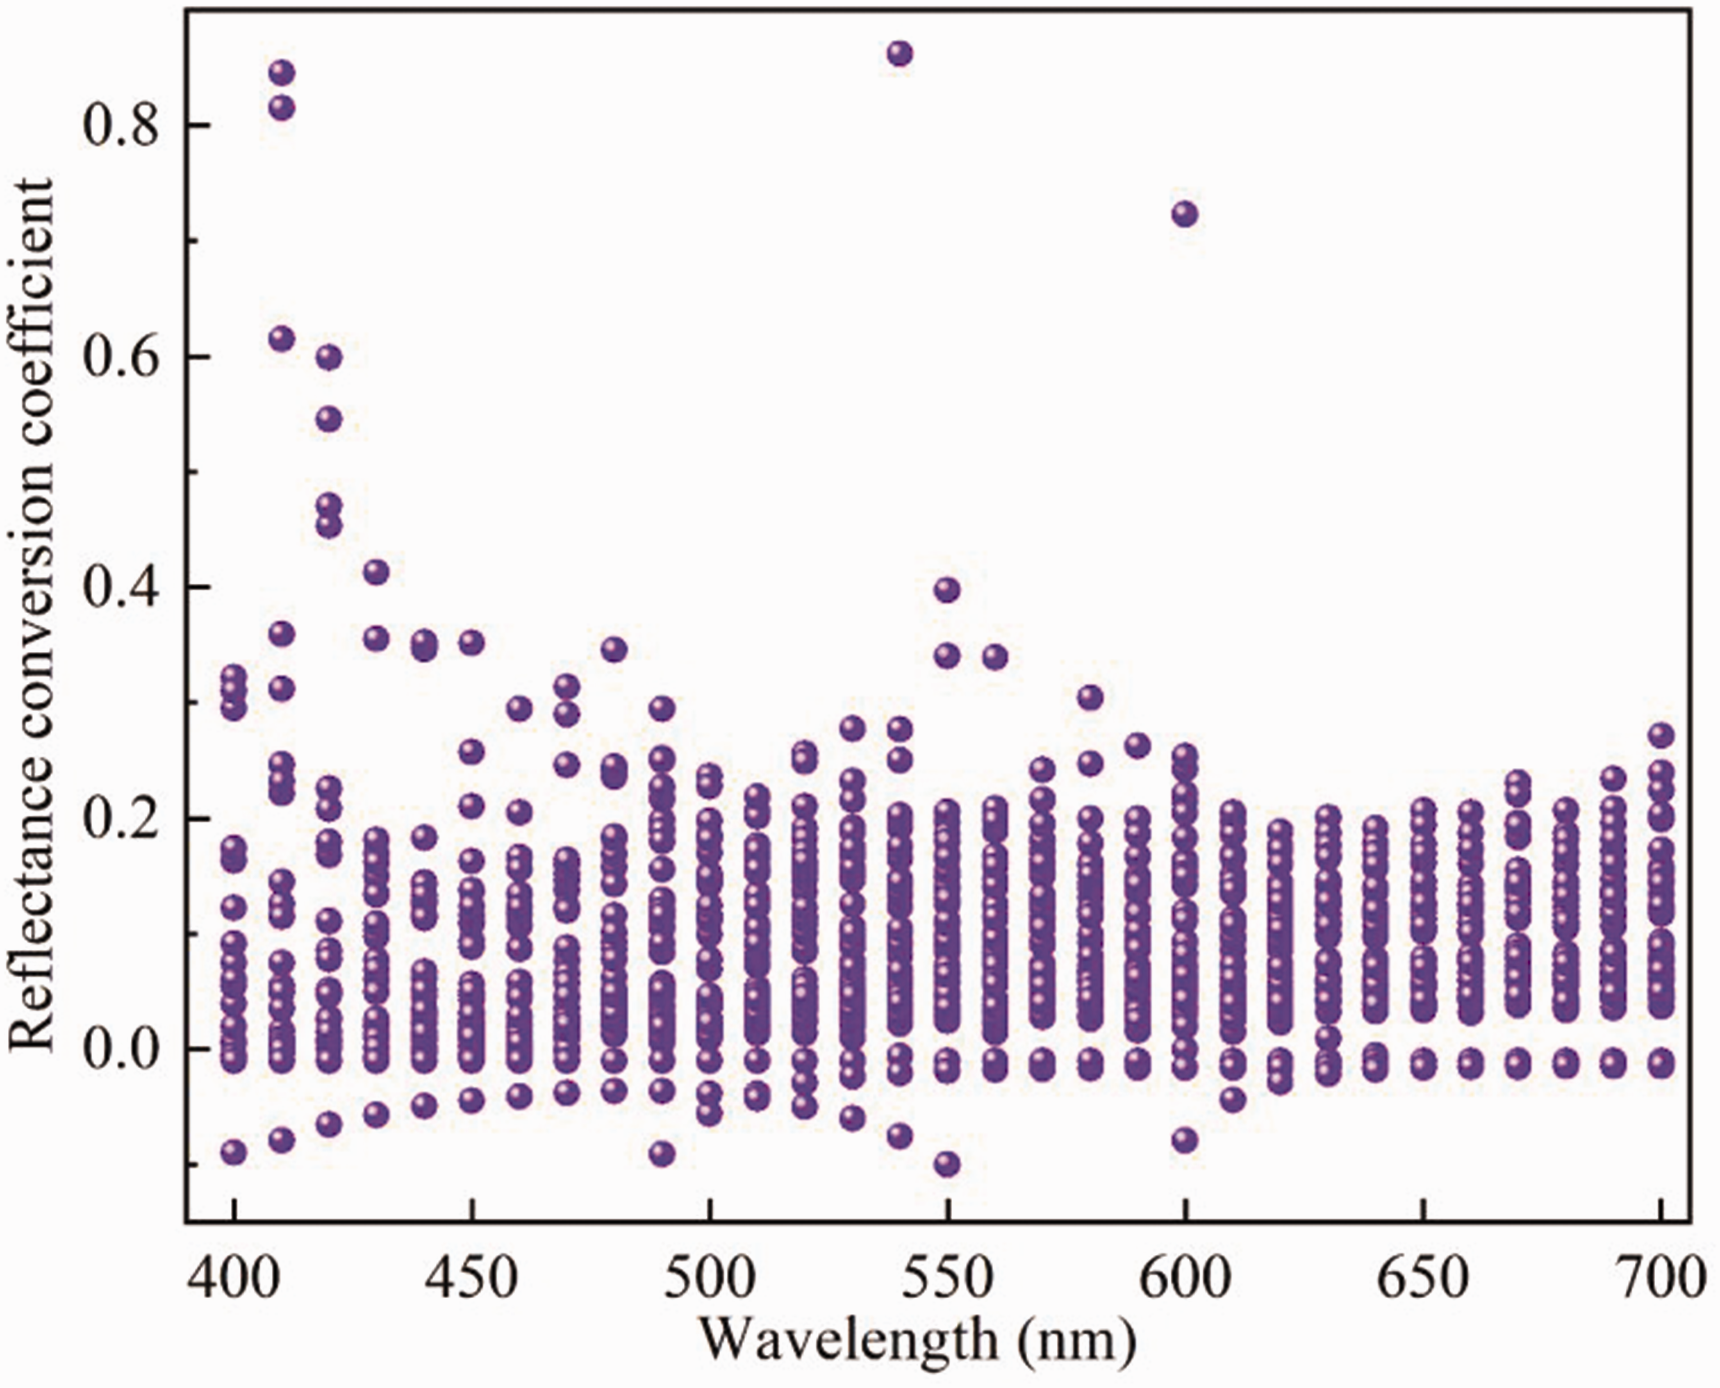
Scatter plot of wavelength to reflectance conversion coefficient.
In accordance with the Stearns-Noechel formula, the relationship between the mixing ratios of the above fabrics and the reflectance conversion coefficients is presented in Figure 7. As can be concluded from Figure 7, the reflectance conversion coefficients are varied under different proportions and are mainly concentrated between 0–0.2. The values of the mixing ratios and the reflectance conversion coefficients interact with each other, and there is no obvious linear association between their projection points on each surface.
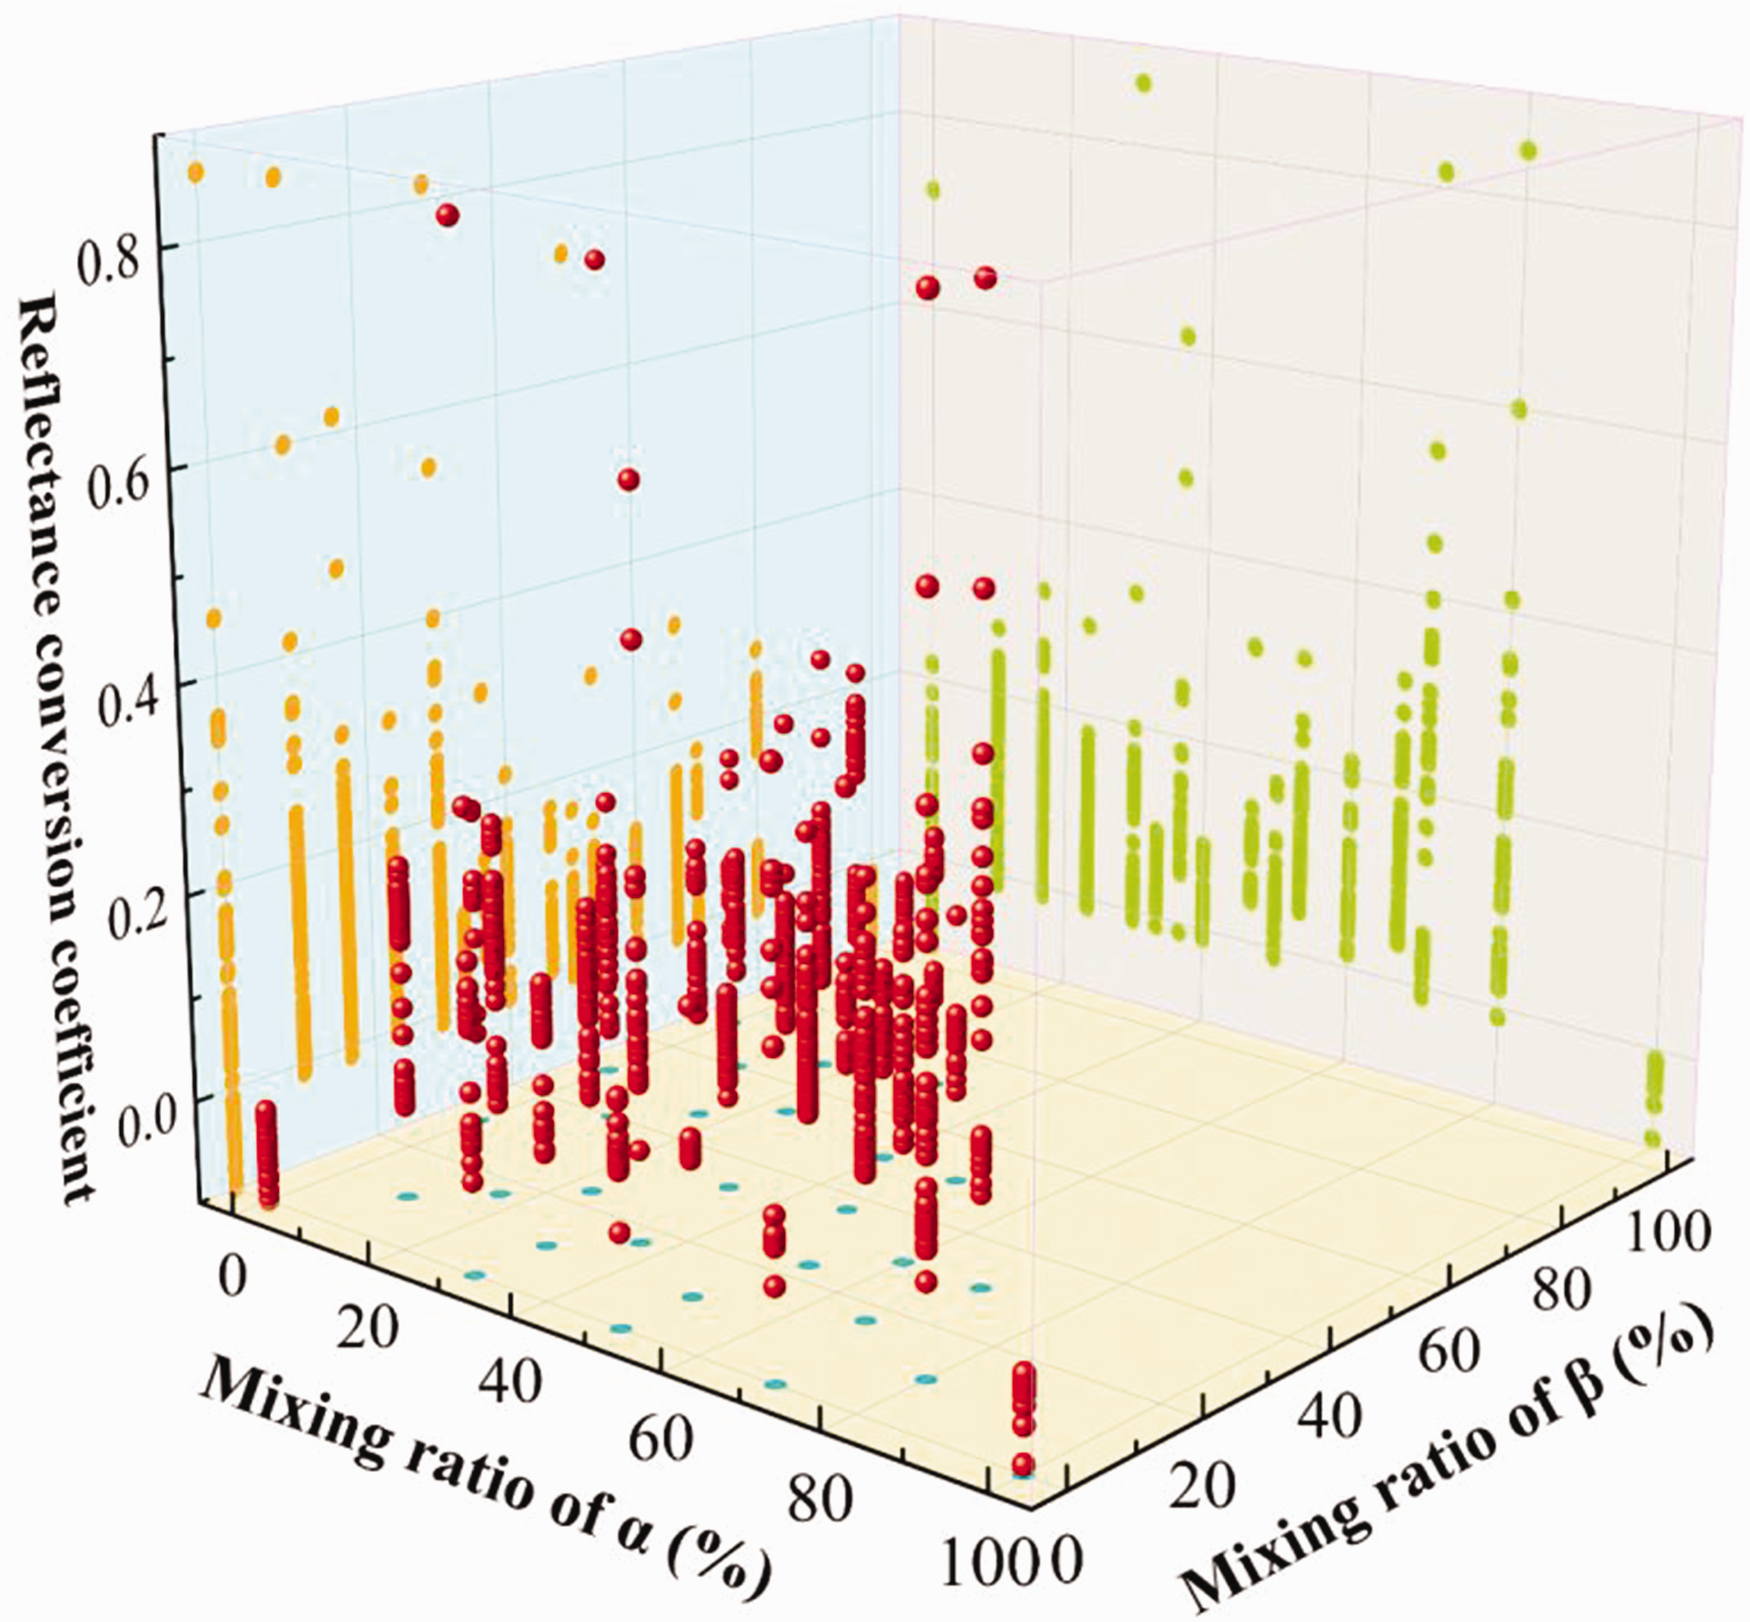
Scatter plot of mixing ratios to reflectance conversion coefficients.
Prediction of fabric color for arbitrary mixing ratios
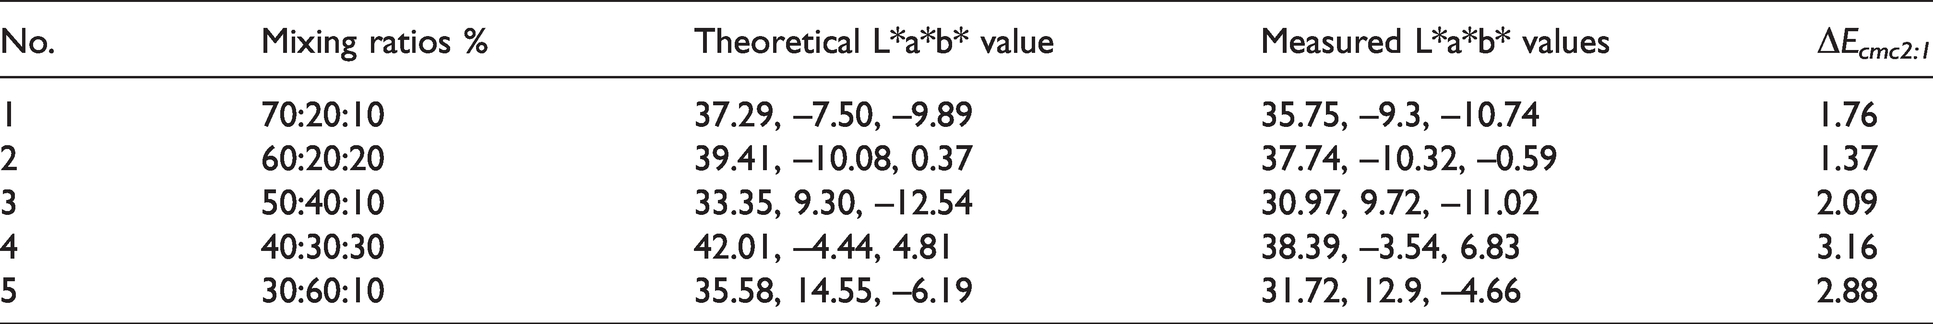
Choosing the three primary colored fibers of C, M, and Y, the mixing ratios were 7:2:1, 6:2:2, 5:4:1, 4:3:3, and 3:6:1, respectively. The prediction of reflectance curves and their color values for each of the five samples was carried out according to formulas (16) and (17). Furthermore, the spinning was performed with the mixing ratios of 7:2:1, 6:2:2, 5:4:1, 4:3:3, and 3:6:1 for fibers C, M, and Y respectively, and the corresponding fabrics were manufactured, and the reflectance curves and their color values of the five samples were measured with a 3nh YS6010 spectrophotometer. A comparison of the predicted and actual reflectance curves is demonstrated in Figure 8. The predicted and actual color values are compared as indicated in Table 2. A comparison of the predicted colors and the actual images is illustrated in Figure 9.
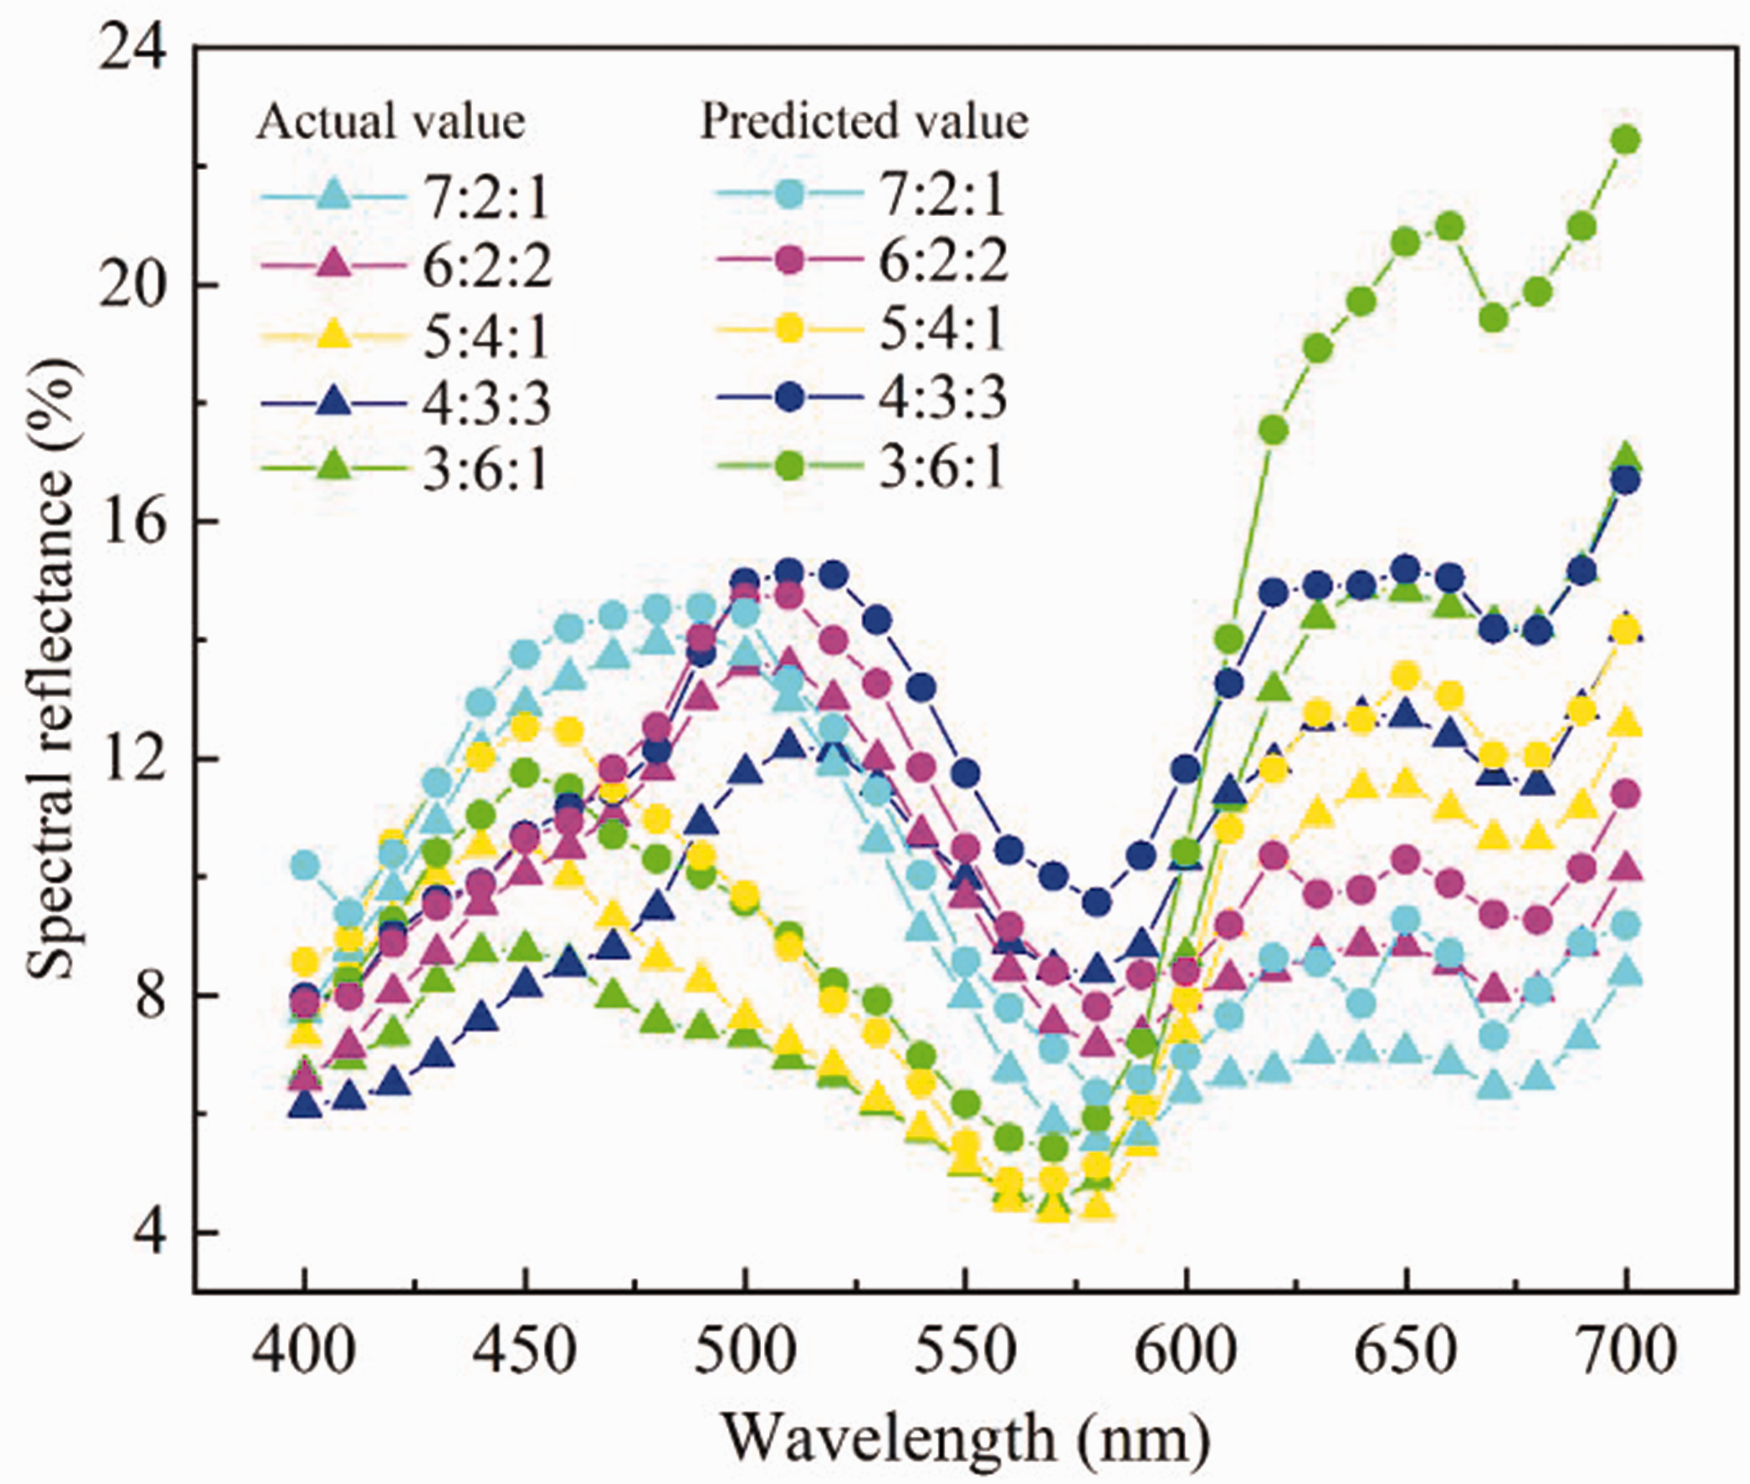
Comparison of actual and predicted reflectance curves of the five colored fabrics.
Comparison of actual and predicted colors for five colored fabrics.
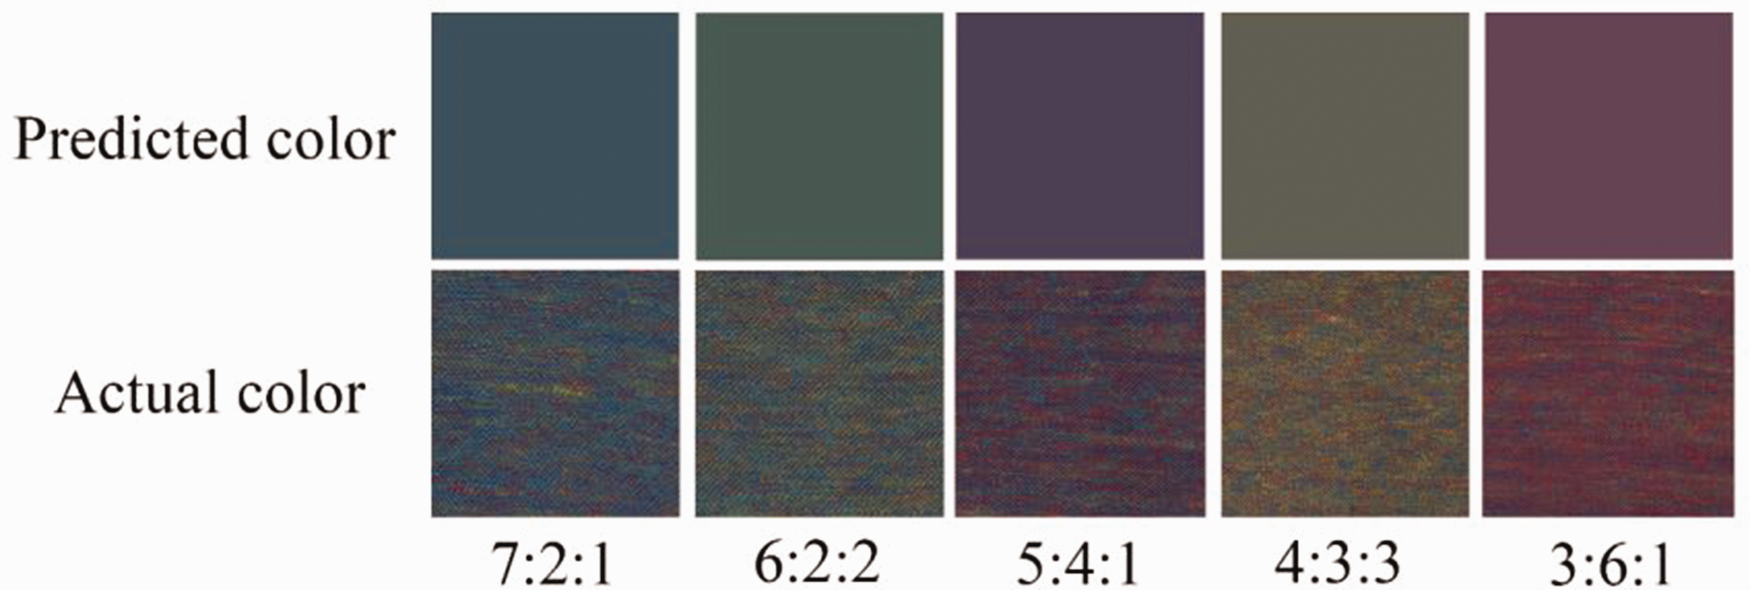
Comparison of the predicted colors and images of the five fabrics.
Prediction of the mixing ratios of fabrics in arbitrary colors
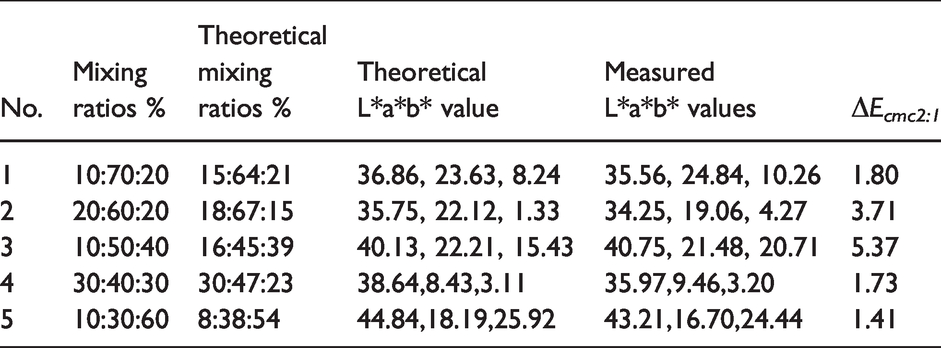
The mixing ratios of fibers C, M, and Y were chosen as 1:7:2, 2:6:2, 1:5:4, 3:4:3, 1:3:6 for spinning, and the corresponding fabrics were fabricated, and the reflectance curves of five samples and their color values were measured with a 3nh YS6010 spectrophotometer. The prediction of mixing ratios for each of the five samples was performed according to formula (27), and the forecast of reflectance curves and their color values were conducted according to formulas (16) and (17) and the predicted mixing ratios, respectively. A comparison of the predicted and actual reflectance curves is illustrated in Figure 10. The predicted and actual color values are compared as indicated in Table 3. A comparison of the predicted colors and the actual images is demonstrated in Figure 11. Comparing Table 2 with Table 3, it can be concluded that the average color difference between the predicted and actual colors achieved from the forecasted proportions on the basis of arbitrary colored fabrics is relatively greater, which is approximately 2.80.
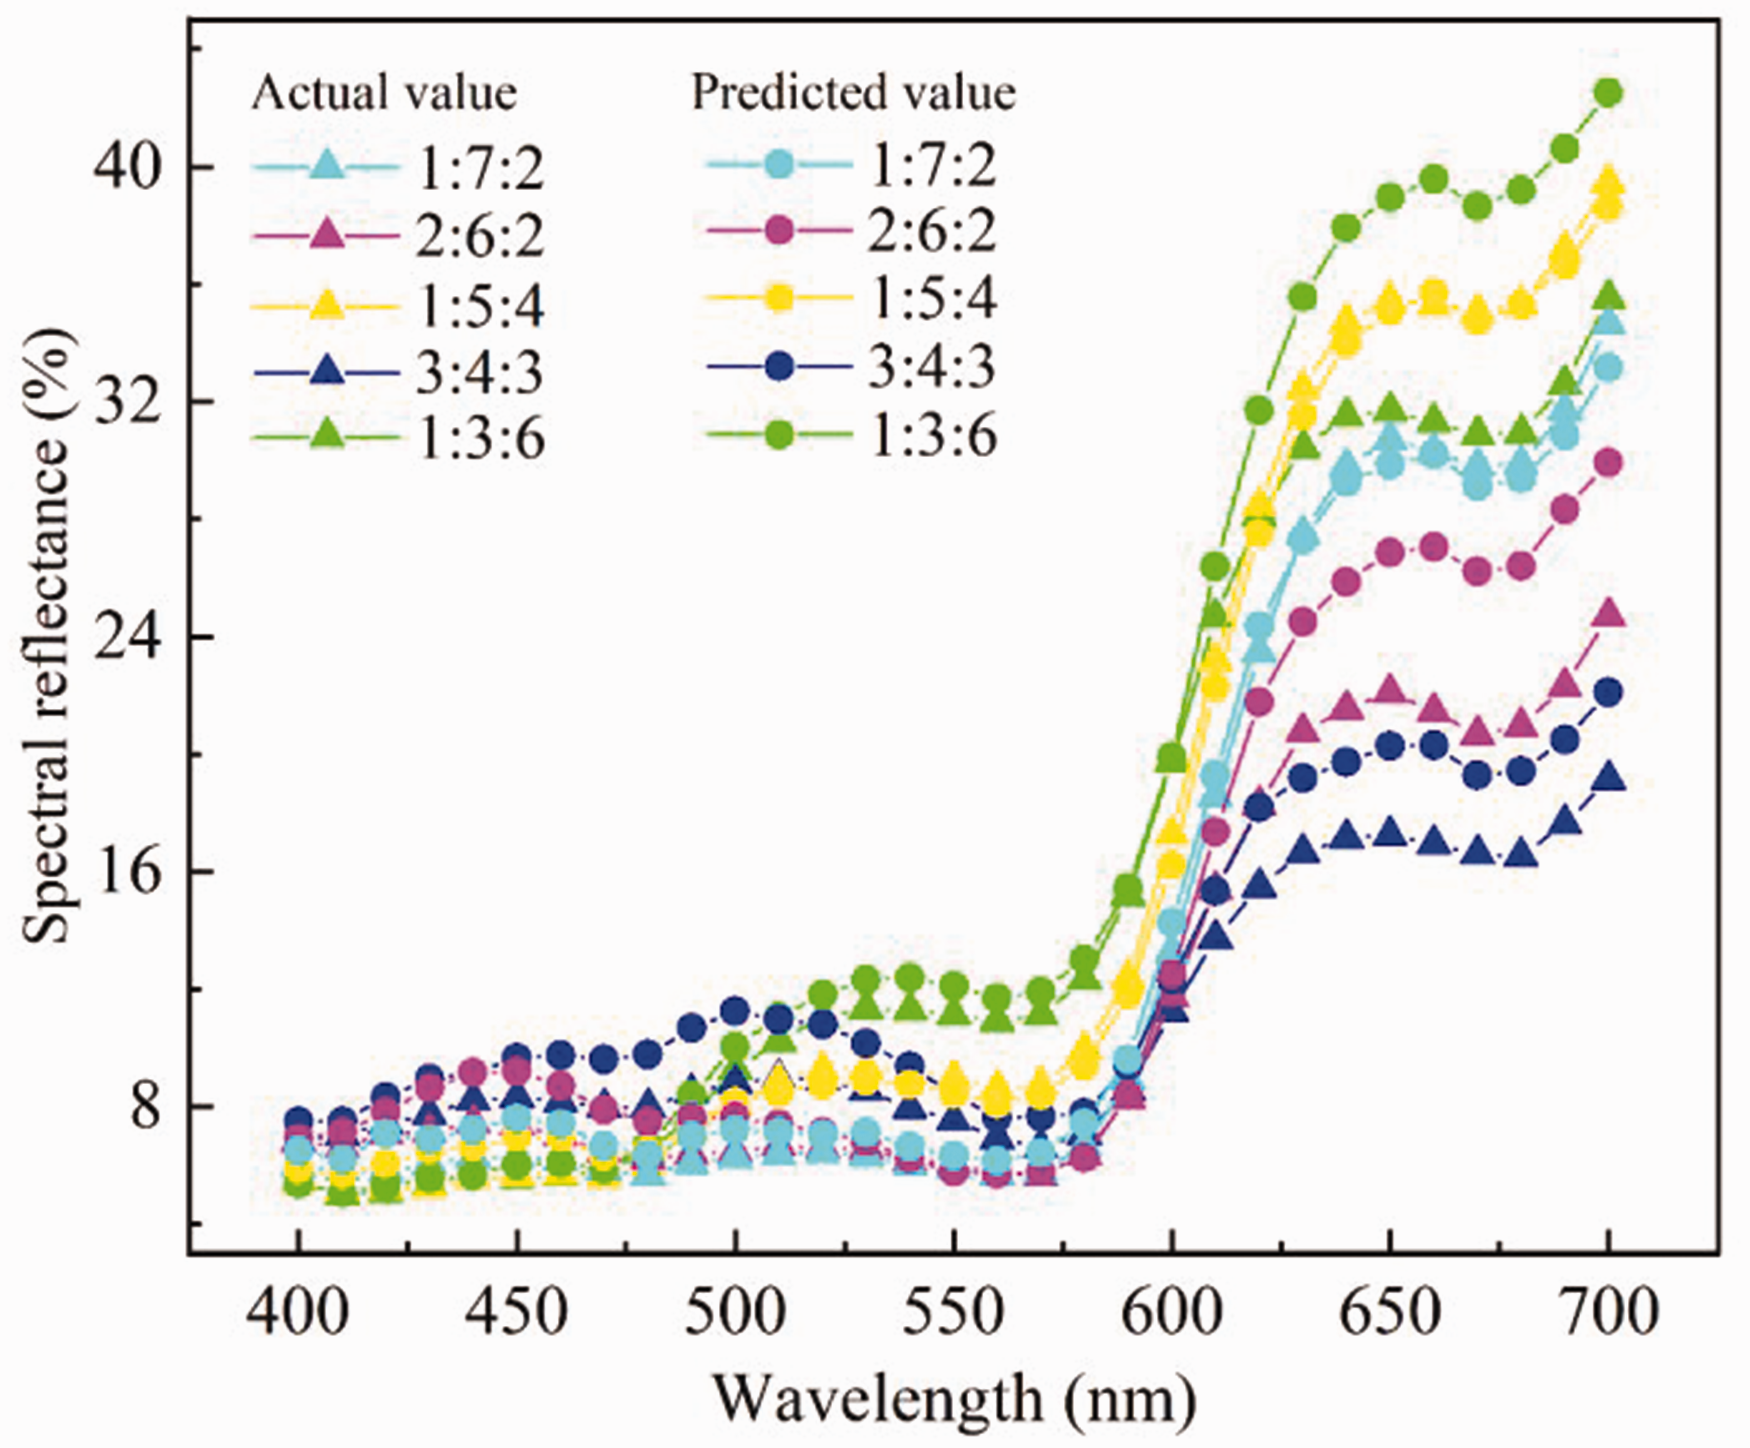
Comparison of spectral reflectance curves of predicted mixing ratios based on five colored fabrics with actual ones.
Comparison of actual and predicted mixing ratios of five colored fabrics
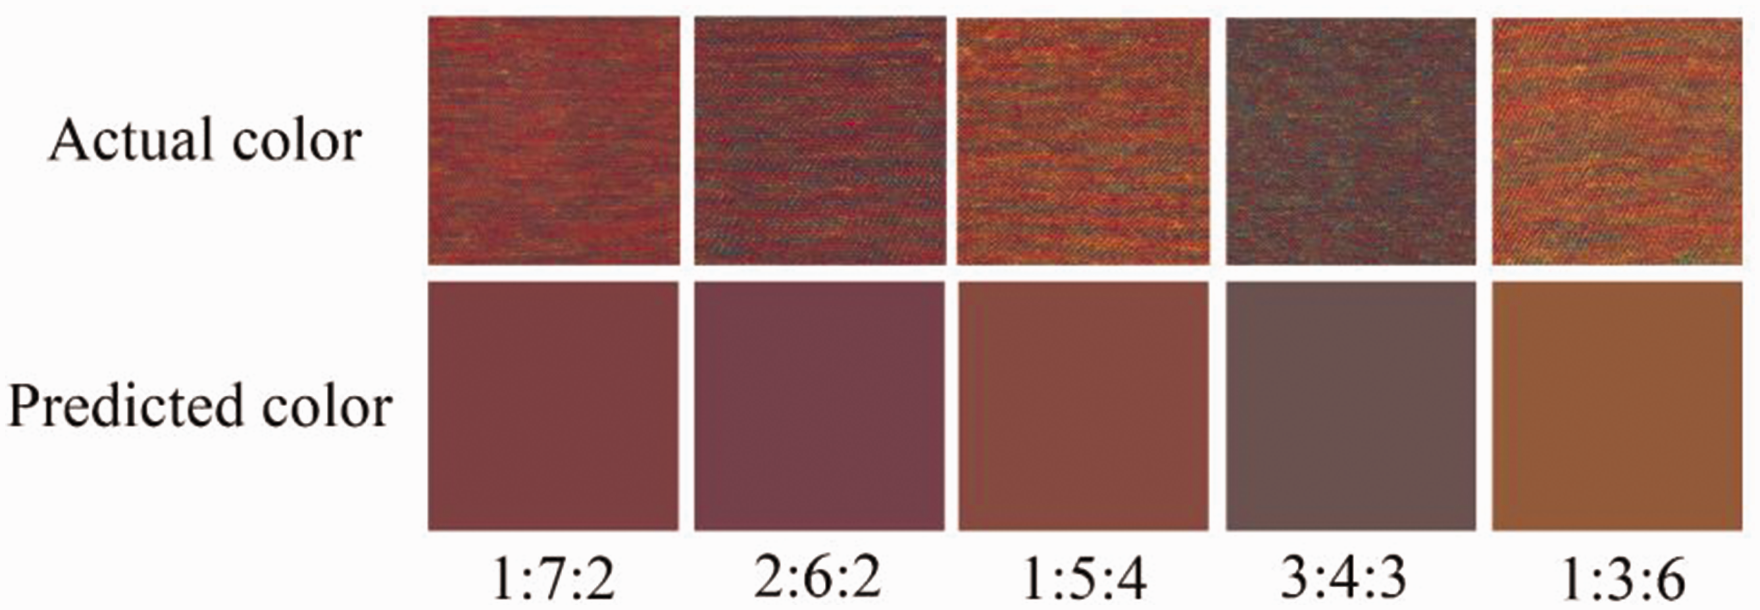
Comparison of the actual images of the five colored fabrics with the predicted colors.
Conclusion
This study investigated the critical issues of color designing, color reproduction, and color reappearing for the spinning of colored yarns. Firstly, according to the ternary coupled mixing algorithm, a full color gamut mixing mode of three primary colored fibers was planned and a full color gamut mixing model including 166 grid points was established. Secondly, 31 grid points were chosen from the full color gamut mixing model as the standard samples, colored yarns, and fabrics were prepared from the mixing ratios of the above samples, a total of 961 reflectance of 31 fabrics at 400–700 nm wavelengths were acquired by spectrophotometer, and the 961 simultaneous Stearns-Noechel formulas were solved by MATLAB software to obtain their reflectance conversion coefficients with the blending ratios and spectral wavelength as independent variables, thereby building a full color gamut prediction model in accordance with the Stearns-Noechel formulas. The approach of predicting the colors of forming yarns from the color values of the three primary colored fibers and their mixing ratios as well as the prediction of the color values of the three primary colored fibers and their mixing ratios from the colors of forming yarns is proposed according to the full color gamut mixing model. In accordance with the experimental results, the resulting reflectance conversion coefficients were mainly concentrated in the range of 0–0.2, which significantly improved the prediction accuracy for samples with varying mixing ratios. The acquired reflectance conversion coefficients were employed in the Stearns-Noechel formula to achieve the forecast of color or mixing ratios for arbitrary samples, where the prediction accuracy was relatively low for the color and high for the mixing ratios. Therefore, the future direction of study is to endeavor to improve the prediction accuracy of mixing ratios of multiple primary colored fibers and properly deal with the inverse calculation issue in color forecasting.
Supplemental Material
sj-pdf-1-trj-10.1177_00405175221132327 - Supplemental material for Research on full color gamut mixing model constructed by CNC spinning and Stearns-Noechel color prediction method
Supplemental material, sj-pdf-1-trj-10.1177_00405175221132327 for Research on full color gamut mixing model constructed by CNC spinning and Stearns-Noechel color prediction method by Xianqiang Sun, Yuan Xue, Yuexing Liu, Guoqing Zhang, Lixia Liu and Liqiang Wang in Textile Research Journal
Footnotes
Declaration of conflicting interests
The author(s) declared no potential conflicts of interest with respect to the research, authorship, and/or publication of this article.
Funding
The author(s) disclosed receipt of the following financial support for the research, authorship, and/or publication of this article: this work was supported by the Fundamental Research Funds for the Central Universities (JUSRP12029 and JUSRP52007A) and the “Jian Bing” and “Ling Yan” Research Fund in Zhejiang Province (2022C01188).
Supplemental material
Supplemental material for this article is available online.
References
Supplementary Material
Please find the following supplemental material available below.
For Open Access articles published under a Creative Commons License, all supplemental material carries the same license as the article it is associated with.
For non-Open Access articles published, all supplemental material carries a non-exclusive license, and permission requests for re-use of supplemental material or any part of supplemental material shall be sent directly to the copyright owner as specified in the copyright notice associated with the article.