



Abstract
This study proposes a method for 3D modeling of weft knitted fabric and simulating its deformation behavior. A geometric model of the fabric was established using a loop-mesh unit, and the surface of the yarn was calculated using a reference frame. The patterns of the fabrics were represented by bitmap images. To simulate the deformation behavior of the fabric, a physical model was built based on a dynamic spline that included stretching and bending of the yarn. To simplify the collisions between continuous yarns, collisions were detected using a discrete sphere-spring model. The Euler-Lagrange theorem was introduced to achieve the energy balance of the system, and a stable shape was obtained by solving the Euler-Lagrange equation explicitly according to the convergence conditions. Rendering and deformation of the model were implemented using a simulator program via C++ and OpenGL. The simulation displayed the 3D appearance of the weft knitted fabric. The deformed shapes of fabrics were accurately predicted by the proposed method.
Weft knitted fabrics are typically produced with a variety of structures or different stitch densities. For fabrics knitted with different densities, their steady shapes after knitting process always deviate from designed shapes. There is no method to simulate the deformed shape of weft knitted fabric constructed with different stitch densities, and the only way to knit a fabric with an ideal shape is to determine the appropriate knitting parameters by repeated knitting, which is time consuming and wastes material. Therefore, a method that can accurately simulate the appearance of a weft knitted fabric and its overall shape after knitting is needed to guide actual production and improve productivity.
In terms of geometric modeling, many loop models have been proposed to simulate the appearance of weft knitted fabrics. For example, Peirce proposed a classical loop model in which the loop was segmented into straight and curved segments. 1 However, this loop model was idealized and limited to a 2D simulation and deviated from a real loop shape. Leaf and Glaskin improved Peirce's loop model by defining a loop as mutually symmetric multiple spatial curves. 2 Kurbak and Kayacan divided a single loop into eight segments and used spatial functions to define the position and direction of each yarn segment. 3 Although these methods improved the reality of the loop model, describing the shape of a loop by a set of functions requires complex calculations, and the shape functions need to be redefined when a loop deforms. Piegl’s use of an non-uniform rational B-splines (NURBS) spline to fit a series of control points to simulate the centerline of yarn, to form a knitted fabric that improved the flexibility and realism of the geometric simulation of a knitted fabric, is widely used. 4
A weft knitted fabric composed of different structures deforms owing to the imbalance of internal forces. Therefore, many scholars have studied the deformation behavior of weft knitted fabrics. Some scholars have simulated the deformation of knitted fabrics using purely geometric methods. Kysove et al. used empirical equations and learning based method to simulate the wrinkle and drape of fabric. These methods can describe the deformation behavior of fabric quickly; however, they do not consider the physical properties of a fabric and lack realism.5,6 Therefore, many scholars have combined geometric models of knitted fabrics with physical properties to study the deformation behavior of knitted fabrics. Abghary used the FEA method to model knitted fabric and studied the tensile deformation of knitted fabrics of various densities in different directions.7,8 Wadekar et al. proposed a loop model based on the finite element method, which minimizes the yarn curvature and length by the energy method to determine its geometry, but it is only suitable for plain loops. 9 These method show great numerical accuracy for the simulation of knitted fabric, but this relies more on the stress-strain relationship between loops rather than the overall deformation of a knitted fabric. The classical mass-spring model proposed by Provot associates the geometric shape of a loop with a rectangular mesh. 10 The vertices of the rectangle mesh represent the mass points that are connected by springs to simulate the force between loops. Many scholars have extended the mass-spring model. Mozafary et al. proposed a new method based on a mass-spring model to study the deformation behavior of knitted fabric and compared the 3D model with a real sample; 11 it had high accuracy in the simulation of the draping and crimping of knitted fabric. Sha et al. proposed a cuboid particle system to study the deformation caused by fancy stitches.12,13 Peng et al. simplified the mass-spring model and studied the deformation of knitted fabrics. 14 These methods based on the mass-spring model can rapidly simulate the deformation behavior of knitted fabric but pay more attention to the local deformation caused by the combination of different structures rather than the overall deformation of knitted fabrics. Moreover, the discrete mass-spring model deviates significantly from the actual mass distribution of a stitch and does not conform to the physical properties of a knitted fabric.
Therefore, some scholars have modeled knitted fabrics using a dynamic spline, treating the yarn as a continuous elastic material deformed in the elastic range and simulating the deformation behavior of a knitted fabric at the yarn level. Kaldor et al. divided the loop into eight segments, each of which was treated as an inextensible B-spline tube. This method can be used to simulate the physical properties of yarn. 15 Wu realized the relaxation of complex knitted fabrics using Kaldor et al.’s method. 16 They used a polygonal topology to mesh the fabric and achieve the simulation at the yarn level. Cirio et al. simplified Kaldor et al.’s model by discretizing loops into polygons and representing the continuous contact between loops with intersecting nodes to improve the simulation efficiency. 17 Leaf developed an interactive software to simulate the deformation behavior of fancy stitches. 18 All these studies were able to model knitted fabric at the yarn level and achieve deformation simulation effectively. However, there has been no research on predicting the dimensions and contours of a knitted fabric with different densities, and the accuracy of the simulation results cannot be evaluated quantitatively.
In view of the above, this article simplifies the yarn level model and proposes a method that can predict the dimension and contour of a knitted fabric structured with different densities precisely. In addition, a method based on image processing is proposed to evaluated the simulation precision quantitatively. Here, the geometric model of a knitted fabric is established based on mesh-loop model and cubic spline. A physical model of yarn was built based on a dynamic spline. Further, real samples were knitted and compared with deformed simulations, and the simulation precision is analyzed quantitatively for contour and dimension.
Geometric model
We used a cubic Catmull-Rom spline curve to represent the geometric centerline of a yarn by fitting a series of control points, and the shape of the yarn was adjustable by moving the control points. We regarded the knitted fabric as a repetition of a unit loop, and the coordinates of the control points that determined the shape of the geometric centerline of the yarn were calculated using the mesh-loop model. To construct the 3D surface of the yarn based on the centerline, we treated the yarn cross-section as a circle with a diameter equal to the yarn diameter and swept the cross-section along the yarn geometric centerline.
Geometric centerline of yarn
Considering the complexity of calculation and the flexibility of curve, we used a cubic spline to fit the continuous centerline of yarn. Compared with the NURBS spline, the Catmull-Rom (C-R) spline is simpler for fitting the control points. All control points were directly fitted by basic function on the curve. Any spline segment between two adjacent control points is described by four control points. The expression of the geometric center line of any yarn segment at a certain time step
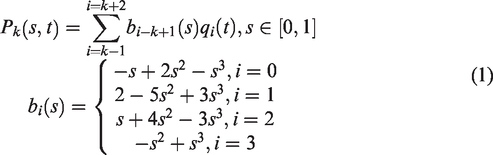
Loop model
Weft knitted fabric is composed of a repetition of a basic loop. We treated the plain loop as the basic unit of the weft knitted fabric. We calculated the control points of the loop using the mesh-loop model and fitted all the control points using a cubic spline to get the 3D centerline of the yarn. The real fabric was abstracted by the mesh-loop model as shown in Figure 1.
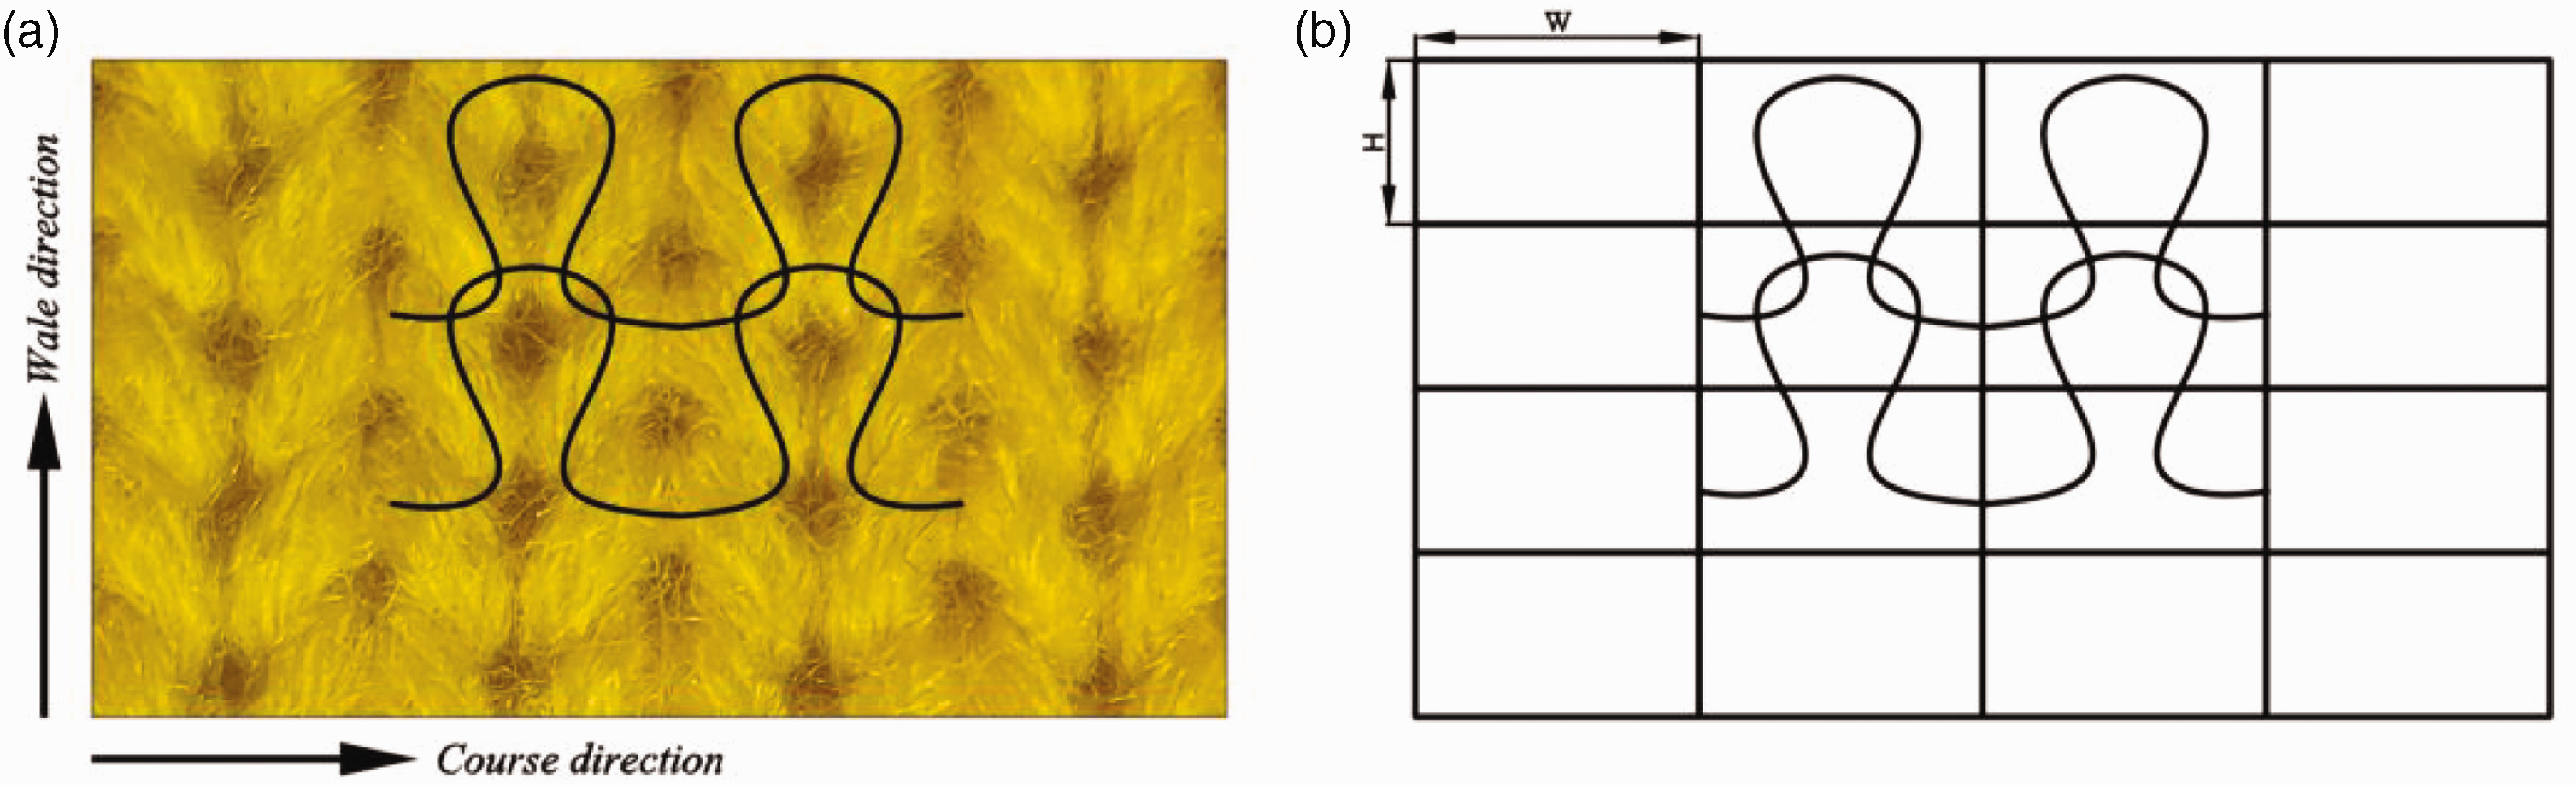
Fabric meshing: (a) real sample and (b) mesh model of fabric.
According to the knitting procedure, a plain weft knitted fabric is composed of cast-on, plain, and cast-off loops. We used nine control points to describe the shape of the plain loop, six control points for the cast-off loop, and seven control points for the cast-on loop, as shown in Figure 2. The mesh-loop model was built based on the loop model proposed by Groller and Rau, 19 in which the coordinates of the control points are proportional to the vertices, and the width and height of the rectangle are equal to the loop width and loop height, respectively.

Mesh-loop model: (a) plain loop, (b) cast-on loop, and (c) cast-off loop.
The weight relationship between the control points and mesh vertices was calculated using the mean value method as listed in Appendix 1.
3D surface of yarn
The geometric centerline of yarn is a spatial curve that takes the arc length s as its parameter. The Frenet frame can represent the path of the centerline to calculate the 3D surface of a yarn by section sweeping. We subdivided the geometric centerline of the yarn into segments by parametric nodes and used the Frenet frame to calculate the yarn section at each node to represent the sweeping process.
The Frenet frame is a local right-hand coordinate system composed of three basic unit vectors T, B, and N. T is the tangent vector of the curve, and B and N are the principal normal vector and binormal vector, respectively, which are mutually perpendicular to each other.
We subdivided each centerline into n segments and each circular section uniformly into m segments. The value of the parametric points along the curve can then be calculated as

Suppose the radius r of the cross-section is same as the yarn. The vertices of the cross-section at each parametric points were calculated as

We rendered the vertices with OpenGL to generate a continuous 3D model of the loops and fabric, and the Frenet frame and cross-section of the yarn are shown in Figure 3.

(a) Reference frame on geometric centerline and (b) cross-section of yarn.
Physical model based on dynamic spline
The dynamic spline, which can describe the physical properties of a material, is suitable for the simulation of yarn and the deformation behavior of weft knitted fabric at the yarn level. Deformation of yarn occurs much more in stretching and bending, while torsion reduces the dimensions of fabrics. The physical model is shown in Figure 4. In this article, we consider the stretching, bending, and damping of yarn to deduce its dynamic equation.
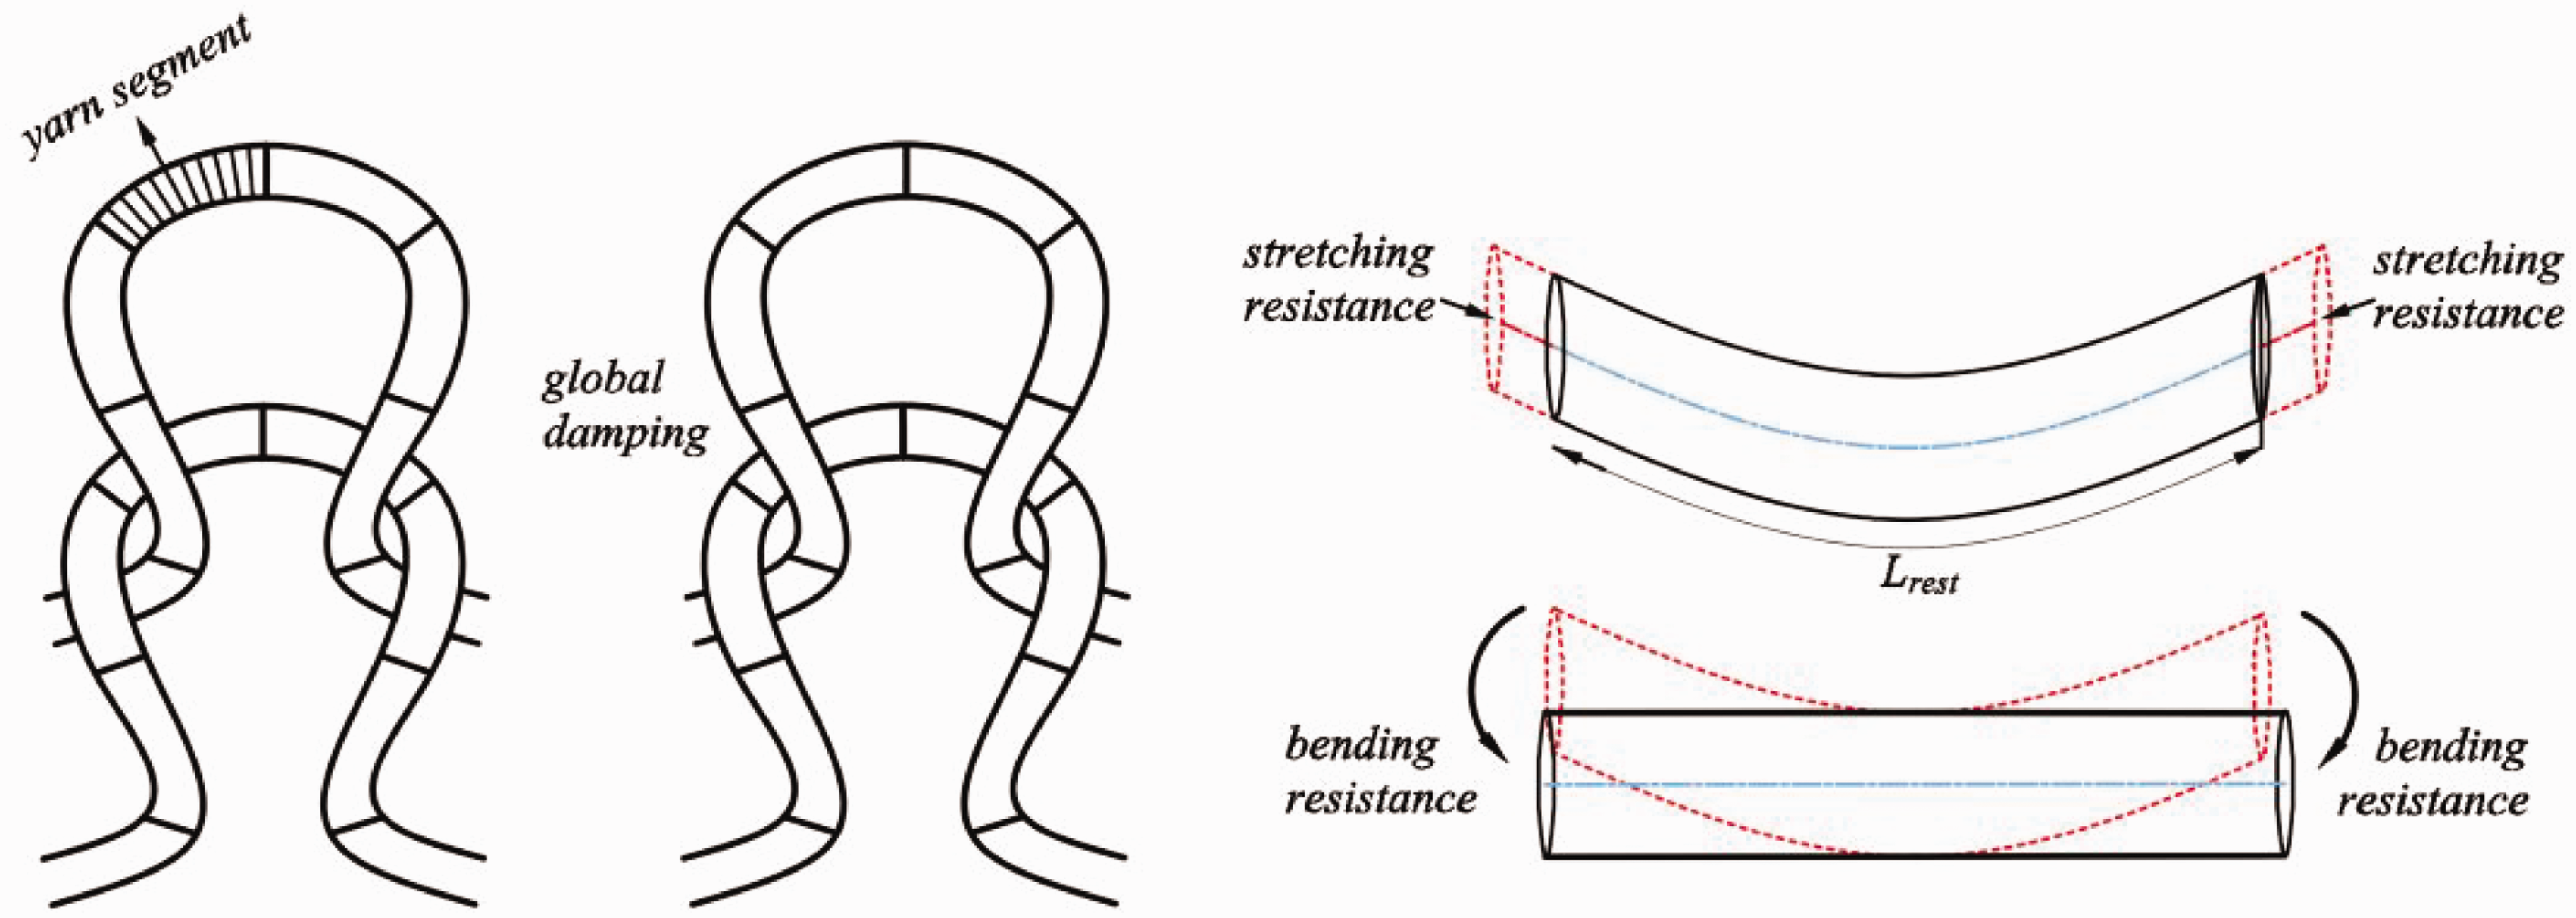
Physical model of yarn.
Before we built the physical model, we assumed the following: (a) a yarn segment is a cylindrical elastic rod with a constant cross-section, and (b) all the deformation behaviors of yarn are in the elastic domain.
Dynamic equations
Because of the continuance and low rigidity of yarn, it is difficult to represent a yarn segment as a mass point. Therefore, it is more suitable to treat it as a whole and model it using the energy method. Therefore, the analytical mechanics method was used to model the dynamics of the yarn. The dynamic equation of the control point


The dynamic equation of yarn can be transformed into a differential equation as

Mass distribution
We assumed that the mass of the yarn was distributed uniformly over its length. For an arbitrary yarn segment, the mass is proportional to its length
The length–mass density function is defined as

Stretching energy
When the yarn is stretched in the elastic domain, the internal tensile energy resists tensile deformation along the centerline. We extended and simplified the inextensible model proposed by Kaldor et al. such that the length of the yarn could be stretched and reversed in the elastic region. For a yarn segment with rest length

The generalized force exerted on corresponding control point

Bending energy
Similar to the stretching of yarn, internal strain energy will resist the bending of yarn and exert forces that attempt to straighten the yarn. The bending energy is defined by the unsigned curvature of the geometric centerline as

The generalized force exerted on relative control point

Damping
Damping was used to dissipate the motion of the yarn and to guarantee that the system converged to a steady state. In our simulation, global damping was uniformly defined along the length of the yarn. For a small part of ds around parametric point s, the active damping force is

The generalized force exerted on relative control point

Simulation implementation
We studied the deformation behavior of the fabric caused by a combination of structures at different densities. For knitted fabrics with various densities, the forces between the inner loops were not balanced. The overall deformation of the fabric was caused by the nesting and pulling of the loops. We built the initial configuration of the simulation by mapping the bitmap (BMP) image into a simulation model in which the fabric was in a uniform but unsteady state. The forces were solved by the dynamic equation of the yarn to move the control points and led to the deformation of the fabric model. To guarantee that the yarns interacted with each other correctly, we performed collision detection on the yarns and simulated the collision response. A set of convergence conditions was proposed to check the stability of the simulation. For the analysis, we compared the contour similarity between the real sample and the simulation results to verify our method. Figure 5 illustrates the fabric deformation simulation process.
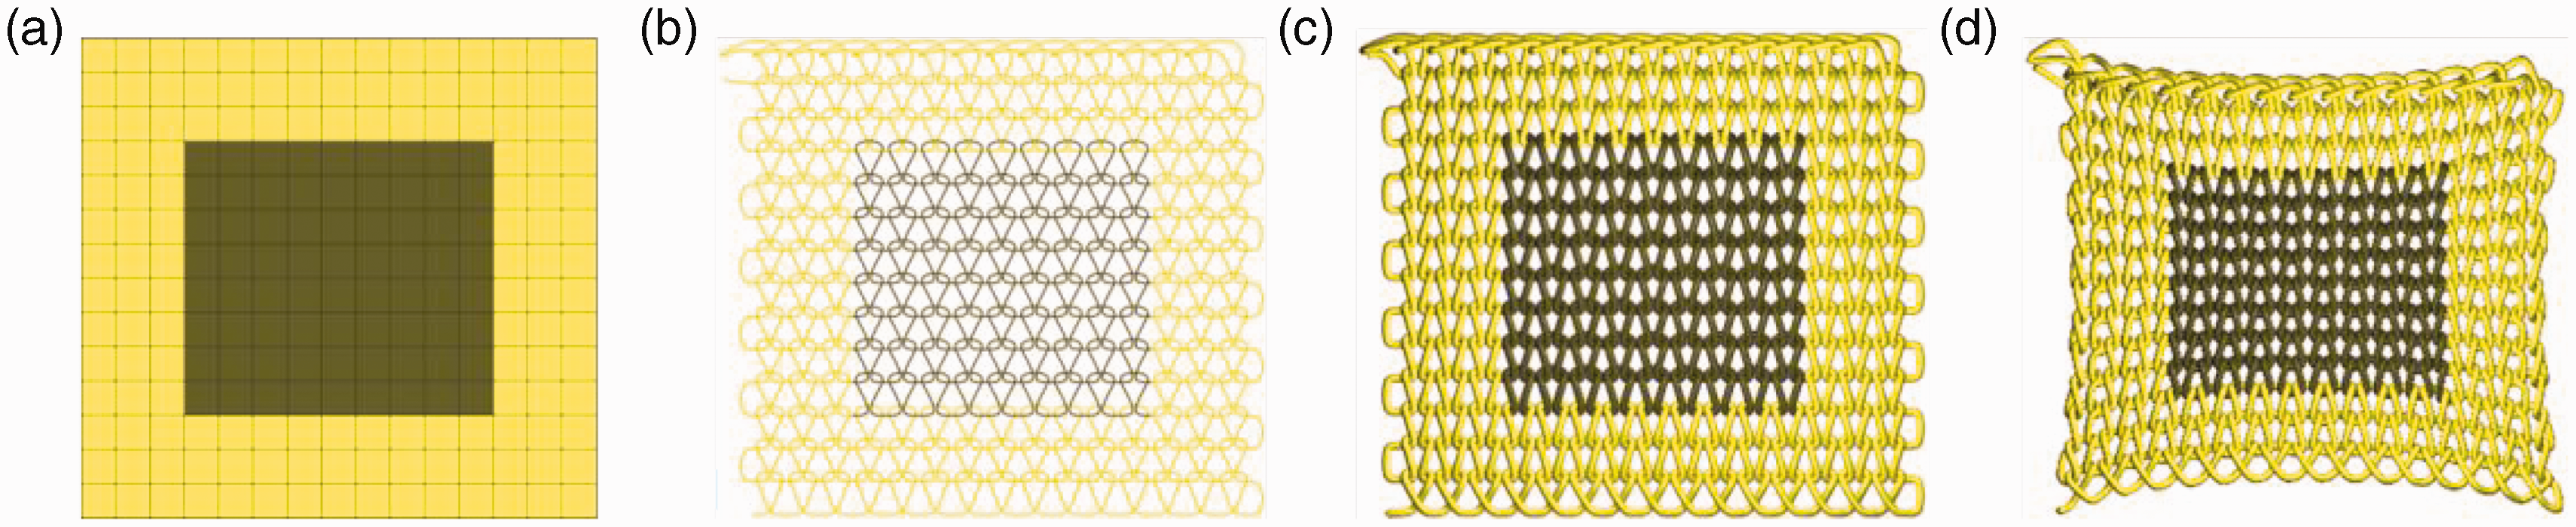
Simulation process: (a) density distribution of fabric, (b) geometric centerline of fabric, (c) undeformed simulation of fabric, and (d) deformed simulation of fabric.
Initializing configuration
We set the undeformed simulation of fabric as the initial state for deformation simulation. We set the initial state of the simulation model to be uniform but unstable; before the simulation started, the stitches of different structures had the same length, and the corresponding rest of the stitch lengths were set according to the density. The driving power for deformation was generated by the stretching energy according to Equation (9) when the simulation began.
To build the initial configuration for simulation, we used a BMP image to represent the distribution of the densities of the fabric and map it into the initial simulation model. Each pixel in a BMP image was a grid of the same size. We mapped each grid into a mesh-loop unit, representing the uniform state before the deformation simulation. And colors of the gird indicate the different densities of the structure, where inner stitches have different rest length. As shown in Figure 5(a), the brown gird and yellow grid in the BMP image represent the structures with different densities, which have the same stitch length at initial state but different rest length. And Figure 5(b) shows the undeformed simulation mapped by the BMP image.
Interaction
Interaction between yarns was inevitable during the simulation and ensured that the yarns moved appropriately without pulling through each other. To avoid useless collision detection for performance improvement, we handled the collision in two steps: preliminary detection based on an oriented bounding box, and geometric detection based on a discrete sphere-spring model.
In the first stage, we used oriented bounding boxes to obtain contact set C that contained pairs of yarn segments that might interact with each other. In the second stage, we approximated the continuous yarn with a chain of spheres. 21 These spheres had the same radius as the yarn and were distributed uniformly along the center curve. Springs were added between the centers of the spheres to exert a contact force. The interactions between the yarn segments were considered to be the result of collisions between their sphere pairs. The collision detection model is shown in Figure 6.
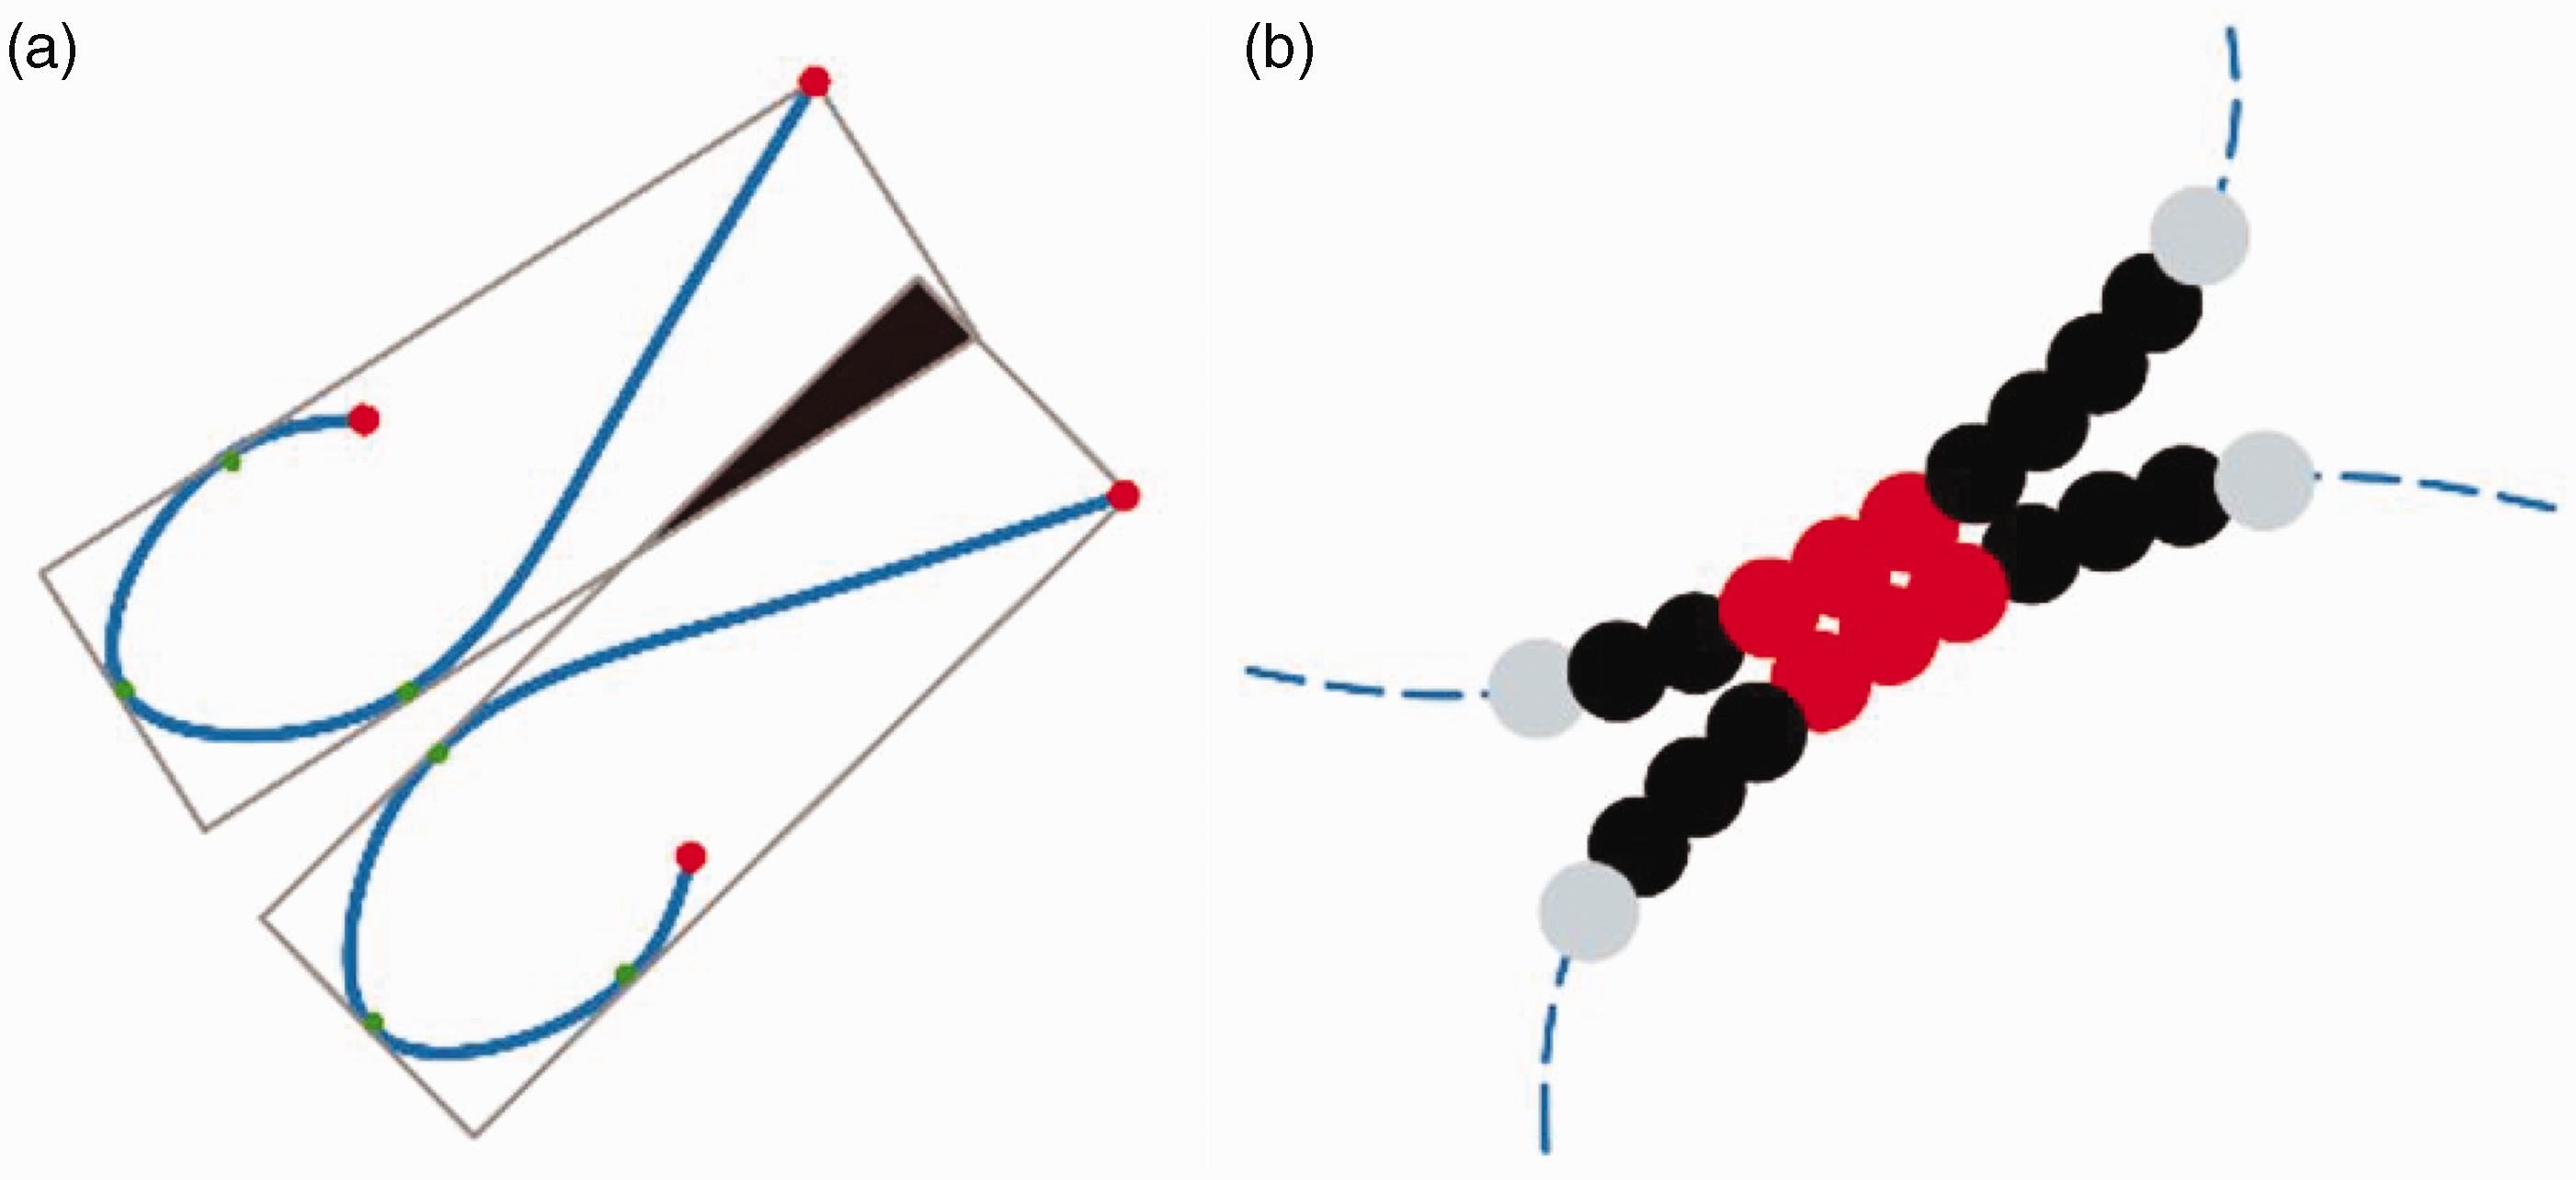
Collision detection model: (a) oriented bounding box detection and (b) discrete sphere collision detection.
For two yarn segments,

For our simulation, we used 11 spheres to discretize the continuous yarn. The collision force exerts on relative control points was calculated as follow:


Convergence
Instead of checking the stability of each structure in the fabric, we used a convergence term for the entire fabric based on the internal energy. The convergence condition was defined as


Stepping
The dynamic equation of the system was deduced from the Euler-Lagrange equation and transformed into a differential equation as shown in Equation (6). We solved the differential algebraic equation explicitly at the midpoint of the time step
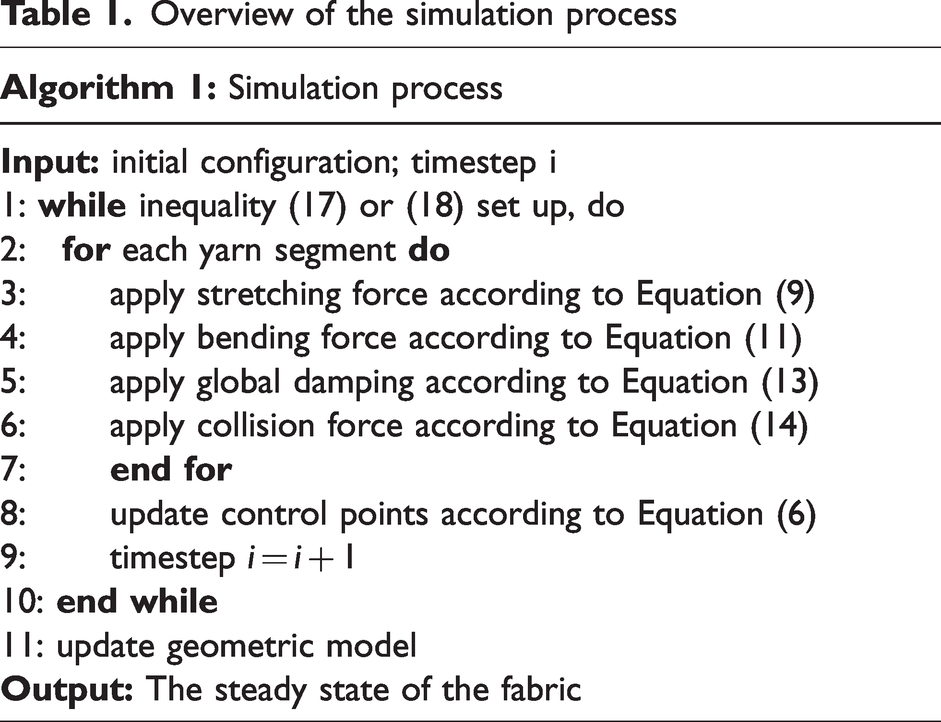
In practice, the time step must be sufficiently small because the equation is solved explicitly. The integrals for the mass matrix and stretching, bending, and damping energies were evaluated using Simpson’s quadrature in parameter space with fixed quadrature points per spline segment. Table 1 presents an overview of the steps used in our simulation.
Overview of the simulation process
Results and discussion
We built a 3D model for two types of weft knitted fabrics and simulated their deformation behavior according to our proposed method. The simulation results were compared to real samples for similarity analysis. The simulation was implemented on a computer with an AMD Ryzen 5600U central processing unit (specifications: 2.30 GHz and 16 GB RAM). The 3D simulation of fabrics was based on Microsoft Visual Studio 2017 IDE and the OpenGL graphics library.
Simulation parameters
We designed two types of weft knitted fabrics structured with different stitch densities and used BMP images to represent their density distribution as the input of the simulation, the parameters of the weft knitted fabrics are listed in Table 2.
Parameters of knitted fabric
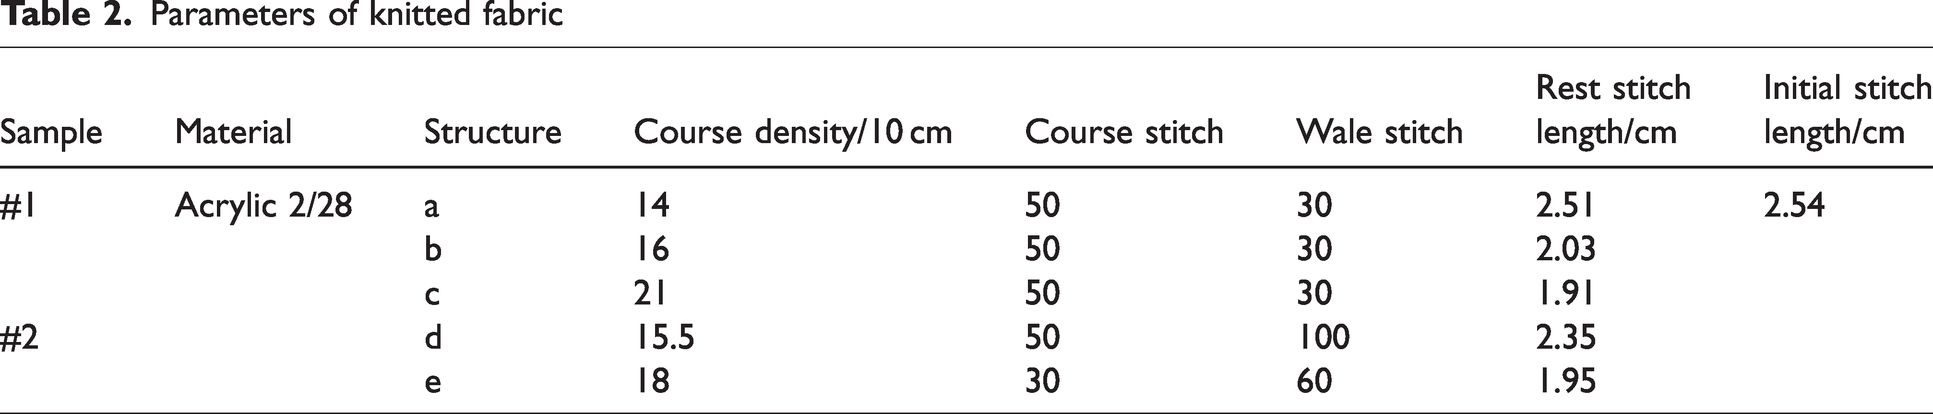
Figure 7(a) shows the density distribution of the fabric structured with three different stitch densities, where the stitch density of Structures a, b, and c increased in turn. Figure 7(b) shows the density distribution of the fabric structured with two different stitch densities, where the density of internal Structure e was greater than that of external Structure d.

Fabric density distribution.
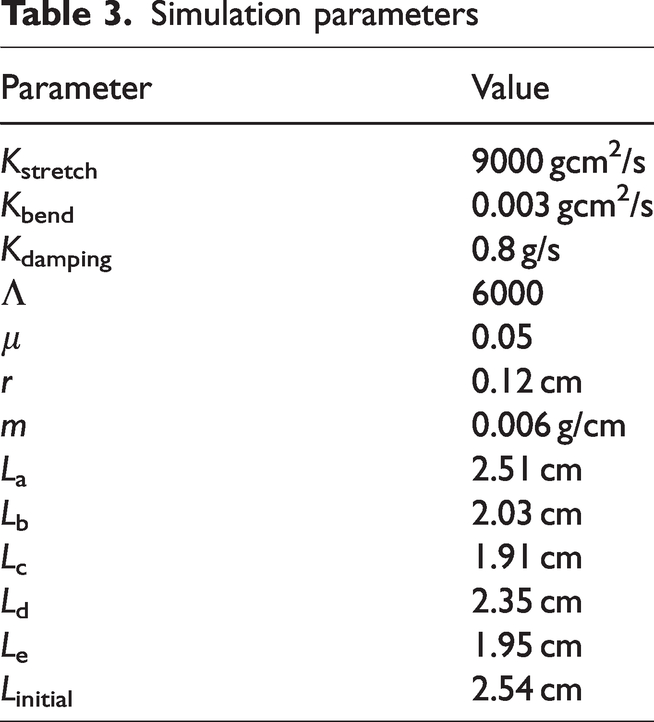
We set the remaining stitch lengths of each structure through production experience, and the parameters involved in the simulation are listed in Table 3, where La–Le refer to the remaining stitch lengths of structures a–e, and Linitial
Simulation parameters
Simulation results
Figure 8 shows the simulations of the deformation behavior of the two fabrics and their comparisons with real samples. Figure 8(a) shows the undeformed simulation of the fabric structured with three different densities. Figure 8(b) shows the deformed simulation of the fabric structured with three different densities. As shown, the undeformed simulations of weft knitted fabrics were in a uniform state at the beginning; that is, all plain stitches were the same length.
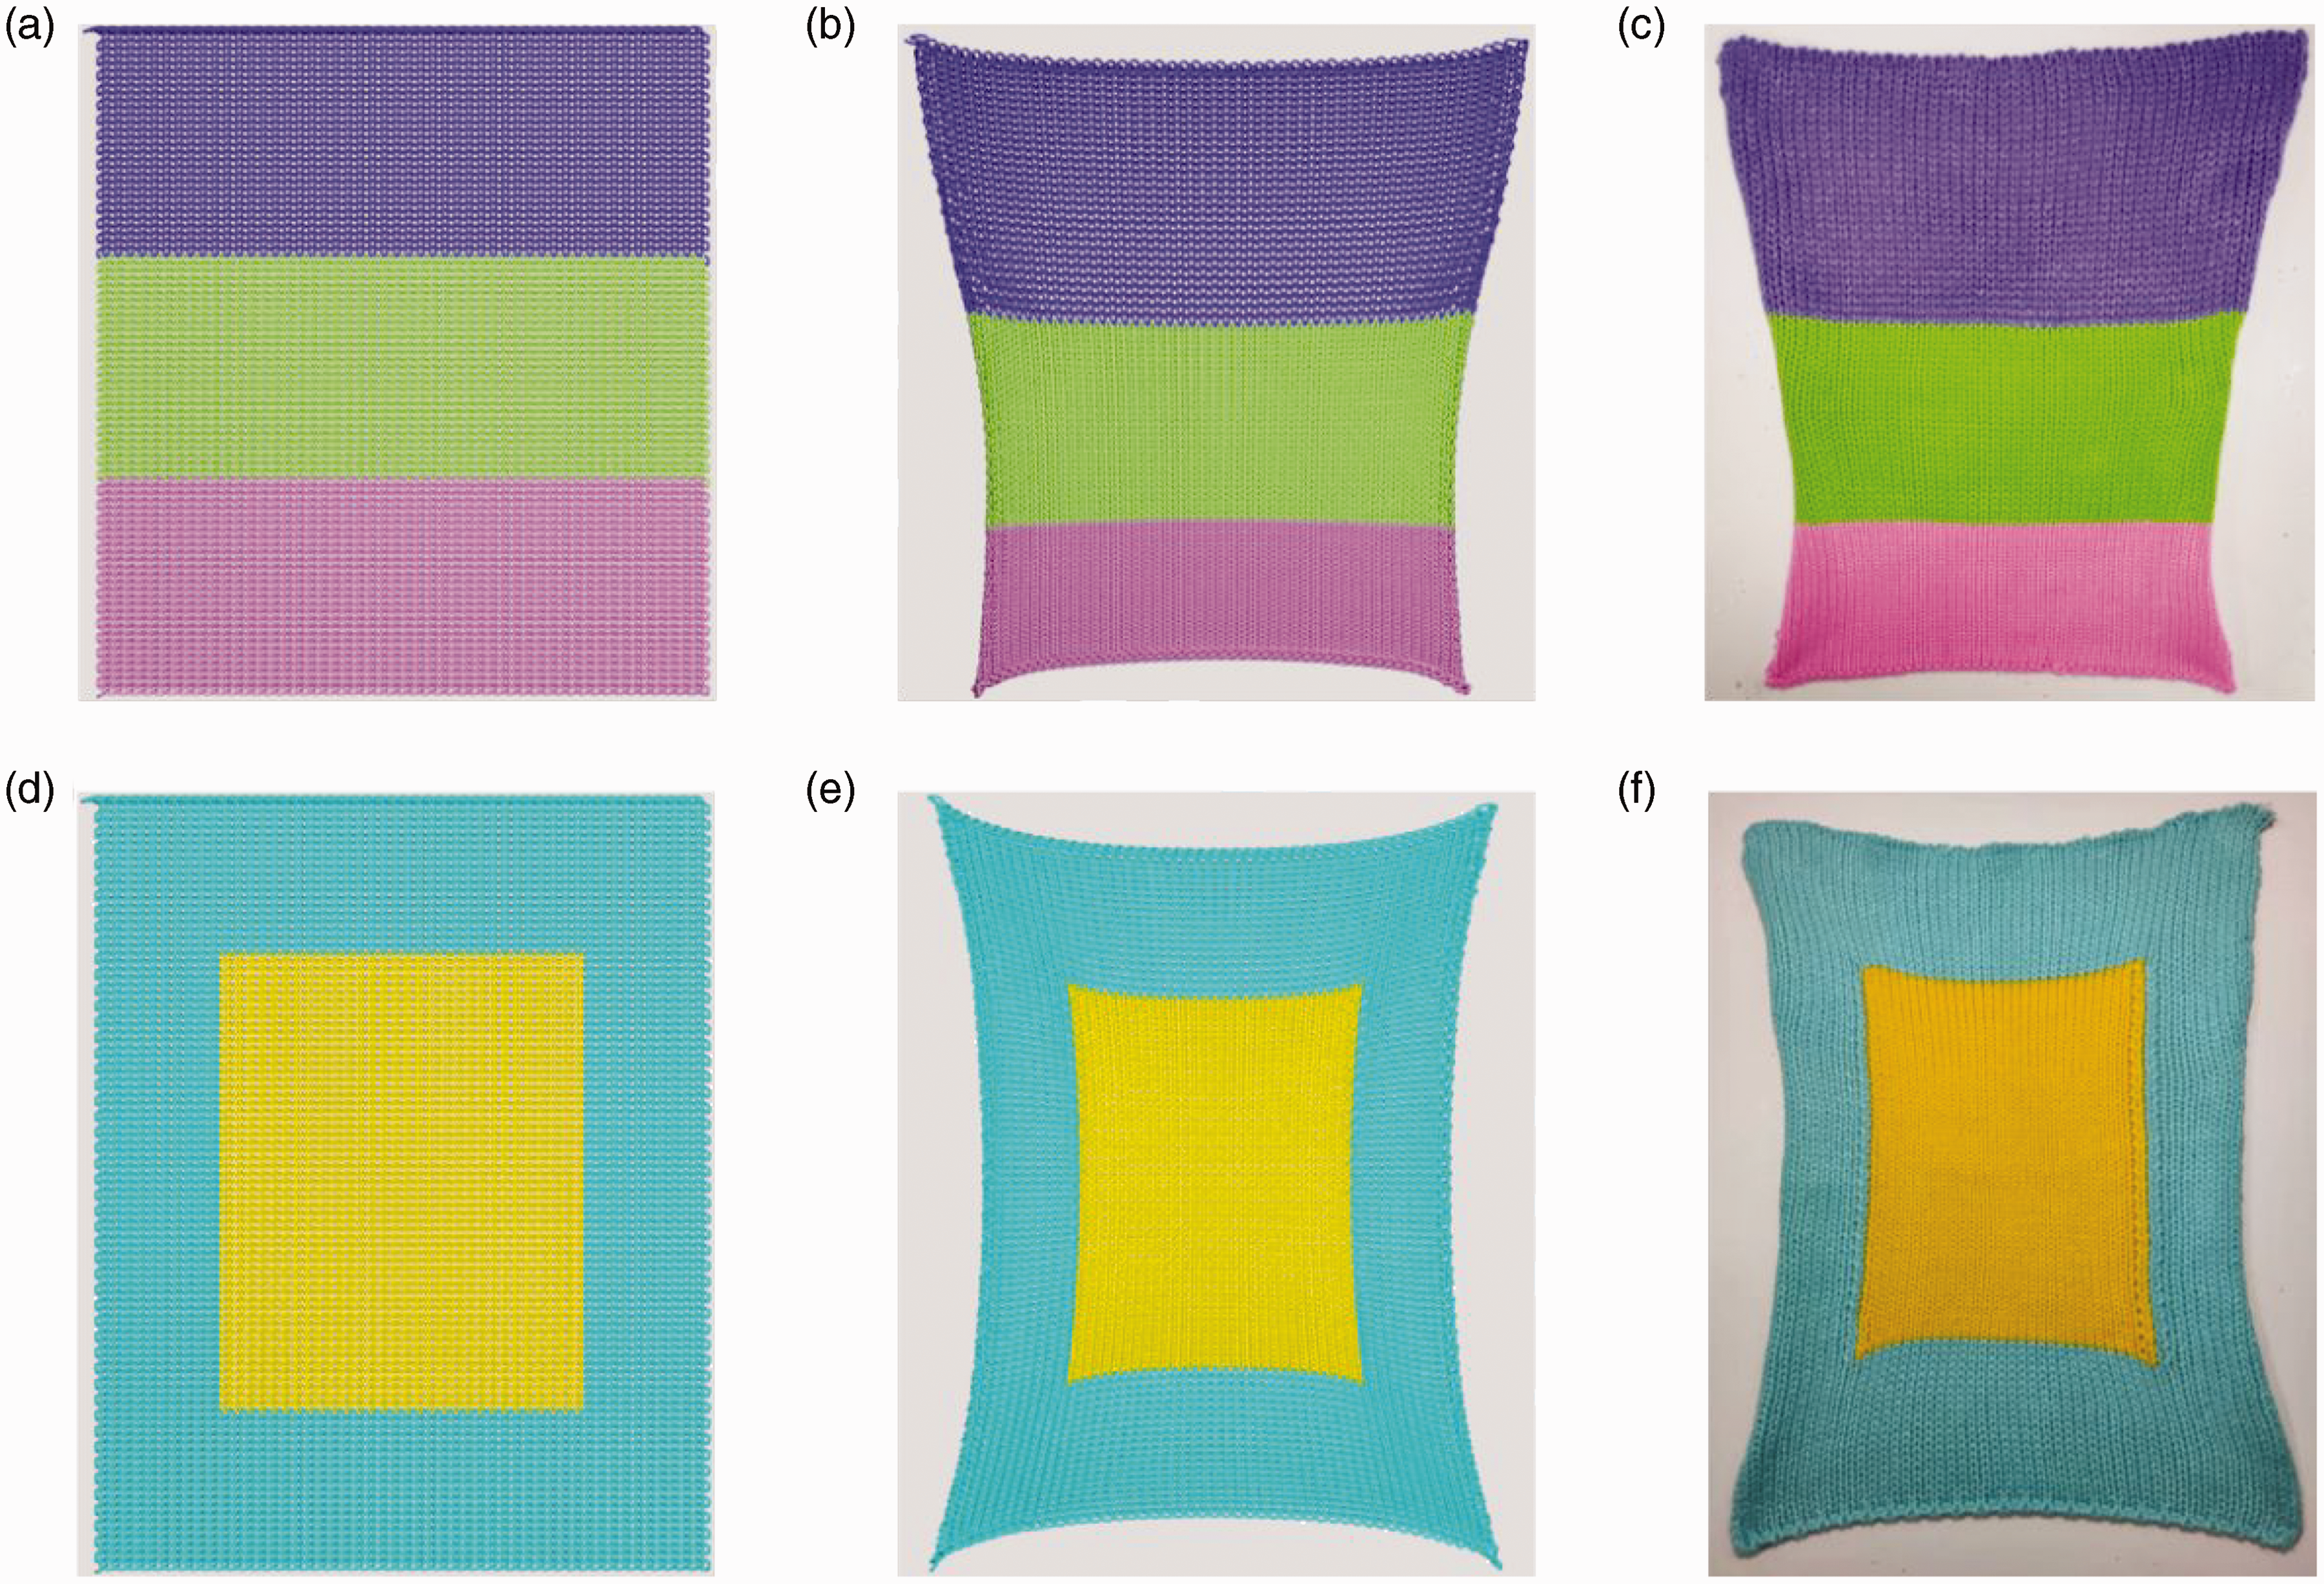
Comparisons between simulations and real samples: (a) Sample 1 undeformed simulation; (b) Sample 1 deformed simulation; (c) real fabric composed of three different densities; (d) Sample 2 undeformed simulation; (e) Sample 2 deformed simulation; and (f) real fabric composed of two different densities.
The inner loops of weft knitted fabric, which are composed of various structures or different stitch densities, do not maintain the ideal shape but deform to some extent. The deformation of the inner loops leads to an overall deformation of the weft knitted fabric. Figure 8(b) and (c) compare the deformed simulation of Sample 1 and the knitted fabric sample. The inner loops of different densities do not maintain the ideal shape, the greater the density is, the smaller the rest length of stitch, and the greater the stretching energy is according to equation (8). As the density of Sample 1 increased from top to bottom, the internal stretching energy increased gradually, resulting in the unregular deformation of the fabric. The widths of the knitted fabric sample and simulation model decreased gradually, and the upper and lower edges of both shrank significantly. Figure 8(e) and (f) compare the deformed simulation of Sample 2 and the knitted fabric sample. For Sample 2, its inner density is greater than the outer density, and the inner stretching energy is greater than the outer. The outer part was pulled by the inner part owing to the variation in density and led to a change in the width. The shapes of each structural simulation model were very close to the actual samples, and both models performed well in the edge-curling simulation.
Analysis of similarity
To verify the similarity between the simulations and real samples, we measured the width of each real sample per 10 wale stitches and compared them to the deformed simulations. A comparison of the dimensions is shown in Figure 9. For both samples, the dimension of the deformed simulation was close to that of the real sample, but there was a deviation of 1 cm at the location where fabrics were cast off.
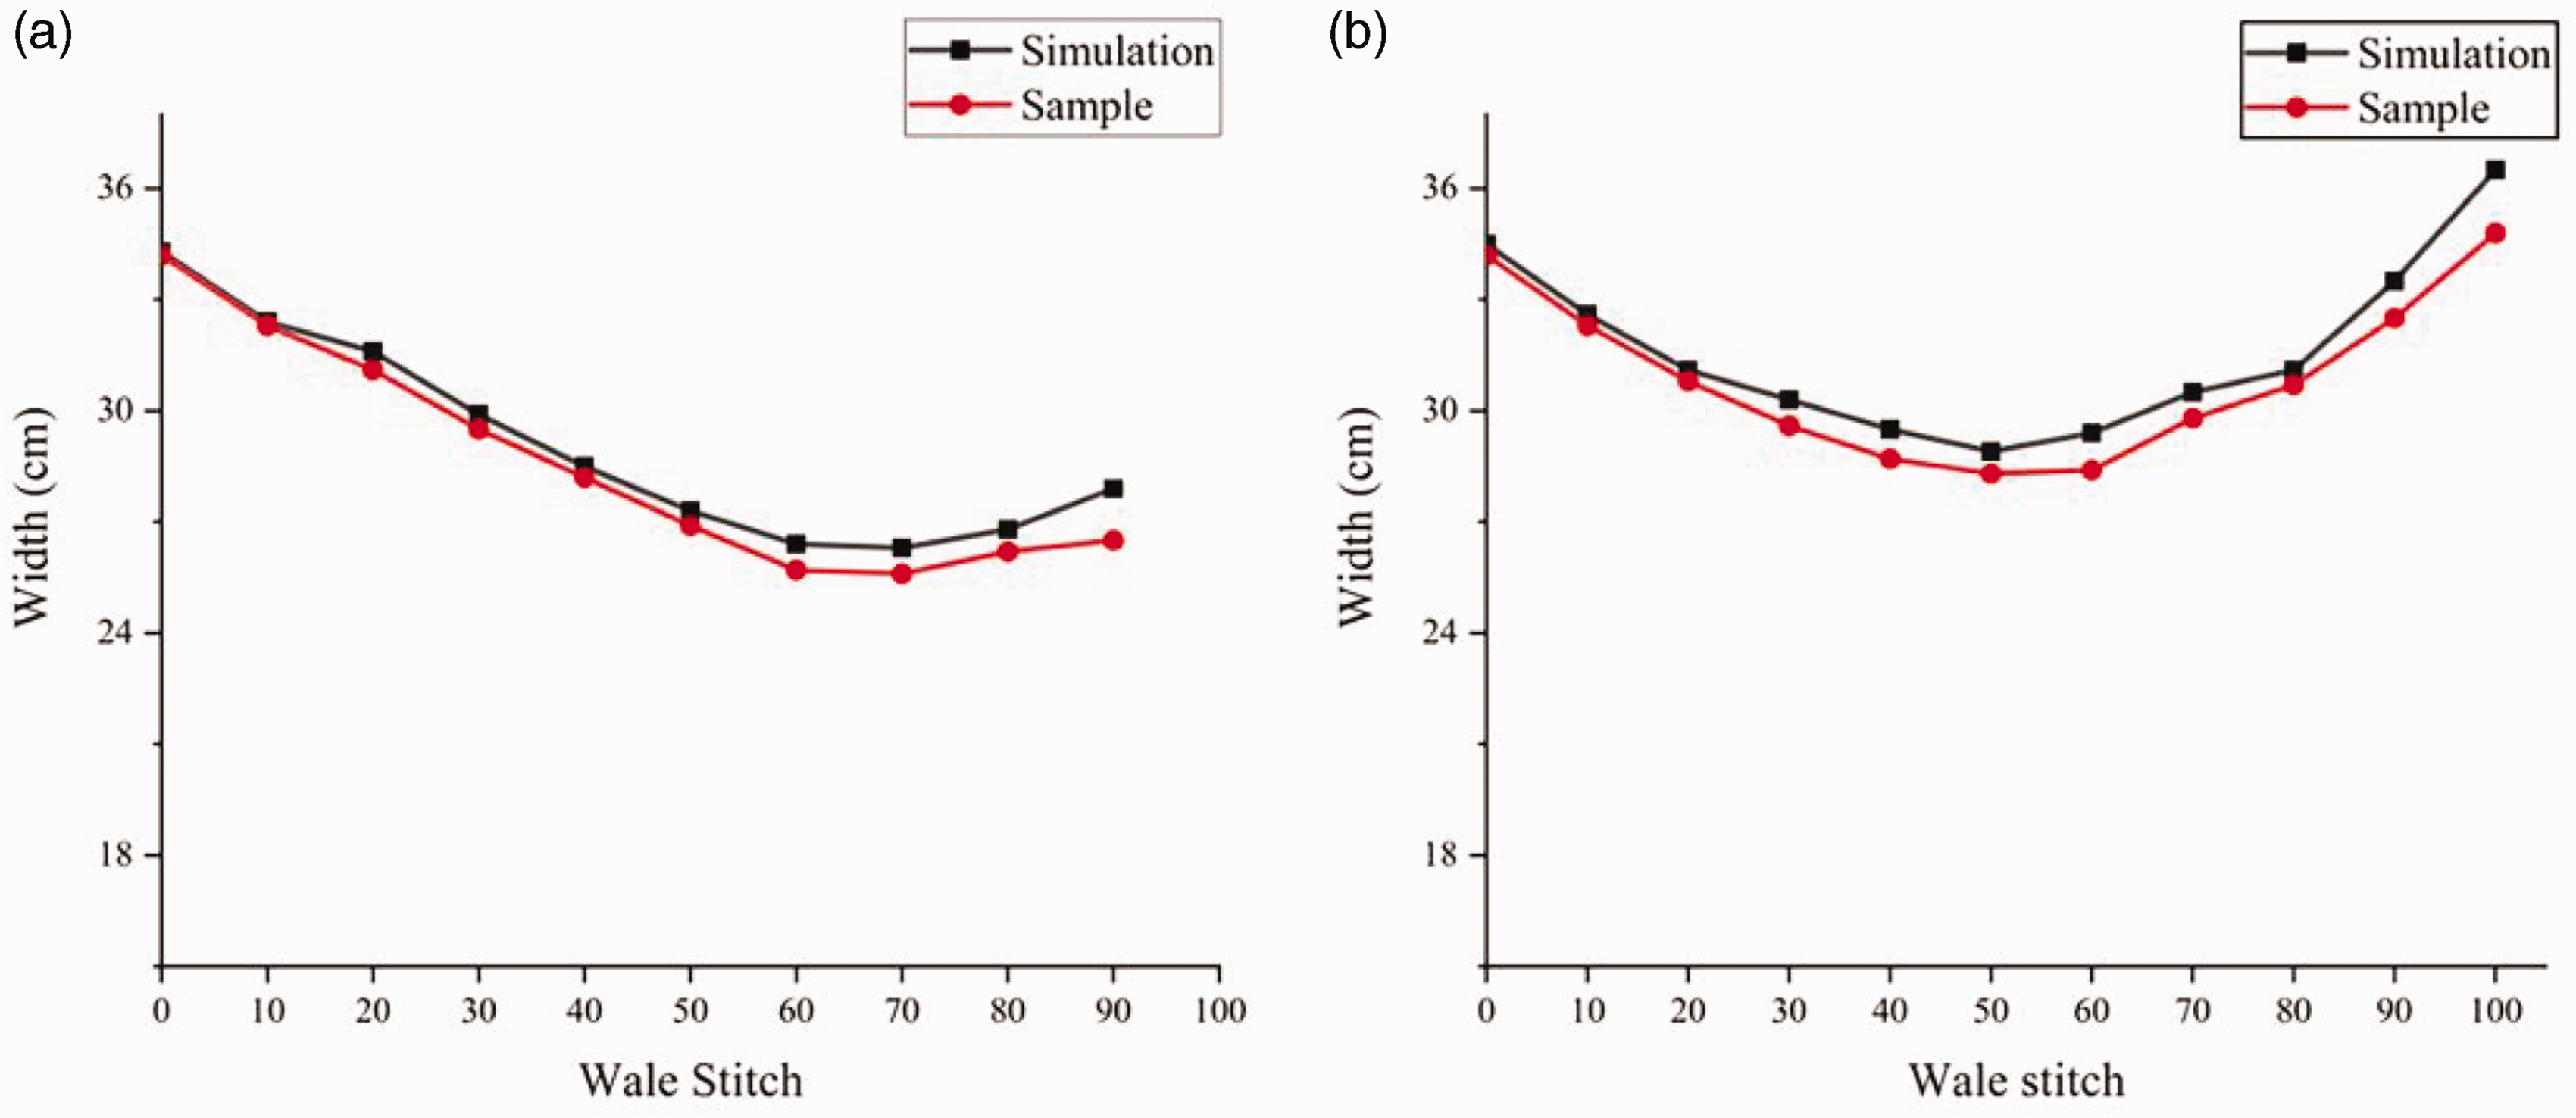
Dimension comparison between real samples and deformed simulations: (a) width comparison between Sample 1 and its deformed simulation and (b) width comparison between Sample 2 and its deformed simulation.
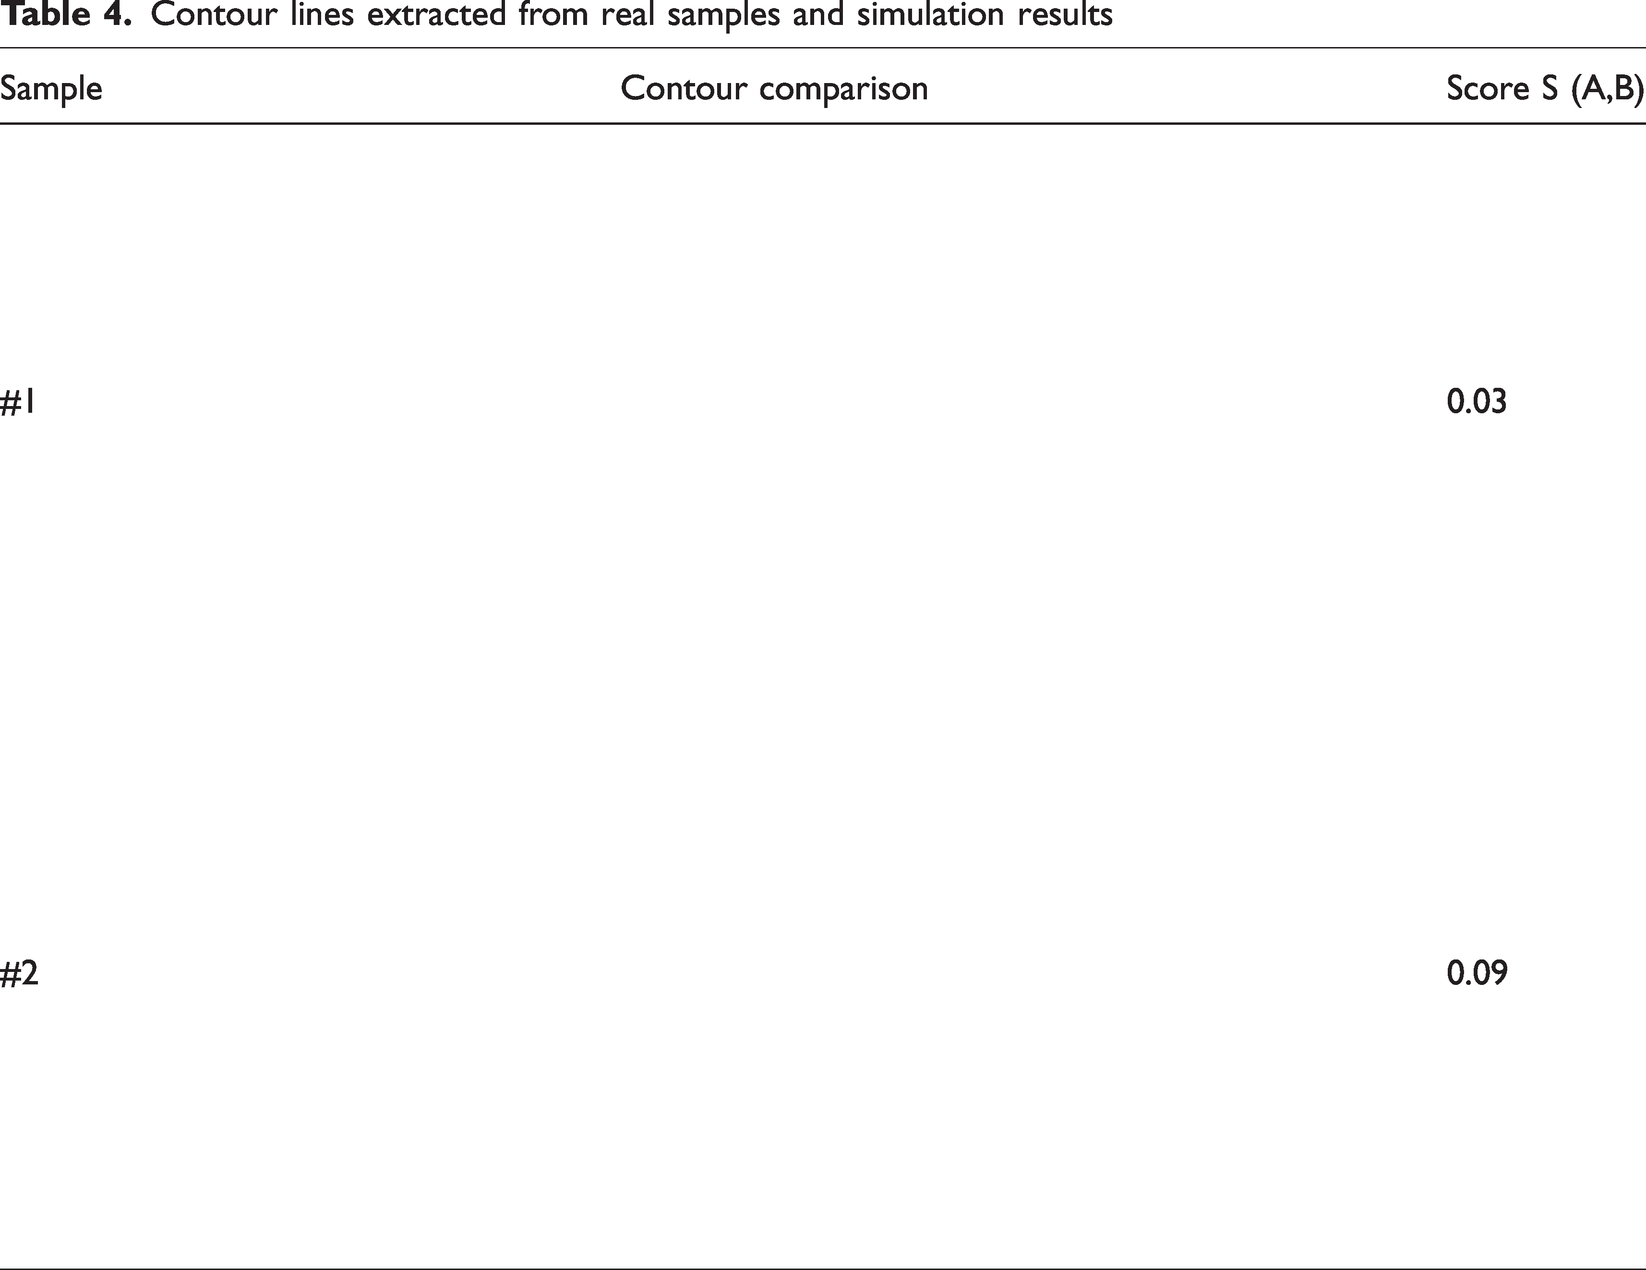
In addition, we verified the contour similarity between the simulation and real samples by image processing. We employed the method proposed by Satoshi et al. to extract all pixels along the contour of the target fabric.
23
The contour of the fabric is described by a set of variant image moments, I1–I7, which provides information on the geometric features of the image, such as size, position, orientation, and shape. We defined the similarity of two contours, A and B as

The results of the contour comparisons are presented in Table 4. Clearly, our method worked well in simulating the deformed shape of the knitted fabric. The overall shapes of the simulation models were similar to those of the real samples.
Contour lines extracted from real samples and simulation results
Conclusion
In this study, we proposed a method to visualize weft knitted fabric in three dimensions and simulated the deformed shape of knitted fabric. The cubic Catmull-Rom spline was used to represent the geometric centerline of the yarn, and the control points for the spline were calculated by constructing a mesh-loop model as the unit model for the knitted fabric. The 3D surface of the yarn was generated by calculating the cross-section of each parametric point on the geometric center using the Frenet reference. To build the initial fabric model for the simulation, we used a BMP image to represent the density distribution of the knitted fabric and mapped it into a 3D model for simulation.
We built a physical model of yarn using a dynamic spline to simulate the deformation behavior of knitted fabric at the yarn level. Stretching and bending resistances were considered in the physical model, and the damping of the system was defined globally. We used a two-stage strategy to detect collisions between yarns, and the collision force was simplified to a spring force. The motion of the yarn was solved explicitly at the midpoint of the time step. Finally, we compared the dimensions by measuring the width of the fabric and comparing the contour shapes between the simulation results and real samples by image processing. The results showed that this method worked well in simulating the deformed shape of weft knitted fabric, had great accuracy, and could be used to guide actual production and improve productivity.
Our method had some limitations. It only involved the simulation of plain fabric, and in future work we will use our method for more fancy fabrics. In addition, efficiency also needs to be considered, and we plan to use this method to explore faster simulations.
Footnotes
Declaration of conflicting interests
The author(s) declared no potential conflicts of interest with respect to the research, authorship, and/or publication of this article.
Funding
The author(s) received no financial support for the research, authorship, and/or publication of this article.
