



Abstract
For variable and flexible objects, there is no appropriate intelligent method to quantitatively characterize the three-dimensional (3D) form, especially for garment development. To address the problem, we proposed a novel approach to mapping 3D flexible objects with the coded graphic as a medium. Two-dimensional mapping patterns were used to characterize the 3D form and extract metric information. The proposed graphic code is small in size and it is easy to demonstrate position. With different fabrication techniques, various coding materials are available. With only a monocular image, the method shows high accuracy and low cost without the need for camera calibration in advance. Specifically, the processes of the method, including the algorithm of feature extraction, decoding, mapping position calculation, and pattern generation, are discussed. Two tests were implemented, and the results showed that the method was accurate and simplified the process of made-to-measure garment development. The proposed method has great application potential in the manufacturing of labor-intensive and experience-dependent flexible industries, such as apparel, home decoration, shoes, and other related areas. It also sets the stage for further artificial intelligence research of flexible objects.
Quantitative characterization of three-dimensional (3D) flexible objects is involved at all stages of product development and manufacturing, including garment dimension measurement, fabric deformation estimation, garment specification formulation, pattern making, adjustment, etc. Regrettably, it is performed mainly by manual involvement and empirical estimation, leading to labor-intensive and time-consuming processes. 1 No suitable computer vision-based quantification method is currently available in the garment industry. To address this problem, we propose an efficient approach to accurately map 3D flexible objects and acquire metric information.
With folds, shape deformations, and overlaps, acquiring quantitative information of flexible material is challenging. The aesthetic of garments requires great variations in styling, causing more difficulties. Meanwhile, garment measurements require a high degree of precision. Any slight deviation of textiles may lead to wrinkling and unfitness of garments. In garment design and development, automated 3D quantification has become a top priority.
3D reconstruction is a common method to obtain quantitative information but, for flexible objects, it is impractical. Accurate 3D garment models can be acquired with 3D modeling techniques such as virtual modeling,2,3 3D scanning, 4 and vision-based reconstruction. 5 However, what is needed for the flexible industry is flat unfolding templates, known as patterns. With folds, deformations, and overlaps, it is difficult to unfold 3D surfaces into two-dimensional (2D) templates.
Our study focuses on a new approach to flat-mapping 3D flexible objects from a monocular image in the garment industry. Using mini coding graphics as a medium, we calibrate the material and establish the relationship between 3D objects and 2D patterns. Combined with deep learning techniques, the flattened 2D patterns and the 3D metric information of the target area can be easily obtained. Meanwhile, camera parameters are not required for the method. This simple and efficient method realizes improvements in accuracy and reduction of computational costs. It lays the foundation for further research on artificial intelligence for 3D perception and quantification of flexible materials. The approach also has practical value in the automation of made-to-measure, pattern making, intelligent sewing positioning, and other related manufacturing stages.
The following sections analyze related work, describe the general framework and details of the proposed method, validate the precision of the method and give an example of bespoke garment pattern acquisition. The main features of the method are then discussed and conclusions and future works are presented in the final section.
Related work
In apparel manufacturing, traditional 3D quantitative estimation is a heavily labor-intensive process. Body dimensions are acquired by professional body fitters to ensure accuracy. Garment pattern making always takes several rounds, from specification formulation and pattern making to fitting and adjustment, not to mention bespoke garments, which necessarily have a long production cycle and high cost. The quantitative estimation process is lengthy and complicated, as it depends heavily on experience and expertise. Therefore, automated and accurate 2D mapping and qualification of 3D garments is a significant goal in the field of flexible engineering.
For automatic garment engineering, not only is 3D modeling necessary, but also flat unfolded 2D patterns. 3D modeling can be achieved through virtual modeling, 3D scanning, and vision-based 3D reconstruction. A virtual garment model can be generated directly from the surface of virtual mannequins or from the contour lines of designed garments.6,7 The 3D scanning acquires metric information based on the morphology of structured light, laser, or speckle pattern projected onto the garments.4,8 Due to its advantages of simplicity and low cost, vision-based passive 3D reconstruction has attracted a lot of attention. In stereo camera methods, camera traps with two or multiple cameras photograph the same target from different directions and distances. The coordinates of the target are calculated based on a set of images.9–13 In addition, with the significant development of deep learning, the accuracy of monocular image methods has been improved. Depth information and 3D structure are represented with voxel, 14 point cloud, 15 directed distance field,16,17 and polygon mesh.9,10 These studies have contributed significantly to 3D reconstruction, but for flexible and complex garments, their reconstruction requires a huge computational cost. Unfolding 3D surfaces to 2D patterns is also a conundrum. For the undevelopable surfaces on 3D items, geometry and physical methods are used to estimate the shape of the flattened 2D patterns.18,19 However, the garments suffer significant variations in style and design with overlaps, folds and deformation. At the same time, the appearance of garments is influenced by the textile deformation, human dimensions and any trims; thus, there is a non-negligible difference between the acquired 2D patterns and the patterns for production.
To obtain mapping patterns efficiently, some research has focused on pattern generation based on the 2D data acquired from garment images. Parametric pattern generation methods represent apparel construction with several parameters.20,21 Variant programming methods require inputting of all the parameters and pattern, making rules into codes, which is always a time-consuming process. Later, other studies focused on the constraint relationships between geometric entities of one specific style, such as points, lines and curves. Furthermore, the dimensions of the patterns can be predicted based on fuzzy logic, 22 back propagation neural network, 23 and radial basis function neural network. 24 However, although these methods enable efficient pattern acquirement, they ignore the 3D perception of garments. They are prone to problems of being limited to restricted styles and inaccurate patterns, and cannot adapt to the changing styles of the fashion industry.
To address these problems, we propose a simple and efficient method of mapping and qualifying the target area on a flexible material based on graphic coding. The 3D form of garments can be characterized by the mapping patterns. The proposed method meets the accuracy and precision requirements of apparel and textile manufacturing from a monocular image.
Description of the proposed method
General scheme of the system
The proposed method can be used in the accurate mapping of flexible objects, such as apparel, home decoration, shoes, etc. In this article, we use the example of the apparel industry to give a brief overview of the proposed method. The coding graphics with localization information were attached to the flexible material in advance. Since coding graphics are regarded to deliver fast readable information with a large storage capacity and strong resistance to damage,25,26 we used coding graphics as markers attached to the object. With deep learning, the region of interest (ROI), such as cutting lines, darts, pleats, gathering, etc., could be extracted automatically. The location of ROI could then be calculated approximately according to the decoding value of the codes. Using the coding graphics on the flexible material as calibration, the method can achieve accurate localization for a flexible material, even if modeled into a complex structure. The workflow of the method is shown in Figure 1.

General scheme of the proposed approach.
The basic steps of the method are given below.
Design the graphic coding and prepare the calibrated material. Extract the ROI on the acquired images with deep learning. Decode the coding graphics and obtain the localization information. Calculate localization of the ROI according to the decoding value and image information. Detect outliers and generate the mapping patterns.
Structural design and fabrication of coded material
The coded graphics attached to flexible material contain location information and need to meet the following conditions:
Small size
To reduce the deformation of coding, the size of the code should be as small as possible to allow sufficient image quality. The small size also reduces the effect of the codes on the appearance of the material.
Easy to locate
The code should contain obvious features for accurate and quick location.
Data and error correction codes
The code contains information about the code’s position. To improve accuracy, error correction codes need to be added in the data area.
Direction information
To ensure omnidirectional recognition, it is necessary to set up direction graphics.
The structure of the designed code is shown in Figure 2. It consists of three colors: two colors represent the information, and the other illustrates the background. The hue is one of the main color parameters in the HSV (hue, saturation, value) model and can typically be represented quantitatively by 0–360. We took a pair of complementary colors, cyan (hue, 180) and red (hue, 0), with the greatest hue contrast as the information colors, improving the discrimination of different modules. The two colors of the information modules represent bits ‘0’ and ‘1’, respectively. White was used as the background color.
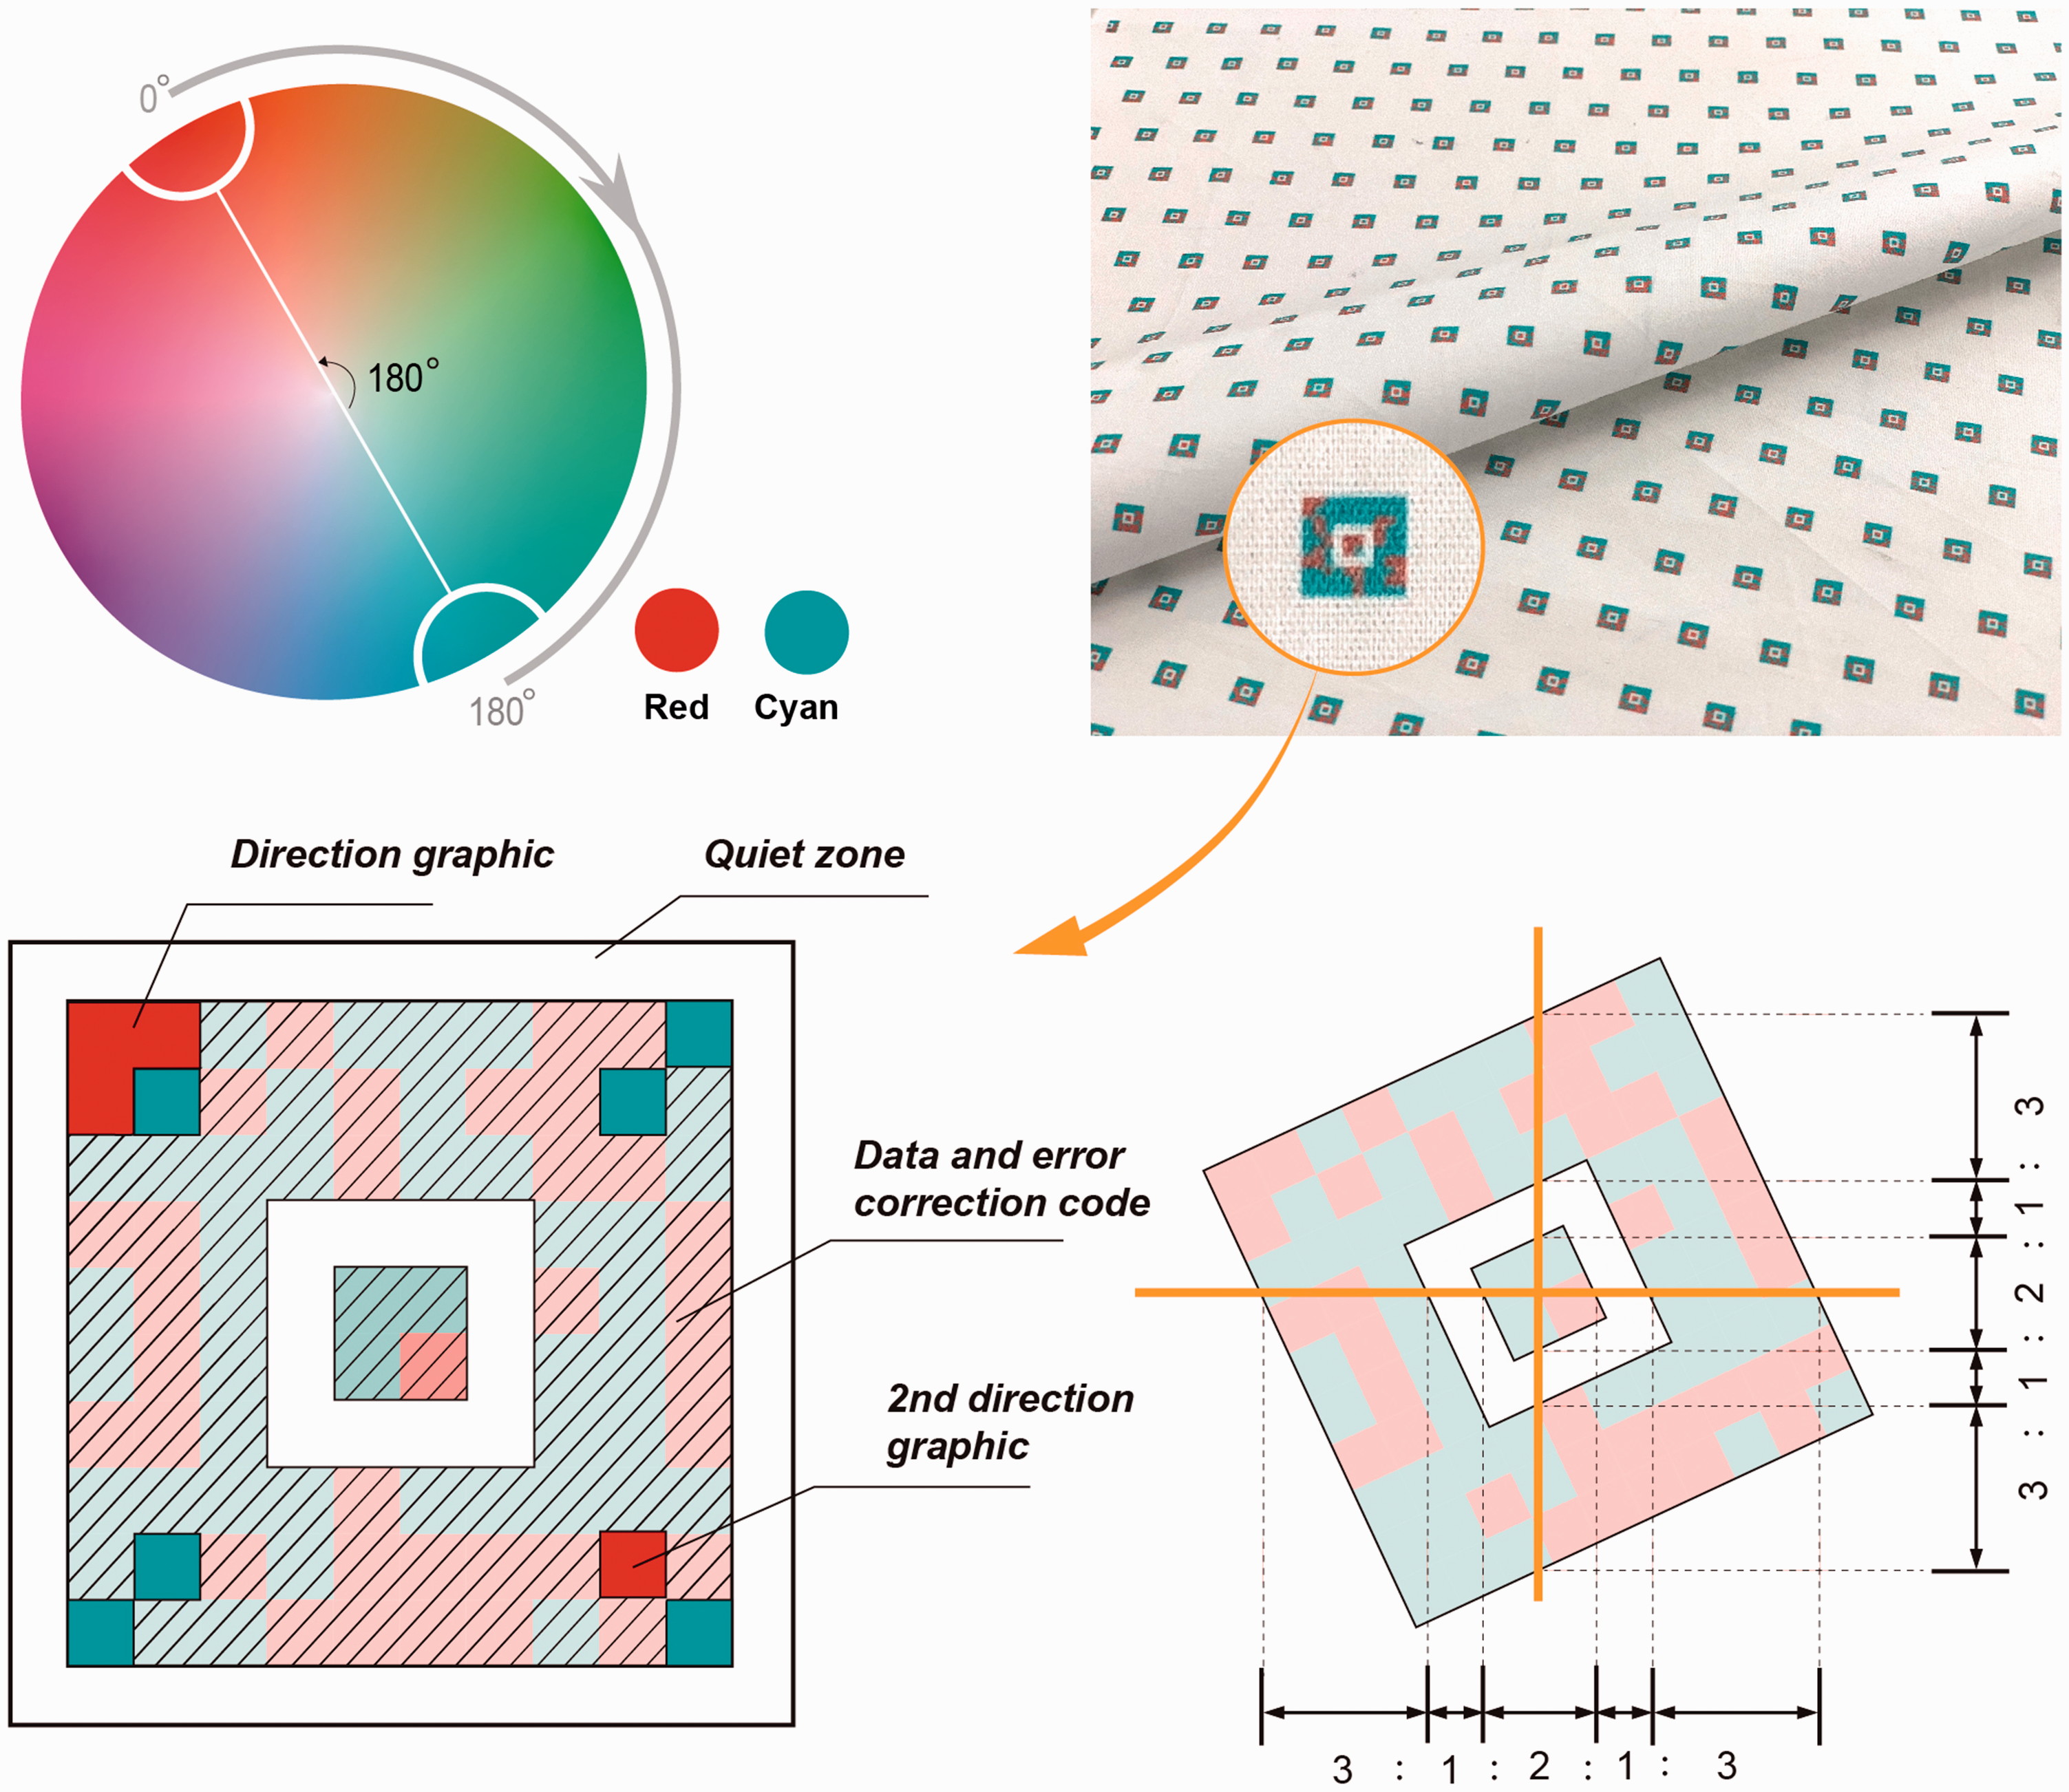
Structure of the localization code. The code graphic contains direction graphics, quiet zone, data, and error correction code. A pair of complementary colors, cyan and red are taken, with the greatest hue contrast. The information modules and white models constitute the finder pattern with a fixed width proportion in any direction.
The red and cyan modules constitute the finder pattern, composed of three overlapping homocentric squares with 3:1:2:1:3 width proportion in any direction, which ensures accurate and quick localization of the code. Among the four corners of the outermost and second layers of the code, one module is in cyan to determine the orientation of the code. These two modules are located as far apart as possible, at the diagonal position, so that the orientation can still be recognized when an image distortion occurs at a certain position of the code.
The code contains the information of two numbers, which represent the abscissa and ordinate, respectively, of the position where the code is located on the flexible material. BCH (Bose–Chaudhuri–Hocquenghem) error correction coding with high space utilization can improve the anti-distortion and stainability of coding and ensure small graphics size.27,28 We used BCH (63, 18, 8) and BCH (15, 5, 3) to encode the hundreds digit as well as other digits, respectively. The coded graphics then were arranged in an array.
Textile printing techniques can be used to print the coding graphics on flexible materials. The code array can also be printed with infrared (IR) ink and be detected with an IR camera so that the code graphics are invisible to the human eye. Water-soluble inks can also be used to make the markers easy to remove. In addition to direct printing, heat transfer techniques can also be used to transfer the codes on the films to the fabric by ironing. Transparent films with coding graphics can also adhere to the surface of different flexible materials.
Theoretically, the proposed method can be applied to a variety of fabrics, including woven and knitted fabrics with better stretchability. In the production of knitted garments, pattern-making requires getting the shape of the stretch fabric in its upstretched state, while in our approach, the flexible material is calibrated when it is not deformed. The proposed method can therefore be used for stretched materials. However, it should be considered whether extensive fabric stretching would influence the accurate identification of the graphic codes. For instance, if the density of the knitted fabric is too low, the coding graphic printed on the fabric may crack when stretched; the large stretch deformation may result in a large code distortion and a failure of the correction algorithm. In these cases, elastic offset printing and a reduction of the code size might address these issues.
In this article, we use woven fabrics as an example with which to discuss the feasibility of the method. In our experiments, white cotton fabric was used as the base fabric. Its parameters are shown in Table 1.
Base fabric specification
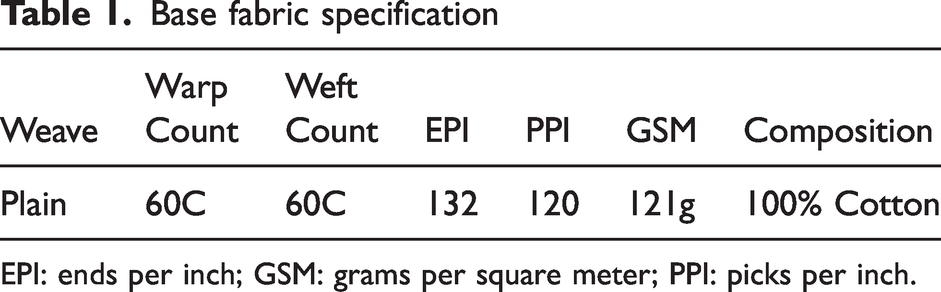
EPI: ends per inch; GSM: grams per square meter; PPI: picks per inch.
ROI extraction
The ROI can be extracted by different methods according to the actual case under consideration. In pattern making, the ROI on the clothing surface includes borderlines, lines drawn by markers, boundary lines with stitchers, pins, and tapes, as shown in Figure 3 and Figure 4, where these lines may exist in darts, pleats, hems and junctions of different clothing pieces. Folds, creases and pins on the garment may interfere with the recognition results collected in the database. Also, images were collected under different light conditions, including strong, weak, front, side, back and top light.
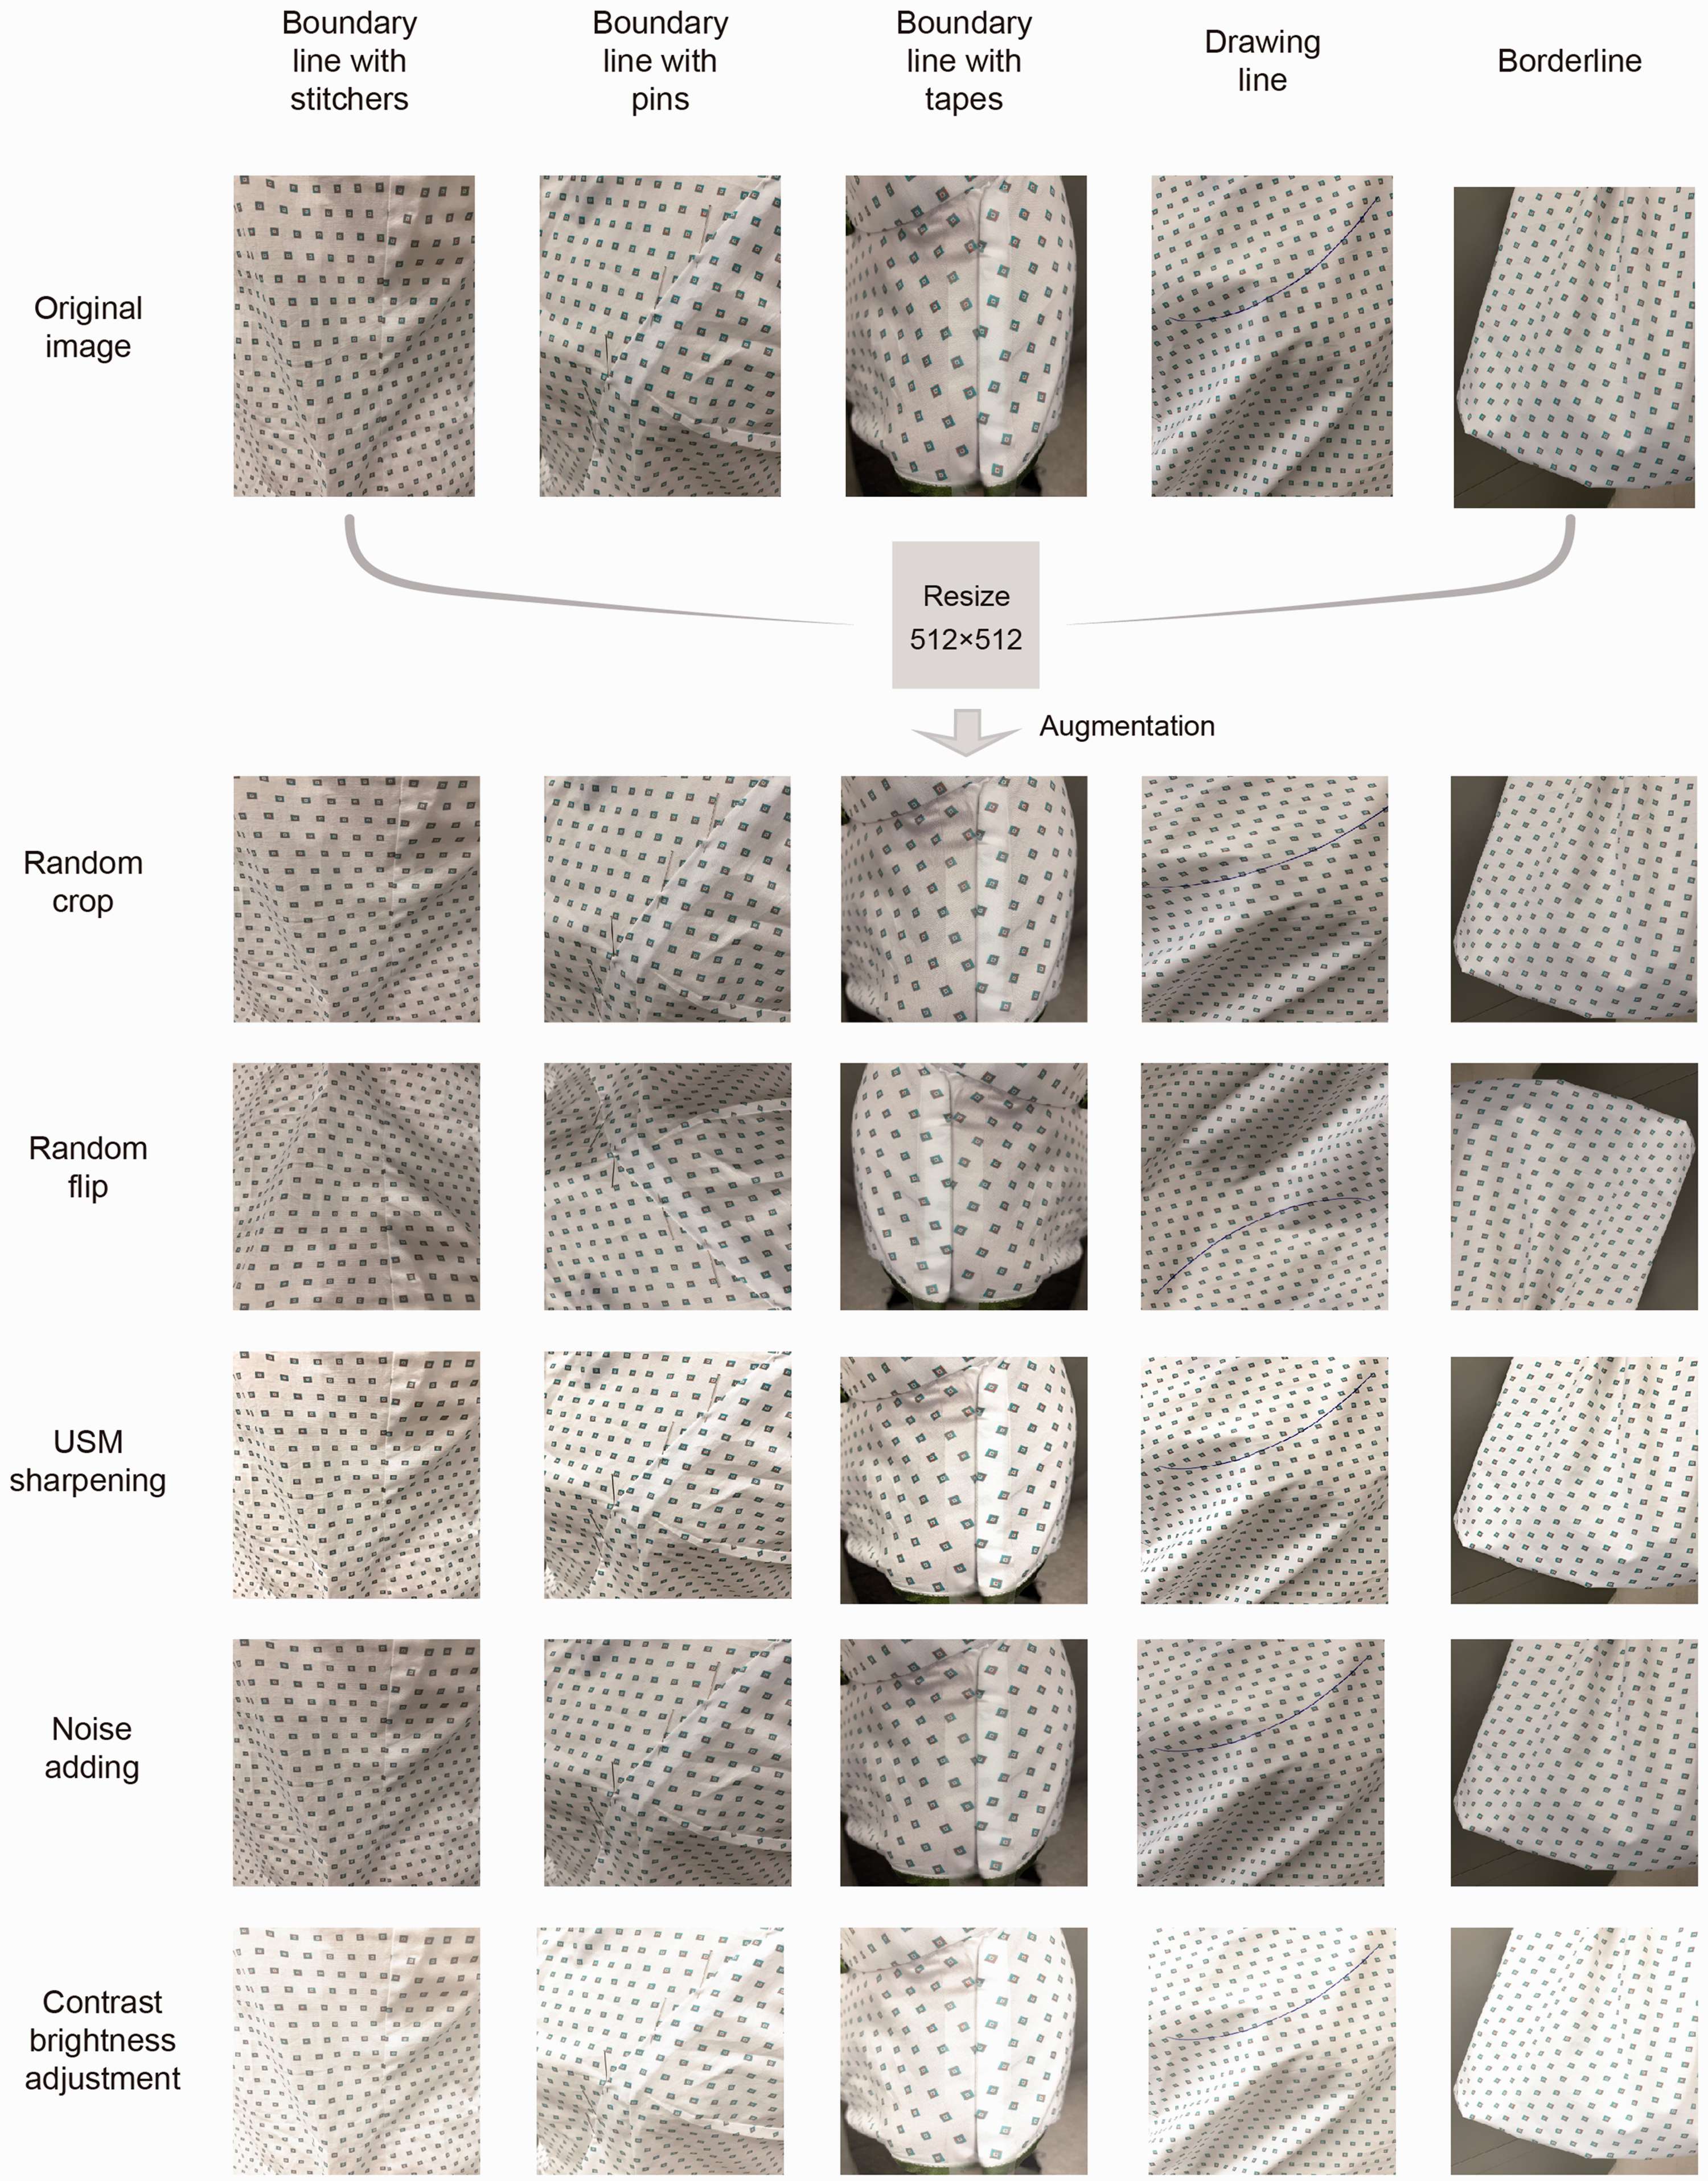
Dataset augmentation process. Random crop, random flip USM sharpening, noise adding, and contrast brightness adjustment were utilized to expand the size of the training dataset. All different types of lines are shown for comparison. USM: unsharp mask.
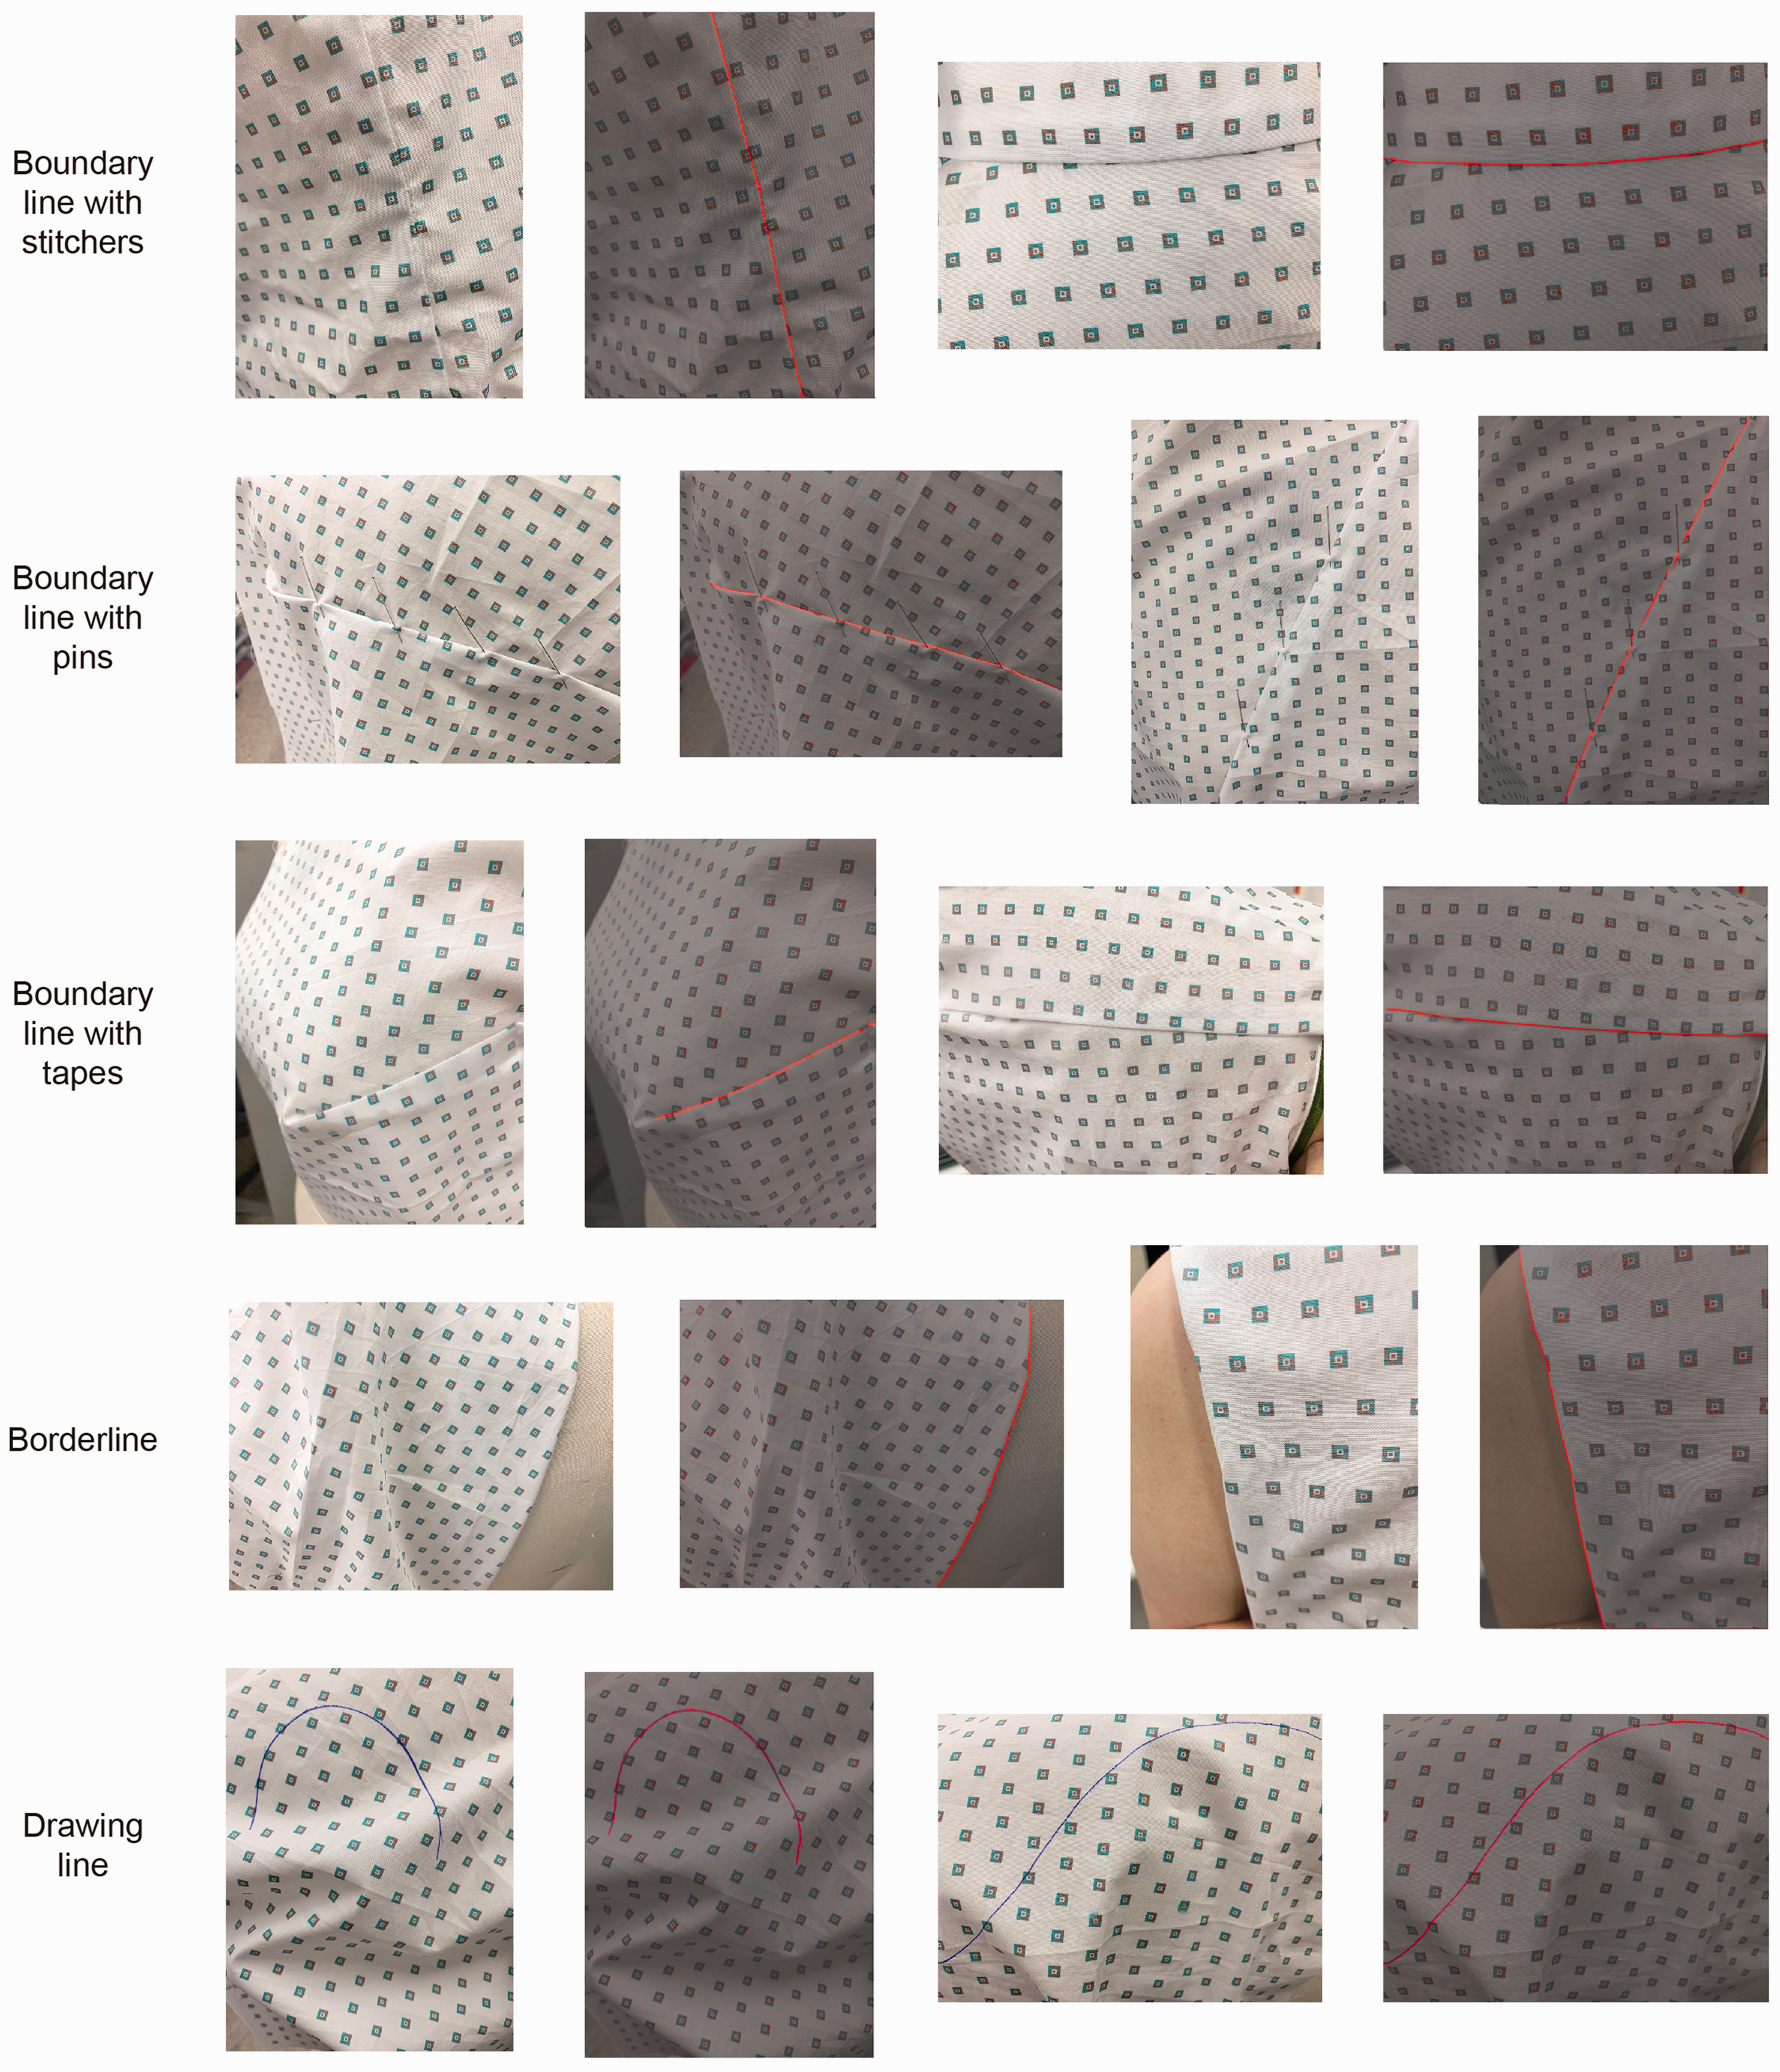
Sample images of the prediction results. Different categories of ROI can be identified. ROI: region of interest.
We took the classical image semantic segmentation algorithm DeepLabv3 as an example to extract the ROI in the apparel field. 29 A total of 400 garment images with characteristic lines were collected, considering different types of characteristic lines, image background and lighting conditions. All the lines in the images were annotated. The whole dataset was divided randomly into training and testing sets at a ratio of 4:1. The images underwent a preprocessing step to resize to fit the DeepLabv3 input size (512 × 512). To expand the size of the training dataset and overcome the possibility of overfitting, image data augmentation, including random crop, random flip, unsharp mask sharpening, noise adding and contrast brightness adjustment, was used in the study as shown in Figure 3.
We trained the datasets based on a computer with an Intel(R) Xeon(TM) E-2176M CPU at 2.70 GHz and Nvidia Quadro P4200 with Max-Q Design graphics processing unit. The model was implemented in PyTorch 1.9.0. After trying several possible combinations of hyperparameters, we set the original learning rate to 0.001 and adopted step decay to help the network converge to a local minimum and ovoid oscillation. The learning rate dropped to 0.8 times every 10 epochs. The epoch was set as 100 and batch size as five. Every epoch took around 140 s. To implement the model quickly, we used ResNet34 to perform transfer learning. The loss function applied in the study was a cross-entropy loss. The Adam optimizer was used for updating the model. Due to the large difference between the pixel area of the characteristic lines and the background, the recognition accuracy would always be high even if all the images were predicted as background. Therefore, it was necessary to set the weight of the optimization function. The optimization scale of the background category was set to 0.2, and the optimization scale of characteristic lines was set to 1.0.
For evaluation metrics, we used pixel accuracy (PA), mean PA (MPA), and mean intersection over union (mIoU). These evaluation metrics provided comprehensive assessments and are adopted frequently in research. In binary classification, they are defined as:



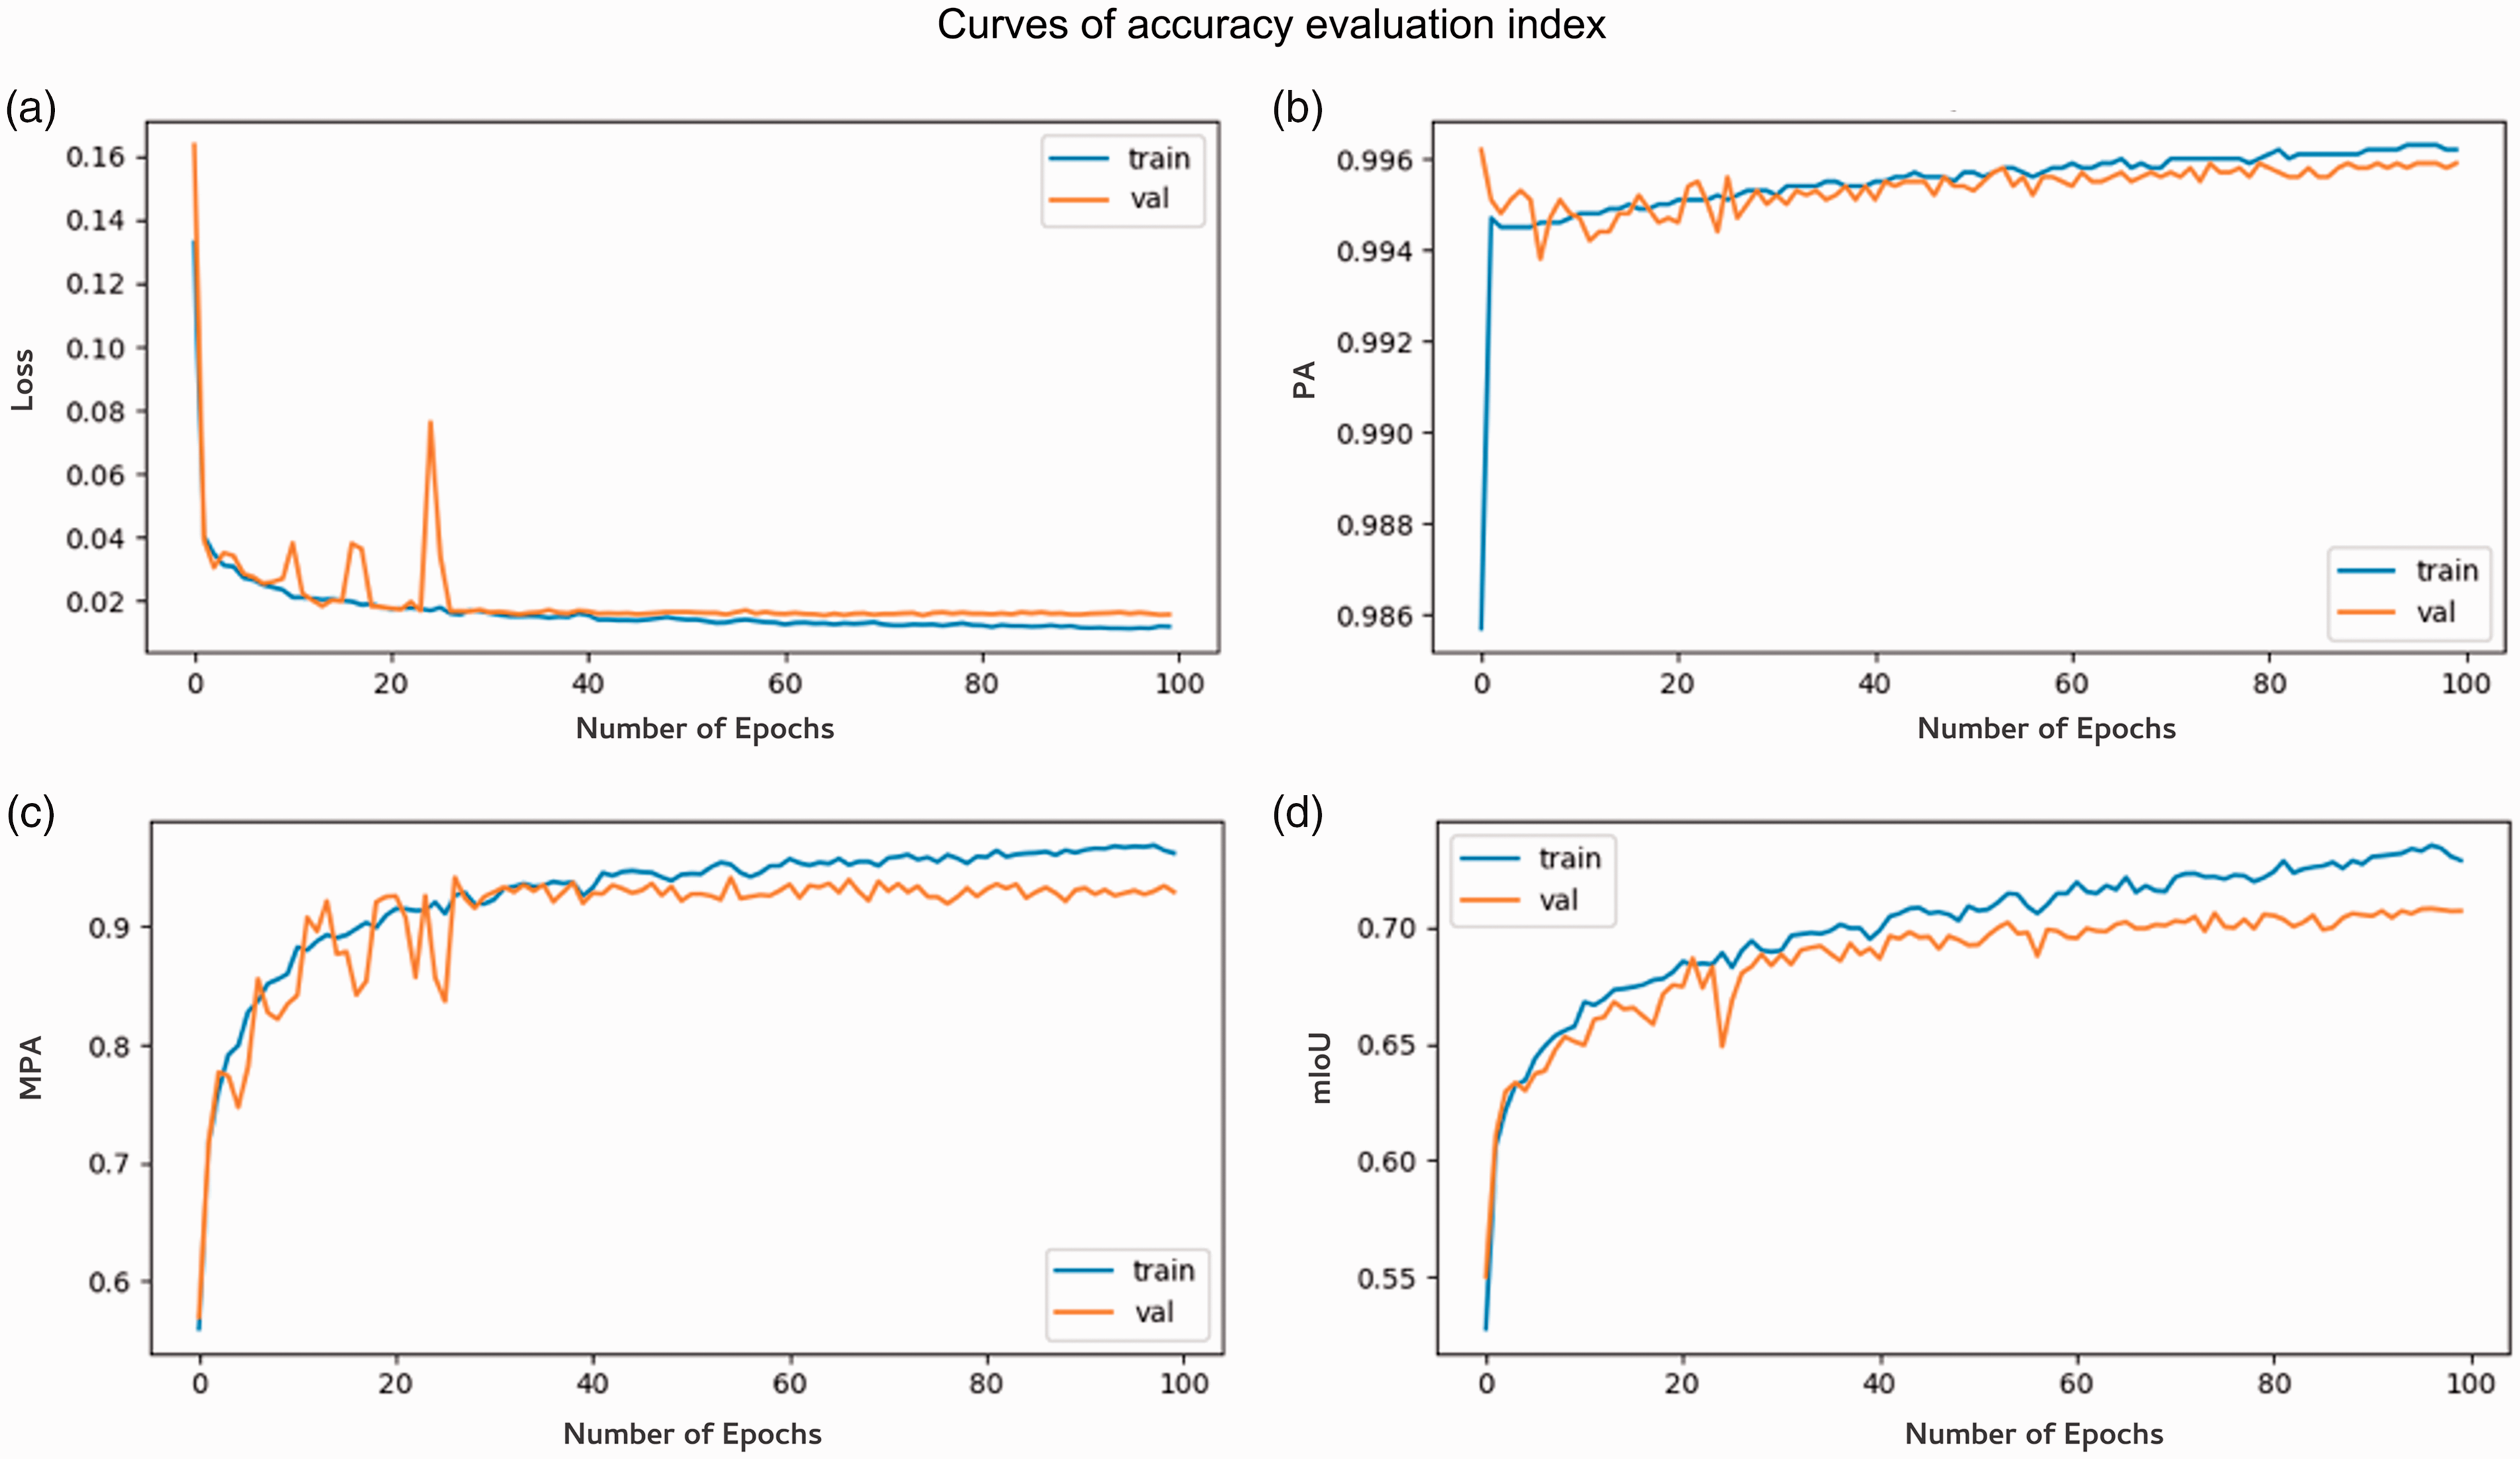
Curves of accuracy evaluation index, loss (a), PA (b), mPA (c), and mIoU (d) during training process. Both curves for training (blue) and validation (orange) sets are reported. mIoU: mean intersection over union; mPA: mean pixel accuracy; PA: pixel accuracy.
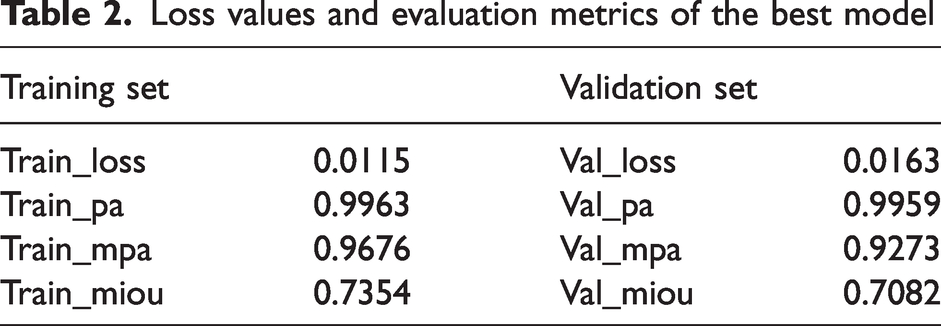
In this study, the proportion of pixels between the lines and the background is extremely unbalanced. Even if the feature line prediction is wrong, the PA of the model is still very high, so the PA value can be used only as a reference index for model evaluation. Evaluation of the clothing feature line prediction model is based mainly on mPA and mIoU. The best model was saved with epoch 96. The loss values and evaluation metrics of the training set and verification set are shown in Table 2. The final prediction results are shown in Figure 4.
Loss values and evaluation metrics of the best model
Decoding and mapping results
The target points in the extracted ROI are acquired by image processing operations and positioned by the recognition points nearby. The acquisition of target points is demonstrated in Figure 6(a). The mask images are binarized first and pixels are added to the extraction area by dilation to expand the shapes. Then, via image refinement and region boundary trace, pixel coordinates of target points for localization are obtained. Since there is no need to obtain dense points, the final target points are taken every 50 points.
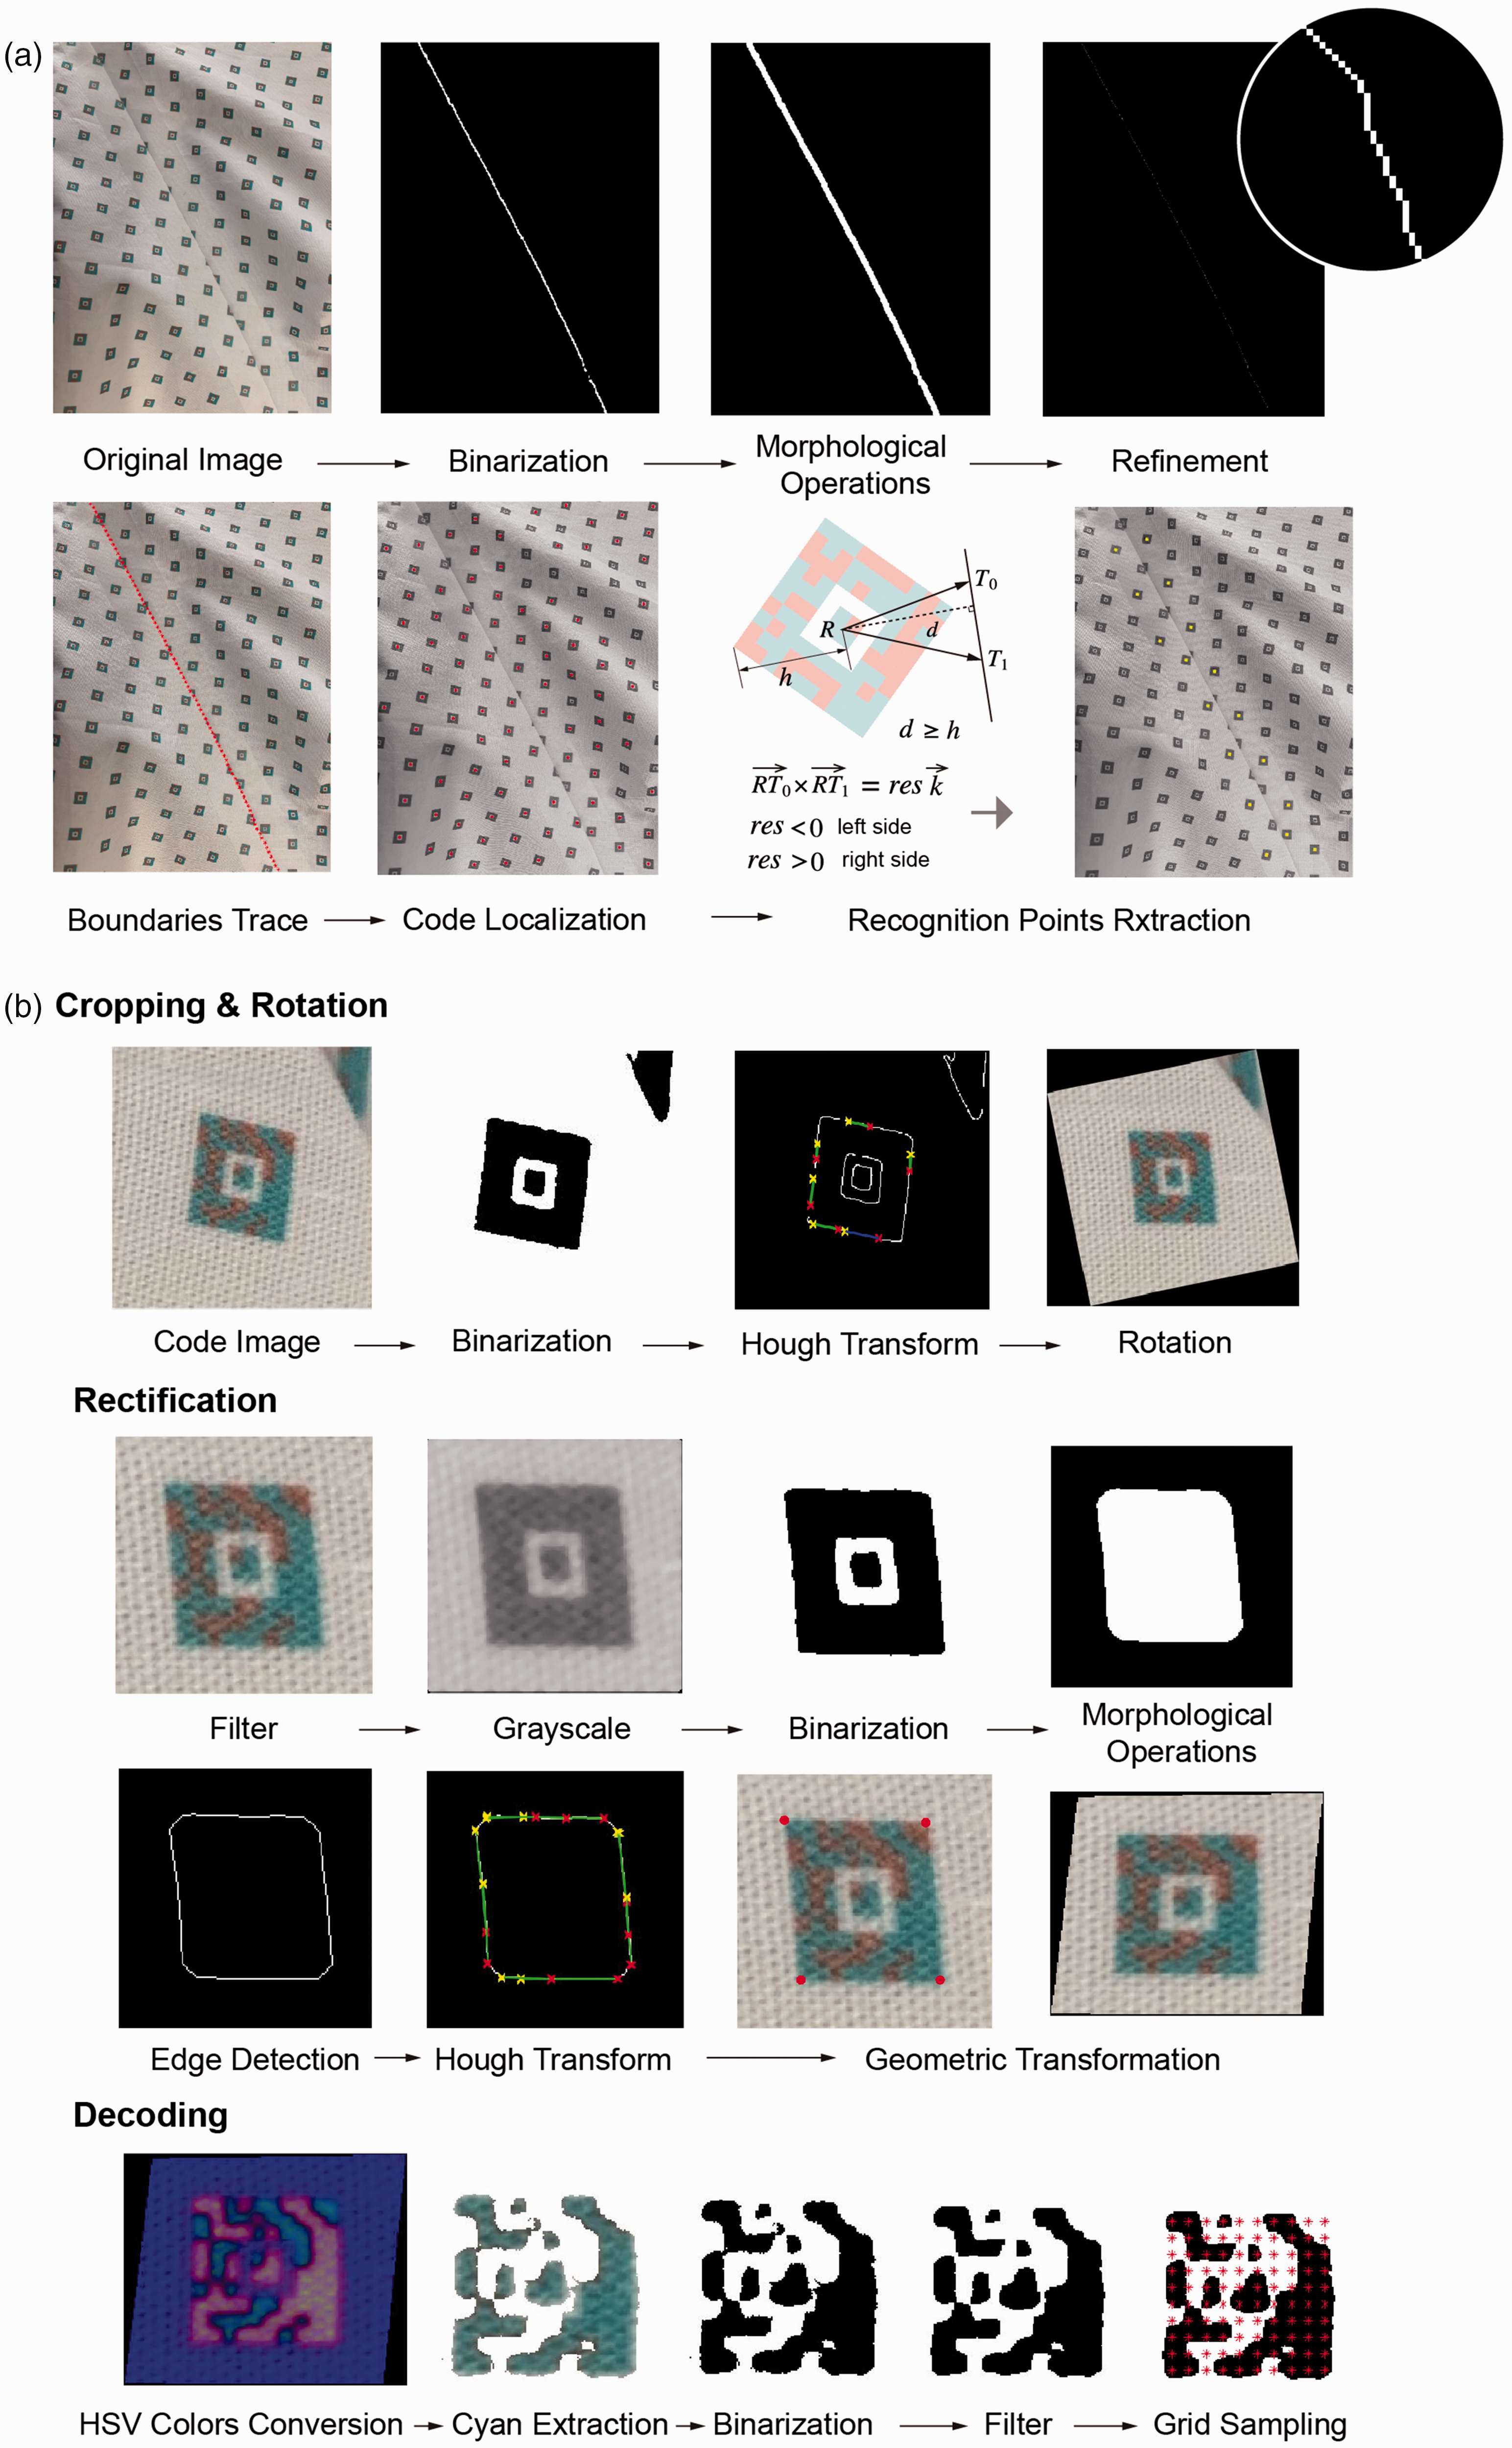
Image processing and decoding process. (a) Acquisition of target points and (b) a decoding sample of recognition points.
Next, the recognition points—the closest codes to the target points—need to be localized and decoded as shown in Figure 6(b). The original images are first binarized by a locally adaptive thresholding technique to keep the coded pattern clear under different conditions. Code localization utilizes the characteristic feature of the codes, namely that the dark and light module with any rotation of the code in an image has a fixed ratio of 3:1:2:1:3. A binary is scanned horizontally and vertically to find all points matching the ratios as candidates. The isolated points are deleted in multiple iterations. For the nearest neighbor points around the code center, we replace the original coordinates with the average coordinates of the nearest neighbor point set of each point. After a number of iterations, the point clusters shrink and fuse inward. The accurate pixel coordinates of all the code centers are obtained. Recognition points for every target point on both sides of the ROI then need to be searched and decoded. The recognition points should keep intact without being truncated by feature lines, thus we extract the code that meets the following conditions as the recognition point R of the target point 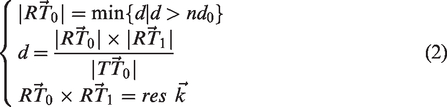
Following these steps, the recognition points are decoded. Hough transform and edge detection are used to detect the code boundaries. Every code graphic then is rotated horizontally or vertically. Since the textile is flexible and bendable, deformation of the codes always exists; thus, a rectification process is necessary. Hough transform is used to detect the four edges of the coded graphic, whose intersections constitute four vertices. The four vertices are regarded as a pair of control points that can be transformed, whereas the four vertices of a square are regarded as fixed points that can be used to infer the geometric transformation applied to the code image. In addition, the direction pattern determines the direction and location of the information. Two direction patterns are set to in case one is defaced and unrecognizable. The information data are stored in the red and cyan modules. An RGB code image is converted to HSV color modules first, then the cyan modules are extracted based on hue (0.2–0.6), saturation (>0.1) and value (>0.1), where hue corresponds to the position on a color wheel from red (0) to cyan (0.5) and finally back to red (1), saturation illustrates the amount of hue from neutral shade (0) to maximum (1), and value means the maximum value among the components of a specific color from 0 to 1. Morphological operations are then applied to the extracted cyan modules to remove small objects from the image. After extracting the information data, the BCH decoder is used to detect and correct errors in the data.
The decoded value represents the actual coordinates of the recognition points on the textile. The mapping points of the target points can be calculated according to the pixel distance, orientation and actual distance between each target point and the corresponding recognition point. 30 Outliers are then detected, and the mapping points classified by density-based spatial clustering of applications with noise (DBSCAN). Finally, a B spline curve is used to fit the mapping points of the target points as shown in Figure 7.
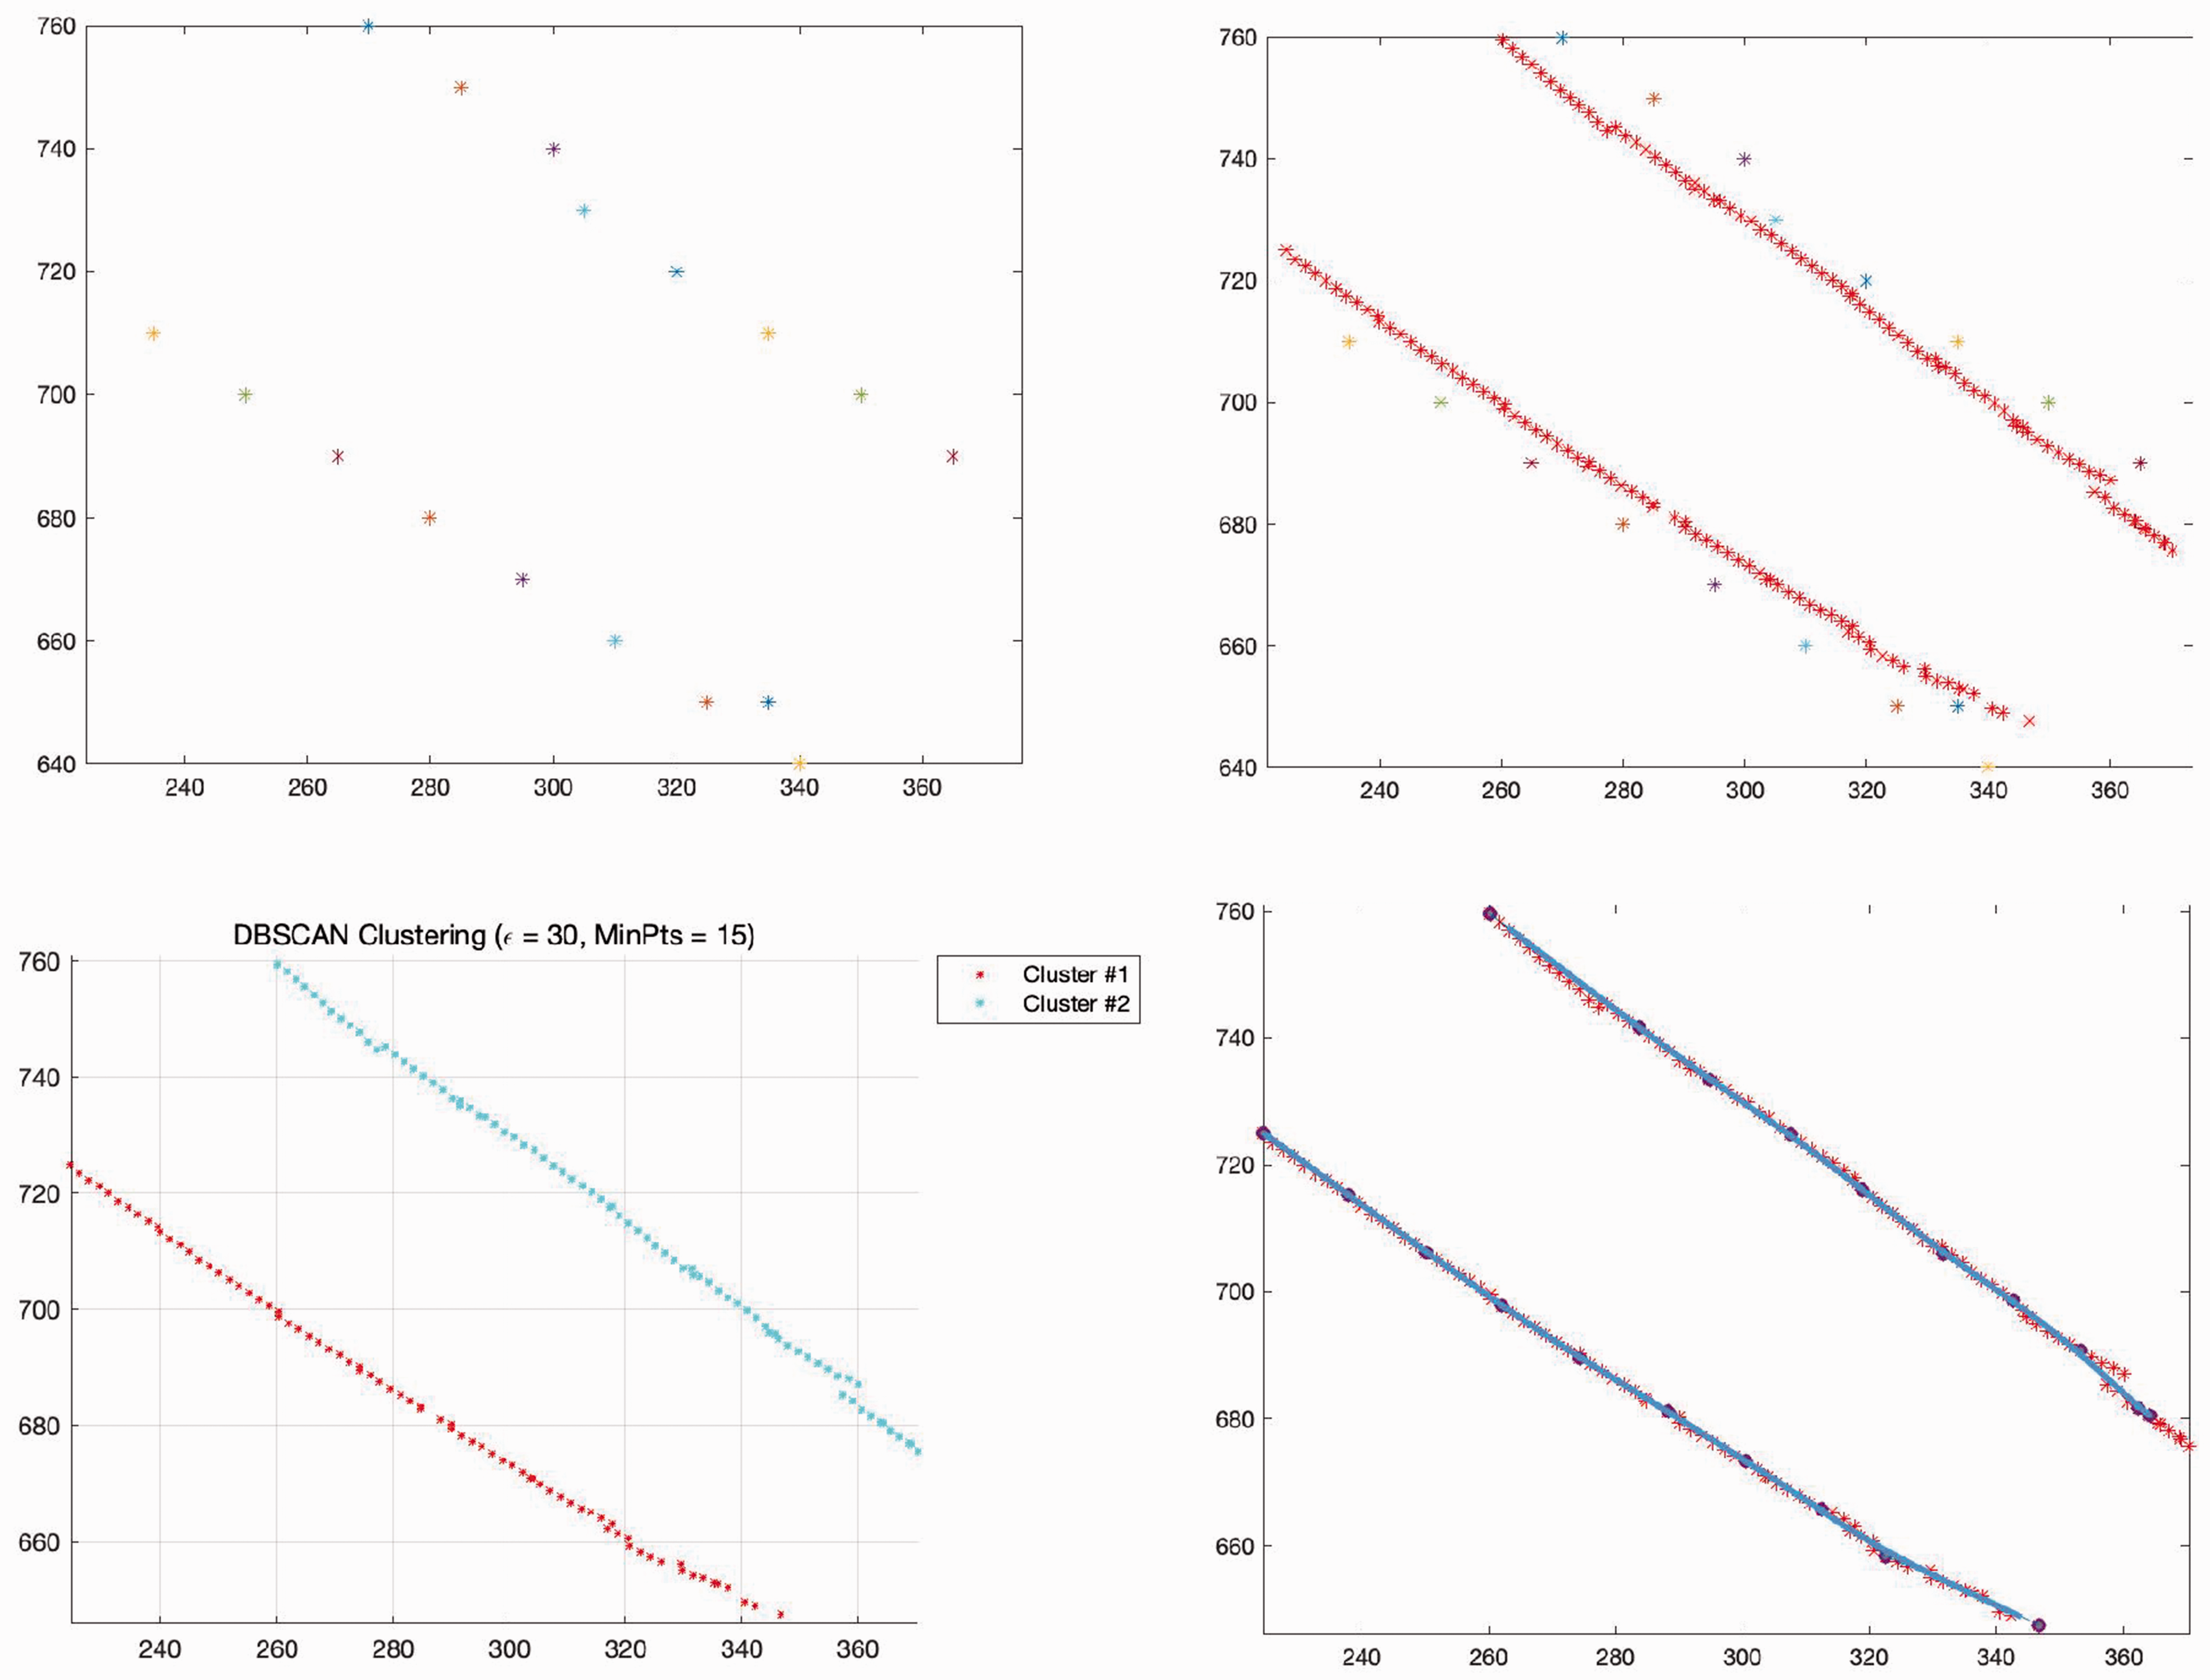
Spline fits of the mapping target points. The calculated target points are classified into two groups and fitted separately by B spline curves.
The description above introduced the details of the proposed approach, including the structure of the coding graphic and the recognition process. Our method directly establishes the relationship between 3D garments and 2D patterns. There is a corresponding point in 2D coordinates for every point on 3D garments. The ROI, where the target point is located, is extracted by deep learning. The location information from the recognition points is then calculated by the decoding results. Finally, the form of 3D objects can be represented by 2D mapping patterns.
Experimental validation
Verification tests were conducted to confirm the feasibility and accuracy of the proposed method. In these tests, we used regularly arranged colorful codes with 4mm side length and 1.2 cm spacing. To arrange the codes more densely in the vertical direction, codes in even rows were shifted to the right by 0.5 units.
In the first test, we adopted three common 3D structures on the garment to test the precision of the system, namely pleat, dart and design graphic. The mapping patterns generated were compared with the actual dimensions of the pattern as shown in Figure 8. For pleat and dart, the measured dimensions were acquired by the proposed method. The flexible material was then flattened. The actual size was obtained with common tools and compared with the measured size. The measured size of the pleat is 70.68 mm while the actual dimension is 70.7 mm. The actual angle of the dart is 20.85°, whereas the measured size is 20.81°. The design pattern on the garment surface was scanned and compared with the generated mapping pattern, and the result showed that their shapes almost coincided. The test showed that the accurate mapping patterns of ROIs are able to represent the 3D forms of flexible material, and that the metric information can be acquired easily with the mapping patterns.
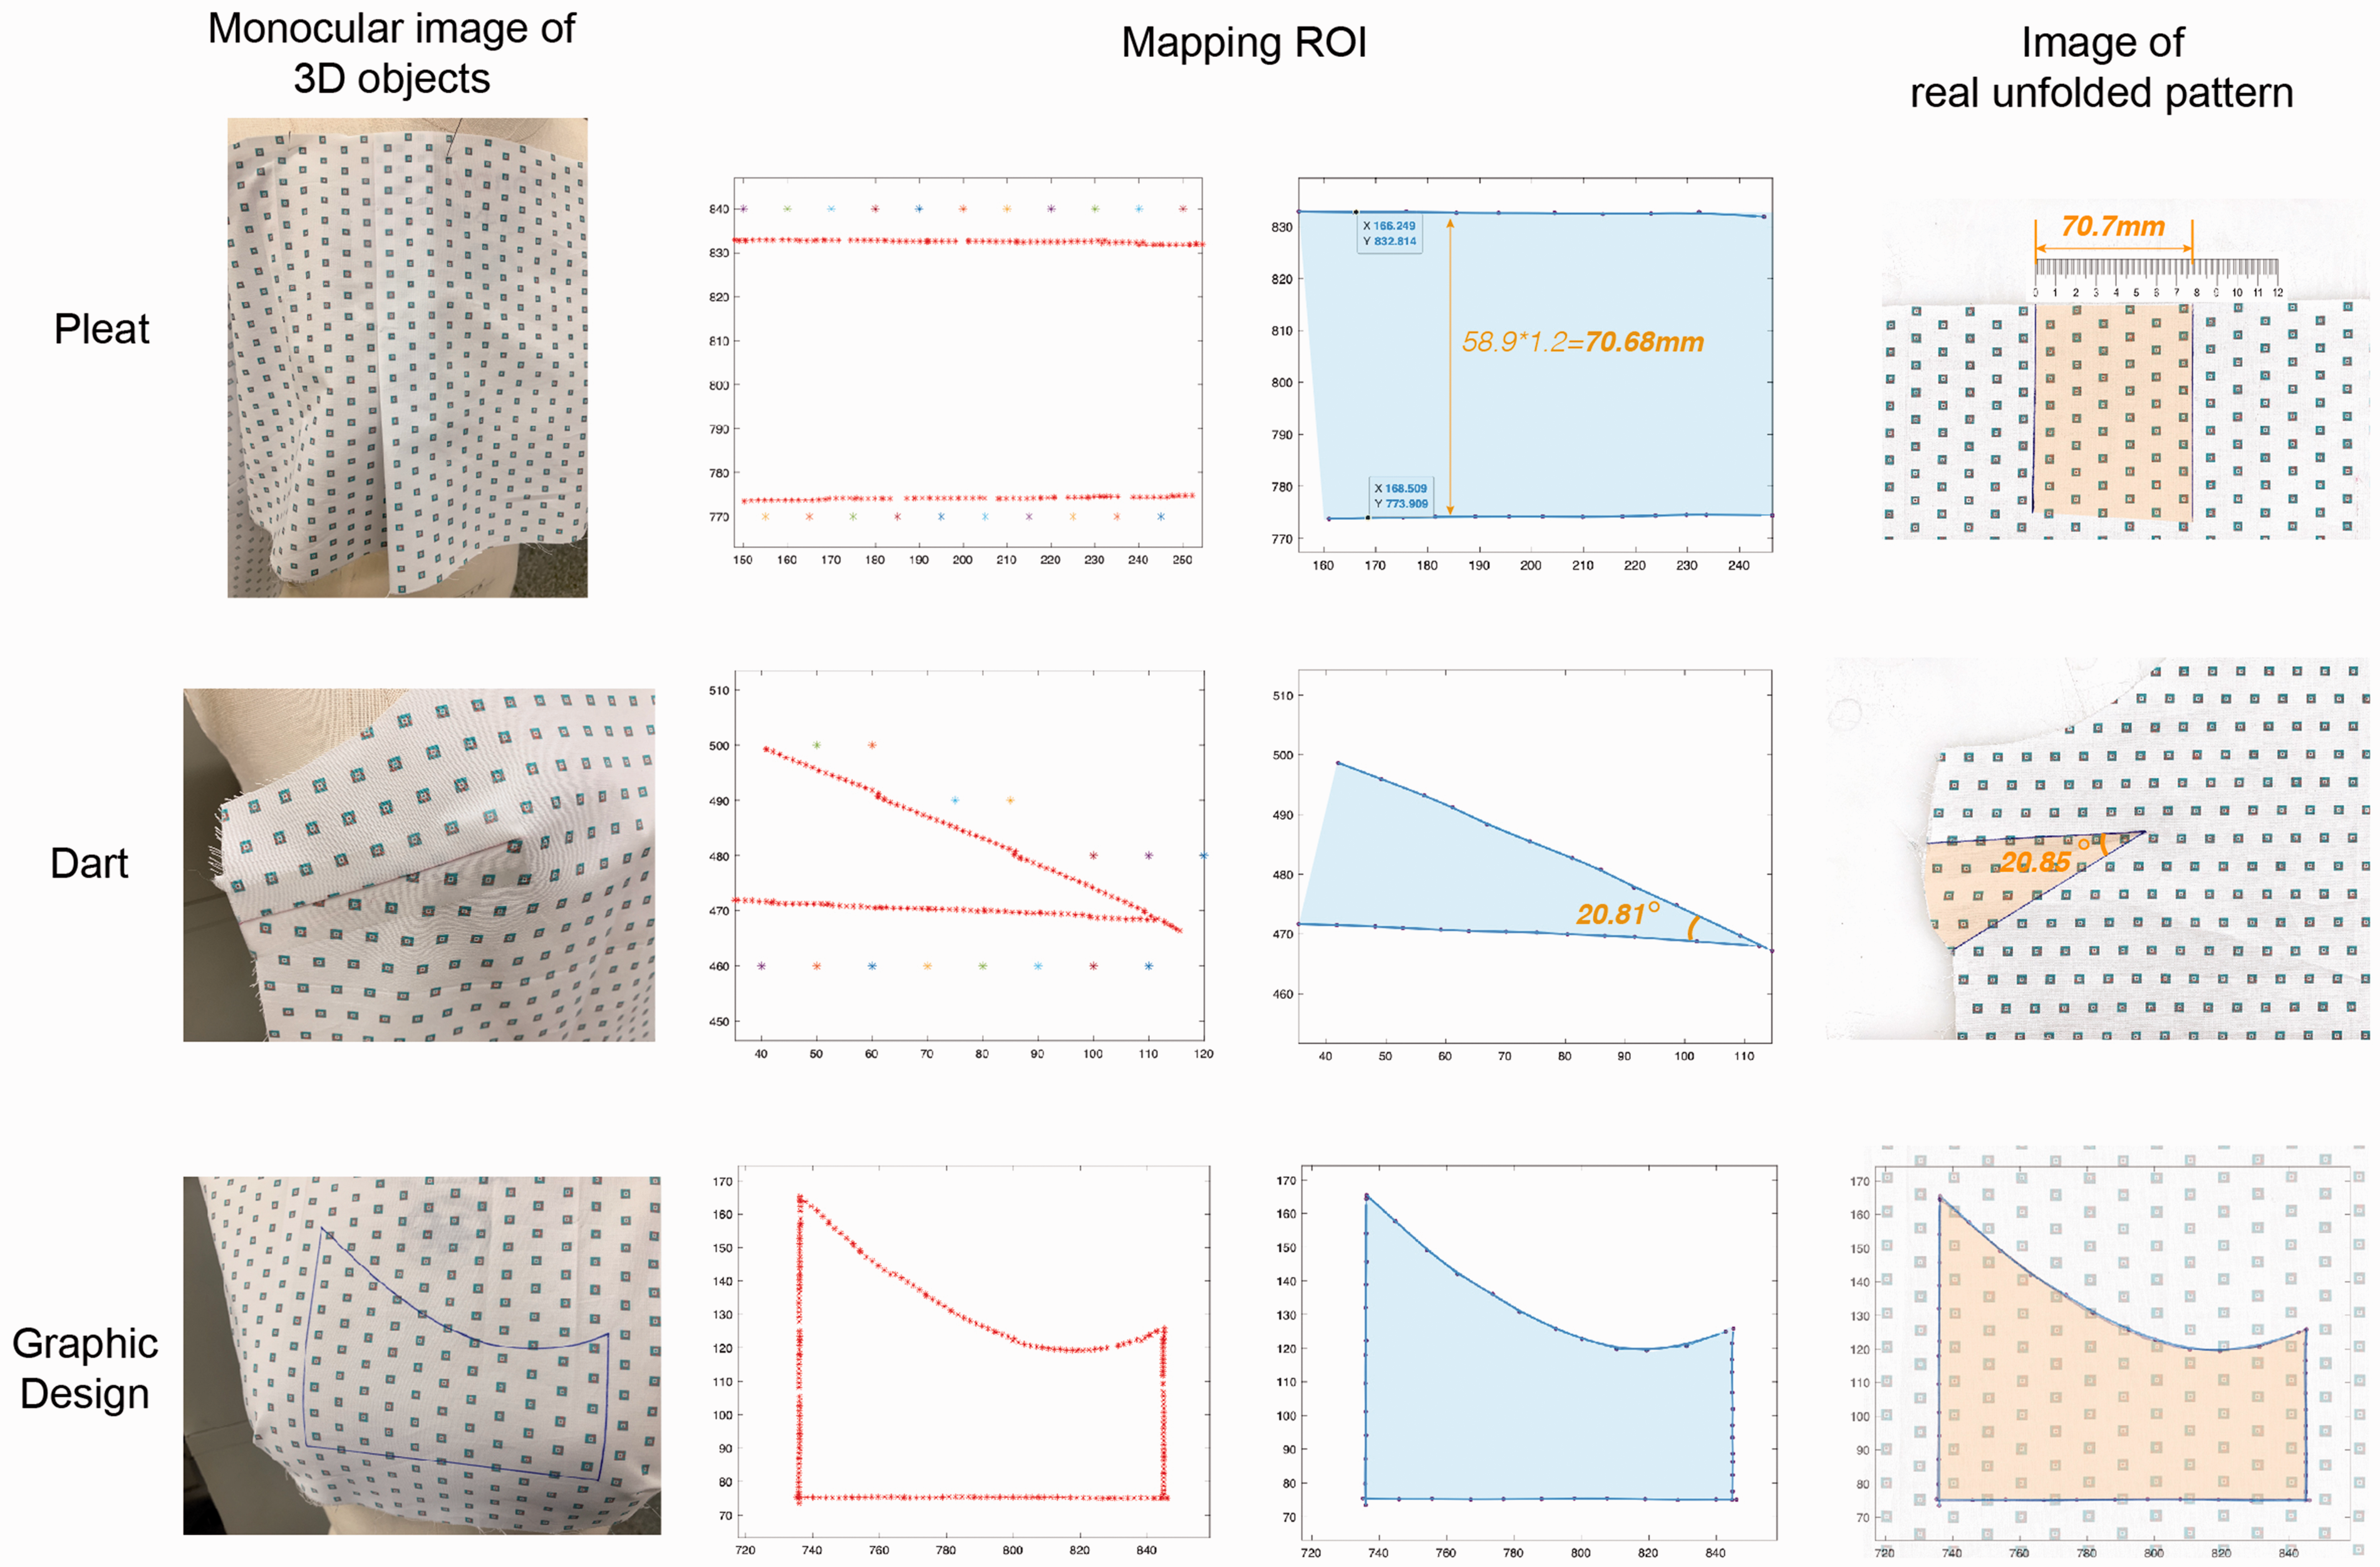
Accuracy and precision validation of the proposed method. Three classic structures in garments (pleat, dart, graphic design) are presented. The shape of mapping patterns and the real unfolded patterns almost coincide.
In the second test, with the proposed method, we achieved a rapid response to customize the garment without measurement of body dimensions. Qipao, a type of bias placket body-hugging dress, does not have as many cuts as other tight-fitting clothing. Representing the curves of the human body with only a few darts and cuttings, it requires accurate and proper pattern structure for different customers. Thus, we adopted Qipao, with its demand for high accuracy, as the validation style for patterns.
In the test, we acquired bespoke Qipao patterns for different participants by trying on a Qipao in average size. First, we made the Qipao in an average size using the coding fabric. The patterns were input into the system at the mapping position. When participants tried on the garment, we adjusted the unfitting parts in the light of the different body shapes and preferences. Pictures around those areas were taken. After image processing, the corresponding ROI areas on the pattern were acquired. The data obtained from the images were divided into two groups according to the location of recognition points: one from the right side of the ROI, and the other from the left side. Clustering analysis was performed to suggest subgroups of data, and the data were then fitted by B-spline. To ensure the generated curve intersected with the original pattern boundary, we extended the generated curve based on the trend of the curve. Finally, the closed area formed by the generated curve and the boundary of the original pattern was removed. The final pattern was obtained by transferring the dart and reassembling the original pattern. The mapping pattern obtained from this process is shown in Figure 9.
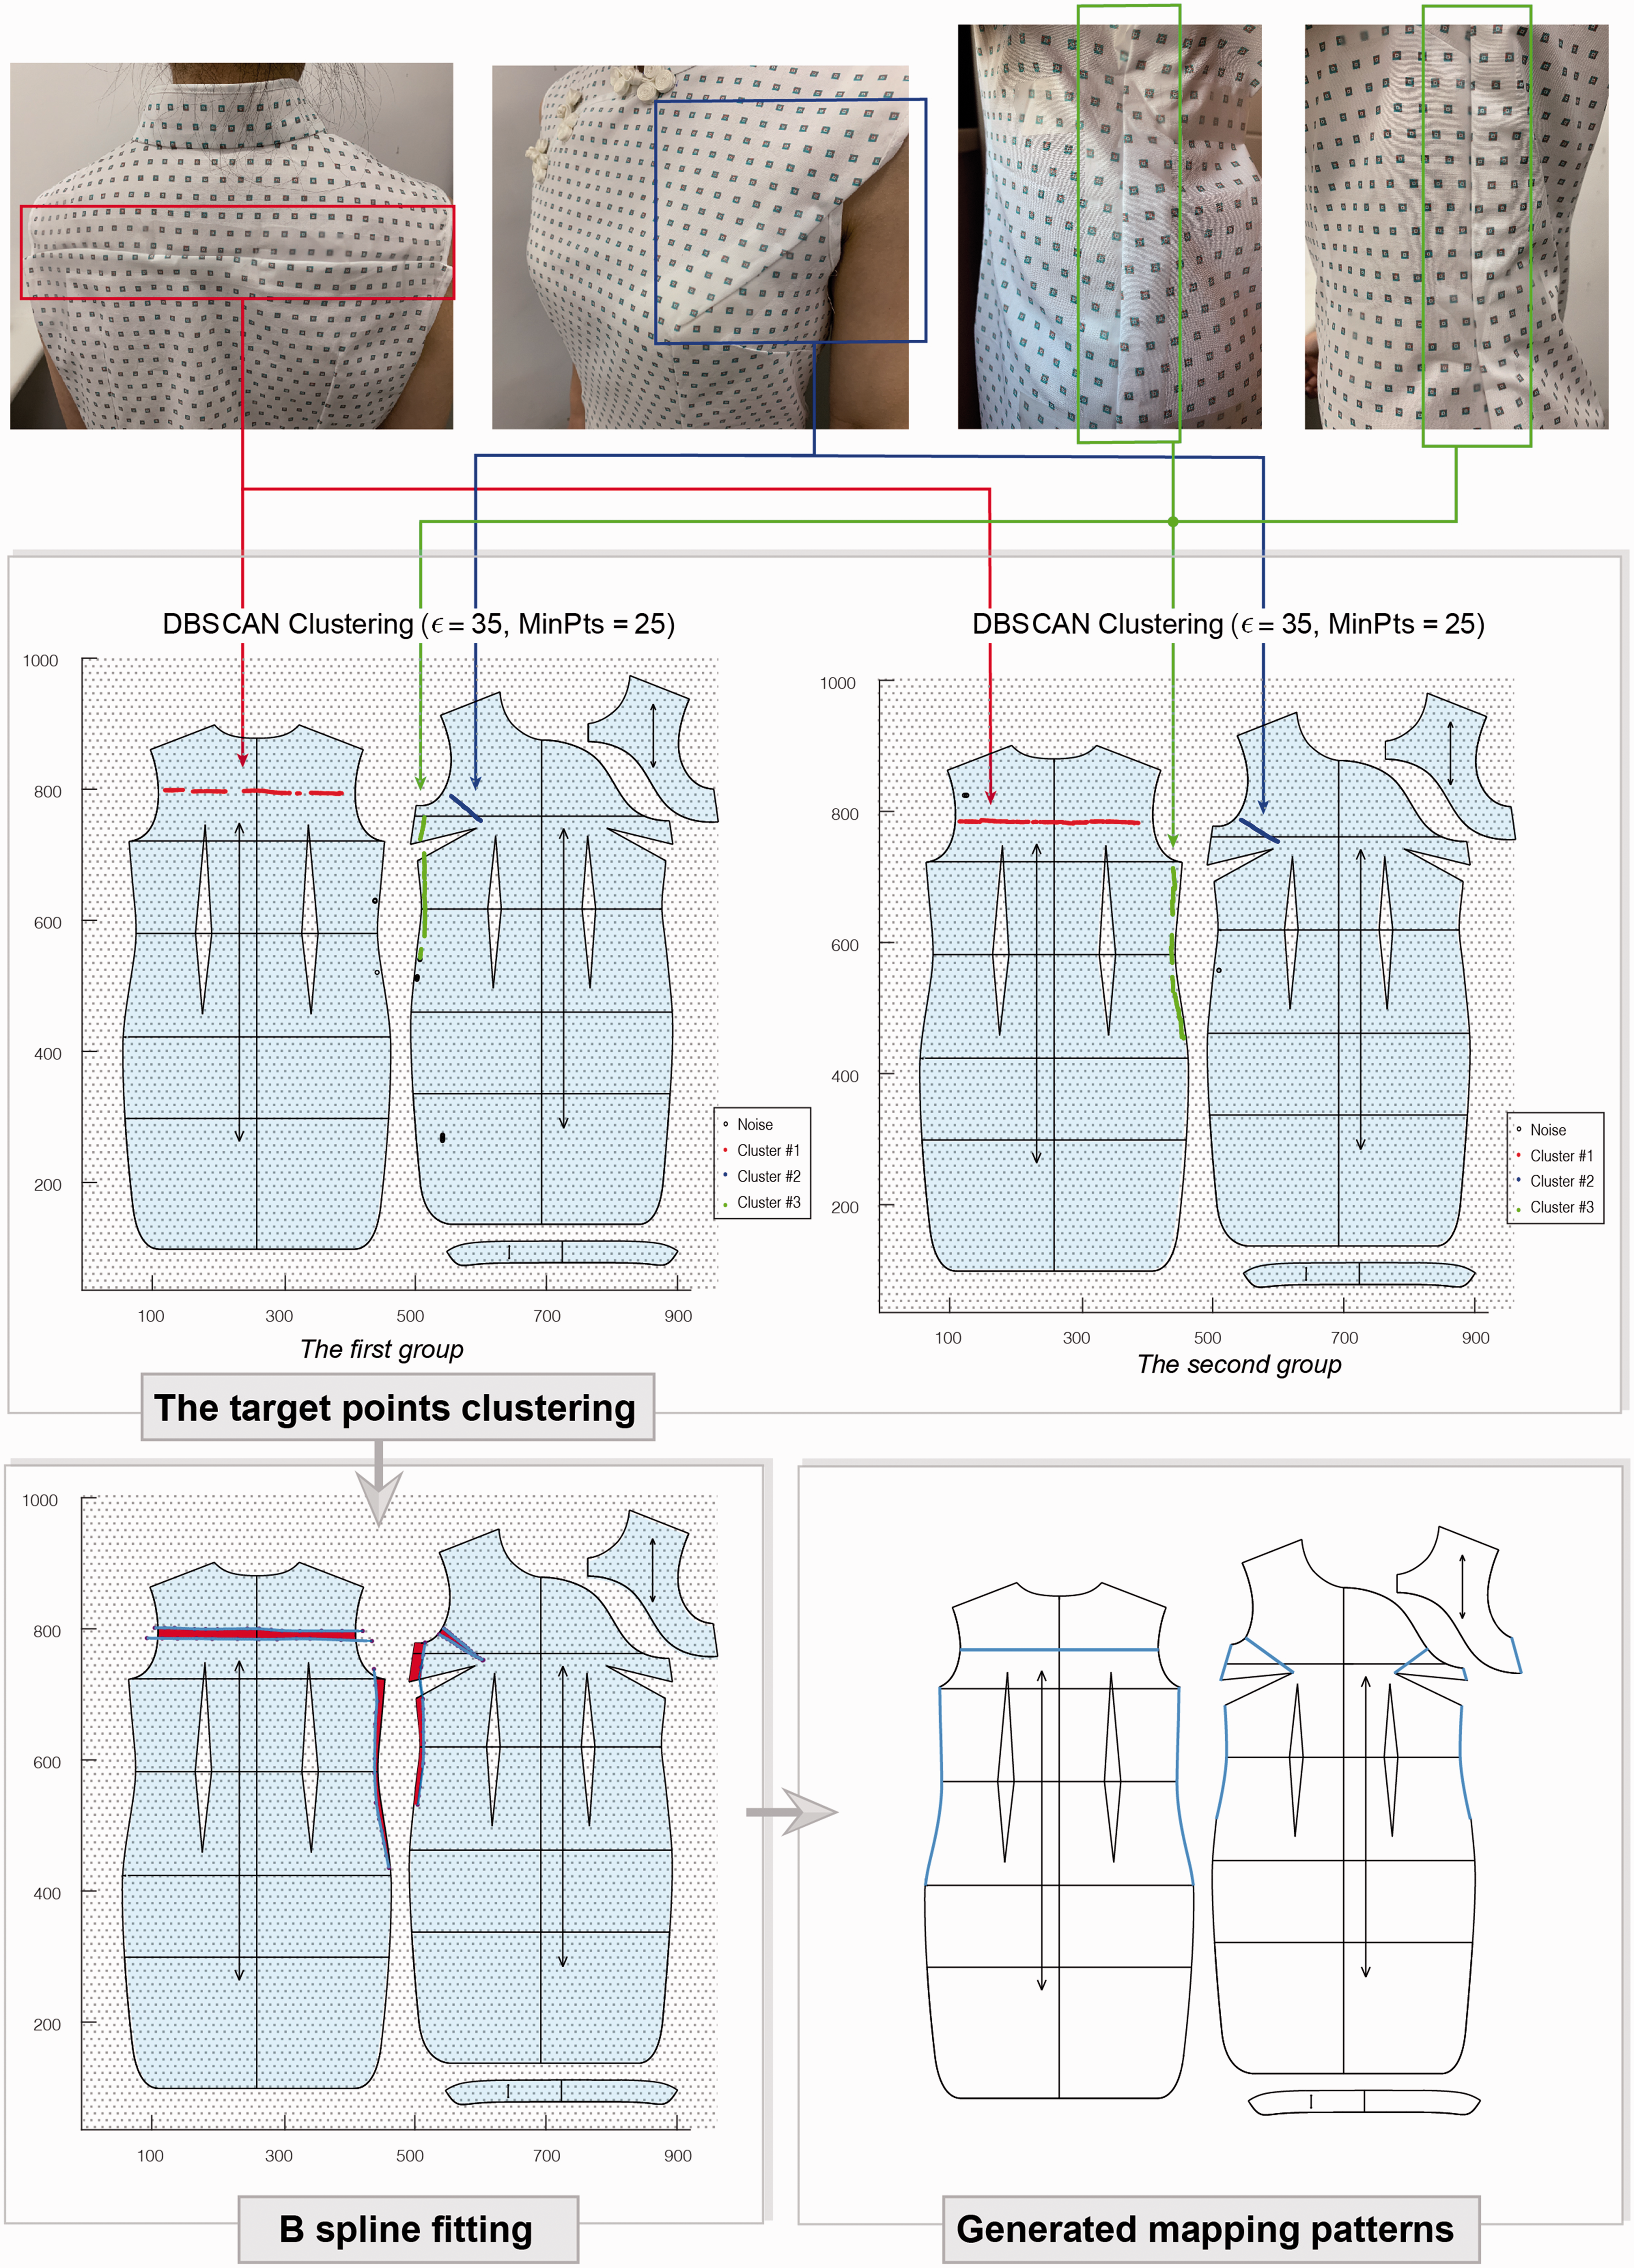
Mapping process of bespoke garment patterns with the proposed approach. Target points are clustered into two groups and fitted by B spline curve. Bespoke patterns are generated by transferring the dart and reassembling the original pattern.
We invited several participants to try on and adjust the garment. The test process for three of them is shown in Figure 10, and their body measurements are shown in Table 3.
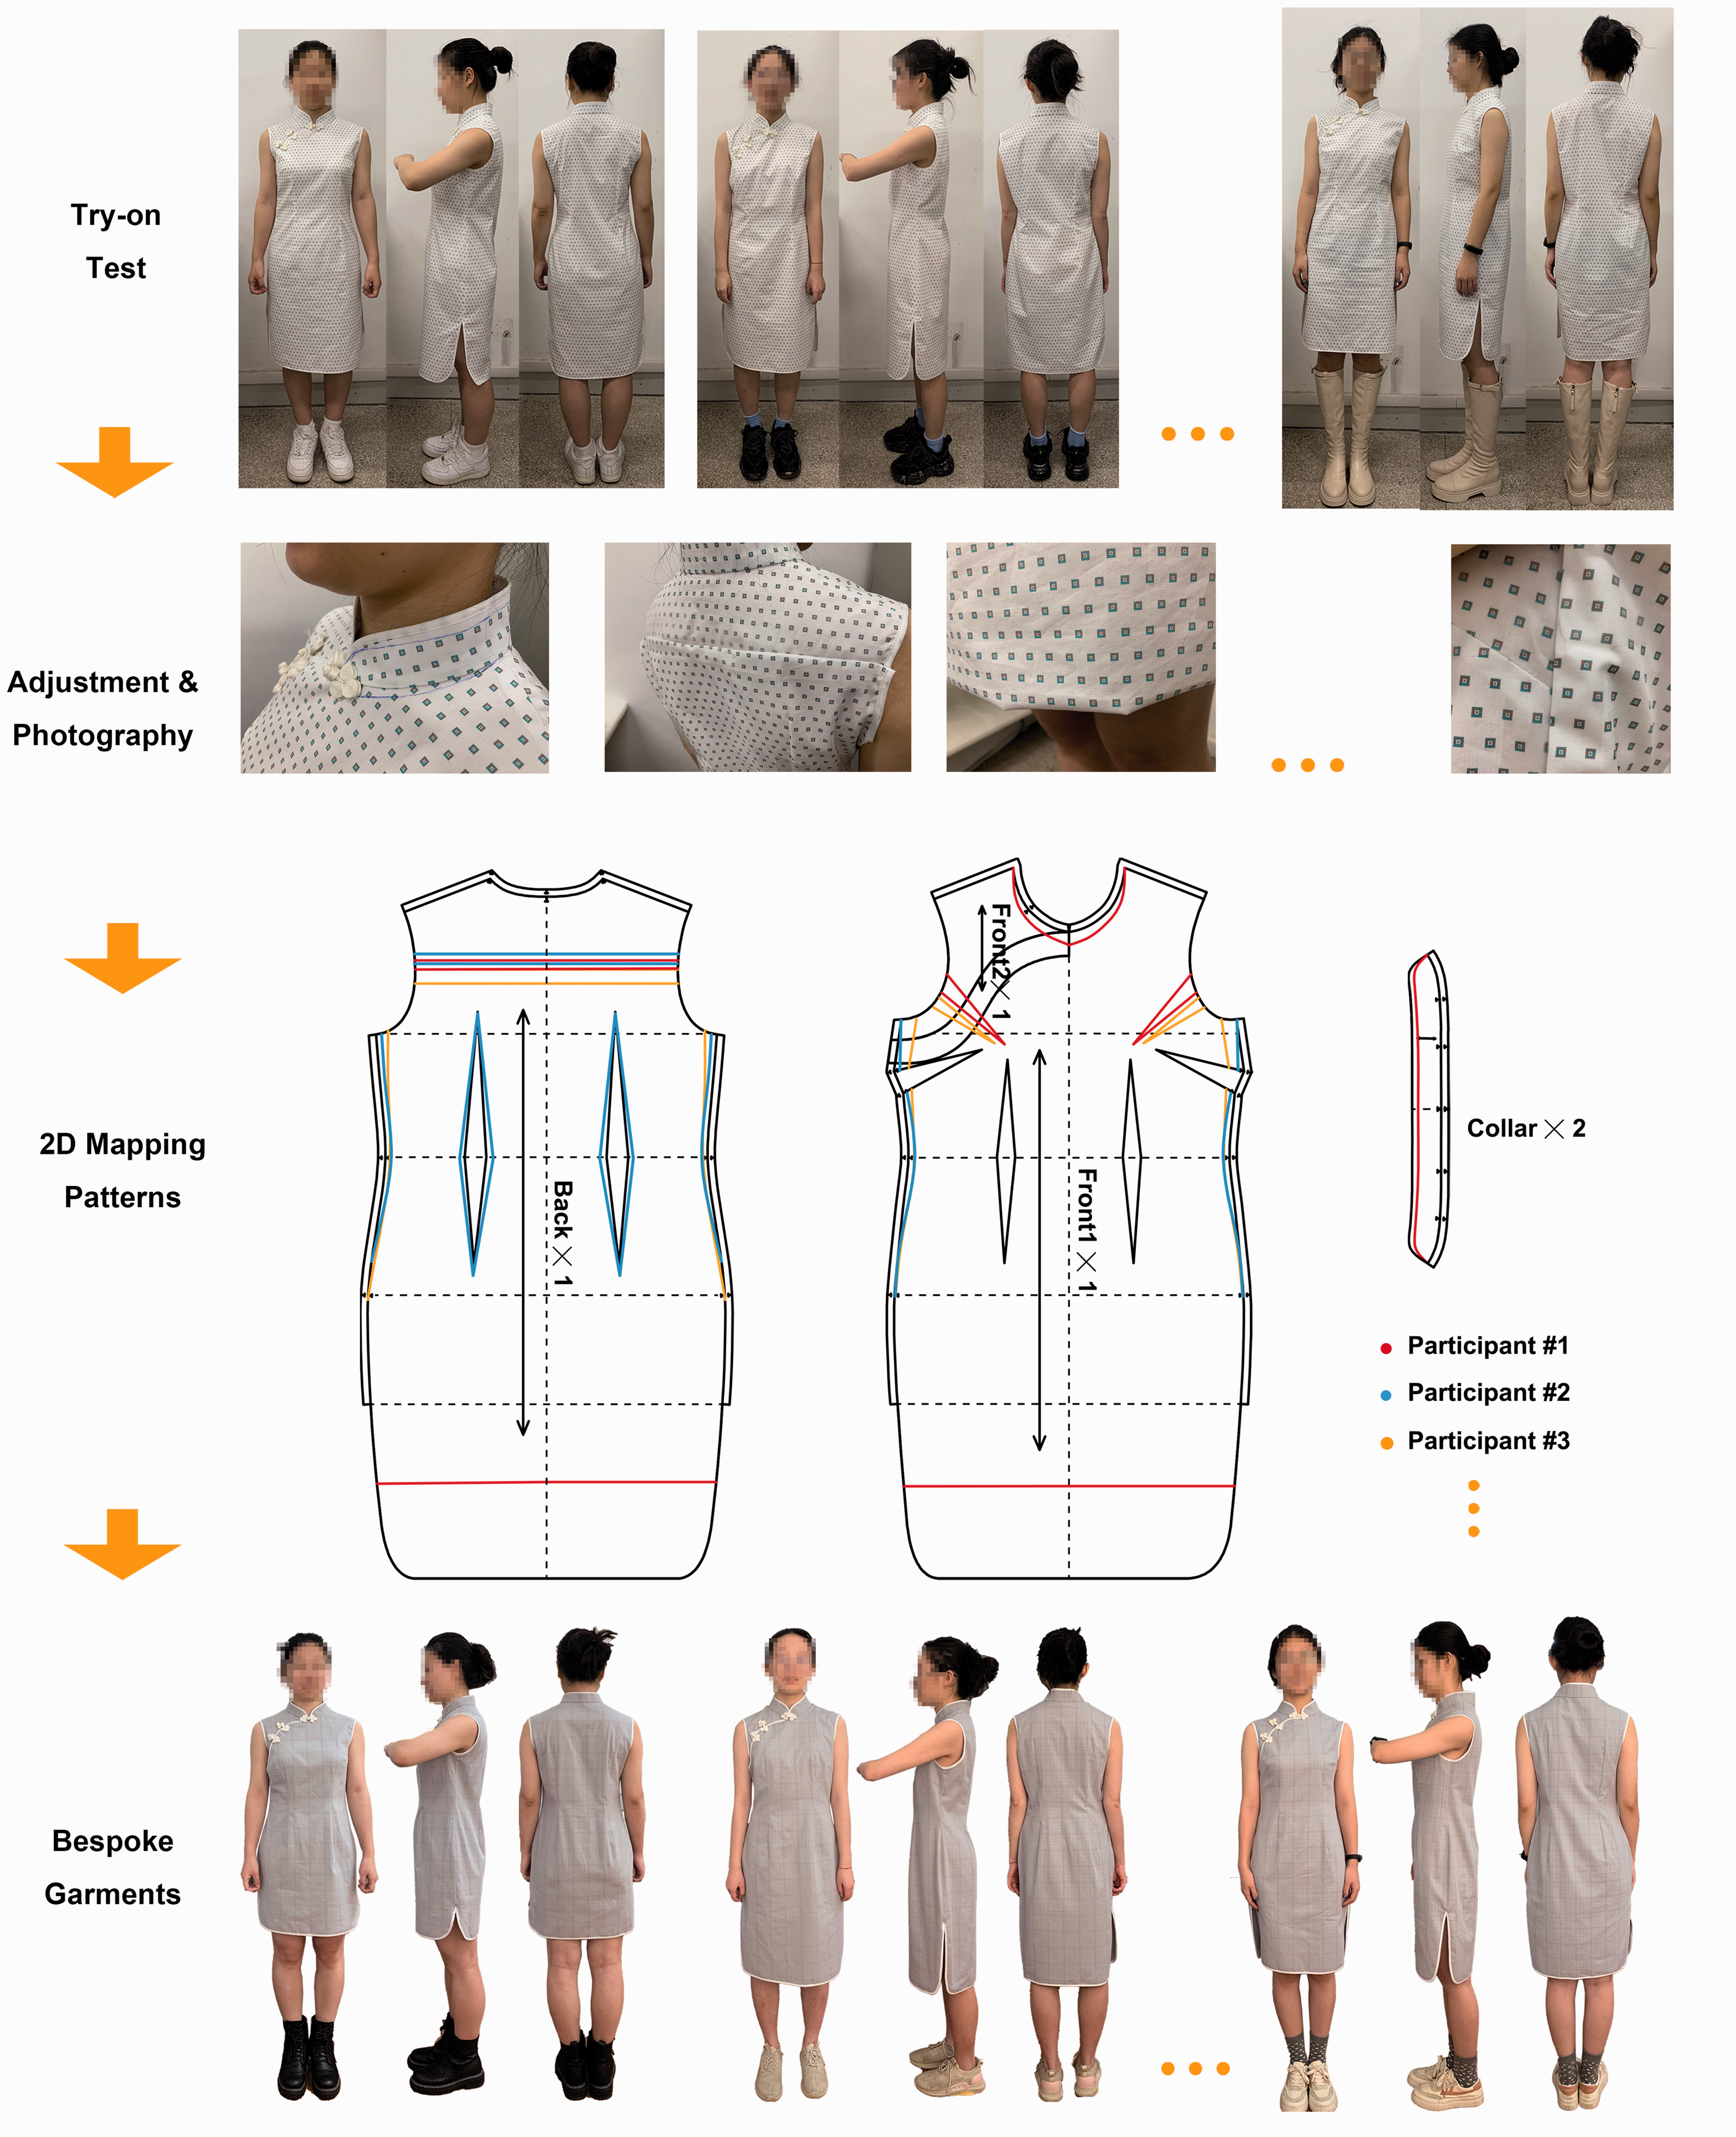
Try on test process. The 2D mapping patterns can be obtained by trying on the average size garment and taking images of the adjusted areas. 2D: two-dimensional.
Body measurements of subjects

For the first participant, the collar width was adjusted as her neck length is smaller than that of the average body. The garment showed an obvious forward slope, so we adjusted the back waist length of the garment. There was excess fabric around the chest, thus we adjusted the size of the chest dart. Also, she preferred a shorter Qi-pao style, thus we reduced the length of the garment.
For the second participant, the garment size is obviously large. As she preferred a loose style, we did not adjust the hip girth, but only the waist and bust girth at the side seam and double-pointed darts. She had a thinner back; thus, the back waist length was reduced.
The third participant preferred a tight-fitting style; hence we made a significant adjustment to the bust and waist girth of the garments. From the side view, the waist part was not fitting at the back of center. As there was no cutting line at the center back, we made the waist fitting by reducing the back length.
After adjusting the garment for different body types and preferences, we took pictures of the adjusted areas. The adjusted patterns could then be generated automatically. The try-on test of the bespoke garments based on the generated patterns showed a good fit. The test demonstrated that the proposed method proved to be accurate and showed promising results in bespoke garment development. The accurate mapping patterns could quantitively characterize the 3D form of garments.
Discussion
For garment manufacturing, it is important to both acquire quantitative information of 3D garments and establish relationships between 3D objects and flatted 2D patterns. 3D garment models can be obtained by various vision-based methods, but this incurs huge computational costs. Meanwhile, unfolding 3D surfaces to obtain 2D patterns is also a difficult problem. Obtaining 3D models and unfolding surfaces lead to unavoidable errors in mapping 2D patterns. Actually, both measurements and the mapping relationships can be acquired by accurate textile localization. Computer vision-based positioning methods are usually applied to indoor navigation, robot localization, mechanical visual systems, dimension measurements, etc., and few studies have focused on positioning of ROIs on flexible materials, mainly because flexible materials with the ability to bend easily exhibit great shape changes when made into products. Morphologic changes create difficulties in feature point recognition. In the proposed method, codes with localization information are attached evenly to the flexible material, enabling their positioning at any location, even with significant variations in morphology. The method is straightforward and computationally cheap in practice.
Although parametric and machine learning-based pattern generation methods are able to make patterns automatically, they lack understanding of the 3D garment structure and pattern generation process. This restricts those methods to fixed clothing styles. In contrast, since the proposed method directly establishes the relationship between 3D garments and 2D patterns, it can be used in various clothing styles and allows personalized patterns to be obtained without body dimensions.
Based on the monocular image, it is difficult for computer-vision methods to acquire metric information with a high level of accuracy. In some monocular image measuring methods, external camera parameters are calculated by several object coordinates of the targets with obvious features together with their pixel coordinates in the images. These methods are simple and highly efficient, but some of them require the internal and external parameters of the camera so that the measurement results are greatly affected by the environment. The proposed methods have no specific requirements for the camera and the shooting conditions. With the pixel distance of the adjacent codes, the magnification of the lens can be estimated accurately. The accuracy of the measurement can be improved by increasing the density of the codes.
Additionally, the proposed coded graphic is small in size to minimize the impact on the appearance of the garment. It is easy to locate and has high error correction capability. The coded graphic can be used on a variety of materials with different fabrication methods. With IR ink, the codes can be printed with an invisible effect. Alternatively, using water-soluble ink, the codes can be removed after product development. Also, there is no need to calibrate the camera in advance, as the codes on the material can be used directly as a benchmark.
Conclusions
We present an accurate mapping and quantifying system for flexible objects based on graphic codes with localization information. It was shown that the mapping shapes could characterize the 3D form of garments. A mini colorful code as a medium was proposed to demonstrate the position of the object. The image recognition processes of the method were discussed. The tests proved that the approach is an accurate and precise way to map the ROI in garment manufacturing.
The method proposed here is easy to use in obtaining 3D metric information and flattened 2D patterns, for flexible materials and other objects with shape variations. It provides a basis for the improvement of automated manufacturing for flexible industries, such as the apparel, home decoration and shoe industries, which are still labor-intensive and demanding of experience. In pattern making, the use of codes with positioning information enables users without expertise to acquire mapping patterns. In the product development of bespoke garments, the method allows customized patterns to be obtained without body size measurement with high efficiency.
Theoretically, our method can be used in different types of flexible material. But due to the potential effect of fabric stretching on the recognition of the coding graphics, the method needs to be modified to adapt to stretchy materials, adjusting the material preparation approach, code size, and rectification algorithms. Further work will aim to apply the method to knitted fabrics, which create a more stretchable structure. In addition to pattern making, the method can be used in the positioning for automatic sewing techniques, garment specification formulation and fabric deformation estimation. In other areas, the method can also be used in flexible 3D digital tablets and the positioning of robots. All of this suggests interesting directions for future research.
Footnotes
Acknowledgements
The authors would like to acknowledge the support of the Key Laboratory of Clothing Design and Technology, Ministry of Education, Shanghai, China.
Declaration of conflicting interests
The author(s) declared no potential conflicts of interest with respect to the research, authorship, and/or publication of this article.
Funding
The author(s) disclosed receipt of the following financial support for the research, authorship, and/or publication of this article: The authors would like to acknowledge the financial support from the Fundamental Research Funds for the Central Universities (Grant No. 2232022G-08).
