
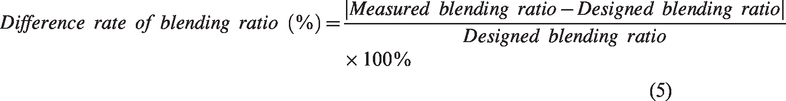
Abstract
The blending ratio and blending irregularity of the blended yarn determine its property and quality. In this article, the image processing method was introduced to accurately and conveniently measure the blending ratio and blending irregularity of blended yarn by using images of the blended yarn cross sections. The Euclidean distance peeling method was applied to segment the adhered fibers to make them individual. Then, the fibers were classified according to characteristic parameters of fiber cross section such as color, shape, and area. The experiments were implemented to verify the accuracy and applicability of the image processing method to test the irregularity of blended bundles, slivers, and yarns by different fibers including polyester, viscose, and wool. The results show that the fiber identification error rate of the image processing method for blended bundles, compared with the designed, is less than 2%; the blending irregularity difference rate between image processing method and the manual counting method is less than 5% for blended sliver by sliver blending; the difference rate of the blending ratio of polyester/viscose blended yarn between designed and measured by image processing method is less than 5%, while manual counting method is less than 10%. The findings mean that the image processing method proposed in this article can greatly save labor and time on identifying and counting fibers, and it is a more accurate, convenient, and reliable method to test blending irregularity.
Keywords
A variety of fibers are spun into a blended yarn, which can make the fibers complement each other’s performances and improve the property of yarn and fabric. The distribution of fibers in the yarn, in cross section (both radial and circumferential direction) and longitudinal direction, directly affects performance and the appearance of the yarn. Poor blending uniformity leads to evident color defects during printing and dyeing. In particular, the blending uniformity within the yarn directly affects the stretchability of the blended yarn. 1 Therefore, it is crucial to ensure the uniform distribution of each component fiber in the yarn in order to improve the property of the blended yarn. Blending irregularity was applied to characterize the degree of blending uniformity of each component fiber in a blended yarn.2–4
In early research studies, the chemical dissolution method was commonly adopted for measuring the blending irregularity of blended yarns. 5 This can reflect the difference in blending ratio on length segments, but it cannot characterize the fiber distribution in the yarn cross section. More importantly, this method cannot be applied for the identification of chemically similar fibers (such as cotton and linen blended yarn). The migration index (MI) 6 is used to characterize the internal and external transfer of fibers in the yarn cross-section, and some scholars7,8 also use it to express the distribution of fibers on the cross section. To calculate the MI, the cross-sectional image of blended yarns is segmented into five rings with equal width by the image processing method (IPM). The number of blended fibers in the annular area around the yarn cross section is manually counted, then the fiber migration index can be calculated. Deng et al. 7 compared the MI of the blended yarn made by two rovings blended and slivers blended (slivers blended for three passages in drawing), and found that they were basically the same. As is known to all, the blended yarn made by slivers blended was blended more uniformly. This indicates that the MI cannot accurately characterize the blending irregularity. Chollakupet al. 8 used the IPM to divide the cross section of silk/cotton blended yarns according to the yarn cross section in a “contour” direction, and then counted the number of fibers in each contour by the manual counting method (MCM) to calculate the MI, to investigate the blending of the yarn. Similarly, MI is calculated by counting the number of fibers per ring, so it can only characterize the internal and external transfer of fibers in the yarn cross section and cannot characterize blending irregularity truly and accurately. Moreover, in the process of obtaining the MI, the IPM was only used to divide mesh on the yarn cross section, so the number of fibers has to be counted by MCM, which consumes time and labor.
Currently, scholars have started to try to use IPM to calculate the blending irregularity of blended yarns directly. Luo and Li 9 proposed a random window method to measure the blending uniformity. In the blended yarn cross section image, some windows are randomly selected, and the uniformity calculated according to the variation of the fiber ratio in each window. Chiu et al.10,11 defined three indicators of radial, lateral, and angular distribution in the cross section of the PET/viscose blended yarn to characterize the blending uniformity by IPM. Watanabe et al.12–14 identified different colored fibers within the side view image of the blended yarn to measure the uniformity of fiber distribution on the yarn surface, while the fibers inside the yarn could not be identified. All of the above research studies focused on the blending irregularity only in yarn cross section9–11 or longitudinal section,12–14 not the total blending irregularity of yarn, i.e. the comprehensive picture of cross section and longitudinal section blending irregularity.
In our previous study,15,16 the multiple cross section image of blended yarn was divided into fan-rings with equal area, the blending uniformity or irregularity both in cross section (including radial and circumferential direction) and in longitudinal section of the blended yarns can be calculated. Thus, this method can be used to evaluate the blending irregularity more comprehensively. But, the number of fibers still needs to be counted out by the MCM, and if it is replaced by IPM, the time and labor cost can be greatly saved. When using IPM to count fibers, each fiber in the cross section needs to be identified first then to determine its category. Because of the squeezing and adhering of the fibers caused in preparing cross-sectional slices of blended yarns, the adhered fibers need to be segmented to individual before identification. Researchers17–19 proposed a light spot diffusion model to segment the adhered fibers, that is capable of identifying the component fibers in the polyester/cotton, viscose/cotton blended yarns. This is a light spot diffusion model 17 –19 which can separate different kinds of fibers by controlling parameters such as spot radius and step size, but since it detects the image only once, it is sometimes difficult to completely detect all the fibers in the image. After segmenting all fibers into individual fibers, the fibers can be easily identified and then classified according to fiber characteristic parameters. In studies of IPM for classifying fibers within blended yarns, fiber feature parameters such as color, 20 curvature, 21 etc. are often employed. Xu et al. 21 identified the rabbit hair/acrylic/viscose blended yarns based on fiber edge curvature and holes; Xu et al. 22 characterized the cross-sectional shape with geometric and Fourier descriptors and used characteristic parameters such as area, perimeter, circularity, rectangularity, and ellipticity as the basis for fiber classification. Yu and Xie23,24 identified polyester/hemp blended yarns, and used comprehensive indicators to discriminate. Dong and Xu 25 identified wool/silk blended yarn by the neural network algorithm which automatically detected and segmented adhesion fibers by boundary curvature analysis, but it can only be applied to fibers with large differences in edge curvature. Wei and Hong 26 distinguished the red wool/purple cashmere blended yarn by the difference in fiber color and diameter size used in the Hexcone model, i.e. Hue, Saturation, Value (HSV) model. Lu et al. 27 used the roundness analysis algorithm to classify the fiber varieties based on the roundness of each fiber, but the adhesion between fibers was not separated, and the recognition rate of fibers was low.
In this article, the IPM was investigated to measure the blending irregularity of the blended yarn. Firstly, the Euclidean distance peeling method was implemented to divide the adhered fibers. Then fibers were classified according to characteristic parameters such as fiber color, cross-sectional shape, and cross-sectional area size. Finally, the yarn cross section was divided into fan-rings with equal areas and the blending ratio within each area was calculated, respectively. By calculating multiple cross section images, the blending irregularity of blended yarns can be calculated comprehensively both in longitudinal section as well as cross section of the yarn. This method can greatly reduce the errors caused by subjective factors and, at the same time, can measure blending irregularity of blended yarns accurately, conveniently, and in a time-saving manner.
Experiment
Materials
Polyester and viscose fibers were purchased from the Shanghai Defulun Chemical Fiber Co., Ltd, and black wool and white cashmere were purchased from the Tongxiang Xinao Group. Fiber parameters are listed in Table 1.
Parameters of fibers
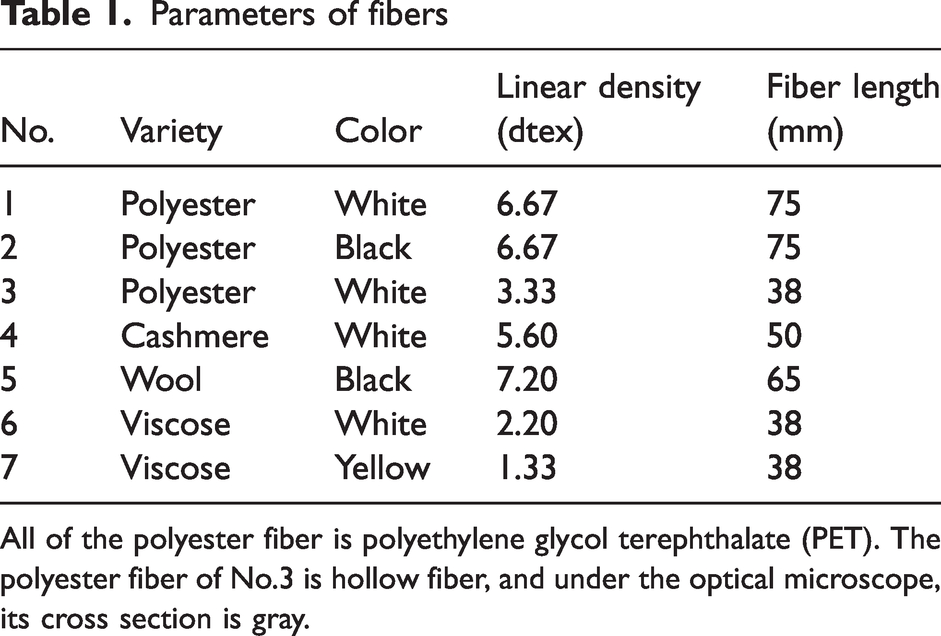
All of the polyester fiber is polyethylene glycol terephthalate (PET). The polyester fiber of No.3 is hollow fiber, and under the optical microscope, its cross section is gray.
Methods
Fiber identification verification
A polyester/wool bundle was made up of 100 white polyester fibers (No.1 in Table 1) and 100 black wool fibers (No.5 in Table 1) that were selected and mixed manually. The same method was taken to make a cashmere/viscose bundle consisting of 80 white cashmere fibers (No.4 in Table 1) and 100 white viscose fibers (No.6 in Table 1). The MCM was used to count the number of each component fibers on the original images. The IPM was used to treat the images of bundles cross section and then identify the fibers and statistic fiber numbers, to verify the accuracy of fiber identification by IPM.
Verification of blending irregularity
Black polyester fibers (No.1 in Table 1) and white polyester fibers (No.2 in Table 1) were carded to form black polyester slivers and white polyester slivers respectively. Then they were blended in the drawing (through four passages). Two feeding arrangements in the first drawing were adopted, as shown Figure 1. Where, “W” indicates a white polyester sliver with weight of 7.08 g/10 m, and “B” indicates a black polyester sliver with weight of 7.30 g/10 m. Then, the blended irregularity of each blended slivers was calculated by MCM and IPM, respectively.
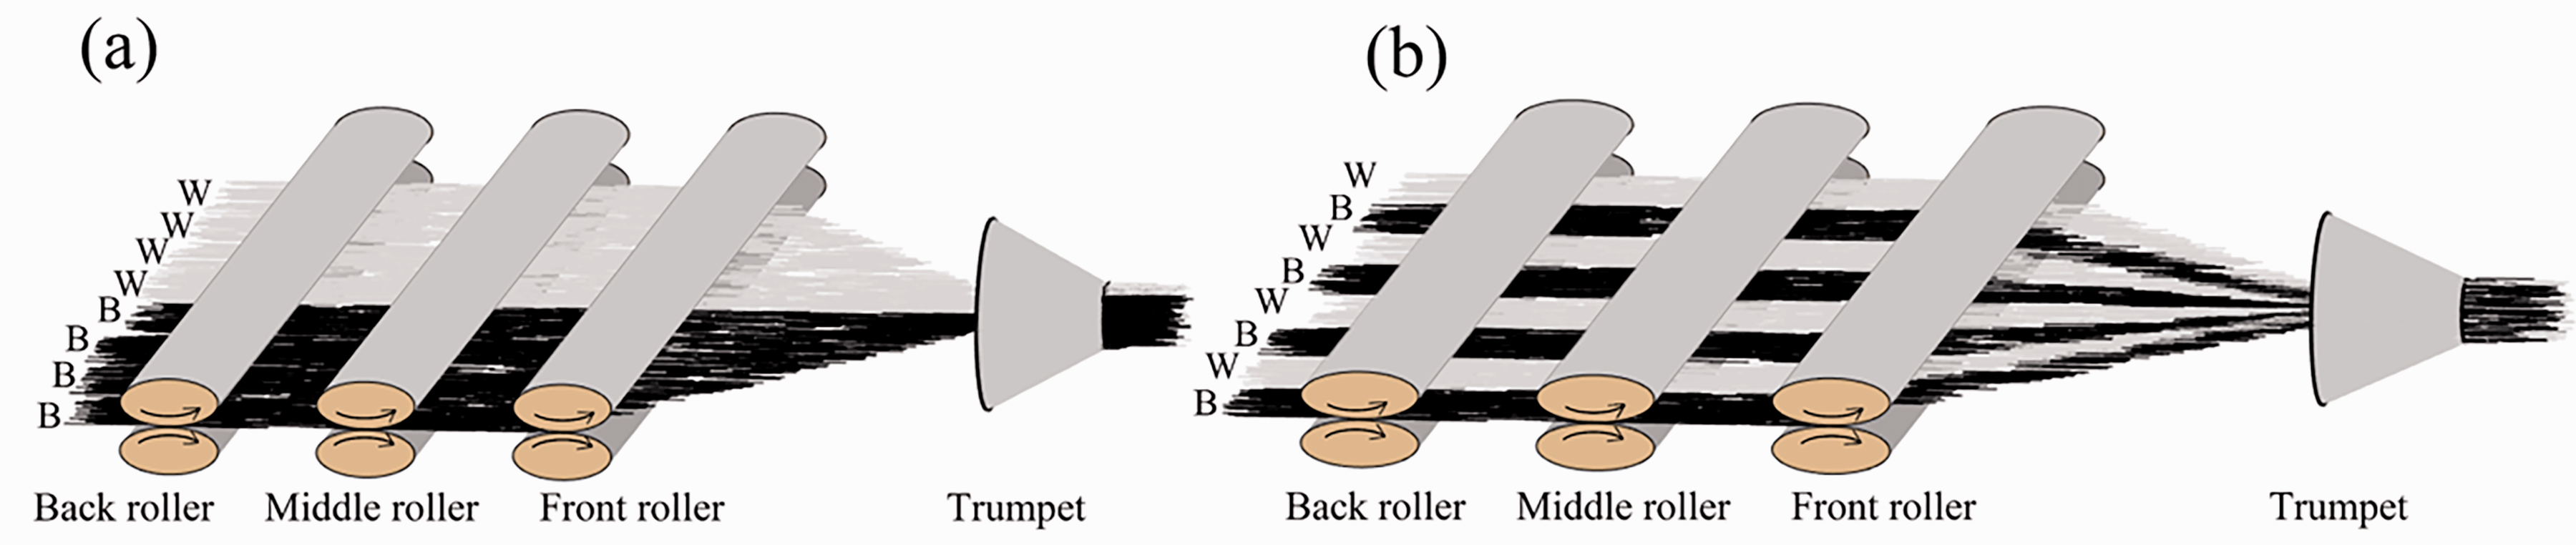
Arrangement of feeding sliver in the first drawing: (a) component slivers are arranged “separately” and (b) component slivers are arranged “alternately.”
Applicability verification
The white polyester (No.3 in Table 1) and yellow viscose (No.7 in Table 1) were carded to form slivers respectively, then blended in drawing (through three passages). Subsequently, 20 tex with a blending ratio of 40/60 blended yarn was produced by roving and spinning. Furthermore, polyester/viscose blended yarn (18 tex) and ramie/wool blended yarn (16 tex) were collected from Yuzhu Co., Ltd, and fiber parameters were unknown. They both had a nominal blending ratio of 50/50, but their tested blending ratios were usually different, because of the error caused by yarn production. The measured blending ratio and blending irregularity of above three blended yarns were calculated by IPM and MCM, respectively. Comparing with the nominal blending ratio of the three blended yarns, the accuracy and applicability of the IPM proposed in this article was verified.
Image preparation
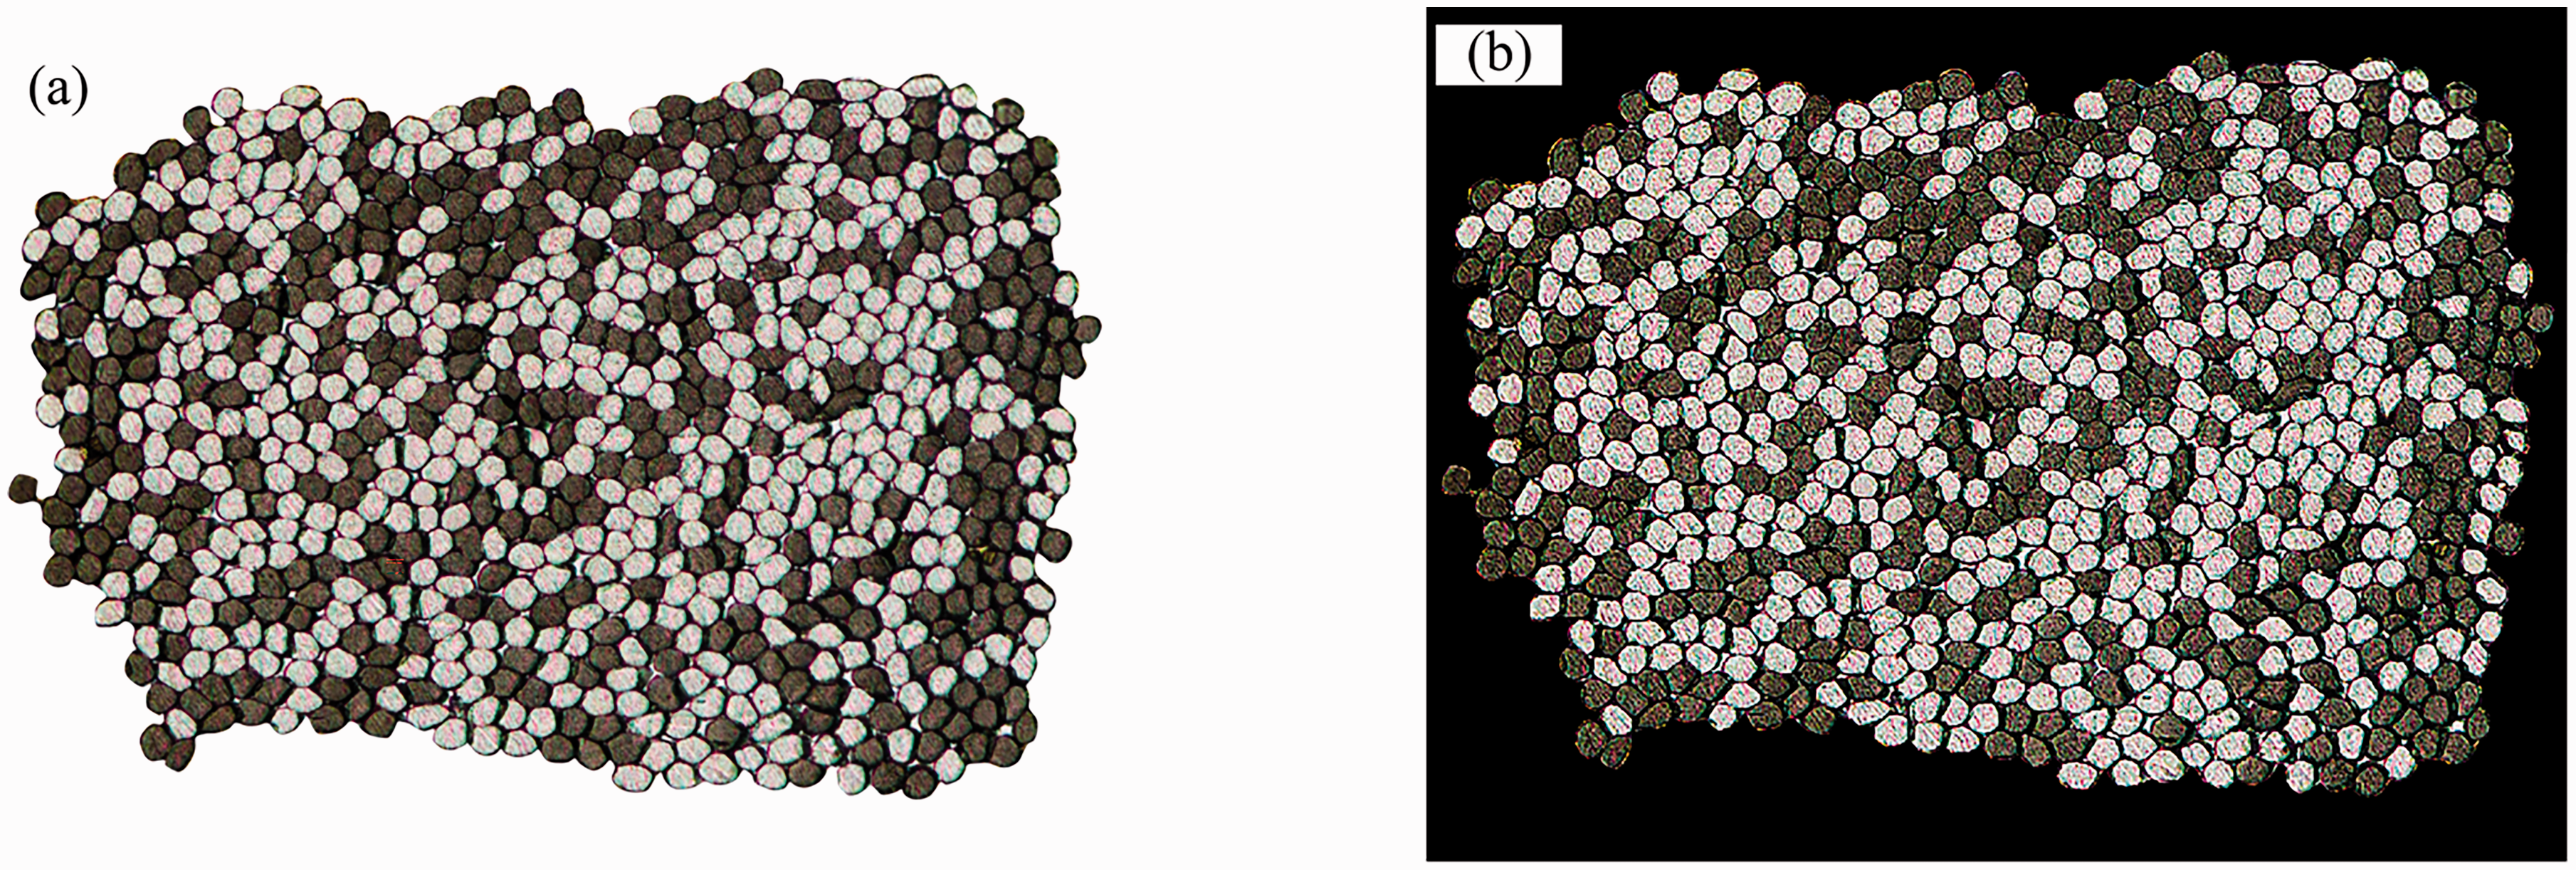
The cross-sectional image of the sliver with cover fibers taken by a microscope is shown in Figure 2(a). For convenience in the calculation, the covered fibers were removed by Photoshop software, as shown in Figure 2(b).
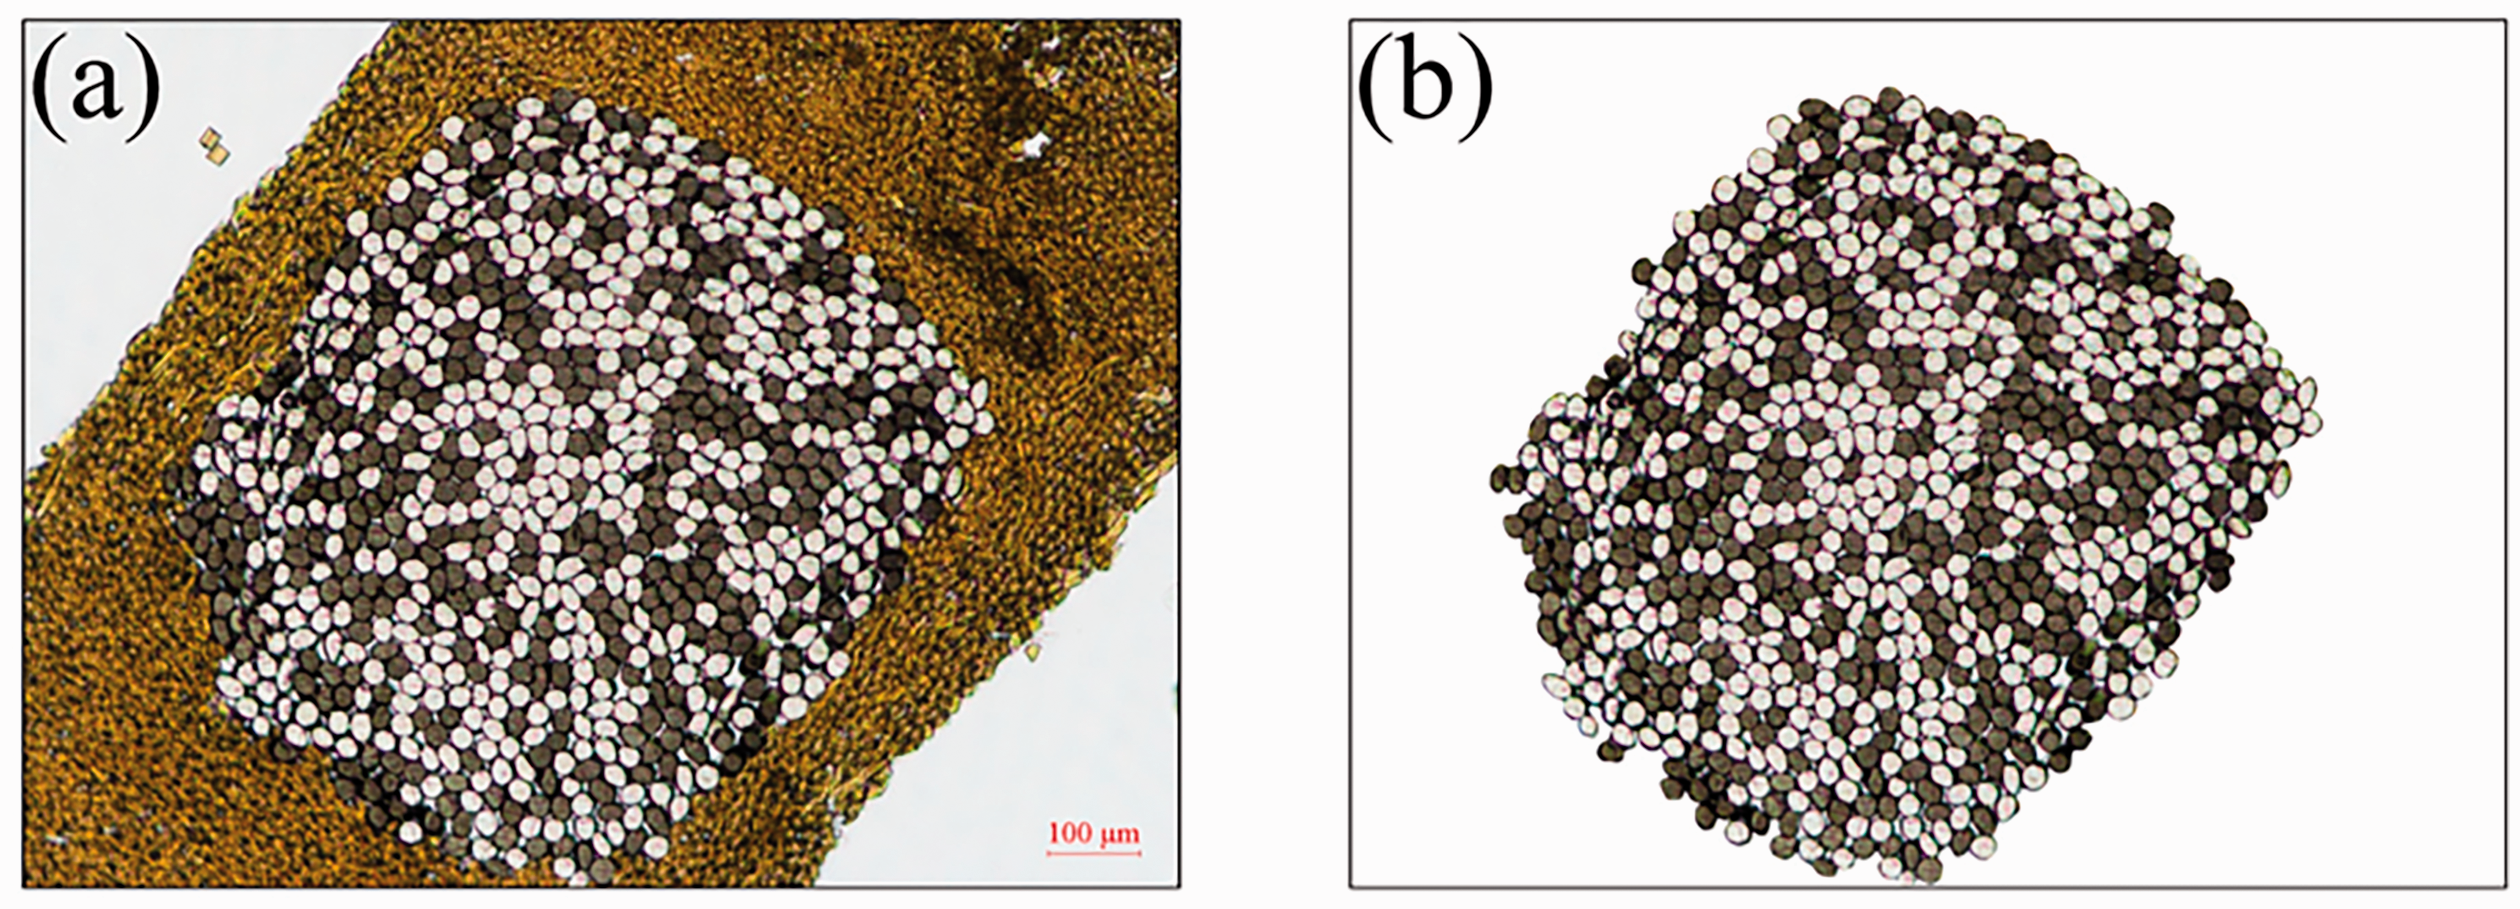
Cross-sectional image of sliver: (a) cross-sectional image of sliver with covered fibers and (b) cross-sectional image of sliver without covered fibers.
Blending irregularity calculation
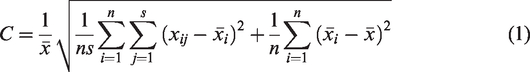
According to the test method of blending irregularity proposed in our previous study,15,16 the yarn/sliver was divided as shown in Figure 3, and the blending ratio of each component fiber in each fan-ring was measured respectively. As mentioned in previous studies,15,16 the blending irregularity of smallest component was used to express the blending irregularity of the blended yarn. Substituting the ratio of blending within each fan-ring of the smallest components into formula (1), the blending irregularity C can be calculated.
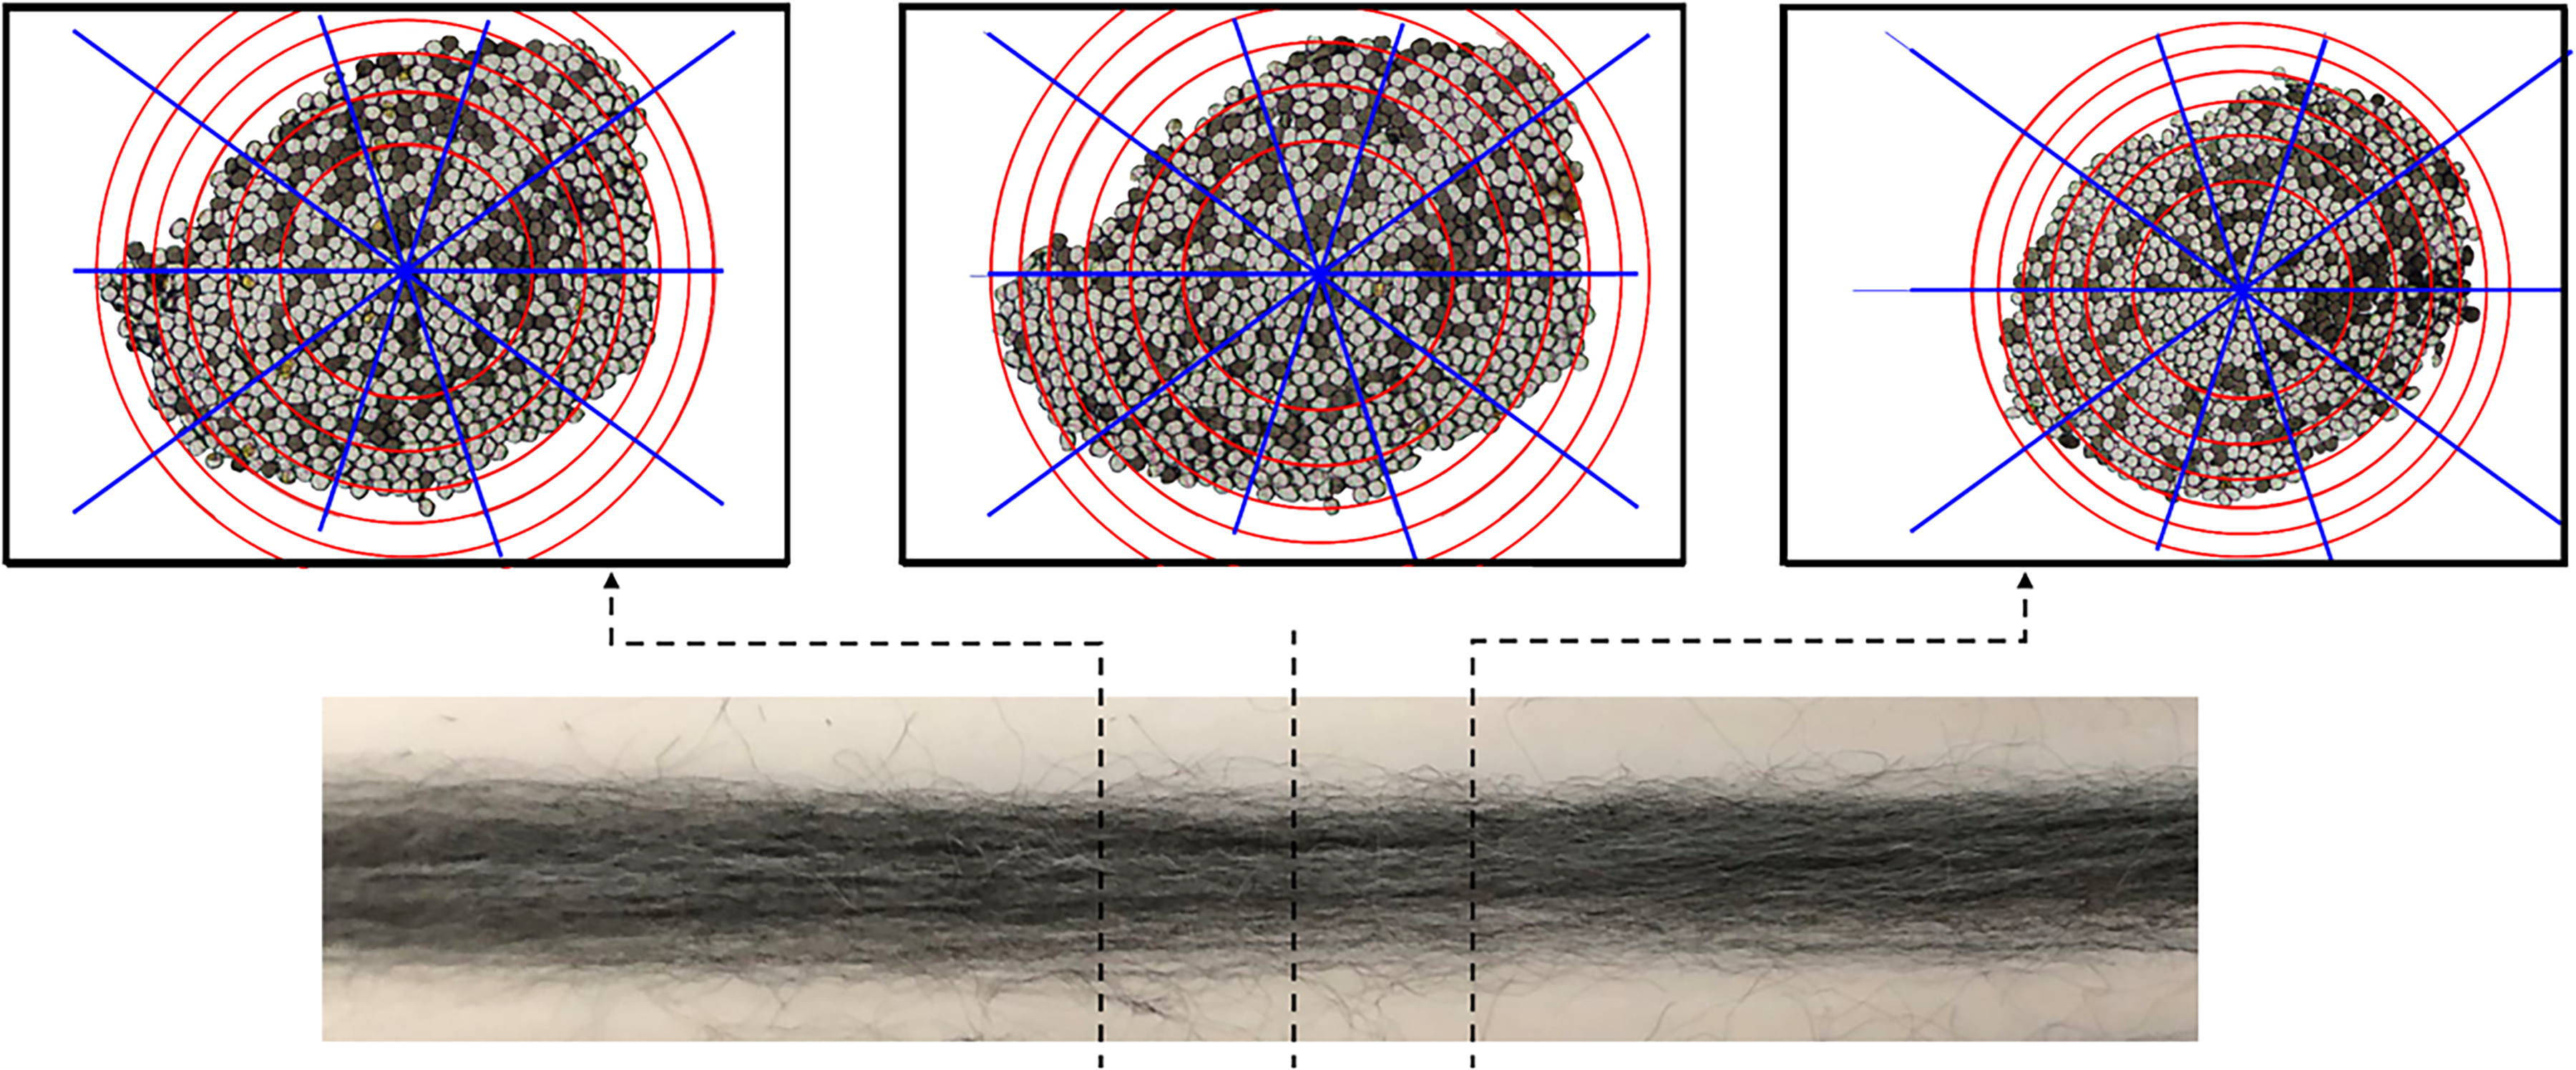
Sliver division method (where n = 3, s = 6 × 10).
Image processing method for blending irregularity
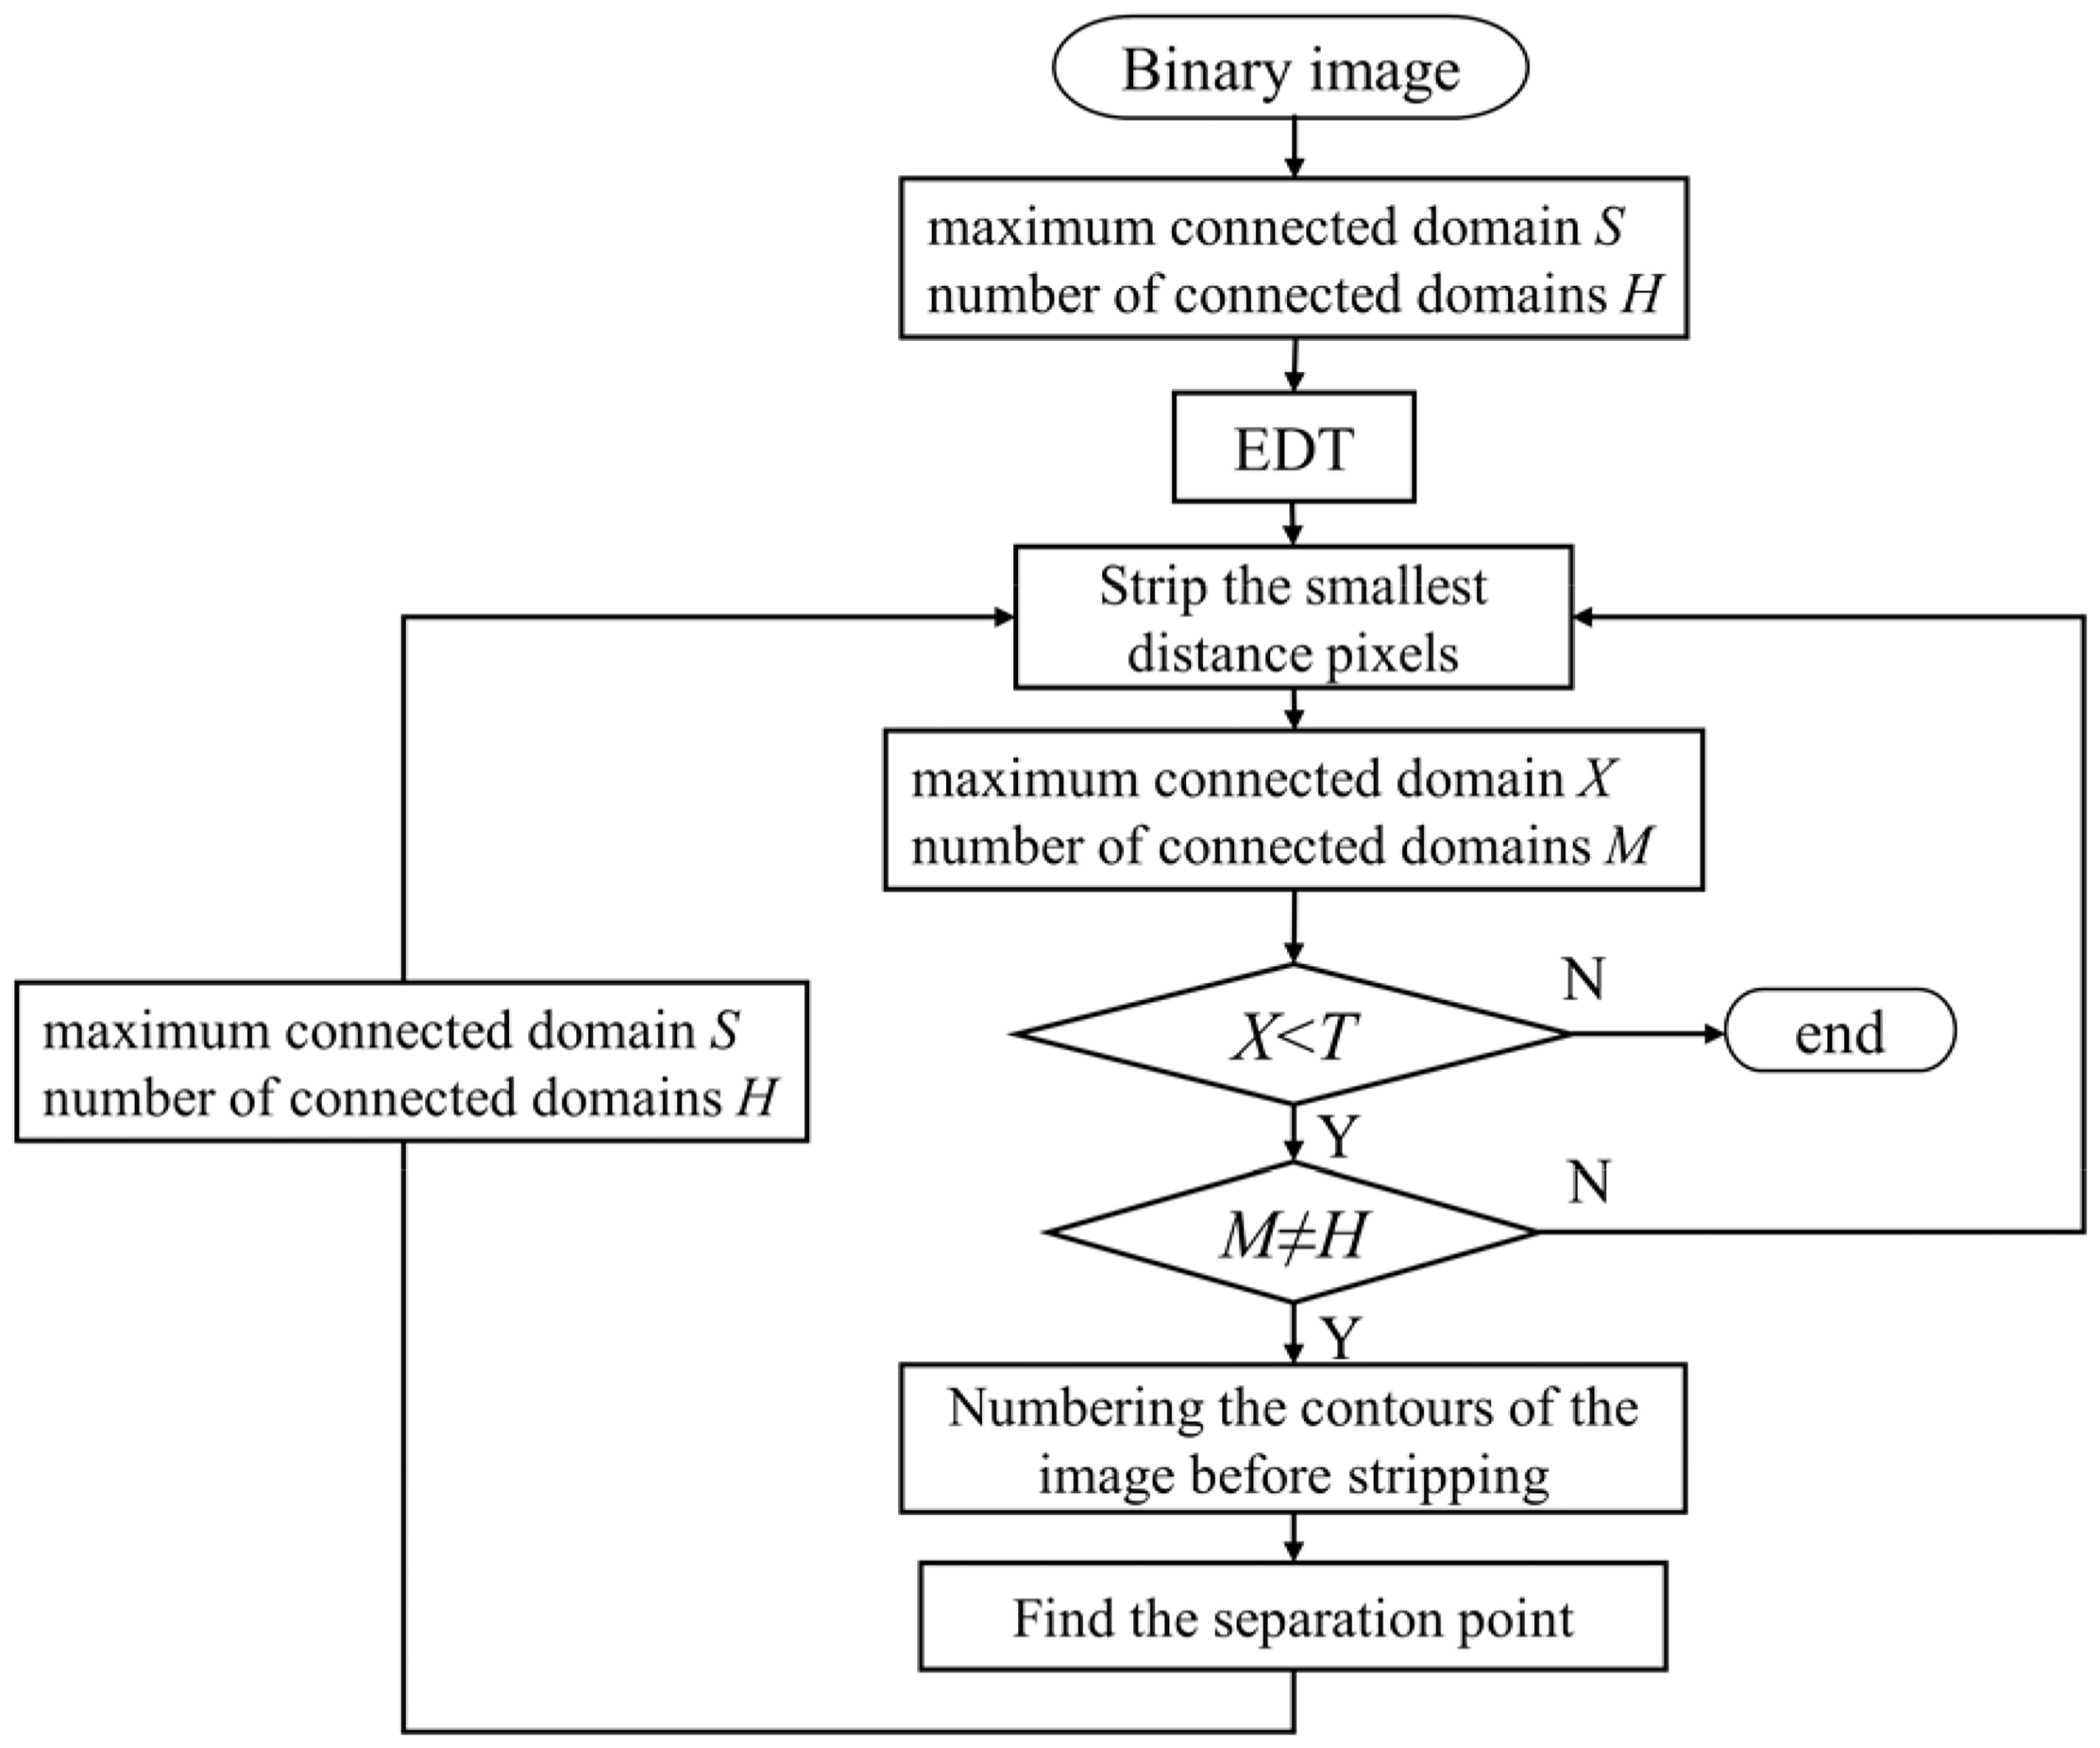
The IPM, developed to identify fibers and calculate the blending irregularity of the blended yarn, includes five steps, and the flow chart is shown in Figure 4.
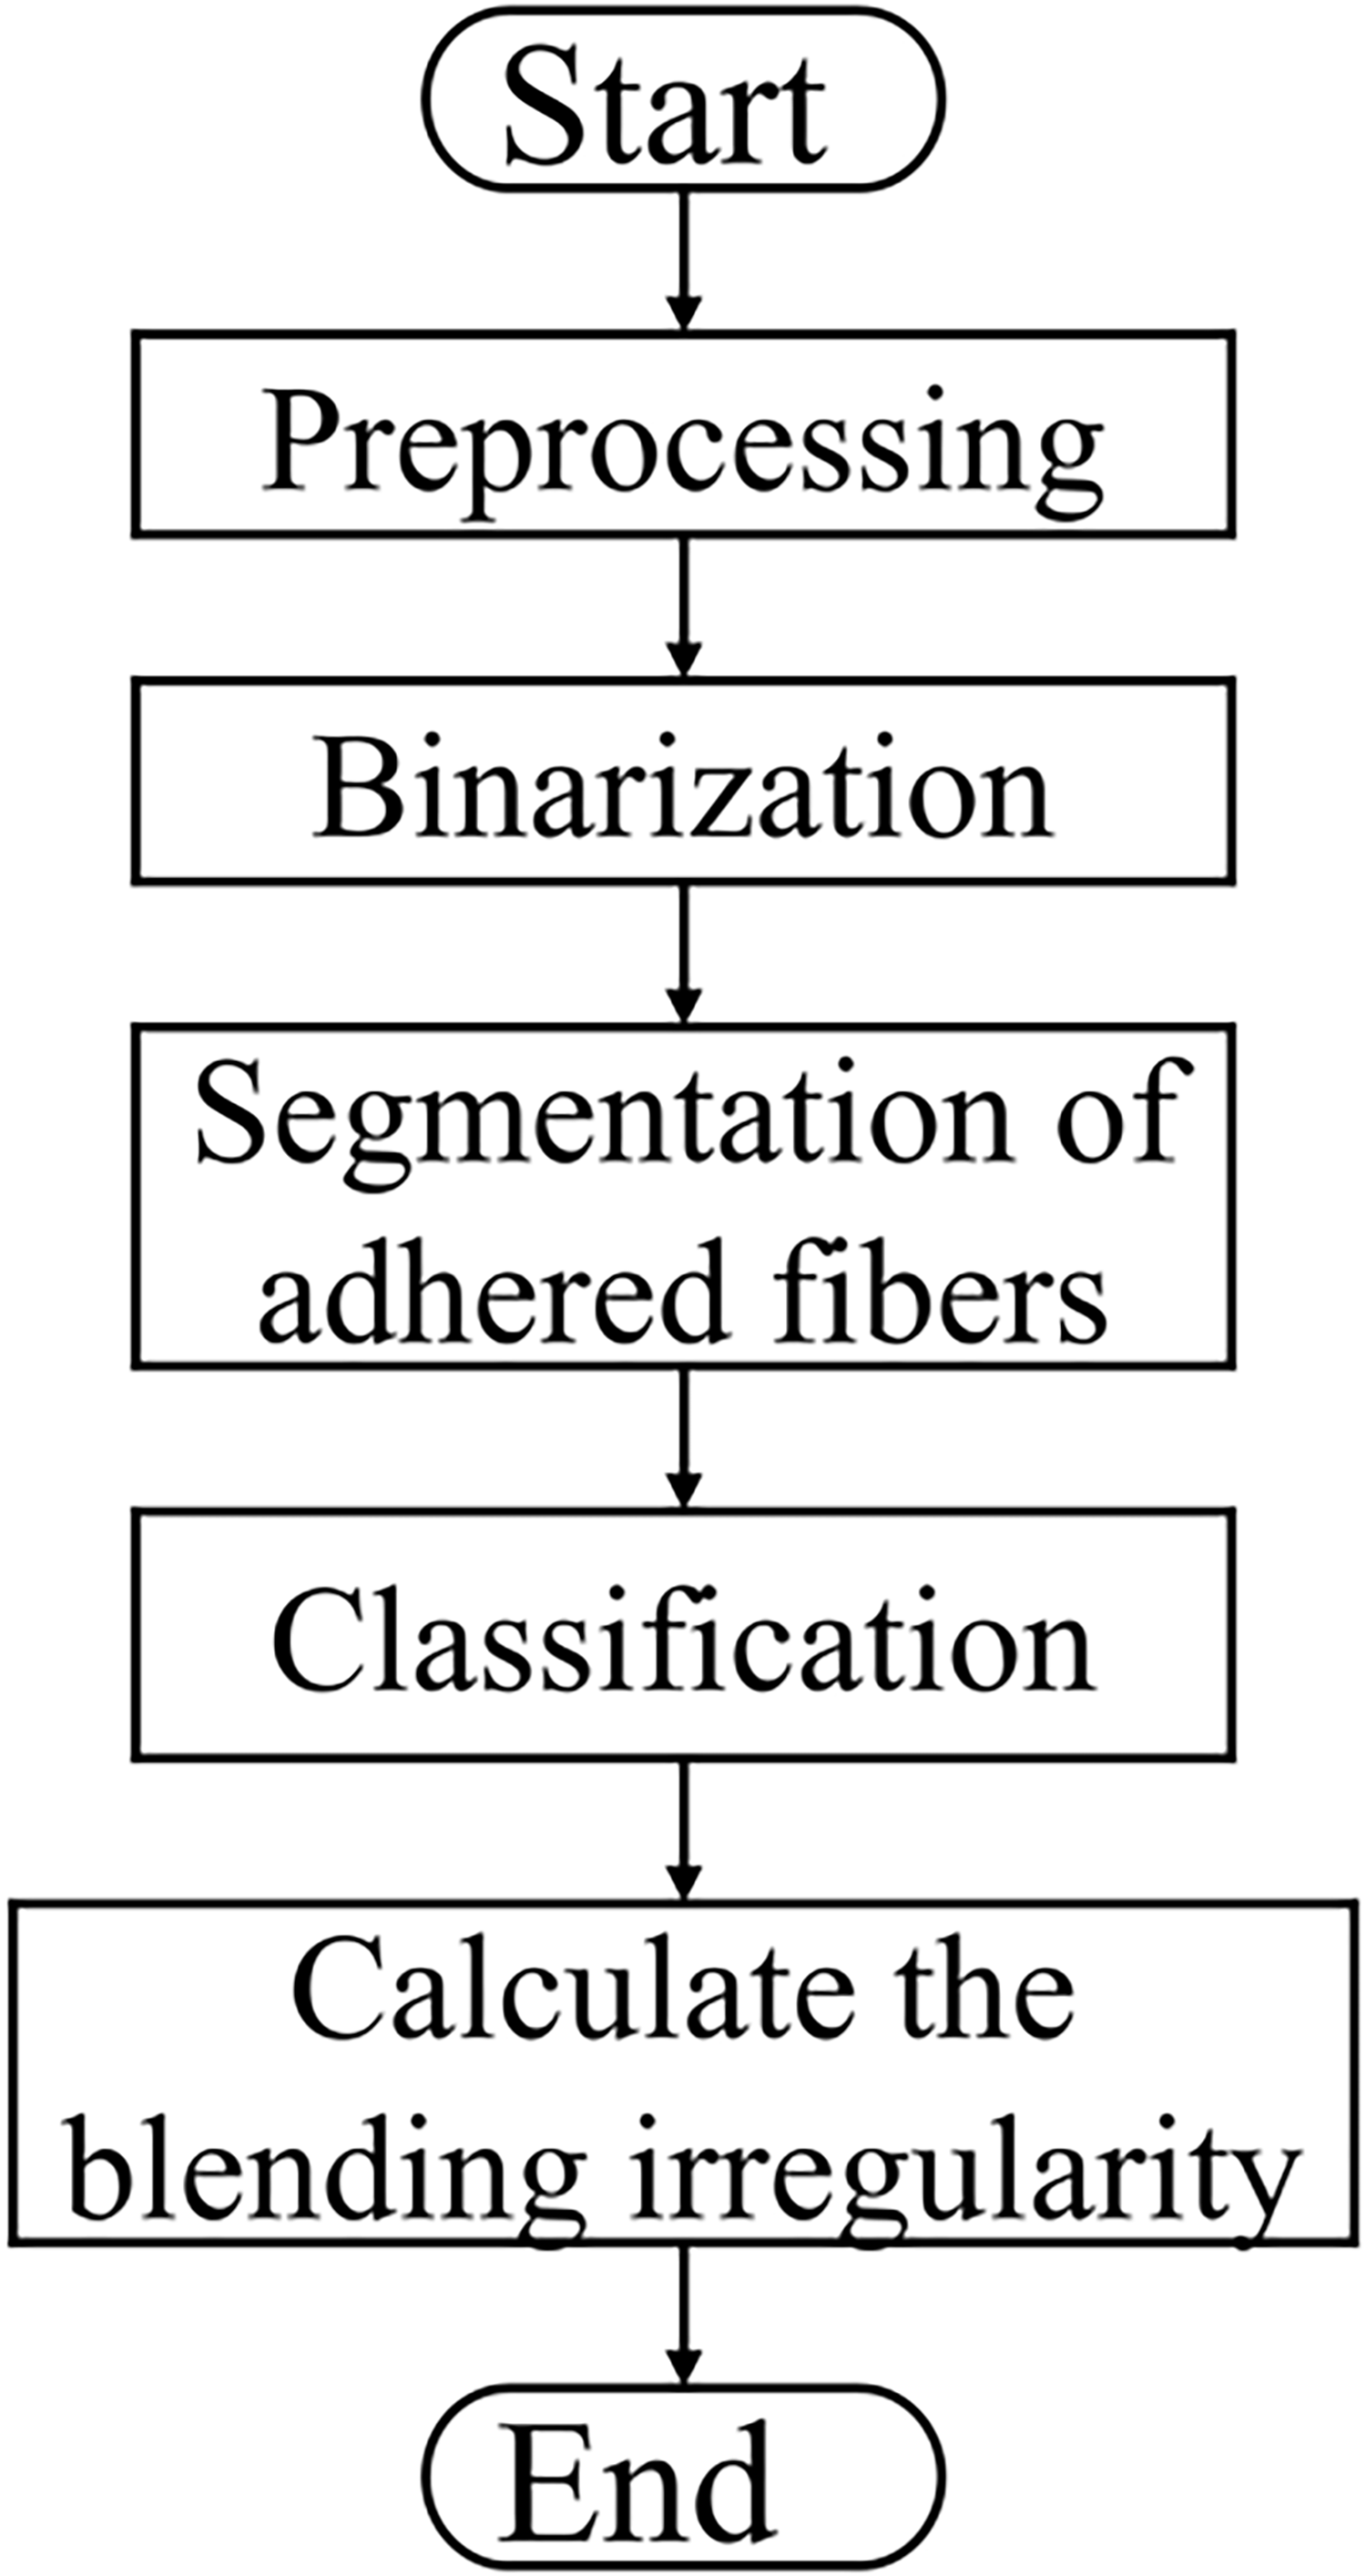
The flow chart of the image processing method (IPM) for blending irregularity.
Step 1: Preprocessing
Preprocessing of images can eliminate irrelevant information in images, retain useful and true information, and enhance the detectability of relevant information, thus improving the reliability of feature extraction, image segmentation, matching, and recognition. In this article, Laplacian image enhancement was utilized to process the details and gradient enhancement was carried out to highlight the edges in the image (Figure 5).
The sliver cross-sectional image: (a) original image and (b) enhanced image.
Step 2: Binarization
Red, Green, Blue (RGB) color mode was used in the IPM. For an image with two or more different color fibers, a binarized image of different color fibers can be obtained by selecting a threshold for each of the three RGB components and superimposing that three components. The binarized pixel point of black fiber was set to 0.5 in this article, for the convenience of observation, as shown in the gray part in Figure 6. Compared to grayscale, this three-component calculation is more useful to distinguish the different color fibers more accurately.
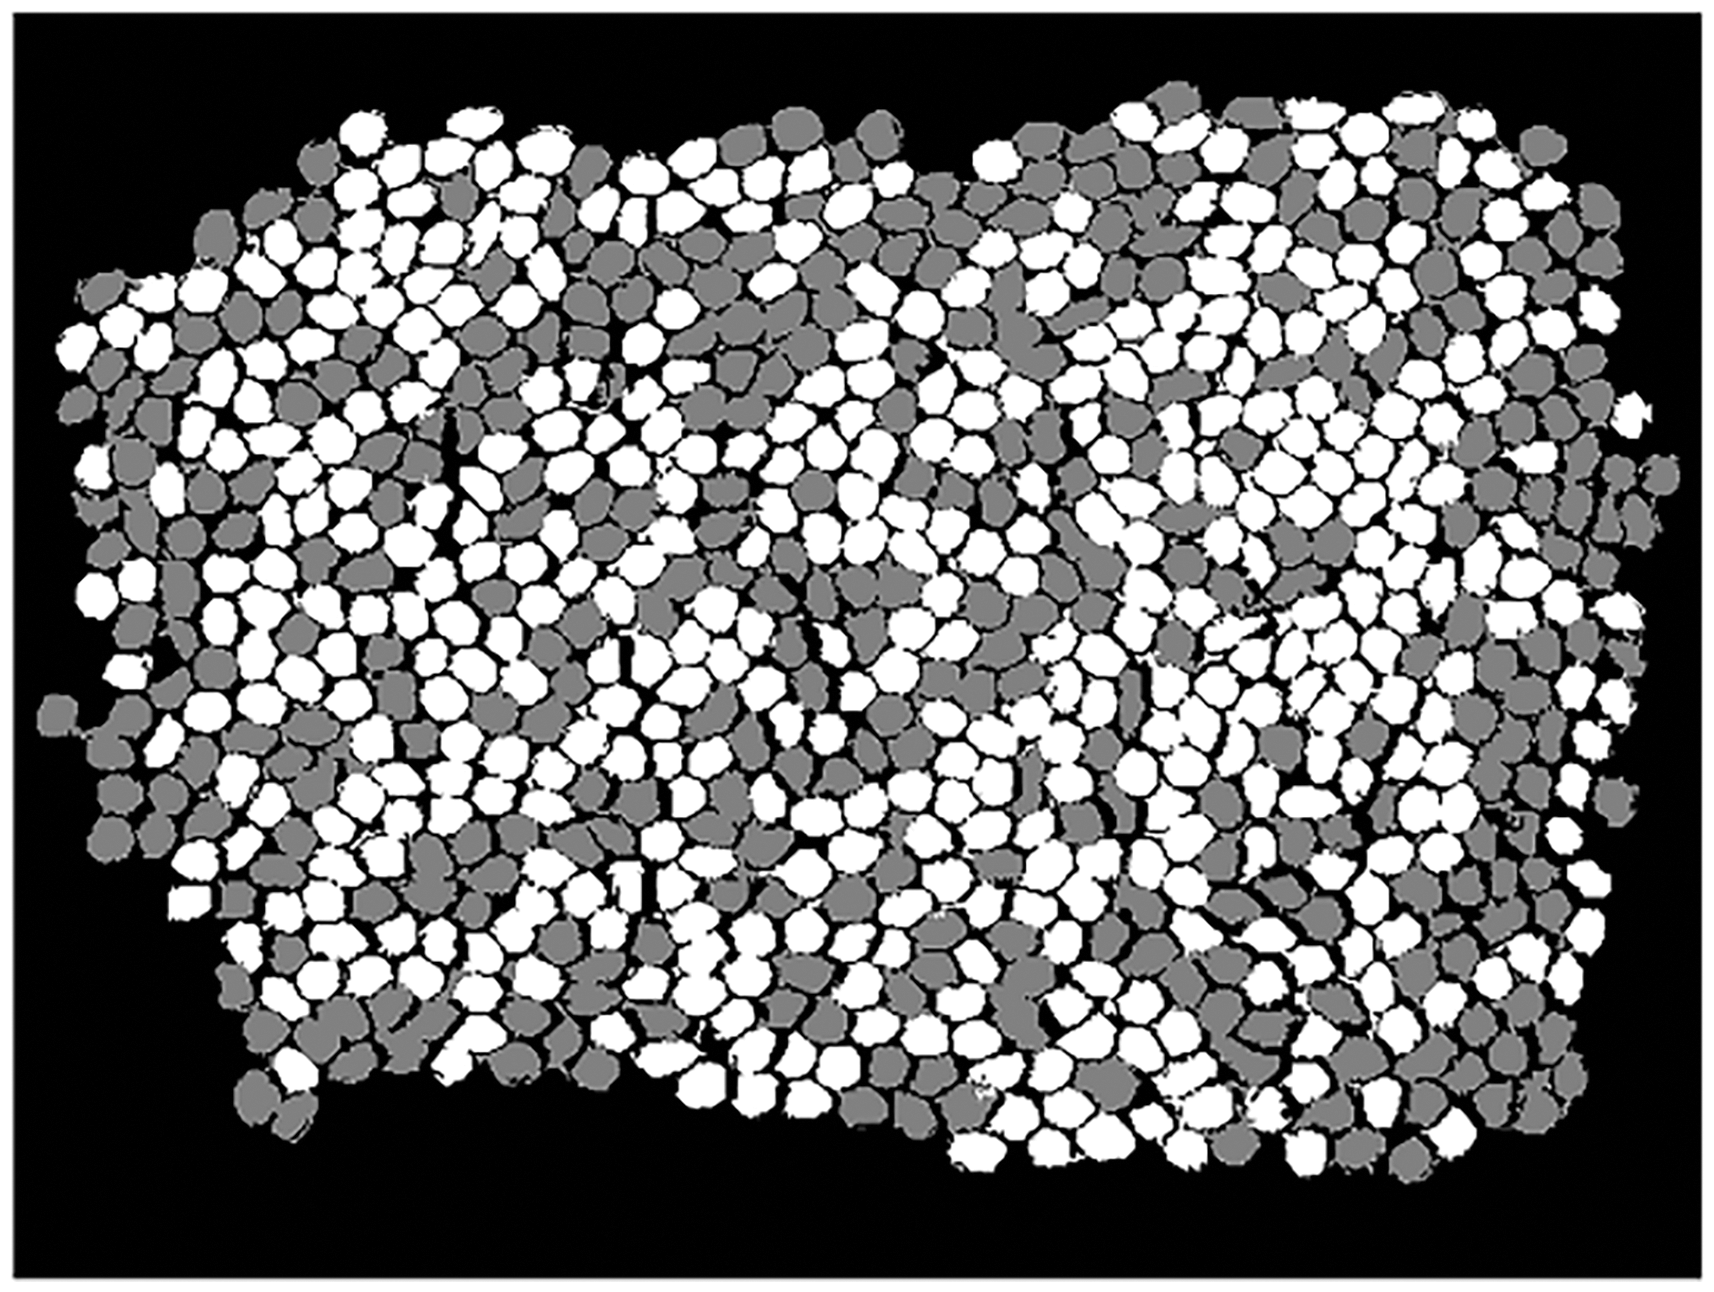
Binarization image.
Step 3: Segmentation of adhered fibers
The fibers in the yarn were wrapped inside by the covered fibers when making the slices, which squeezed to some extent, resulting in close contact between fibers, and presenting two or more fibers connected into a connected domain on the images, as shown in Figure 7(a). Especially, in the case of different variety but the same color fibers were adhered, the fibers cannot be distinguished, so the adhered fibers need to be segmented.
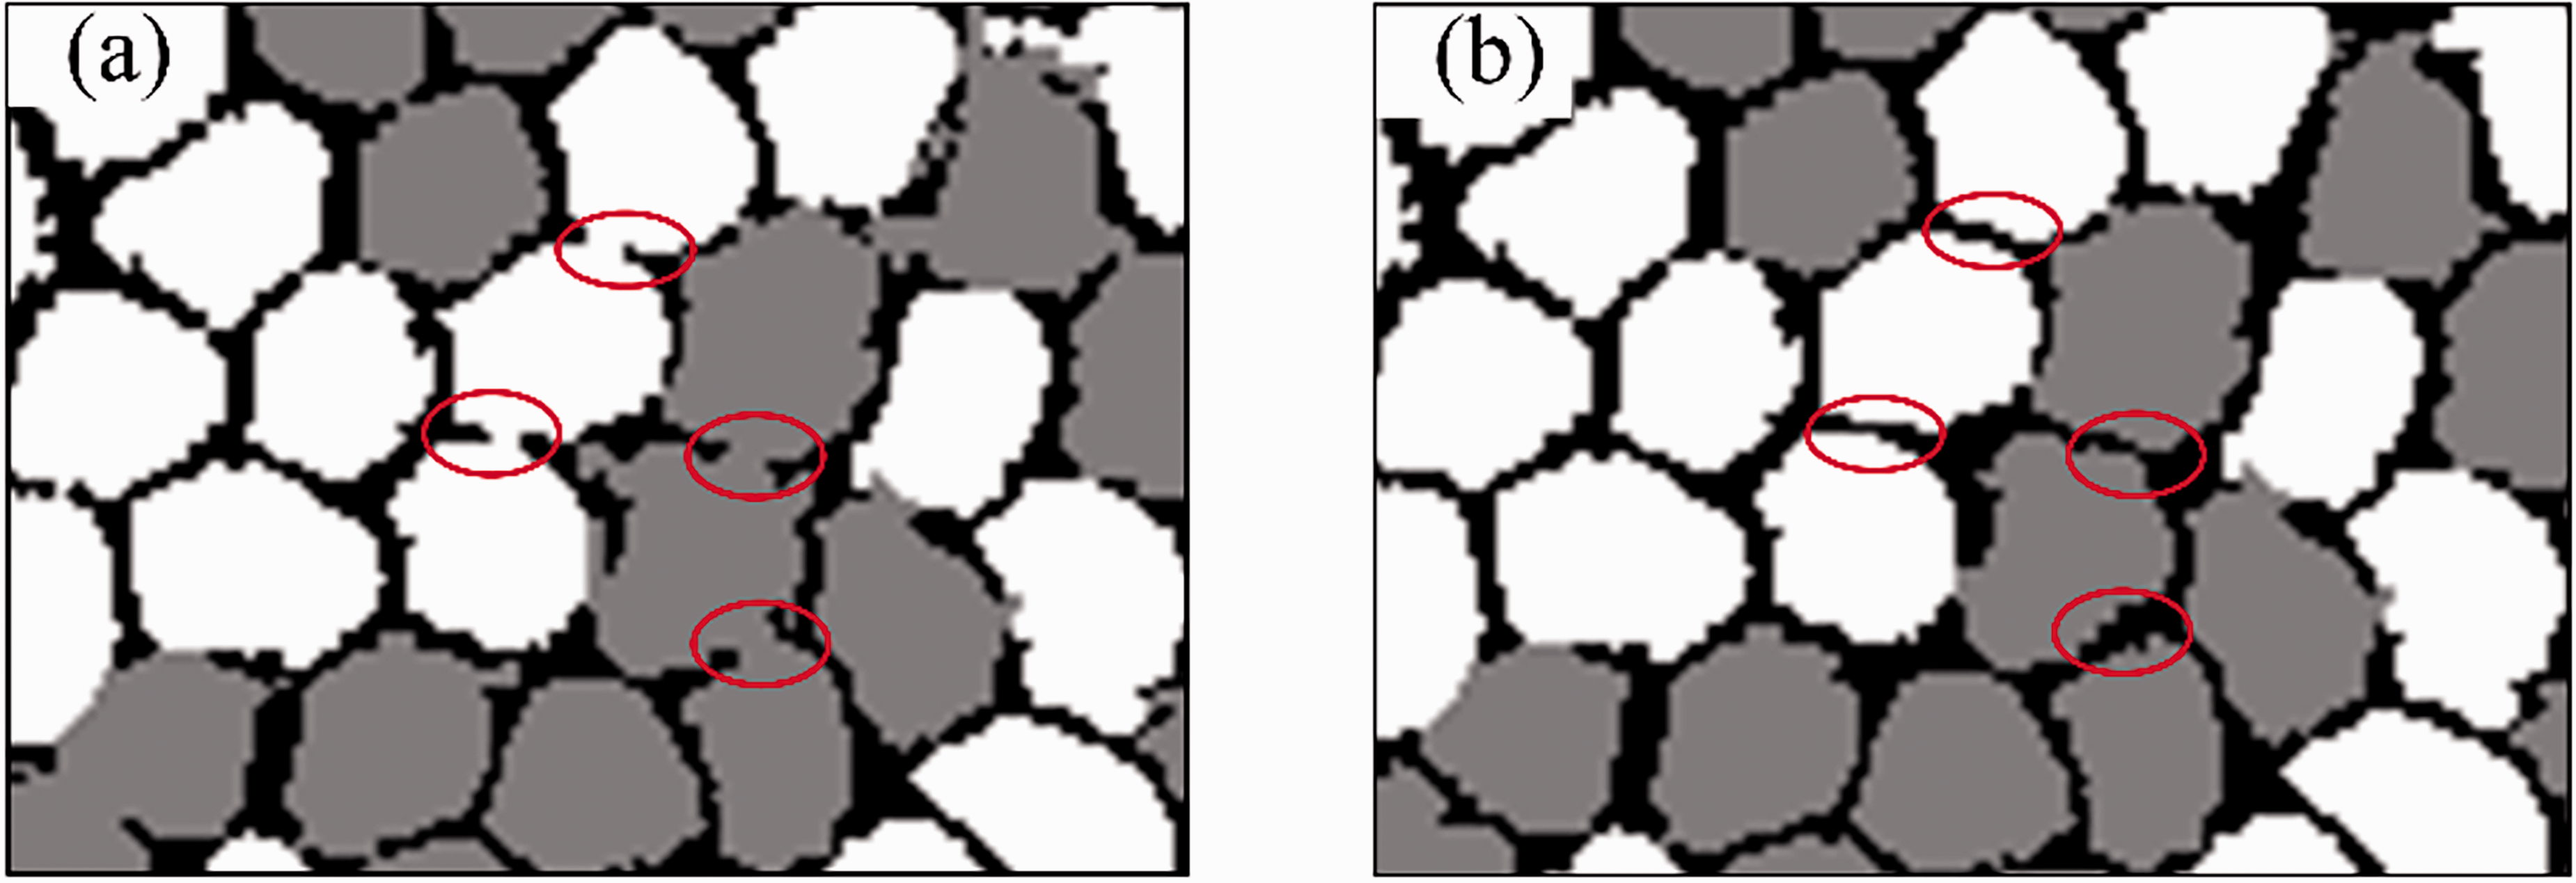
(a) Fiber adhesion and (b) after segmentation.
In this article, the Euclidean distance peeling method was successfully performed to segment the adhered fibers. According to the Euclidean distance transformation (EDT) map of the original image, the pixels with the minimum distance were deleted in ascending order of distance, and this process was called peeling. If the connected domain changes to two or more after a certain peeling deletion, then this peeling-deletion pixel must contain the pixels that ensure the connectedness of the adhered fibers, which are defined as separation points. 28 The contours of the connected domain before this deletion were sequentially coded (green coding in Figure 8), and the outer contours of the “holes” in the connected domain were sequentially recoded (red coding in Figure 8). A pixel that had two codes with a difference greater than two (orange pixels in Figure 8), or the two or more pixels (blue pixels in Figure 8) that encode a difference greater than two to each other as a four-neighborhood were the separation points. Based on this feature, the separation point can be derived, and finally, the separation line was determined according to the gradient direction, and then the adhered fibers were separated. The segmentation process of the adhered fibers is given in Figure 9. For the fiber, images of different colors were processed separately according to the binarized image as shown in Figure 10.
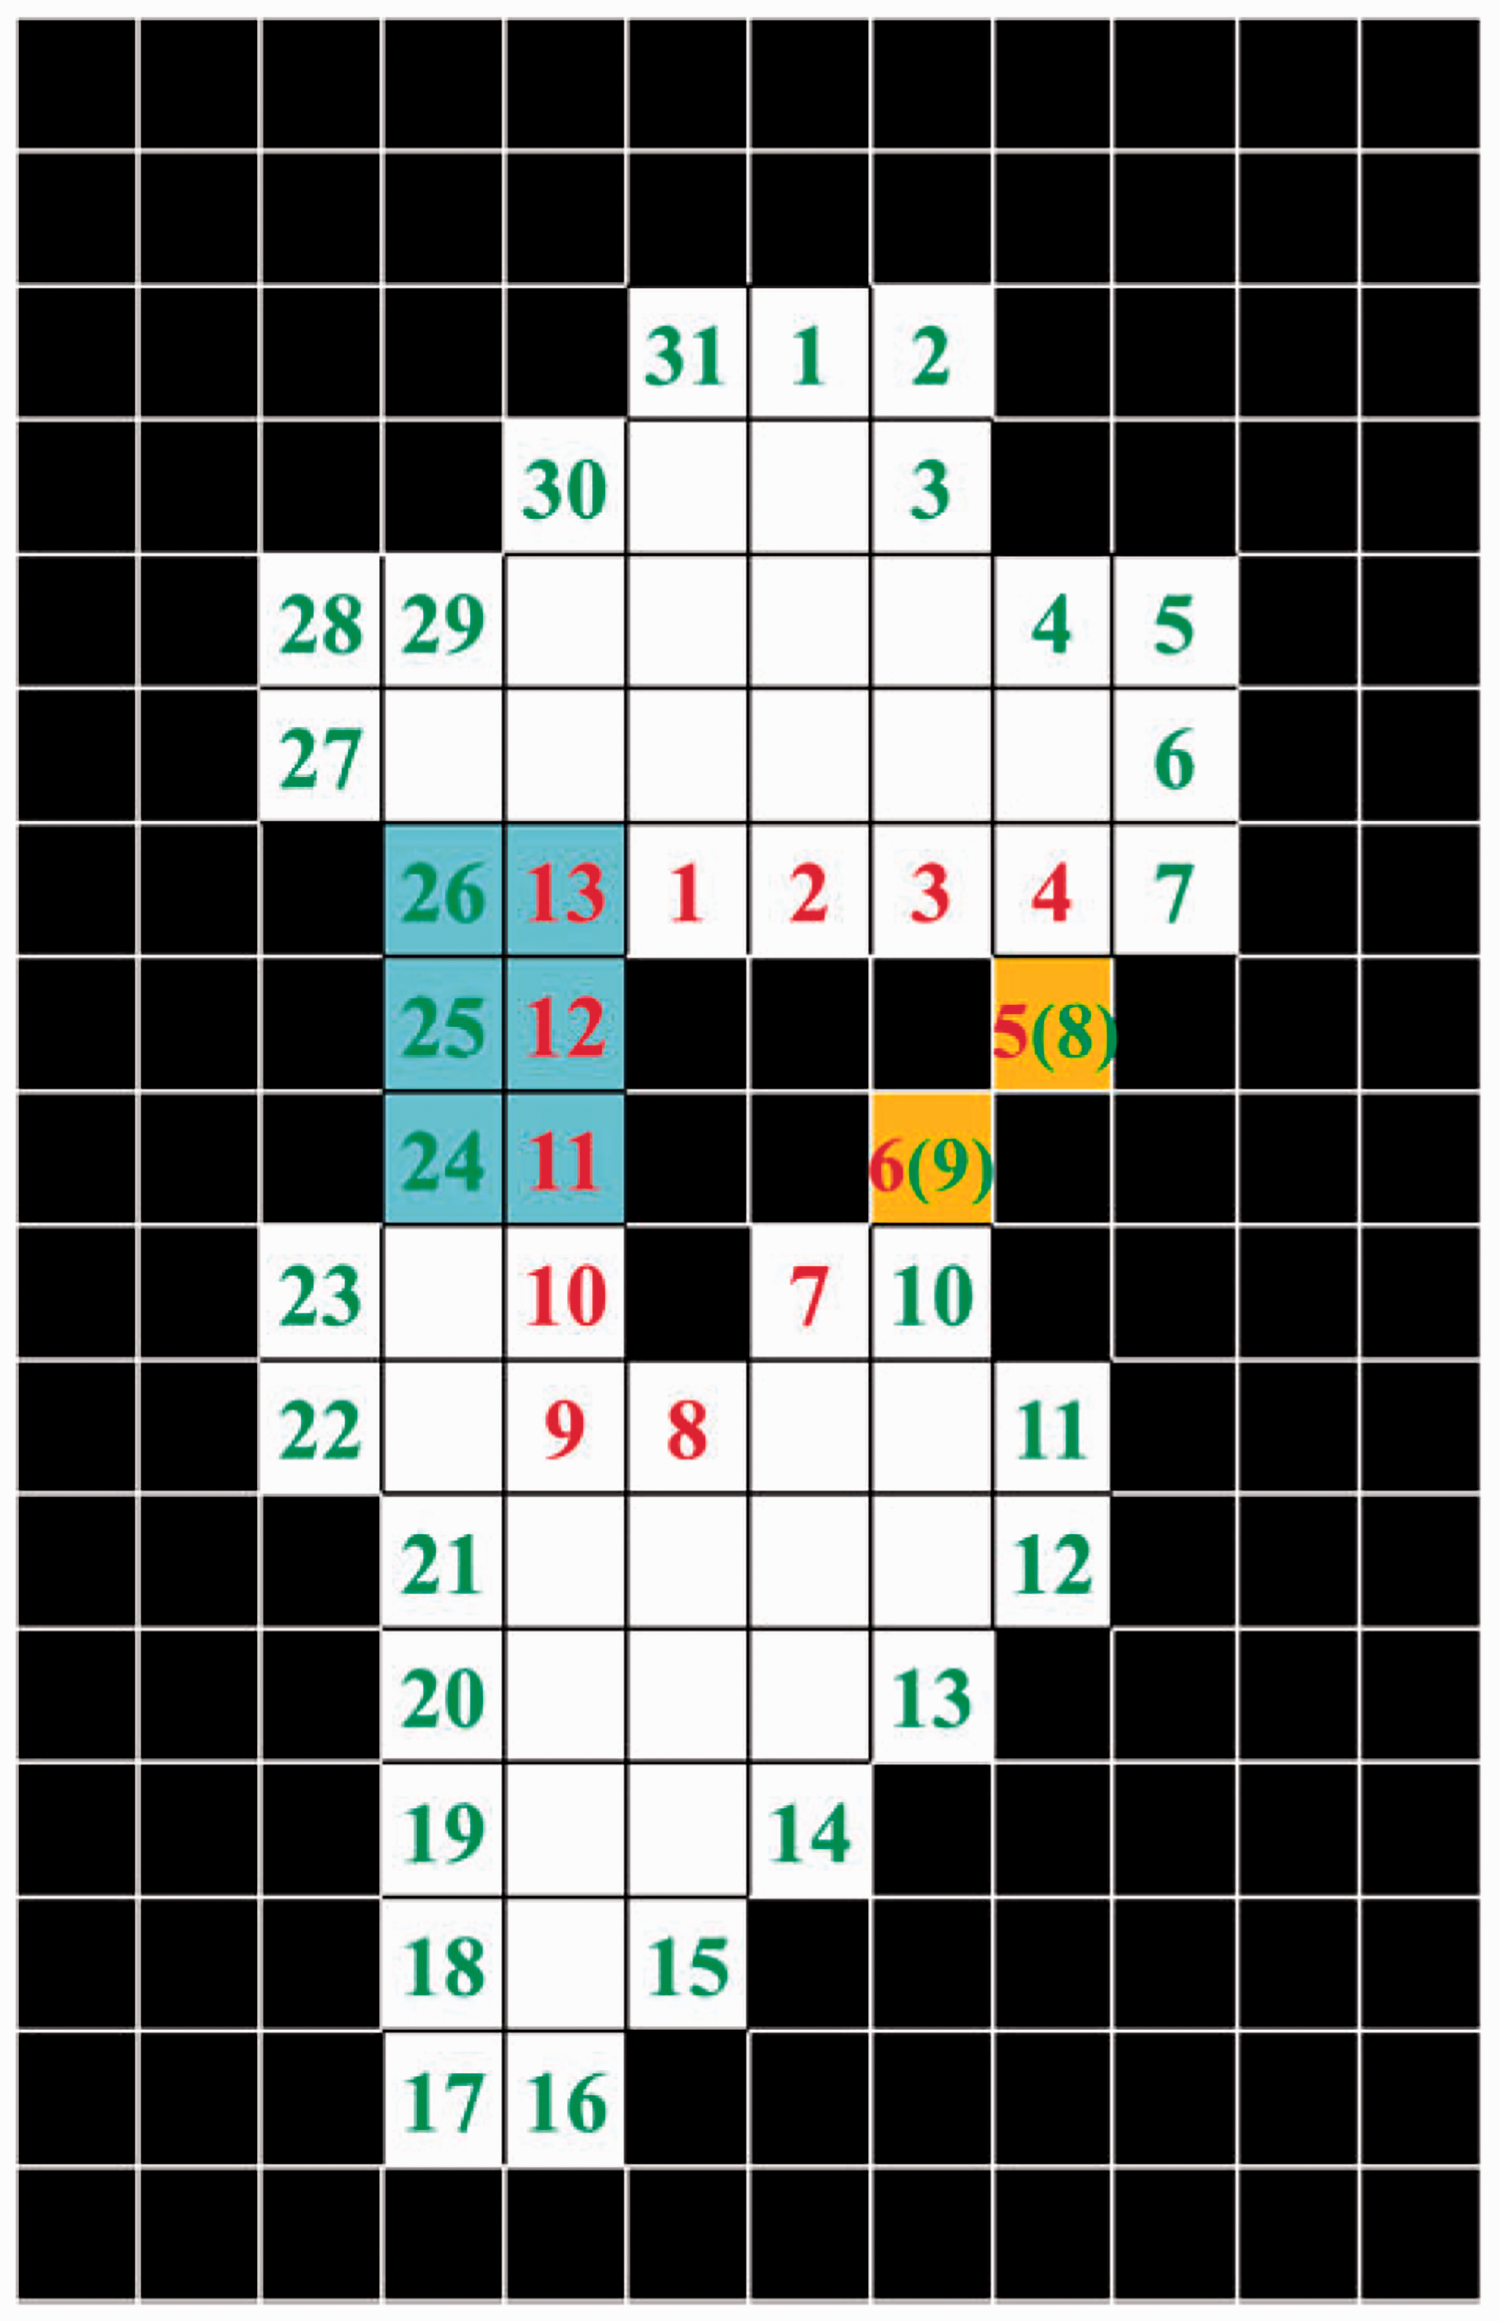
Schematic diagram of separation point.
Flow chart of adhered fibers segmentation. EDT: Euclidean distance transformation.
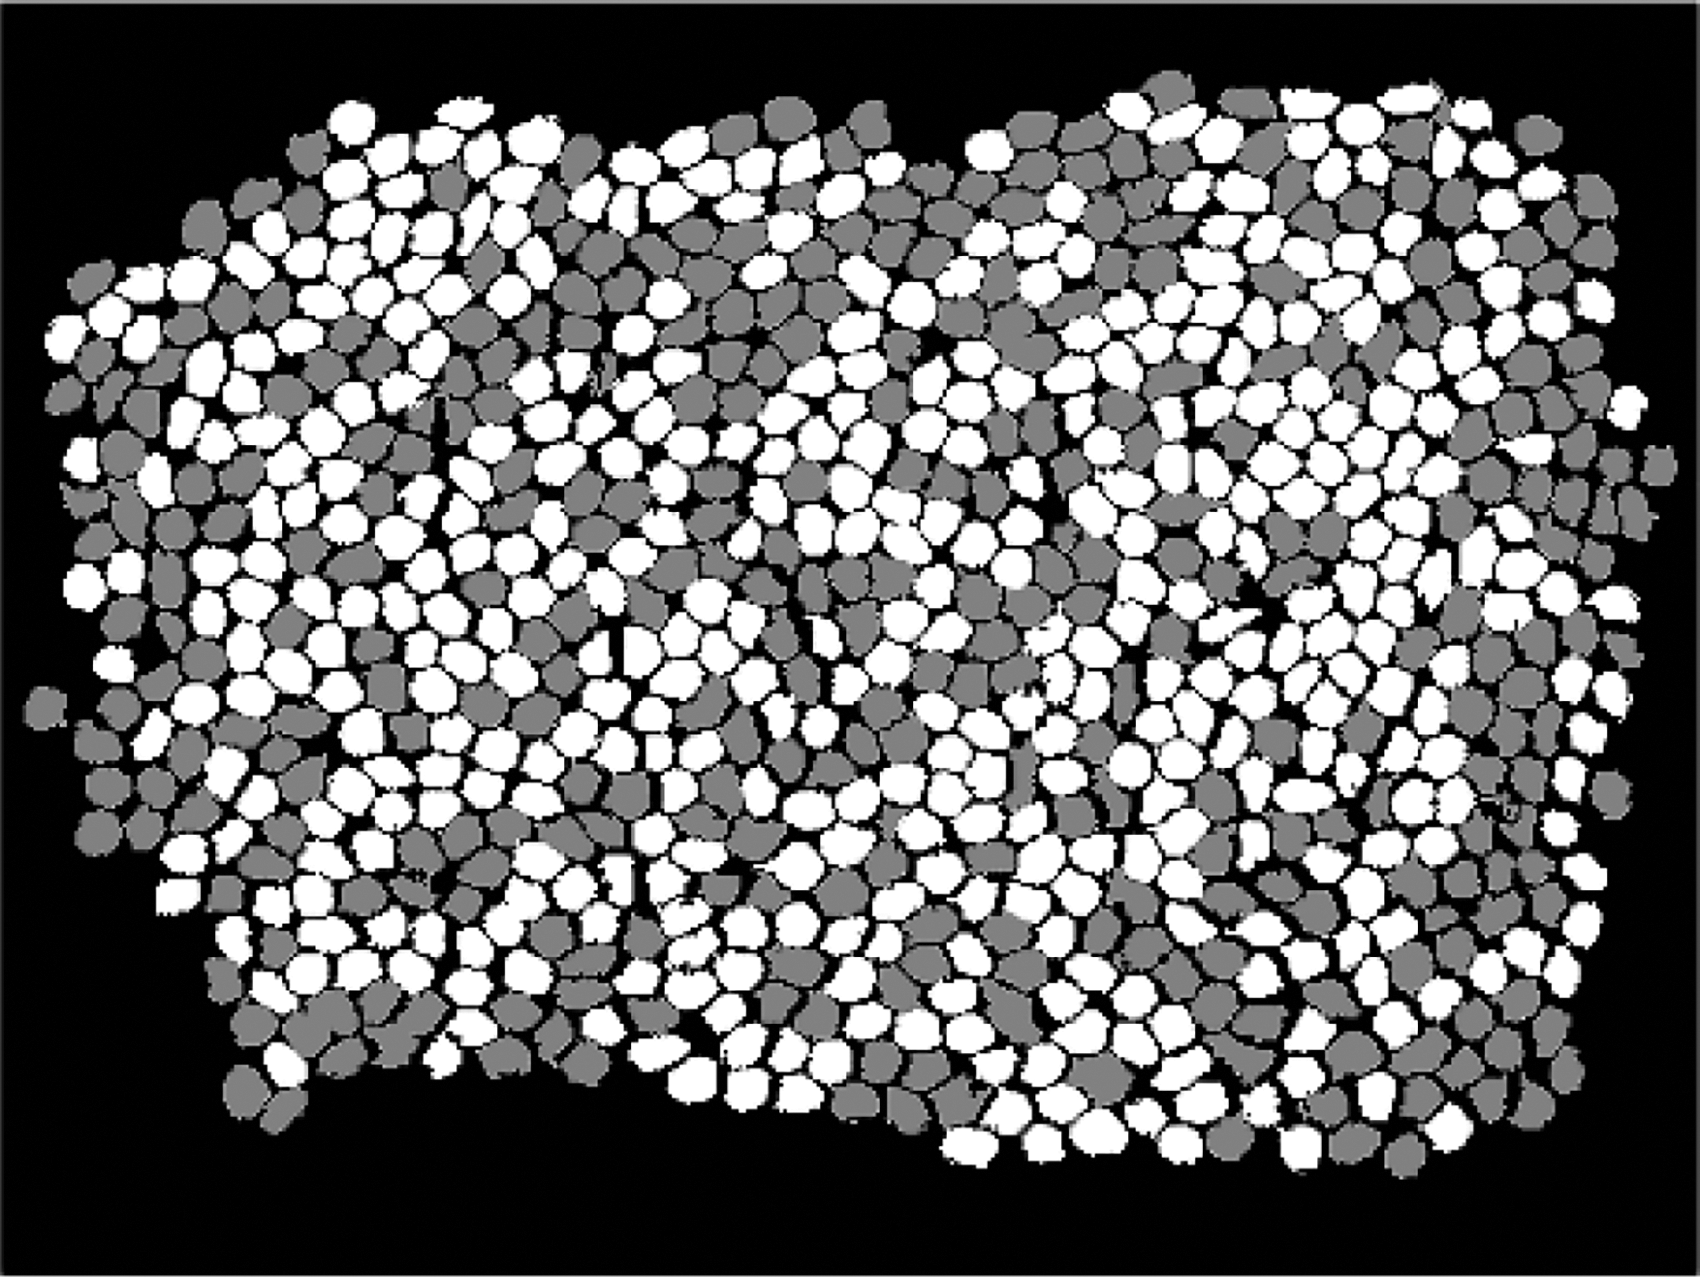
Image after segmentation of adhered fibers.
Step 4: Classification
After the segmentation of adhered fibers, each fiber was a connected domain, and the types of fibers were distinguished by calculating characteristic parameters such as color (pixel value), perimeter, area, circularity, and volatility in each connected domain.
Step 5: Calculate the blending irregularity
According to the division method of blended sliver in the previous study,15,16 the center of gravity of the yarn/sliver cross section was taken as the center, and the maximum radius was the radius of the yarn/sliver, then the cross section was divided into 60 fan-rings consisting of 10 fans and six rings, as shown in Figure 11. The center of gravity coordinate is
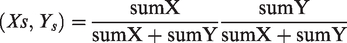
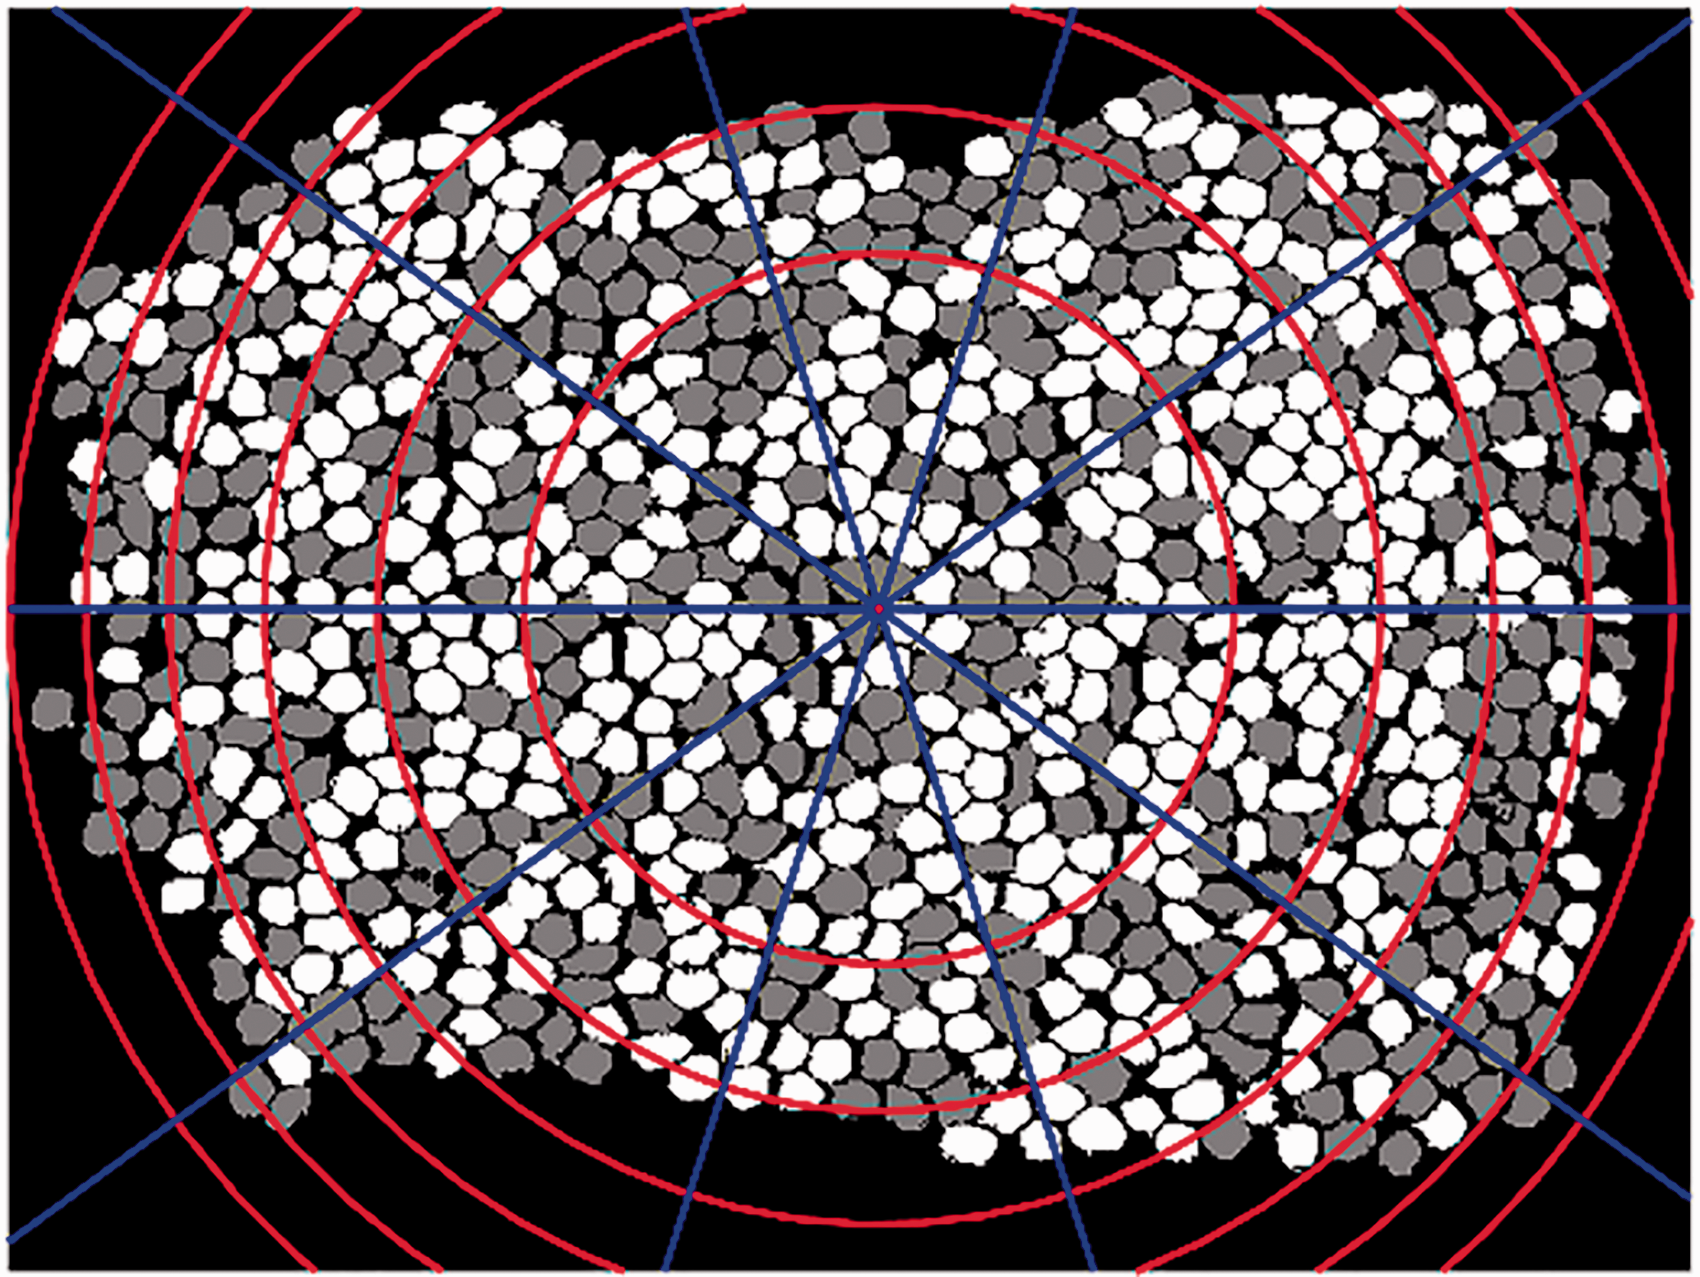
Image after division.
Then the distance of each pixel on the edge from the gravity center Ri can be calculated, separately
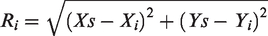
Then the maximum radius Rmax can be obtained. Assuming that there are N varieties of fibers, the number of pixels of each fiber in each fan-ring is calculated in turn, and accumulated, the number of pixels of the f-th fiber is 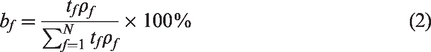
Finally, the blending irregularity was calculated according to formula (1), and the smaller the blending irregularity, the higher the degree of blending uniformity.
Results and discussion
Verification of fiber identification
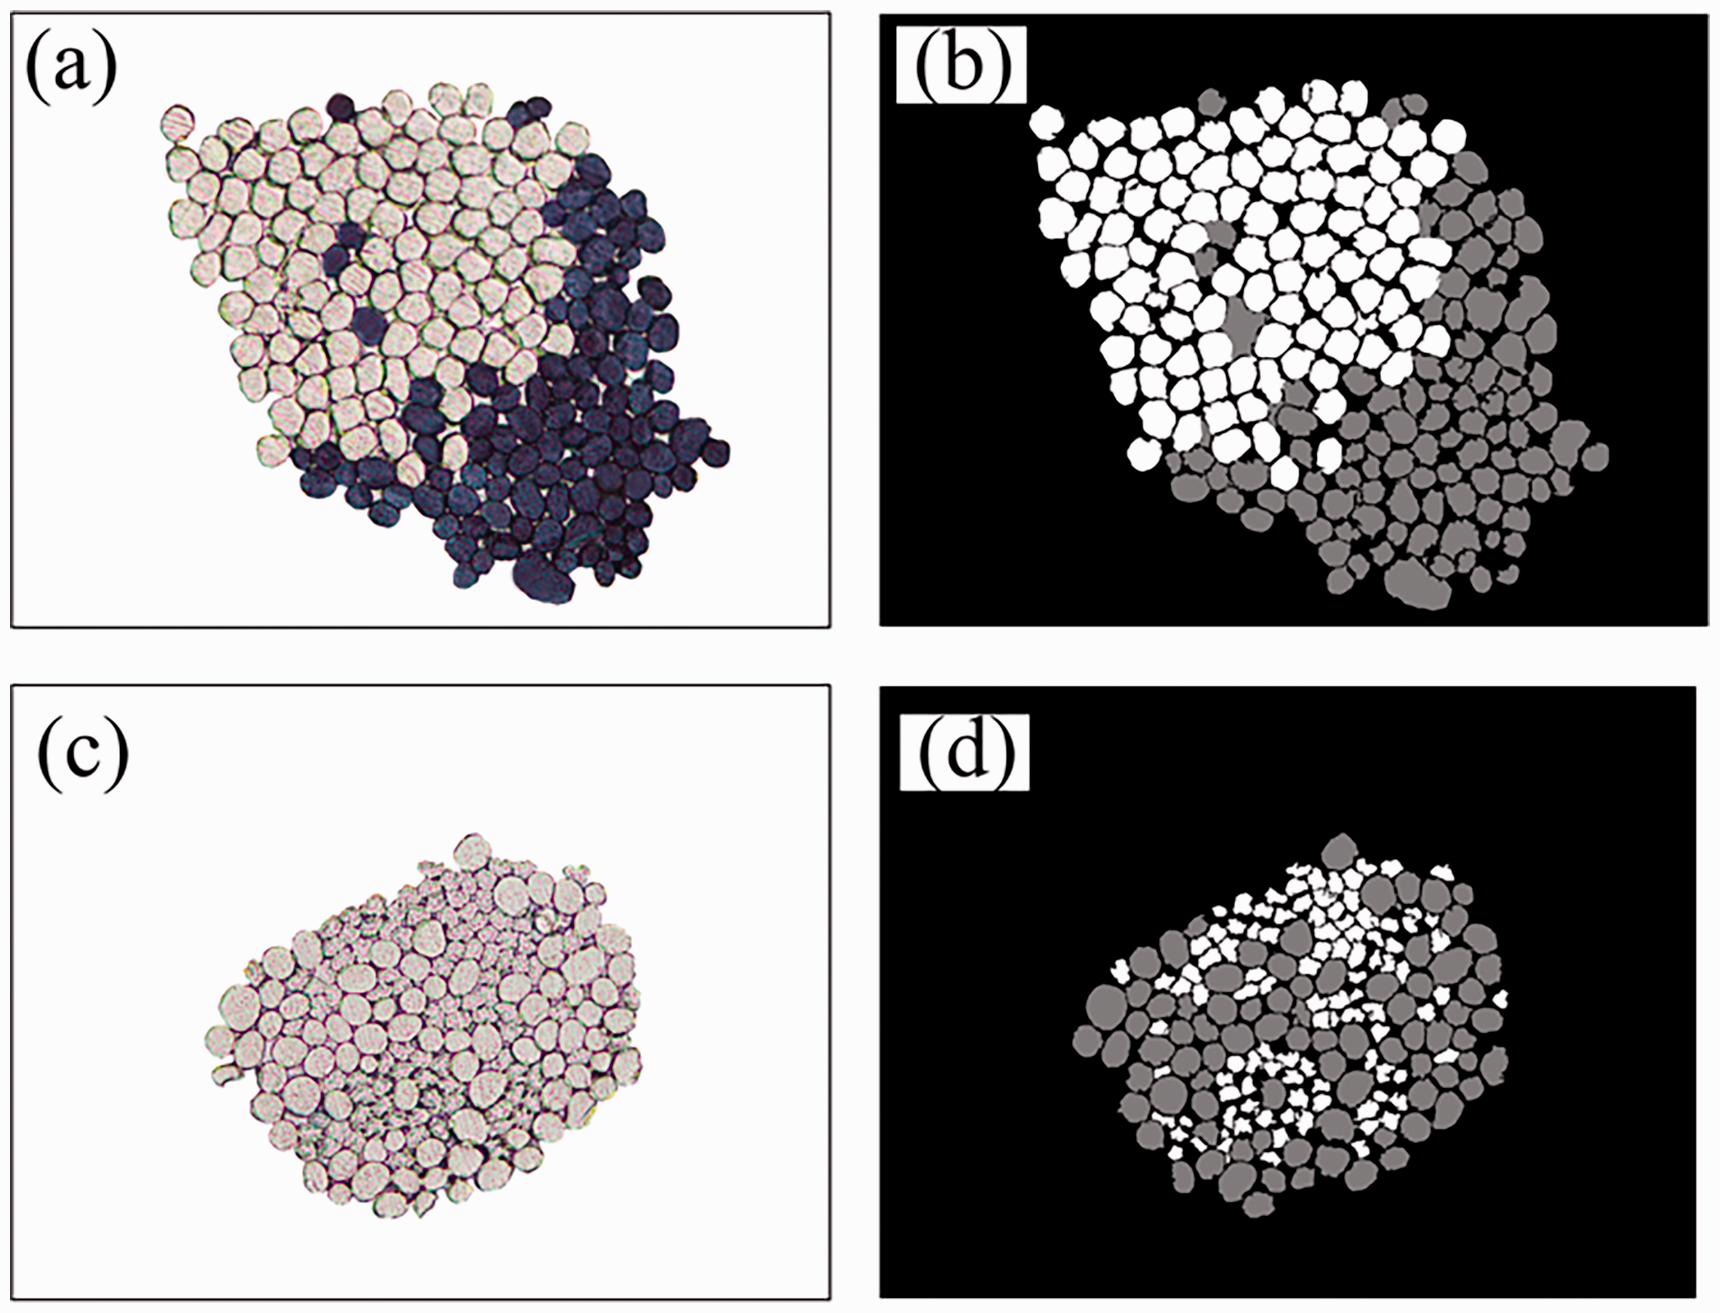
As mentioned in regard to fiber identification verification above, the sliced images of the designed white polyester fiber/black wool fiber bundles (shown in Figure 12(a)) and the viscose/cashmere fiber bundle (shown in Figure 12(c)) were collected. Then, IPM was used to process the image, classify and identify the fibers, as shown in Figure 12(b) and 12(d), and finally count the fiber number of each component, as shown in Table 2. In addition, we counted the number of fiber components by MCM, and the results are also shown in Table 2. The accuracy of each method is expressed by the error rate between calculated and design values.
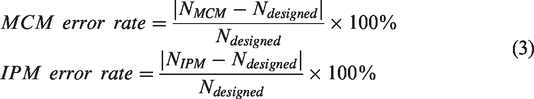
(a) Polyester/wool original image; (b) polyester/wool image after treatment; (c) viscose/cashmere original image and (d) viscose/cashmere image after treatment (gray represents cashmere).
Identification of component fibers by image processing method (IPM) and manual counting method (MCM)
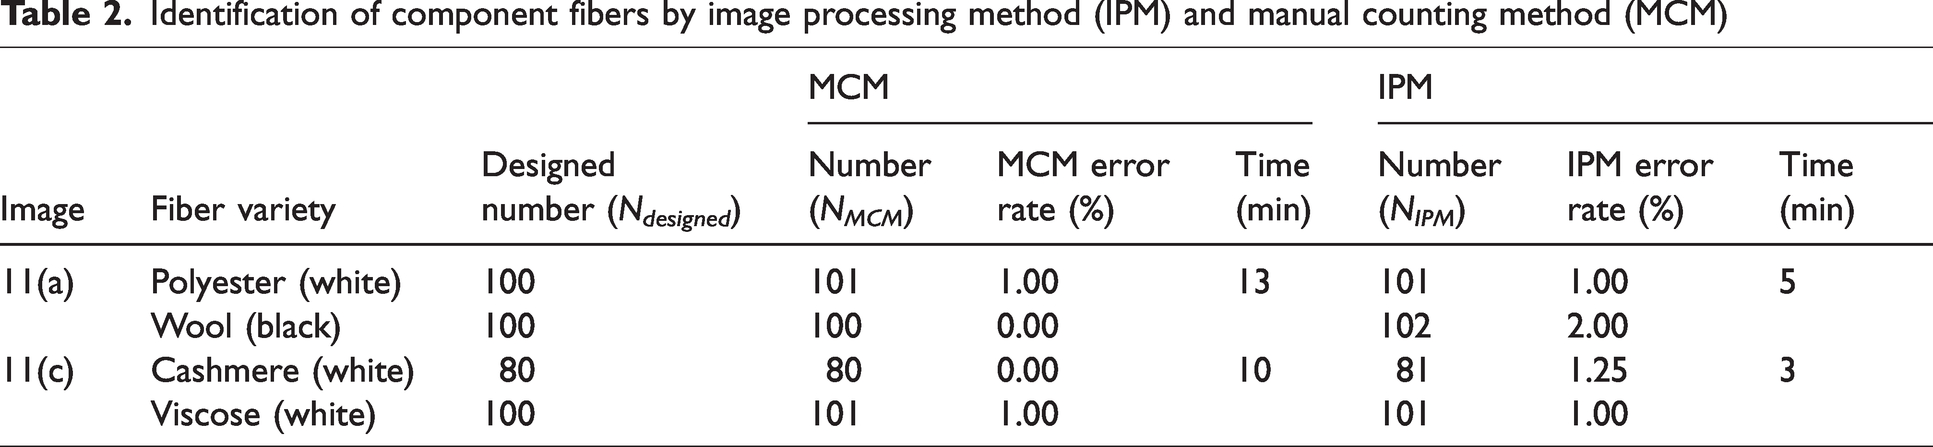
Table 2 shows that the identification of IPM error rate is less than 2%, indicating that the accuracy of IPM is relatively high. The main causes of IPM errors are bubbles, shadows, and large pores between fibers in the bundle cross sections. As shown in Table 2, both MCM and IPM are unavoidable from identification misjudgment. But, compared to manual counting, the IPM takes about only half the time to identify about 200 fibers, which greatly improves the detection efficiency and labor saving.
Verification of blending irregularity
As mentioned regarding verification of blending irregularity above, black polyester slivers and white polyester slivers were blended in the drawing. As shown in Figure 1, the “separate” and “alternate” feeding arrangements were implemented respectively in the first drawing, and then the second, third, and fourth passage of drawing were made in sequence. The cross-sectional images of the blending slivers were captured after each blending passage, and the blending irregularity was calculated by IPM and MCM respectively, and the deviation between the two calculations was expressed as the difference rate. Figure 13 shows the calculation results of the blending irregularity of the blended sliver in each drawing passage by using two different feeding arrangements in the first drawing blending. It can be seen from the experiment on verification of fiber identification that the MCM method has high accuracy in counting fibers, so the blending irregularity calculated by means of multiple MCM averages can be considered reliable. Therefore, the accuracy of IPM can be characterized by the difference rate between IPM and MCM, using the calculated results of as the standard. The different rate of blending irregularity is

Blending irregularity and difference rate of the blended sliver in each passage of drawing: (a) “separate” arrangement in the first drawing and (b) “alternate” arrangement in the first drawing. IPM: image processing method; MCM: manual counting method.
Figure 13 shows that compared with MCM, the difference rate of blending irregularity calculated by the IPM is below 5%. Two colored component slivers are arranged “alternate”, in contrast, that can reach smaller blending irregularity in each passage of the drawing. Moreover, with the increase of the passages of drawing, the blending irregularity decreases and the blending uniformity of the two arrangements is gradually close to each other, especially after the third passage, the blending irregularity under the two feeding arrangements is gradually close to the same. It shows that increasing the passage of drawing can effectively reduce the unevenness of blending caused by the feeding arrangement. But excessive drawing results in fiber damage and sliver quality worsening. However, an “alternate” arrangement can achieve smaller blending irregularity with fewer passages of drawing. Therefore, different component slivers arranged as alternate as possible during sliver blending can greatly improve the blending uniformity with fewer passages of drawing.
Verification of applicability
As mentioned regarding applicability verification above, three types blended yarns (polyester/viscose40/60, polyester/viscose 50/50, and ramie/wool 50/50) were used to verify the applicability of the IPM. The IPM was used to treat the yarn cross-sectional images, then identify fibers, and finally calculate the blending ratio and blending irregularity. Besides, on the original images, the MCM was used to count the number of each component fibers, and then calculate the blending ratio by average fiber linear density. The results are shown in Table 3. The images before and after treatment and identification by IPM are shown in Figure 14. The difference rate is the blending ratio deviation between the designed and measured.
Calculation results of viscose/polyester, ramie/wool blended yarn
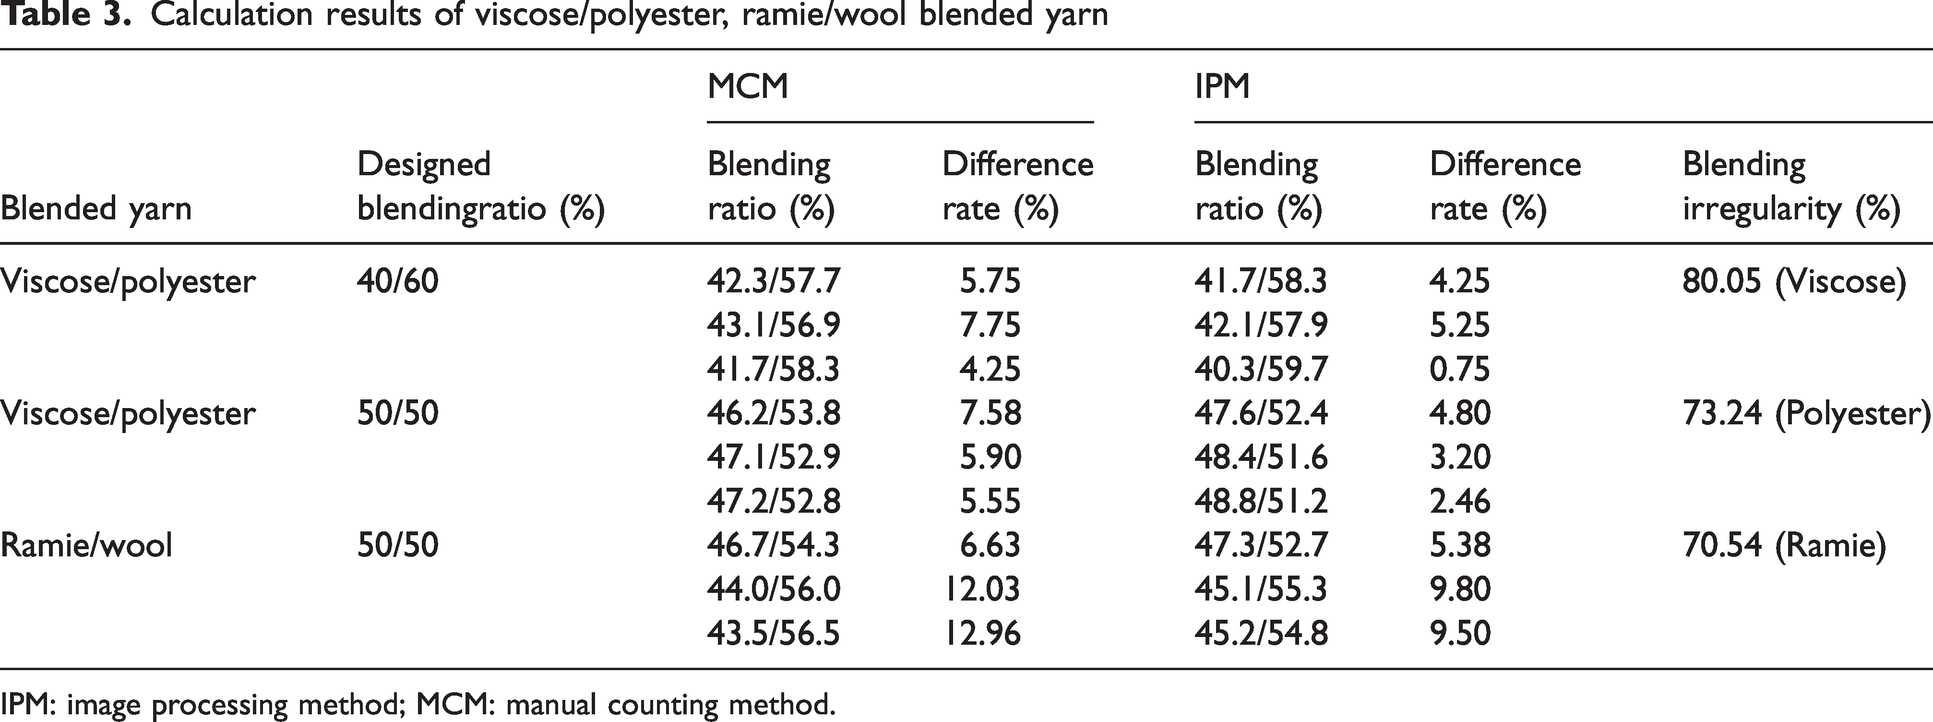
IPM: image processing method; MCM: manual counting method.
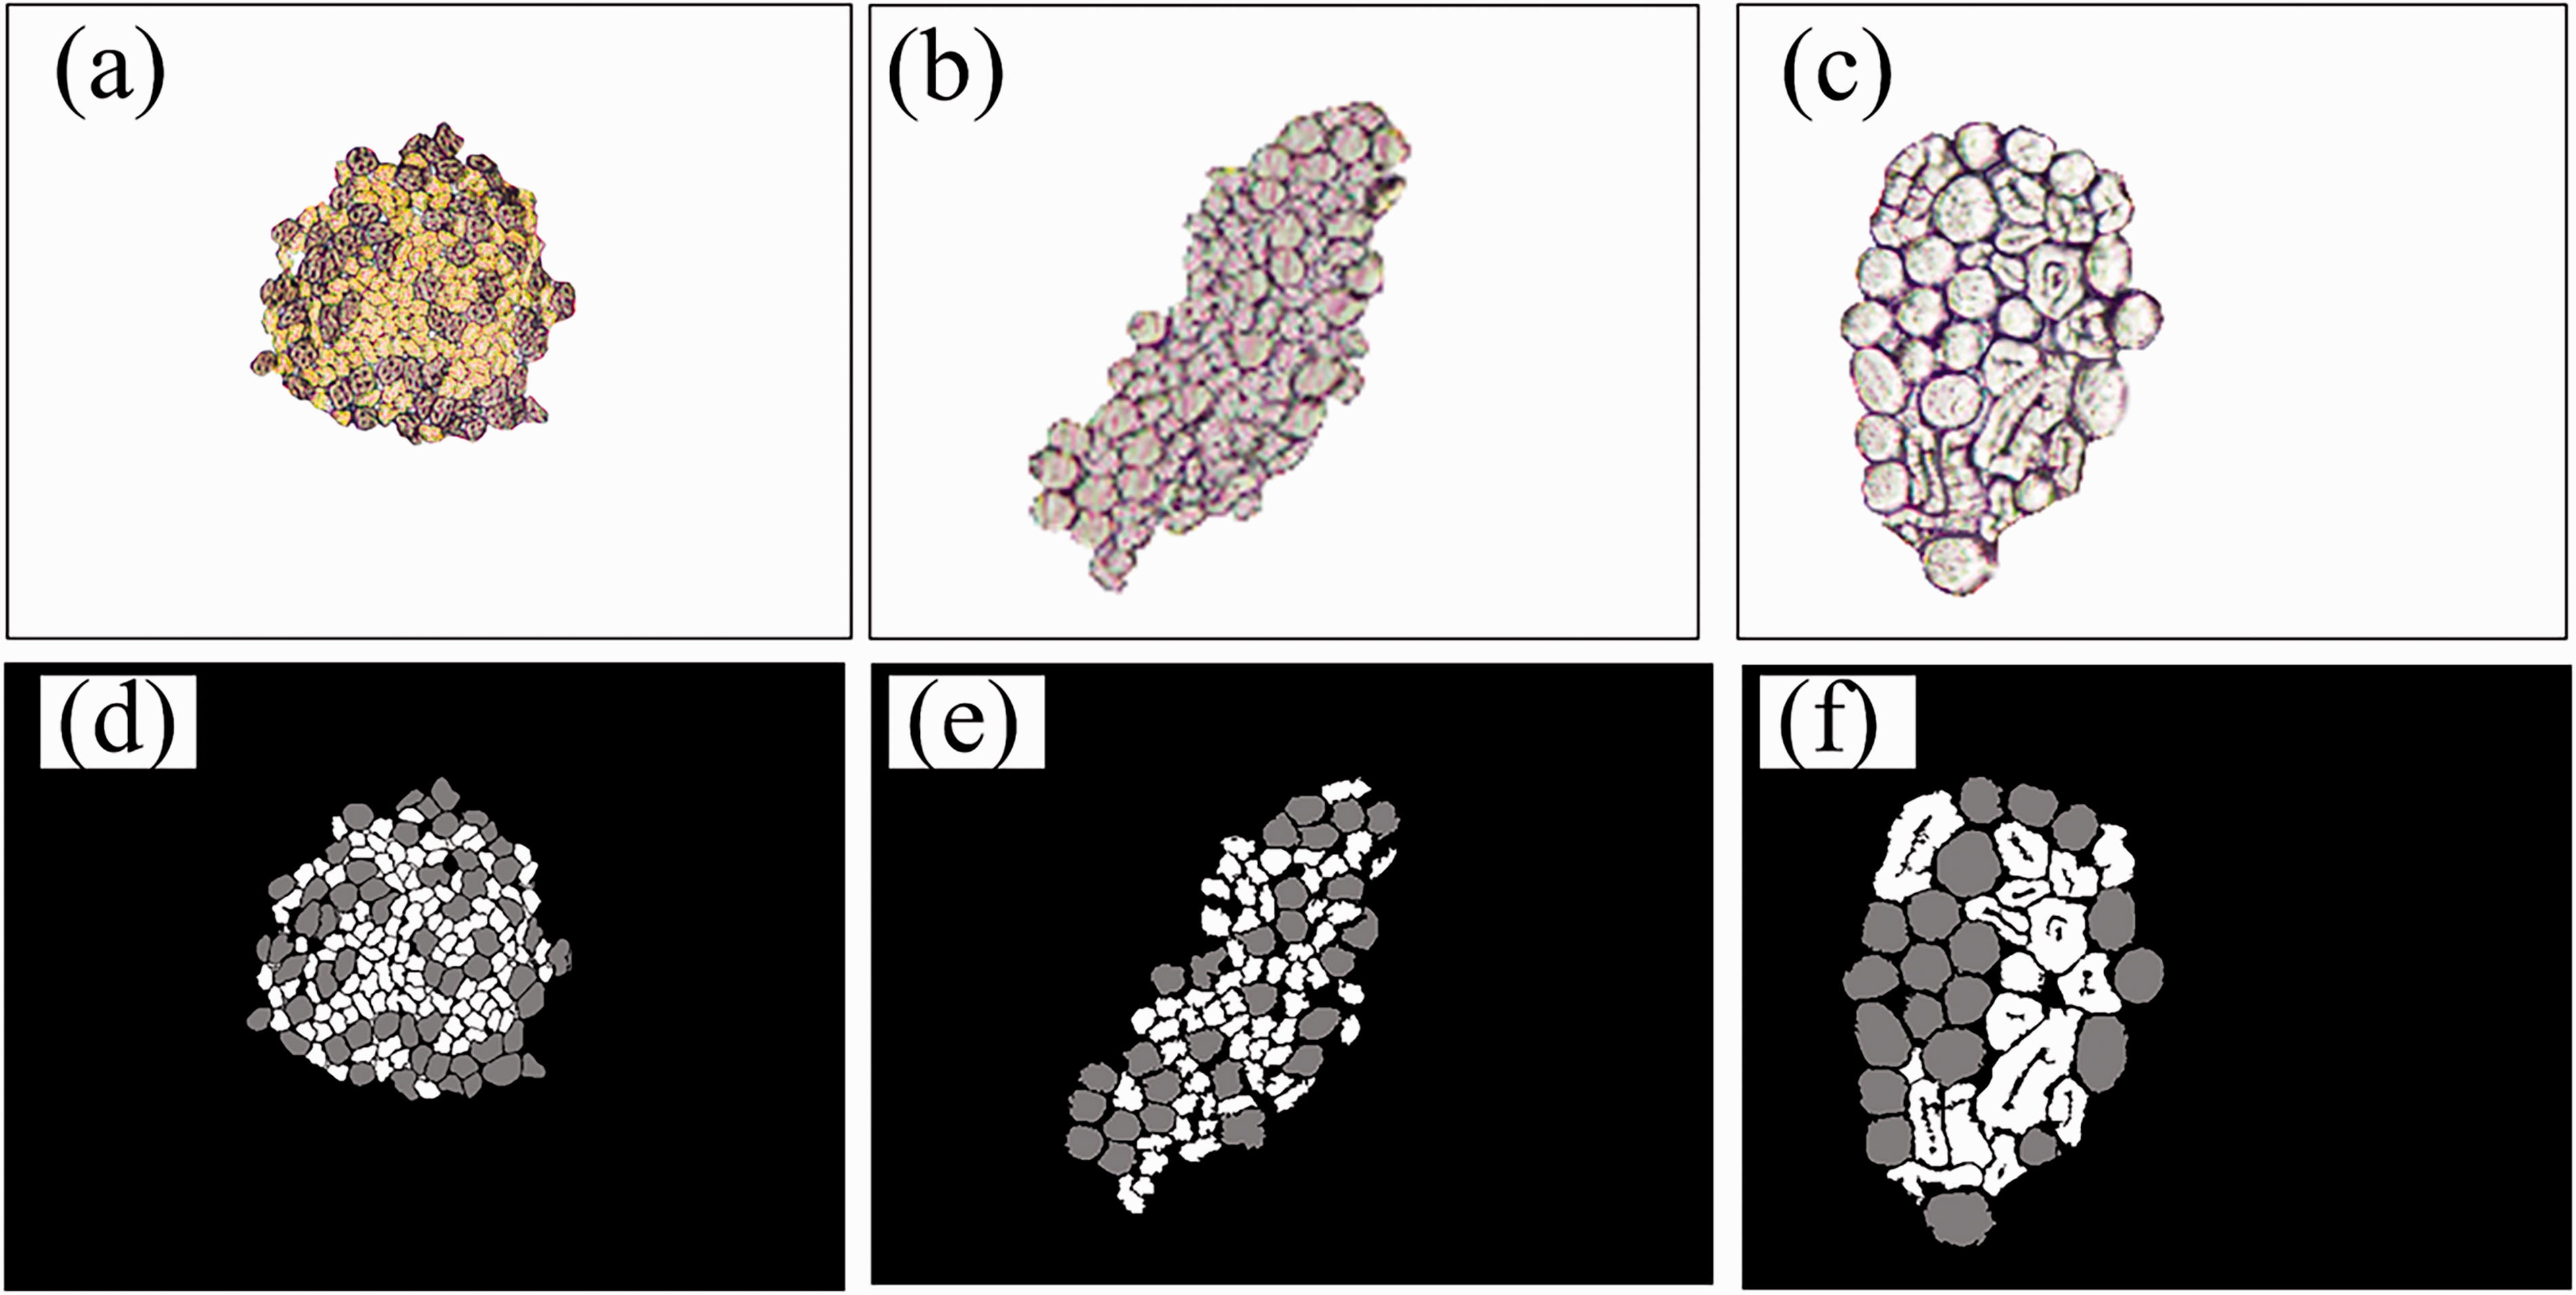
(a) Polyester/viscose blended yarn (40/60) original image; (b) polyester/viscose blended yarn (50/50) original image; (c) ramie/wool blended yarn (50/50) original image; (d) polyester/viscose blended yarn (40/60) after treatment by image processing method (IPM), gray is polyester; (e) polyester/viscose blended yarn (50/50) after treatment by IPM, gray is polyester and (f) ramie/wool blended yarn (50/50) after treatment by IPM, gray is wool.
Table 3 shows that the IPM difference rate of blending ratio for the polyester/viscose blended yarn calculated is less than 5% and the ramie/wool blended yarn is less than 10%, both of which are smaller than the MCM difference rate. In particular, polyester/viscose 40/60 blended yarn was sliver blended, so the designed blending ratio does not differ much from the measured one. Compared with the IPM and MCM, the IPM calculated blending ratio is closer to the designed blending ratio. There are two main reasons for the difference between the measured and the designed blending ratios of ramie/wool blended yarn. First, the ramie fiber is coarse and stiff, which is easily dropped during the spinning process, especially in carding, close to 10%, so the ramie fiber in the resultant blended yarn is usually smaller than in the designed; Second, the error is caused by inaccuracy on identification because of defects such as bubbles and uneven brightness in the images. In general, the IPM proposed in this article can calculate the blending ratio and blending irregularity of blended yarns with different fiber species accurately. Moreover, it is time-consuming and labor-intensive to measure the linear density in ramie fiber with uneven linear density. Whereas the IPM only needs to query the specific gravity of ramie fiber without measuring linear density, and then the fiber weight can be calculated by the multiplication of fiber cross-sectional area and specific gravity, which is more accurate and convenient.
Conclusion
In this article the IPM was put forward to identify fibers and calculate the blending ratio and blending irregularity of blended yarns. The Euclidean distance peeling method was adopted to segment the adhered fibers, and the characteristic parameters such as fiber color, shape, and area were employed to classify the fibers. The fiber identification error of IPM was found to be less than 2%, by designed blended fiber bundles with different component fibers (e.g. polyester, viscose, and wool). For polyester blended slivers, the blending irregularity calculation difference rate between the IPM and the MCM was below 5%. The difference rate between the designed and measured by IPM, is less than 5%, while that of MCM is about 10%. It also shows that the IPM is labor and time saving as well as providing greater test convenience and accuracy than MCM. The IPM proposed in this article provides an accurate, convenient, and fast measurement method for blending ratio and blending irregularity as well as the subsequent research on the blending mechanism of blended yarns.
Footnotes
Declaration of conflicting interests
The author(s) declared no potential conflicts of interest with respect to the research, authorship, and/or publication of this article.
Funding
The author(s) disclosed receipt of the following financial support for the research, authorship, and/or publication of this article: This work was supported by National Natural Science Foundation of China (No. 52173032), and the Fundamental Research Funds for the Central Universities and Graduate Student Innovation Fund of Donghua University(CUSF-DH-D-2022018), also by Modern textile frontier basic science research base, Donghua University, Shanghai, China.