
Abstract
The mechanism of the neuro-electrophysiological response of the human brain to skin tactile stimulation has always been an important research topic in the field of comfort perception of textile materials. In order to explore the characteristic neural potential components induced by various fabric tactile stimulation and their influence rules, event-related potential technology with ultra-high time resolution was introduced to monitor the somatosensory brain region under tactile stimulation of fabrics with different tactile properties, and the signal changes of related potentials were extracted and analyzed. The results showed that the amplitudes of N100 increased with the stiffness of the fabric, the amplitudes of P200 decreased with the smoothness of the fabric, and the amplitudes of P300 decreased with the smoothness and softness of the fabric. These results indicated that N100, P200, and P300 potentials could be used as neurophysiological response indexes of brain neurons to distinguish the subtle differences in fabric tactile properties. This finding not only laid a scientific theoretical basis for the brain perception mechanism of fabric tactile properties, but also provided a possibility for further quantification characterization of textile comfort perception.
Among the various brain perception and representation technologies, ERP (event-related potential) technology is a non-invasive brain cognitive imaging technology that has developed rapidly, and has been widely used in many fields, such as psychology, 1 physiology,2,3 neuroscience, 4 artificial intelligence, 5 and so on. It can not only determine the cognitive process of specific experimental stimuli, but also has the advantages of low equipment price, being easy to carry, ultra-high time resolution, accurate results, small errors, and small subjective interference. Among them, the time resolution of the microsecond level is unrivalled by other brain sensing technologies, which is of great significance for timely location of the characteristic brain regions of material comfort perception and exploring the mechanism of the electrodynamic neural response of tactile perception. 6 Even functional magnetic resonance imaging technology with micron-level spatial resolution (25–100 µm) is limited by the slow change of the hemodynamic signal itself, resulting in its time resolution (1 s) being far less than that of ERP technology, whose time resolution can reach 1 ms. 7 ERPs can not only realize the monitoring of neurophysiological response to tactile stimulation, but also provide a repeatable and quantitative measurement method of brain electrical activity. 8
Among the event-evoked potential components, the most classic components are N100, P100, N200, P200, and P300, which are the evoked potential peaks appearing at about 100, 200, and 300 ms after receiving the stimulus, respectively, which are divided into positive and negative waves, represented by P and N, respectively. They are also called the early negative potential component, early positive potential component, mid-term negative potential component, mid-term positive potential component, and late positive potential component. 9 In terms of the brain perception of material comfort, ERP technology has mainly been applied to the research fields of tactile comfort 10 and visual comfort perception, 11 especially the former. In the early stage, Hoefer et al. 12 found that contact stimulation of fabrics with different textures could induce different amplitudes of the P300 signal, which proved the feasibility of using the ERP method to study the tactile comfort of fabrics. In the same year, Chen and Ge 13 statistically analyzed the amplitudes of P300 waves stimulated by different fabric materials, and found that rough fabric surfaces could induce higher amplitudes of P300 waves. Chen et al. 14 and Liu et al. 15 touched fabric surfaces with different textures with their fingers, and also found that fabric contact with a high texture height and large friction coefficient would induce a larger peak value and shorter latency of the P300 wave. In a study on the tactile sensation of silk fabric based on ERPs, it was found that except for P300, the peak value of the P200 wave was also positively correlated with the itching sensation, surface density, and contact cold sensation of silk fabric, but negatively correlated with the sticky sensation. That is, the stronger the itching sensation, the greater the surface density, the larger the contact cold sensation value, and the smaller the sticky body sensation, the more excited the brain response of the P200 and P300 bands would be. Moreover, in terms of tactile sensitivity, the P300 latency of females was always smaller than that of males, indicating that females processed tactile cognition faster. 16 Tang et al. 17 compared and touched three natural fiber fabrics with different friction coefficients (linen > cotton > silk) and found that, on the one hand, higher friction would cause higher P300 amplitude, and women were higher than men, indicating that women had a stronger response to tactile perception. On the other hand, a larger friction coefficient would make the latency of P300 smaller and easier to judge, and the latency of women was shorter, especially for smooth silk fabrics with a lower friction coefficient, and the P300 wave of women could give a faster response. Tang et al. 18 further confirmed that P300 was related to skin deformation, contact area, friction, and stress around skin mechanoreceptors, and its peak amplitude increased with the increase of tactile stimulation, while its latency decreased with the increase of tactile stimulation. Tang et al. 19 also found that the peak value of P200 components in ERP curves was related to the roughness characteristics of the contact surface, and the surface with greater roughness induced a higher peak value of P200. The study of Liu et al. 20 also concluded that P200 was the most significant component to distinguish multi-level touch, while P300 was a significant component that had a good correlation with the subjective judgment of touch.
In summary, it could be seen that P200 and P300 were the main evoked potential components that had a certain correlation with tactile perception. The amplitude of P200 was positively correlated with the sensation of itching and cold and warm contact, and negatively correlated with the sensation of sticky body. P300 was mainly related to the perception of surface roughness and contact pressure stimulation. The larger the stimulation, the larger the amplitude and the shorter the latency period, indicating stronger perception of discomfort and faster recognition by the brain. This might be related to the fact that P300 wave is the most important endogenous component related to fine active stimulus discrimination and memory renewal.21,22 In this study, ERP technology was mainly used to explore the correlation between tactile properties of materials and the potential components of the somesthetic sensing brain area, aiming to analyze the influence of softness, stiffness, and smoothness on nerve electrophysiological perception. The introduction of electroencephalography and cognitive behavioral methods into the tactile research of textile materials could not only combine the physical properties of materials with the activated ERP responses of tactile sensation, but also provide a good method basis for the quantitative characterization of tactile comfort of textiles.
Materials and methods
Subjects
Twenty healthy right-handed female subjects aged 22 ± 2 years, weight 52.3 ± 2.01 kg, and height 160.8 ± 2.12 cm volunteered to participate in this experiment. It was required that there were no major brain diseases, normal vision (corrected vision), no drugs to promote or inhibit nerves, adequate sleep 24 h before the experiment, no intake of caffeine, alcohol, or drugs, and hair was washed. The interval between two experiments was at least 72 h for each participant. Before the experiment, the subjects were informed of the detailed experiment procedure and signed the informed consent. The study, involving human participants, was reviewed and approved by the Medical Ethics Committee of the Hangzhou Panoramic Medical Imaging Diagnostic Centre (NO. IRB-2023-010). The participants provided their written informed consent to participate in this study.
Materials and apparatus
In this experiment, five kinds of knitted fabrics with different fiber components were used as samples to study the tactile comfort. All experimental samples were selected as black and made into 20 cm × 20 cm square samples. Among them, the first four samples were environmentally friendly fabrics composed of new renewable fibers (including organic cotton, modal, viscose, and so on) as the main component, and the last sample was a fabric sample composed of 100% cotton fibers as a comparison sample. Specifications of the various fabric samples are shown in Table 1.
Specification parameters of fabric samples

The tactile properties of the materials were tested using the PhabrOmeter system, an intelligent style instrument produced by Nu Cybertek, USA, to evaluate the relative feel value of textile materials. A D-lab 3.5 NeroScan-64 electroencephalogram (EEG) device was developed by Ergometers, Germany, which consisted of hardware, software, and auxiliary materials. Hardware included a power supply, control box, amplifier, acquisition computer, stimulation computer, data cable, and electrode cap with 64 channels; software included E-prime3 and Curry8.0; auxiliary materials included conductive paste, scrubs, cotton swabs, flat head needles, bandages, tape, etc. The device worked by studying the cognitive processes in the human brain by collecting electrical signals from specific stimuli through amplifiers.
Tests of tactile properties
Referring to the standard AATCC 202-2014 “Relative hand value of textiles: instrumental method,”
23
the PhabrOmeter fabric feel evaluation system was selected, and the linear density λ (the unit was µg/cm) of the fabric was used as the basis for fabric division, which was the weight (the unit was µg) of fabric per centimeter. The calculation formula λ was as follows:

Each fabric was cut into circular samples with an area of 100 square centimeters, and the experiment was carried out after the standard atmospheric environment (temperature 20 ± 2°C, humidity 65 ± 3%) was wet for 24 h. In this experiment, the instrument’s pushed rod exerted forces that caused the samples to deform in a complex, low-stress state, including stretching, shearing, bending, and friction, similar to the stress state of fabric when people touch it with their hands. All the information related to the feel of the fabric was reflected in the final extracted load–displacement curve, and the style characteristic relative values, such as softness, smoothness, and stiffness, were obtained through data conversion. A lower resistance to compressibility, a higher resistance to bending, and a lower resistance to surface friction were considered to be superior tactile properties of softness, stiffness, and smoothness, respectively. 24 In this experiment, according to the tactile property of the reference fabric, the smaller the relative softness value, the softer the material was, while the higher the relative smoothness value and relative stiffness value, the smoother and stiffer the material was. In addition, because they were relative values, these three indicators did not have units.
ERP experiment
Under the premise of ensuring a quiet laboratory environment, subjects sat in front of a computer, and the experimenter would select the appropriate size of electrode cap according to the subject’s head circumference and they then put on the electrode cap, ensuring that the inside electrode of the electrode cap was closely fitted to the scalp, fastened the fixed Velcro tape at the lower end of the electrode cap, and injected conductive paste to start EEG data collection. The electrode positioning diagram is shown in Figure 1.
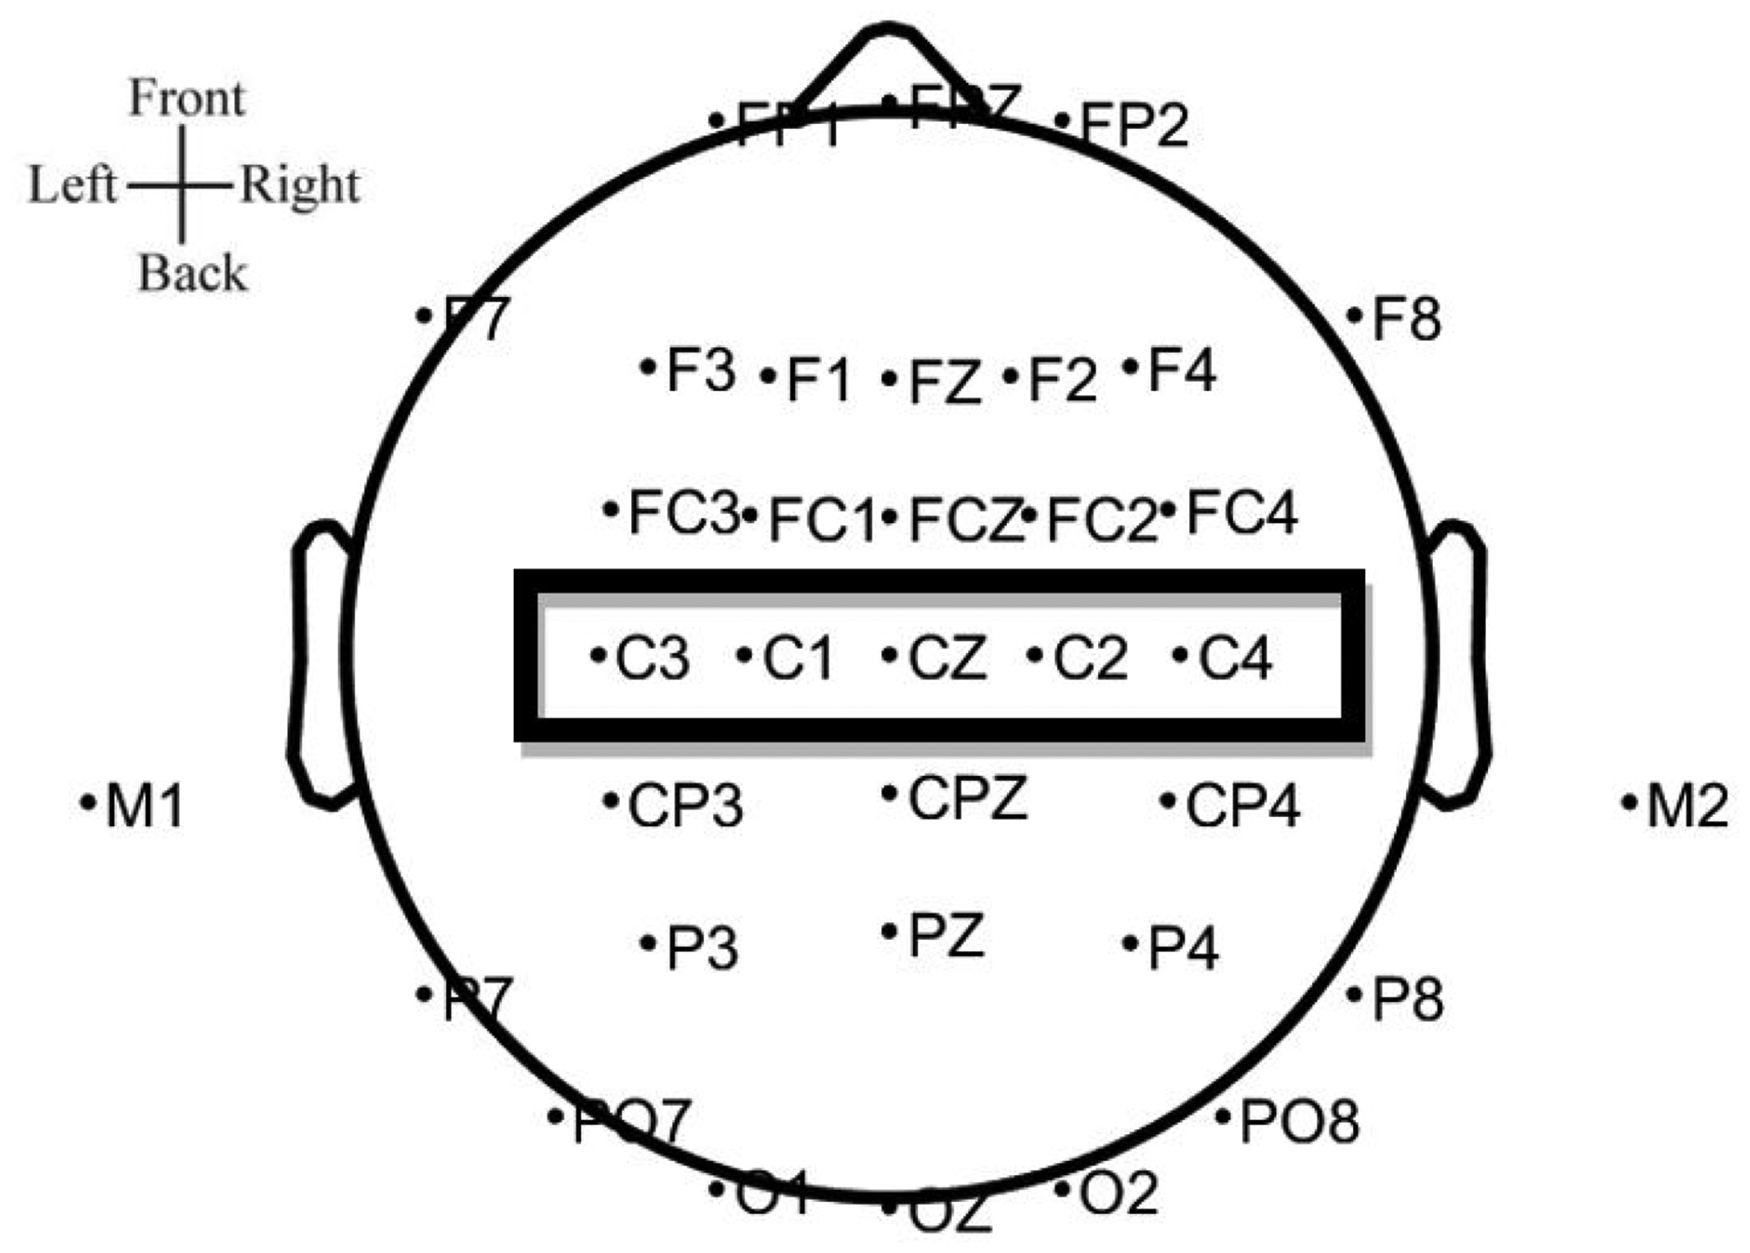
Electrode location diagram.
The electrodes C3, C1, CZ, C2, C4 15 in the brain region where the body sense function is located were selected for analysis. The prefixes FP, F, C, P, and O in the figure represented the prefrontal, frontal, central, parietal, and occipital lobes, respectively, except for F7, F8, P7, and P8, which represented the temporal region associated with hearing. M1 and M2 represented the left- and right-hand earlobe mastoid points, respectively. In order to synchronize the tactile stimulation time series with the EEG recording, vision was used as the trigger moment of tactile stimulation in this research. By showing subjects different pictures to give perception prompts, different pictures suggested that the lab assistant needed to make different action responses. The participants stared at the screen all the time, and the screen appeared in three states: a black screen with a white cross in the middle (duration of 5 s); a white screen with a black cross in the middle (duration of 3 s); and a black screen (duration of 1 s). When the computer screen appeared black with a white cross in the middle, the lab assistant needed to be prepared for applying tactile stimulation. When the white screen with a black cross in the middle appeared, the lab assistant had to move a fabric sample on the subject’s right hand with constant speed and force, so that the subject’s right hand could fully perceive the tactile information of the fabric sample. When the computer screen appeared completely black, the lab assistant was prompted to immediately remove the sample. In the experiment, the oddball paradigm was adopted. Sample 5 was taken as the non-target sample (80% probability of occurrence), and the other samples were taken as the target samples (20% probability of occurrence). The target samples and non-target sample appeared in a completely random order, touching a total of about 100 times, each for time of 3 s, with the interval of 1 s, in order to eliminate habitual influence; after the completion of one set of tests, the participant rested for 10 min, then underwent the next set of tests.
Data analysis
The processing of EEG and ERP experimental data was mainly completed using the toolboxes EEGLAB25,26 and ERPLAB27,28 in MATLAB. Details are as follows: M1 and M2 were selected as reference electrodes, band-pass filtering was performed between 0.1 and 35 Hz, and independent component analysis was used to remove eye electrical noise, cardiac electrical noise, and so on. Finally, EEG signals were corrected at the baseline, superimposed, and averaged, to obtain ERP curves and BEAM (brain electrical activity mapping). 29 After observing the potential distribution of C3, C1, CZ, C2, and C4 in BEAM, the amplitudes of the characteristic evoked potentials were extracted, and the average amplitudes of the electrodes were used as the activation intensity of the evoked potentials. Finally, SPSS (Statistic Package for Social Science) statistical software was used to analyze the correlations between the amplitudes of evoked potentials and the tactile properties of the materials.
Results and discussion
Results of tactile properties of fabric samples
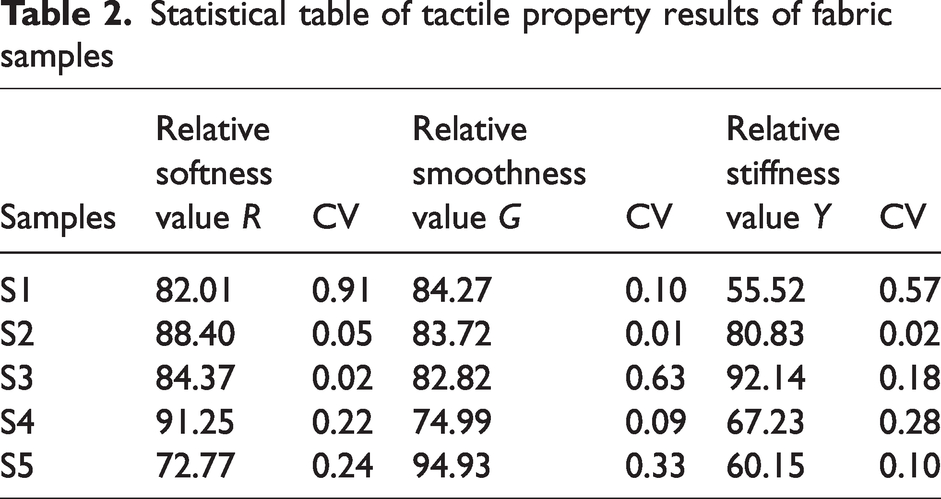
The test results of the softness, smoothness, and stiffness of samples are shown in Table 2 and Figure 2. In this study, it could be noted that the higher the relative stiffness value Y and relative smoothness value G, the better the performance in this aspect, but the smaller the relative softness value R, the better the softness. 24
Statistical table of tactile property results of fabric samples

Experimental results of the tactile properties of fabric samples.
According to Table 2 and Figure 2, in terms of softness, sample 5 > sample 1 > sample 3 > sample 2 > sample 4; in terms of smoothness, sample 5 > sample 1 > sample 2 > sample 3 > sample 4; in terms of stiffness, sample 3 > sample 2 > sample 4 > sample 5 > sample 1, that is, sample 5 made of 100% cotton fiber was the softest and smoothest, while sample 3 with higher Modal fiber content was the stiffest. This was related to the fiber composition, thickness, surface density, and initial modulus of the textile materials. Sample 5 was the lightest and thinnest, while sample 3 was the stiffest because it was thicker and had a higher modulus of Modal fiber. 30
Analysis of BEAM based on ERPs
The so-called BEAM used warm and cool colors respectively to represent positive and negative potential components, and then used the color depth to represent the intensity of the activation response of each brain region. The darker the color, the stronger the perception of the brain region to the event stimulus. From BEAM the activity degree of each material’s tactile stimulation to each brain region and the changes of the activity degree in different time periods could be seen. In addition, the specific electrode location of the active brain region could be seen by combining with the electrode location map. In this study, BEAM with time bands of 100–200, 200–300, and 300–400 ms were extracted, as shown in Figure 3.

Brain electrical activity mapping with time bands of 100–200, 200–300, and 300–400 ms.
Since this study focused on tactile perception, the activation responses of electrodes C3, C1, CZ, C2, and C4 in the somatosensory functional brain region were the main concern in BEAM. By comparing the BEAM of different time periods, it could be seen that in the time range of 100–200 ms, the somatosensory brain regions were dominated by the negative potential wave N100 component. In the time ranges of 200–300 and 300–400 ms, somatosensory brain regions were dominated by the positive potential wave P200 and P300 components, respectively. In other words, in the range of 100–400 ms, the main components of fabric tactile properties evoked potentials changing from the negative component N100 to positive components P200 and P300 with the change of time.
Amplitude analysis of characteristic evoked potentials
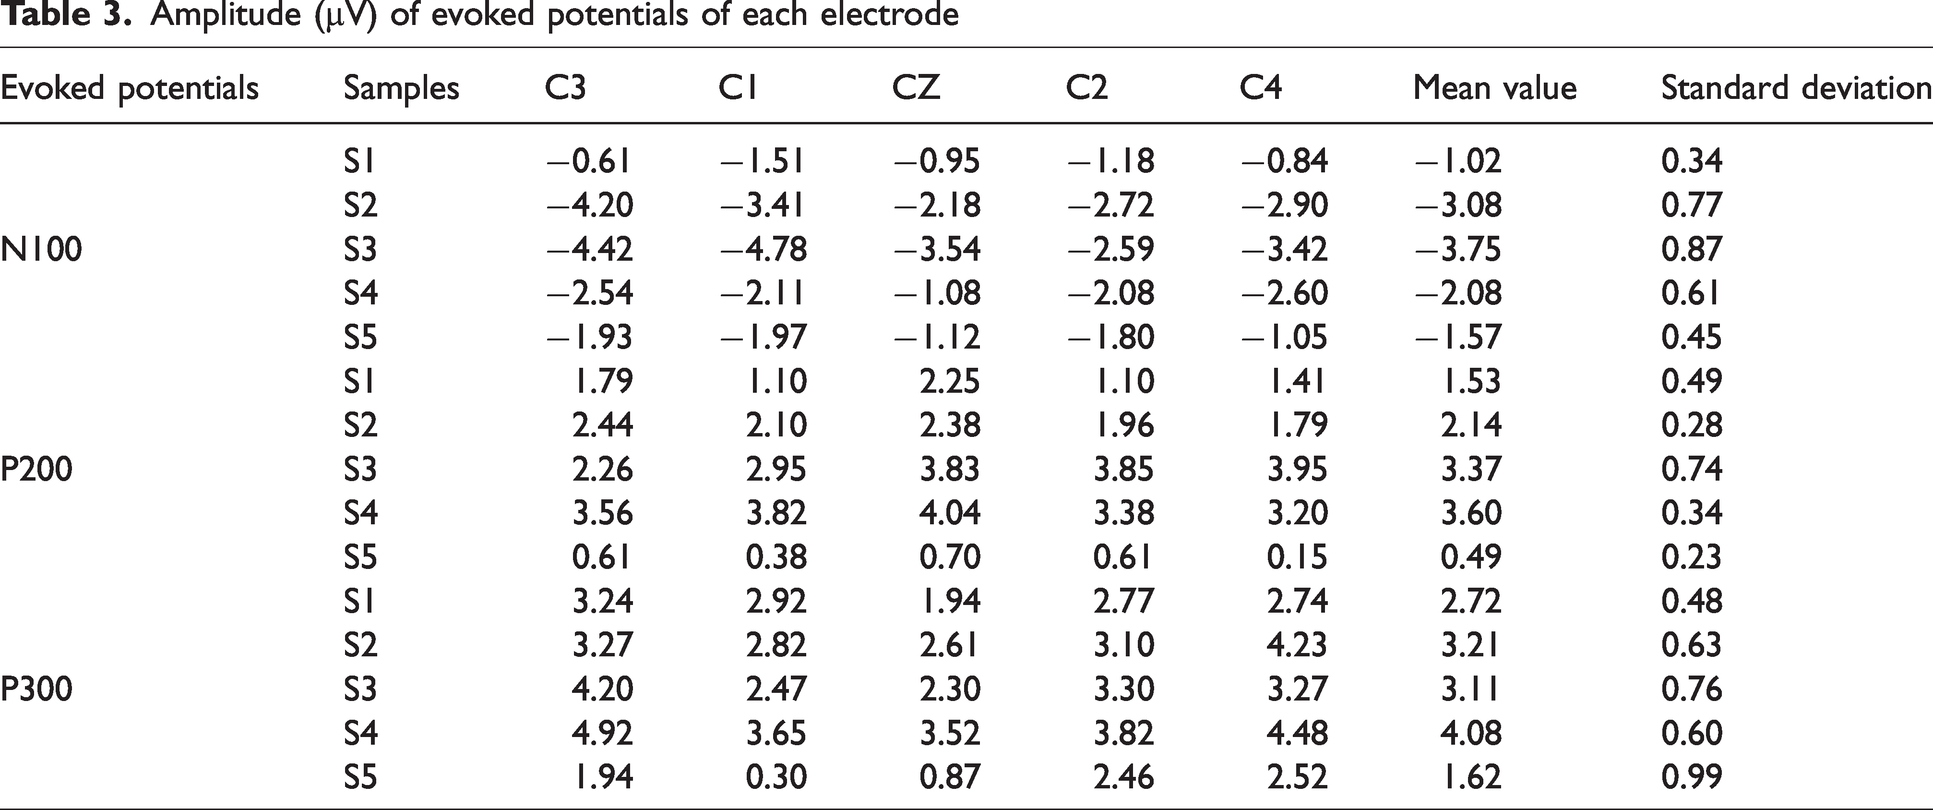
According to the above BEAM analysis, it could be seen that N100, P200, and P300 were characteristic evoked potentials related to tactile perception. In order to further explore the influence of different tactile styles on the somatosensory brain region, the amplitudes of the N100, P200, and P300 components of electrodes C3, C1, CZ, C2, and C4 in the somatosensory functional brain region were extracted, and the average amplitudes of the electrodes were used as activation intensity values of the ERP components, as shown in Table 3 and Figure 4.
Amplitude (µV) of evoked potentials of each electrode
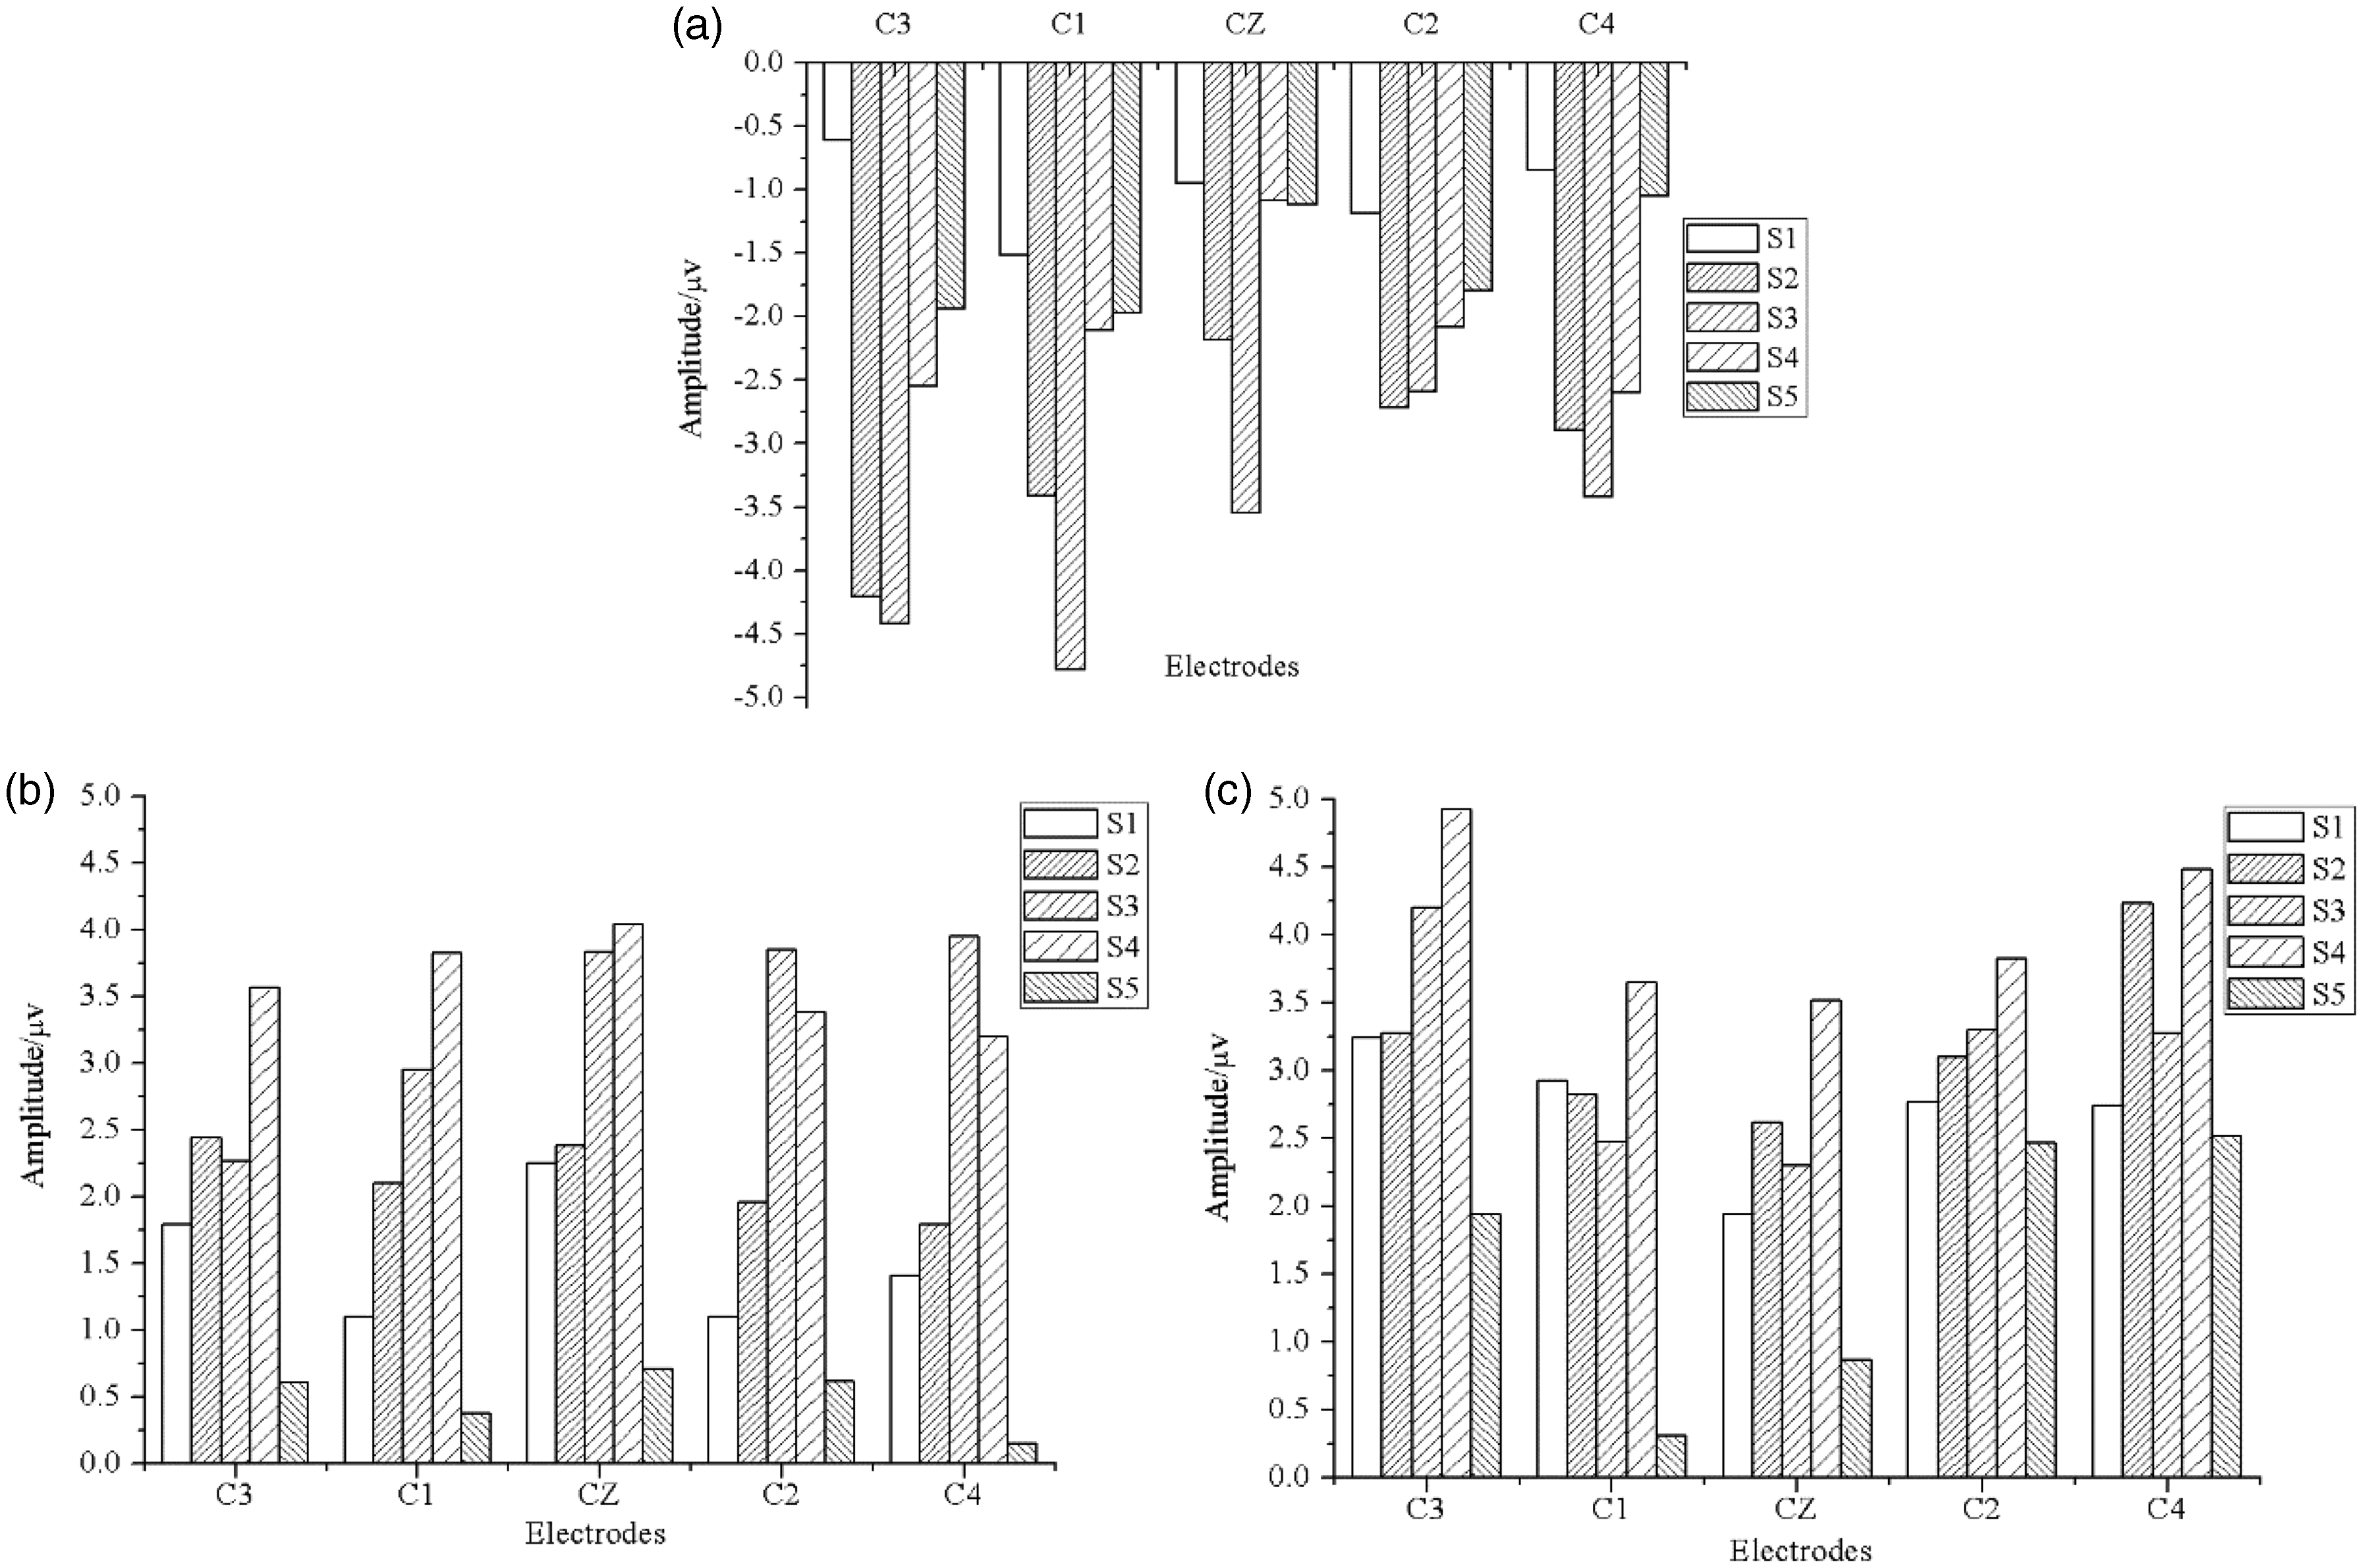
The amplitude distribution of (a) N100, (b) P200, and (c) P300 potential at each electrode in the somatosensory functional brain region.
According to Table 3 and Figure 4, compared with the amplitude of each electrode, it could be seen that in the time range of 100–200 ms, the somatosensory brain region was dominated by negative potential waves, and the average amplitude could reach –3.75 µv. The electrodes with larger amplitude were mainly located in C3, C1, and CZ. In the range of 200–300 ms, the somesthetic brain area was dominated by positive potential waves, the average amplitude could reach about 3.6 µv, and the amplitude intensity of each electrode was evenly distributed. In the time range of 300–400 ms, the somatosensory brain region was dominated by positive potential waves, and the average amplitude could reach about 4 µv. The major electrodes with large amplitude are C3 and C4. That is, the components of tactile evoked potentials of fabrics mainly included N100, P200, and P300. Among them, the brain regions with large amplitude of N100 were mainly distributed in the contralateral central parietal lobe. P200 waves were evenly distributed in the central region. The brain regions with large amplitude of P300 were mainly distributed on both sides of the central parietal lobe.
Correlation analysis between fabric tactile properties and characteristic evoked potentials
In order to explore the correlation between tactile perception and characteristic evoked potentials, SPSS was used to conduct Pearson correlation analysis of the two, and the correlation coefficients were obtained as shown in Table 4.
Pearson correlation coefficients between tactile properties and amplitudes of the evoked potentials

Note: * The correlation was significant when the confidence (double test) was 0.05. ** The correlation was significant when the confidence (double measure) was 0.01.
According to Table 4, within the electrode ranges of the somesthetic functional brain region, first of all, the amplitudes of N100 potentials were highly negatively correlated with the relative stiffness values, but since the N100 potentials were negative, in other words, the stiffer the material was, the greater the activation intensity value of the somesthetic brain region at around 100 ms. Secondly, the amplitudes of P200 potentials were highly negatively correlated with the relative smoothness values of the materials, that is, the smoother the material was, the lower the activation intensity of the somatosensory brain region at around 200 ms. In addition, there was a certain positive correlation between the amplitudes of P200 potentials and the relative softness values, especially the P200 components at the electrodes C3 and C1 where the contralateral somatosensory brain region was located. However, the correlation test results were not significant, which might be caused by the small number of samples. Finally, the amplitudes of P300 potentials were positively and negatively correlated with the relative softness values and relative smoothness values of the materials, especially in the contralateral somatosensory sensory brain area, which were highly correlated due to the contralateral transmission of somatosensory neural pathways.31,32 Since the materials were touched with the right hand in this experiment, the contralateral somatosensory brain area was located at electrodes C3 and C1, the ipsilateral somatosensory brain region was located at electrodes C2 and C4, and the correlations between tactile properties and potential amplitudes at electrodes C3 and C1 were slightly higher than that between tactile properties and potential amplitudes at electrodes C2 and C4. In addition, this is because the smaller the relative softness value, the softer it was. In other words, the softer and smoother the fabric was, the smaller the amplitude of the positive wave peak appearing at about 300 ms, and the smaller the activation intensity of the somesthetic perceptual brain area.
According to Table 4 and Figure 4(a), by comparing the amplitude of N100 potential of each sample under tactile stimulation, it could be seen that S3 was the material with the highest average amplitude intensity of each electrode, followed by S2, S4, S5, and S1. That is, with the increasing stiffness of the material, the activation intensity of early negative components in the somesthetic brain region kept increasing. As one of the commonly used physiological indicators for sensory processing, N100 is referred to a negative deflection cortical signal that appeared about 100 ms after the skin was stimulated. Compared with P200 and P300, N100 has been less studied in the past, but it has gradually developed into a hot spot in the ERP research field because of its higher reliability. 33 Many studies have shown that N100 potential is associated with states of consciousness,34,35 the auditory system,36,37 and the tactile system.38,39 Earlier studies have shown that the amplitude of N100 decreased with a deeper sleep. 40 It has also been suggested that this reduction might be related to the suppression of auditory stimuli to maintain sleep, 41 and that the amplitude decreased with the repetition of the sound pitch. 42 It has also been pointed out that the decrease of N100 amplitude could reflect the loss of inhibition of sensory processing. 43 OniZ et al. 44 compared the human brain’s response to painless tactile stimuli before and during sleep, and found that the amplitudes of P50, N100, and P200 related to sensory processing were significantly higher before sleep than during sleep, so it was suggested that the decrease of N100 amplitude might also be related to the inhibition of tactile stimuli. Kim et al. 45 applied tactile stimulation to the right-hand index finger with two different intensities through suction pressure, and also found that the amplitudes of N100 and P300 of the C3 electrode increased with the increase of stimulation intensity under different stimuli, and proposed that the two were related to perception and cognition in the body sensory area of the brain, respectively 45 With the increasing stiffness of the fabric, the gradual increase of the N100 crest might also be caused by the increased inhibition of the early components of the somatosensory brain region caused by the stiff tactile perception.
According to Table 4 and Figure 4(b), by comparing the P200 potential amplitude of each sample under tactile stimulation, it could be seen that the material with the highest average amplitude intensity of each electrode was S4, followed by S3, S2, S1, and S5. That is, with the gradual increase of material smoothness, the activation intensity of mid-term positive potential in the somatosensory brain region decreased. Conversely, the rougher the material, the greater the activation strength of P200 potential. P200 is an exogenous component processed by human brain for stimulation, and its amplitude is mainly affected by the physical characteristics of stimuli, rather than by human subjective factors. 46 Therefore, the size of its peak value represented the neural response intensity of brain neurons to the stimulation of the rough characteristics of the material surface. When human skin came into contact with the surface of the material, the adhesion friction gradually decreased with the increase of the surface smoothness of the material, and the friction of human skin also decreased, thus reducing the activation response of the somatosensory brain region. 47 Conversely, the rougher the surface of the material, the greater the activation reaction.
According to Table 4 and Figure 4(c), by comparing the P300 potential amplitude of each sample under tactile stimulation, it could be seen that the material with the highest average amplitude intensity of each electrode was S4, followed by S2, S3, S1, and S5. In other words, as the smoothness and softness gradually increased, the activation intensity of the late positive potential in the somatosensory brain region decreased. Softness actually consisted of two factors, namely stiffness and friction against the human body. 48 This might be due to the fact that under the same force, the softness of the textile material increased, and the degree of extrusion deformation of the finger decreased. Due to the existence of interlocking, the friction force on the finger skin gradually decreased and the mechanical stimulation receptors under the skin received less and less stimulation, and the sensation became weaker and weaker. 49 P300 is an intrinsic component in the late processing of stimuli by human brain and its amplitude is mainly related to psychological activities and is affected by human subjective factors rather than the physical properties of stimuli, reflecting the cognitive judgment of human brain on stimuli,50,51 that is, the amplitude intensity of P300 represented the feeling obtained by the human brain after processing tactile stimuli to materials. Therefore, when the material becomes softer and smoother, the human brain would feel less intense, resulting in a decrease in the amplitude of the P300 potential component.
Conclusion
In summary, the effects of different tactile properties of materials on the nerve potentials of the human sensory cortex were studied by utilizing ERP technology. The results showed that the amplitudes of exogenous components N100 and P200, which were affected by physical properties, increased and decreased respectively with the increase of stiffness and smoothness in the somatosensory functional brain region, which was determined by the degree of physical stimulus. Meanwhile, the amplitudes of endogenous late positive potential component P300, which was related to subjective perception, decreased with the gradual increase of material softness and smoothness, which was related to the subjective cognitive processing of the human body. In particular, it was highly correlated with the contralateral somatosensory brain area. Therefore, N100, P200, and P300 potentials could be used as neurophysiological response indexes of brain neurons to distinguish the difference in stiffness, smoothness, and softness of materials, respectively. In the future, with the in-depth study of ERP technology in the field of tactile perception, the dynamic comfort quantitative characterization of materials could be further developed.
Footnotes
Declaration of conflicting interests
The author(s) declared no potential conflicts of interest with respect to the research, authorship, and/or publication of this article.
Funding
The authors disclosed receipt of the following financial support for the research, authorship, and/or publication of this article: This work was supported by the National Natural Science Foundation of China (grant no. 52003245), the Natural Science Foundation of Zhejiang Province (grant no. LQ18E030007), the Open Fund of the Key Laboratory of Advanced Textile Materials and Preparation Technology of the Ministry of Education and Key Laboratory of Fiber Materials and Processing Technology of Zhejiang Province (grant no. 2019QN05), the fund supported by Zhejiang Nigao Textile Co., Ltd (grant no. 23070271-J), the General Scientific Research Fund of Education Department of Zhejiang Province (grant no. Y202148026), the Research Foundation of Zhejiang Sci-tech University (grant no. 20072325-Y, 21202299-Y, and 17072156-Y), and the Shandong Provincial Natural Science Foundation (grant no. ZR2020QF115).