
Abstract
Southern California is facing a demographic transformation that will become characteristic of the nation as a whole in coming decades. In this research, we present a historical review of the region’s attempt to address school inequity, recent enrollment and segregation trends, and an investigation of whether segregation still matters. Our results indicate that school segregation has increased, with inequitable access to learning opportunities and resources enduring. Policies advocating integration by some combination of socioeconomic status, race, and/or linguistic background are legal, offer real possibilities, and should be used in Southern California and other similar regions across the nation.
Southern California is one of the world’s most diverse, urbanized communities with people from every part of the globe, no racial majority, and a sense that it is way ahead of the rest of the country. Yet while the region is seen as progressive along many social and political dimensions, it has done almost nothing to confront segregated and unequal education. The truth is that the civil rights revolution in the South never really arrived in Southern California.
Though there is almost no public discussion of segregation in Southern California, the differences in schools and neighborhoods one or two freeway exits apart are shocking. If one compares the outcomes in the “dropout factory” schools, where the major product is dropouts or students totally unprepared for college, with the kind of opportunities that exist in schools serving affluent communities, it seems they could be serving different countries. The fact that California’s level of public funding for schools has become one of the worst in the United States makes the private resources more affluent communities can give their schools all the more important.
In this study, we present a detailed overview of desegregation efforts since the 1960s across the state and region from a historical review of political and legislative media. In the following, we explore patterns of school segregation and the associated outcomes and opportunities for students in Southern California. We close with a discussion of these findings and implications for policy. This analysis provides the first comprehensive, region-wide study of school segregation in the six-county Southern California area.
Theoretical Framework
In Brown v. Board of Education of Topeka (1954), the Supreme Court unanimously agreed that separate but equal schools would never work. The consensus of nearly60 years of subsequent social science research on the benefits of integration and the harms of school segregation concurs with their decision (Linn & Welner, 2007). This principal conclusion can be explained by perpetuation theory, which posits that continued segregation and its effects will perpetuate “across the stages of the life cycle and across institutions when individuals have not had sustained experiences in desegregated settings earlier in life” (McPartland & Braddock, 1981, p. 149). Two main frameworks can help better explain perpetuation theory and its effects: intergroup contact theory (Braddock, 1980; McPartland & Braddock, 1981) and network theory (Wells & Crain, 1994).
The contact hypothesis states that intergroup contact, particularly under a set of certain specified conditions, can produce generally positive changes in intergroup attitudes and interaction patterns (Allport, 1954). The meta-analytic work by Pettigrew and Tropp (2006), which explored over 500 studies, as well as a more recent meta-analysis with studies in school settings (Tropp & Prenovost, 2008), provides clear support that contact is likely to lead to improvement in intergroup relations, particularly when structured under certain conditions that support intergroup relations. These improved benefits, which are increasingly important in our multiracial society, include reducing prejudice and stereotype development, increasing empathy, and increasing the willingness to live in racially diverse settings as adults.
Racially and socioeconomically isolated schools are strongly related to an array of factors that limit educational opportunities and outcomes. Network theory provides an explanation, suggesting that social networks are an important capital for students and their families, but due to racial or class segregation these networks differ in quality and content (Braddock & Eitle, 2004; Knox, Savage, & Harvey, 2006). The social capital differences between impoverished minority schools and Whiter and wealthier schools potentially play out in important ways, such as the latter: hiring and retaining more highly qualified and experienced teachers (Clotfelter, Ladd, & Vigdor, 2005; Rivkin, Hanushek, & Kain, 2005); normalizing a school and community climate that encourages homework completion, academic achievement, regular attendance, and college enrollment (see Kahlenberg, 2001); and offering students more advanced and challenging curricula (Rumberger & Palardy, 2005). These disparities, as well as others, tend to produce lower educational achievement and attainment—which in turn limits lifetime opportunities—for students who attend high poverty, high minority school settings (Borman & Dowling, 2010).
Within integrated schools—where intergroup contact is possible, social networks are shared, and perpetuation can be interrupted—studies have shown that these settings are associated with higher academic achievement for minority students (with no corresponding detrimental impact for White students; Crain & Mahard, 1983). These trends later translate into high educational and career expectations (Dawkins, 1983; Kurlaender & Yun, 2005), as well as high levels of civic and communal responsibility (Braddock, 2009). Earnings and physical well-being are also positively impacted; a recent study found that Black students who attended desegregated schools for at least 5 years earned a quarter more than their counterparts in segregated settings (Johnson & Schoeni, 2011). By middle age, the same group was also in far better health. Perhaps most important of all, evidence indicates that school desegregation can have perpetuating effects across generations. Students of all races who attended integrated schools are more likely to seek out integrated colleges, workplaces, and neighborhoods later in life, which may in turn provide integrated opportunities for their own children (Mickelson, 2011; Wells & Crain, 1994).
Study Design
This study consists of three sections. Part one presents a detailed review of desegregation efforts since the 1960s across the state of California and in the Southern California region. It draws on a historical review of political and legislative actions.
Part two explores demographic and segregation patterns in Southern California public schools by analyzing education data from a variety of sources. Data consists of the 2008 to 2009 Common Core of Data (CCD) from the National Center for Education Statistics, 2008 to 2009 data from the California Department of Education, and the 2005 to 2009 tract-level data from the American Community Survey.
We explore two different measures of segregation: concentration of segregated schools, and the average exposure of racial group members and low-income students. For the former, we investigate school segregation patterns by the proportion of each racial group in intensely segregated schools (90%-100% of the student body are students of color), as such schools are nearly always associated with stark gaps in educational opportunity (Borman & Dowling, 2010). For the latter, we calculate exposure and isolation rates by exploring the percent of a certain group of students (e.g., Latino students) in school with a particular student (e.g., White student) in a larger geographical area, and finding the average of all these results. This measure might conclude, for example, that the average White student in a particular district attends a school with 35% Latino students. That average is a rough measure of the potential contact between these groups of students, with higher values on the index of exposure but lower values for isolation indicate greater integration. We focused on exposure rates rather than evenness measures of segregation, such as the dissimilarity or multigroup entropy index, as the latter, although important, provide a measure of distribution, rather than the experience of segregation from the viewpoint of average students.
In part three of this study, we explore educational opportunities and outcomes across schools in Southern California with varying racial concentrations of students. This investigation uses a number of statistical indicators to measure educational opportunity and outcomes, such as school safety, teaching quality, degree of college preparation, and degree of rigorous mathematical education. We also explore racial outcome gaps in southern California between more affluent and White schools in comparison with segregated and intensely segregated schools. Multiple years of data files derived from the California Department of Education, including California Basic Educational Data System’s School Information Form and Professional Assignment Information Form, school acreage information for school facilities, and Standardized Testing and Reporting files. Data were also obtained from the California Postsecondary Education Commission to calculate indicators, such as the Cumulative Promotion Index (Swanson, 2004).
Part One: Desegregation in Southern California—Early Promises, Subsequent Failures
California’s courts were among the first to hear arguments detailing the harms of school segregation for minority students, and to rule against the practice as it involved Latino students. The 1946 Mendez v. Westminster decision in the Los Angeles suburb of Westminster was an important forerunner to Brown (1954). In general, the state maintained a positive policy on integration until serious resistance developed in the l970s.
California law until the late 1960s was interpreted by the state Supreme Court to mean that school segregation was inherently unequal, regardless of its cause or origin. This acknowledgment resulted in a decidedly lower standard of proof in desegregation cases heard by the state courts—unlike the federal judicial system, which traditionally placed a great burden on civil rights groups. In federal school desegregation cases, civil rights advocates were forced to gather together massive resources in an effort to compile evidence proving complex historical violations in large cities (Orfield, 1978). In contrast, the California Supreme Court simply ruled that segregated schools were illegal, whatever their cause, and that, if necessary, desegregation could take place across district boundary lines (something the U.S. Supreme Court made extremely difficult in its l974 Detroit decision—Milliken v. Bradley). Given this context, a number of Southern California’s major legal battles over segregation went to state courts rather than to the federal judicial system.
A Rightward Shift: Governor Reagan and Statewide Propositions Help Undermine Early Desegregation Efforts
In spite of the state’s promising legal context, an ongoing struggle occurred over the parameters of civil rights law and the politics of implementing it. Following the l965 Los Angeles riots, the election of Ronald Reagan as California’s governor (l966-1974) heralded a dramatic swing to the right. Reagan was a civil rights adversary; he had opposed California’s fair housing law and was one of the few Republican leaders outside the South who opposed the historic 1964 Civil Rights Act.
Just a few years prior to Reagan’s election, in 1963, plaintiffs filed the Los Angeles school desegregation case. However, due to long delays in the courts (including a 5-year delay on appeal), the electoral defeat of the first judge, who ruled that the city must desegregate, and the subsequent reluctance of any other judge to take the case—in addition to a massive legal battle—it would be many years before a Los Angeles desegregation plan was approved by the state Supreme Court (Crawford v. Los Angeles Board of Education, 1976). And in the meantime, California voters adopted the first proposition intended to block desegregation orders.
The statewide presidential election ballot of 1972 contained a proposition repealing a California law requiring districts to study and consider options to diminish segregation. Known as the Wakefield Anti-Busing Proposition, it explicitly forbade the race-conscious assignment of students for purposes of desegregation. Sixty-two percent of Californians voted to adopt the Wakefield Anti-Busing Proposition in the 1972 election (California Secretary of State, 1972). Ultimately, though, the California Supreme Court overruled the proposition as illegitimately eliminating basic constitutional rights (Crawford, 1976).
The proposition that actually succeeded in eliminating desegregation rights was called Proposition 1, approved by two thirds of California voters in 1979. Proposition 1 originated as a direct result of a Los Angeles desegregation order and the recommendations of court-appointed experts to include the suburbs in the remedy. It was explicitly designed to roll back desegregation rights in the state.
After the passage of Proposition 1, school desegregation could continue only with a finding of intentional segregation (previously the California Supreme Court found segregation to be inherently unequal under the state constitution, regardless of the cause). Still, the trial judge in Los Angeles’ Crawford case held that there had been a finding of intentional discrimination in the district, only to be overturned by the appellate court which promptly ordered the termination of the mandatory desegregation plan. The state Supreme Court—under fierce attack by conservatives—then refused to hear the case, stunning observers who had watched it uphold desegregation mandates for decades. Civil rights groups appealed Proposition 1 all the way to the U.S. Supreme Court, where a more conservative Supreme Court ruled in l982 that the California proposition was legal.
Because of the intense political pressure brought to bear on the Crawford case, court administrators were unable to find a single judge in Los Angeles willing to take it on after the first judge was defeated for reelection. California’s trial judges for the Superior Court were locally elected officials and, consequently, very reluctant to take on controversial cases.
As it was impossible for civil rights groups to obtain sufficient resources to carry out a federal lawsuit proving the history of discrimination among the hundreds of Los Angeles schools, the U.S. Supreme Court’s 1982 decision regarding Proposition 1—and the state Supreme Court’s refusal to hear the case—marked the end of desegregation in the city (apart from a small program of magnet schools) after less than 2 years of implementing a modest plan. No other major city had abandoned desegregation so rapidly. The judicial actions signaled an elimination of rights that had consistently been found to be part of the California constitution—and a virtual guarantee that nothing of consequence could be done to desegregate California’s largest cities in state courts.
The Supreme Court Limits Desegregation and Equity
President Nixon had the unusual good fortune to appoint four new Supreme Court justices in his first term. They supplied four of the five votes to limit desegregation across city-suburban lines in the l974 Milliken v. Bradley decision, which made it far more difficult to successfully desegregate central cities and racially changing suburbs—critical issues for Southern California during that period. The same four justices were also a critical voting bloc in San Antonio Independent School Dist. v. Rodriguez (1973)—a 5-4 decision that failed to establish a federal right to equal school resources. In essence, Nixon appointees’ decisions meant there was no federal right to either meaningful desegregation or equal schooling for groups that had been historically excluded in Southern California and the nation.
Pasadena: A Federal Desegregation Case
The only case that went to the U.S. Supreme Court from Southern California produced a clear limit on desegregation policy. In 1976, a ruling involving the Pasadena school district reasoned that courts did not have to adjust school desegregation plans as the demographics of communities changed (Pasadena Board of Education v. Spangler, 1976).
Prior to making its way to the Supreme Court, the trial judge in Pasadena’s Spangler case concluded that the district was not yet fully desegregated. And because racial change led to the resegregation of five schools in the 4 years after the l970 plan was implemented, the trial judge had directed the district to readjust the plan regularly to prevent racial resegregation. Yet in a clear sign of changes to come, the Supreme Court ruled, 6-2, that the lower court’s order was not permissible. The Pasadena case was the first triumph of Justice William Rehnquist (later elevated to chief justice by Reagan) in what would be a continuing effort to roll back federal desegregation requirements (Davis, 1989). The Court held that unless plaintiffs could show that racial change was linked to new segregative actions, the judicial system had no power to require further desegregation “once the affirmative duty to desegregate had been accomplished and racial discrimination through official action [was] eliminated from the system” (Pasadena v. Spangler, 1976, p. 425).
The Spangler decision (as well as Milliken) was a critical barrier to the evolving process of urban school desegregation, particularly in Southern California, an area of great mobility, massive immigration, and vast racial change. Given the rapid racial transition occurring in the region, the decision effectively allowed desegregation plans to become outdated almost as soon as they were implemented. Spangler demonstrated an unwillingness to deal with the nature of demographic change in metropolitan areas, where the great majority of Americans lived. The ruling also reflected a judicial tendency to look at a single court order, which may have produced desegregation for a few years, as fully repairing the damage caused by generations of discrimination.
San Diego: The Limits of Voluntary Integration Strategies
San Diego, a large city with a sizable White population, had favorable conditions for desegregation. Yet the desegregation process came late to San Diego and was never applied vigorously. In the end, San Diego’s plan amounted to a purely voluntary approach—largely in the form of a modest magnet program—and no transfer of White students to segregated non-White schools.
The desegregation lawsuit in the San Diego Unified School District (SDUSD), Carlin v. Board of Education (1967-1998), was filed 13 years after the Crawford case, shortly following the 1976 California Supreme Court’s decision upholding the Los Angeles ruling. In the next year, the Superior Court in San Diego decided to follow a completely voluntary integration method of the sort that had never produced district-wide desegregation. The district created magnet schools, concentrated in the inner city, and a program called Voluntary Ethnic Enrollment Program (VEEP) to permit voluntary transfers of Black and Latino students to outlying White schools. The order left the White parts of the city virtually untouched and failed to desegregate neighborhood schools that were initially identified as illegally segregated in the court order.
San Diego district officials later supplemented VEEP and magnet programs, which had long provided free transportation to students, with an open enrollment option allowing students to attend any school in the district without the offer of transportation. Of course, lacking transportation provisions, choice plans do not offer real options for families who cannot provide their own transport to school every day and place disproportionate limits on disadvantaged families. All three voluntary choice strategies continue to the present day, with charter schools rounding out the array of options currently available in the district.
Yet recent reports based on San Diego schools raise concerns that, of the four major school choice programs in the district, just two continue to promote racial diversity. Not surprisingly, magnet schools and VEEP—both of which maintain important civil rights protections, including free transportation and specific diversity goals tailored to meet state standards—have a positive effect on integration in the district (Betts, Rice, Zau, Tang, & Koedel, 2006). Open enrollment and charter schools, on the other hand, have a segregating effect on students in San Diego public schools. Both of the latter programs attract disproportionately higher percentages of White students (Frankenberg, Siegel-Hawley, & Wang, 2010).
The San Diego narrative suggests that little desegregation occurred in the district, primarily due to the voluntary nature of a plan that relied on families to navigate the choice system. Of the 23 schools the courts found segregated in 1976, not only were 9 still segregated a third of a century later, but they were also under sanctions for failing to meet the Adequate Yearly Progress requirements of the No Child Left Behind Act (Magee, 2004). In the meantime, though the court had avoided any mandatory desegregation because of fears of White flight, the district changed from a situation where about three fourths of students were White to one where under one fourth are White.
Growth of School Choice in Southern California: Promise or Peril?
Like SDUSD, Los Angeles Unified School District (LAUSD) has also experienced growing interest in school choice options. Together, magnet and charter schools enroll nearly one out of five students in LAUSD (“Graphic: Types of schools,” 2010). The growth of choice in the region’s two largest school districts presents possibilities to either promote or detract from efforts to increase school diversity. Schools of choice offer an important opportunity to disentangle patterns of residential segregation from school segregation trends because they are able to draw students across traditional attendance boundaries—and, in some cases, across district boundary lines.
However, the example of San Diego illustrates some of the ways in which the design of school choice can impact racial diversity. Choice programs that contain civil rights considerations—like the provision of free transportation, outreach to a diverse set of communities, diversity goals embedded in the admissions process—ultimately tend to be associated with higher levels of diversity (Frankenberg & Siegel-Hawley, 2008). Magnet schools, a system of choice with historical roots in the desegregation era, are often (but not always—see Frankenberg & Le, 2008) structured with these civil rights protections in mind. By contrast, the charter sector is governed by a disparate set of state laws related to racial diversity and recently have received little in the way of federal guidance on the importance of designing programs to promote diversity (Siegel-Hawley & Frankenberg, 2011). Without strong federal or state policy in place, and with little evidence of enforcement of existing policy, it follows that charter schools have been linked to high levels of segregation, particularly for Black students (Finnigan et al., 2004; Miron, Urschel, Mathis, & Tornquist, 2010).
One study found that statewide, minority students in California’s charter schools were more likely to enroll in intensely segregated environments (where 90%-100% of students were minorities) than minority students in regular public schools (Author, 2010). However, the report also found that California’s charter schools enrolled a disproportionate share of White students, suggesting that charters may be facilitating patterns of White segregation in some locales. Evidence from Southern California suggests that White segregation in charter schools is indeed an issue, particularly in the Inland Empire.
In sum, desegregation in Southern California has been severely undermined by shortsighted and circumscribed efforts to provide students of color access to the region’s most highly resourced schools. In what has become the most multiracial, complex locale in the country, token efforts to integrate have done little to alter profoundly separate educational systems.
Part Two: Demographics and Segregation
In this section, we explore the school demographic intricacies of the Southern California region. We then examine the racial and socioeconomic enrollment trends using two different measures of segregation.
Demographics
Since the Warren Court handed down Brown (1954), California has become the nation’s most racially diverse state. There are 3.2 million public school students in the six counties of Los Angeles, Orange, Riverside, San Bernardino, San Diego, and Ventura (National Center for Education Statistics [NCES], 2008-2009). Almost a fifth of all U.S. Latinos, now the nation’s largest minority group, go to school in this region, where they face great challenges.
In 2008 to 2009, students from different racial groups were unevenly distributed across the region (see Table 1). Latino students make up more than one out of every two Southern California schoolchildren, but are most heavily concentrated in Los Angeles and the inland counties of Riverside and San Bernardino. Just under half of students attending school in Orange and San Diego counties identify as Latino. At the district level, LAUSD is overwhelmingly comprised of Latino students, much more so than SDUSD.
School Enrollment, 2008-2009.
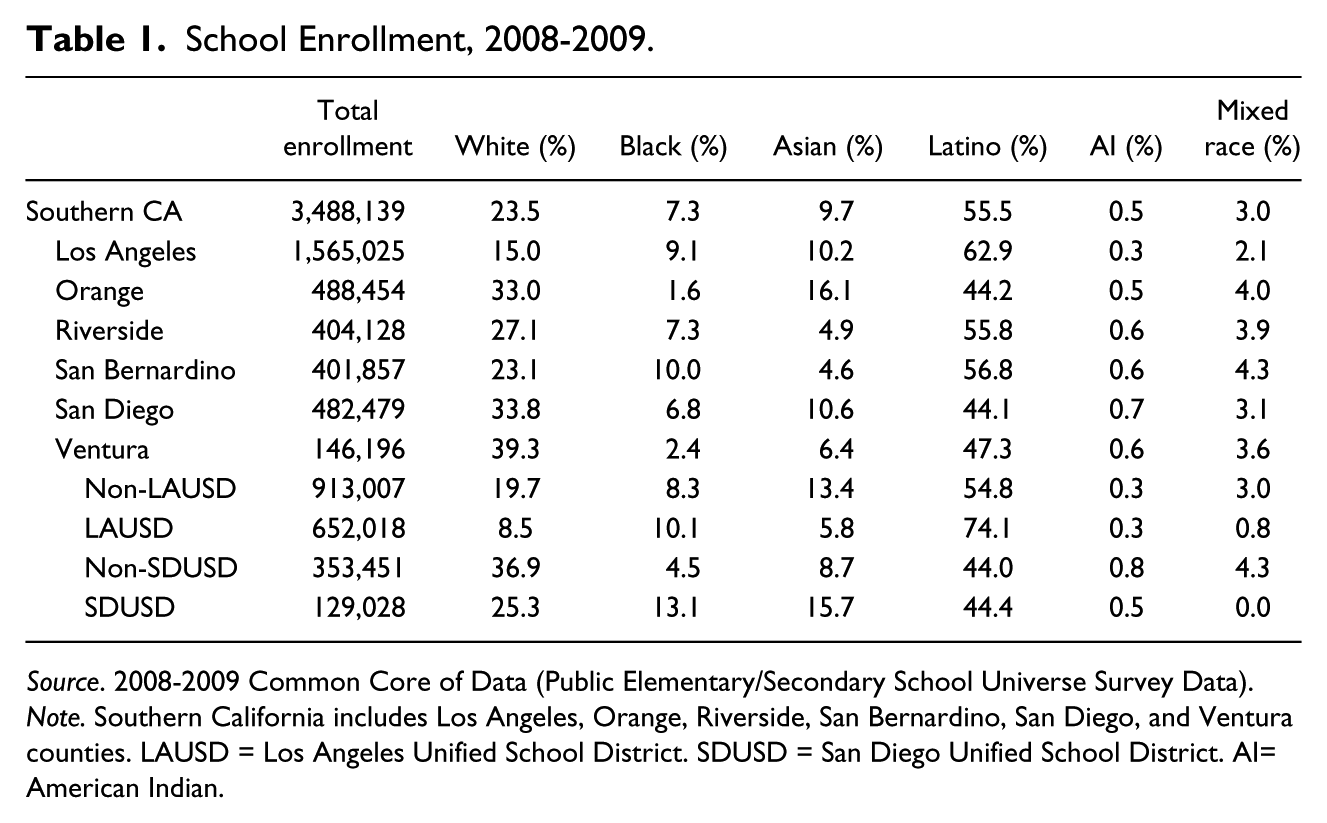
Source. 2008-2009 Common Core of Data (Public Elementary/Secondary School Universe Survey Data).
Note. Southern California includes Los Angeles, Orange, Riverside, San Bernardino, San Diego, and Ventura counties. LAUSD = Los Angeles Unified School District. SDUSD = San Diego Unified School District. AI= American Indian.
Black students overall represent 7% of the Southern California student population. Schools in Los Angeles and San Bernardino report the highest enrollments of Black students; Ventura and Orange County report the fewest. Enrollment numbers for San Bernardino and Riverside suggest a substantial black migration to the far reaches of the Inland Empire, while Orange County’s numbers show a very small, almost negligible movement to the locale.
One in 10 students in the Southern California region is Asian, amounting to the second largest concentration of Asian students in the country. A full 16% of students in Orange County schools are Asian, almost twice the share for the overall region. In the opposite direction, Asian students tend to be underrepresented in San Bernardino and Riverside counties. And unlike trends for Latino students, Asians make up a much larger share of SDUSD than LAUSD.
White students make up a little less than a quarter of Southern California’s students (compared with a little more than half of all U.S. students), but are significantly overrepresented in Orange, San Diego, and Ventura counties. The latter, located just north of Los Angeles, is the most heavily White county in the region. A quick glimpse at the percentage of White students in LAUSD (8.5%), versus White students in other Los Angeles school districts (19.7%), also shows that White students are disparately concentrating in certain Los Angeles communities that are not linked to LAUSD. Similar patterns occur in San Diego. Such racially disparate enrollment trends are buttressed generally by patterns of severe housing segregation, numerous district boundary lines that dice the six-county region into hundreds of different school systems, and the lack of any type of policy to help ameliorate the situation.
The Segregation of Students by Race and Income
Amid the convulsive demographic shifts of Southern California’s student population, levels of segregation have significantly worsened. As the White population declined, patterns of isolation for Latino students deepened. In 1970, the average Latino student attended a metro area school in Los Angeles that was roughly 45% White (Orfield, 1983). By 1980, the proportion of White students in the average Latino students’ school had decreased by more than half, to 21%. In San Diego, where White students comprised a larger majority, the White share of students in the average Latino students’ school went from about 67% in 1970 to 45% in 1980.
During the desegregation battles, Black students in the region experienced a brief increase in levels of exposure to White students (Orfield, 1983). In 1970s-era Los Angeles, the average Black student went to a school that was roughly 14% White, a figure that increased to 16% by 1980. San Diego’s Black students went to a school that was, on average, 36% White in 1970 and 43% White 10 years later.
By the dawn of the 21st century, however, Black students were resegregated into more racially isolated schools. In 2000, the typical Black student in SDUSD attended a school that was roughly 20% White. And for the average Black student in LAUSD, that figure was only 6% (Frankenberg, Orfield, & Lee, 2003, Table 19). Almost identical trends surfaced for Latino students in the early 2000s. None of these patterns are necessarily surprising as almost nothing—legally, politically, socially—has been brought to bear on the issue in recent memory.
Given the racial complexity of the region’s students, we examined segregation patterns with more recent data. All patterns point to a basic fact: Southern California’s students are extremely stratified in schools across the region.
Minority isolation
Intensely segregated minority schools refer to educational settings where 90% to 100% of students come from minority racial backgrounds. These segregated schools are nearly always associated with stark gaps in educational opportunity—explored in detail in the following data section. More than two out of five Latino students and nearly one third of all Black students in the region enroll in these intensely segregated learning environments (Table 2). By contrast, 4% of Southern California’s Asian students attend intensely segregated minority schools, and less than 2% of the region’s White students—who make up 24% of the overall population—do the same.
Percentage of Minority Students in Segregated Underrepresented Minority Schools, 2008-2009.

Source. 2008-2009 Common Core of Data (Public Elementary/Secondary School Universe Survey Data).
Note. Underrepresented minority reflects total Black, Latino, and American Indian enrollment.
The level of intense racial segregation in schools varies by locale. More than half of Latino students in Los Angeles attend intensely segregated schools, a figure that tops out at 69% in LAUSD. At the district level, however, Latino students in Los Angeles experience very different levels of racial isolation. Compared with the LAUSD percentage, only 42% of Latino students in non-LAUSD districts attend intensely segregated schools. North of Los Angeles, in Ventura, significant patterns of racial segregation for Latino students exist even though Whites constitute a near majority of students (which should result in more interracial exposure if students are evenly spread across the county). Less than a third of Latino students attend an intensely segregated school in Ventura. Latino students are also substantially segregated in Orange County, where a near third of Latino students attend intensely segregated schools. To the east, a similar trend (34%) persists for Latino students in San Bernardino attending intensely segregated schools.
Patterns of intense segregation for Black students in the region are also severe (see Table 2). Along the coast, almost one third of Black students in Los Angeles attended intensely segregated schools, rising to two thirds when limited to LAUSD. Levels of isolation are lowest in Orange County (5%), where Black students make up just 2% of the student population. Inland, Black students are less isolated in San Bernardino and Riverside counties, where, as we saw above, the student population more often reflected broader regional demographics. And further south, in San Diego, the level of isolation for Black students depends on whether or not they enroll in SDUSD, the largest district in the county. Eighteen percent of Black students attending SDUSD are in 90% to 100% minority schools, compared with 5% of county Black students enrolled in non-SDUSD districts.
Asian students are most likely to be racially isolated in LAUSD schools (12% attend intensely segregated settings) than in other districts. In Orange County, where the largest concentrations of Asian schoolchildren reside, just 2% of Asian students attend intensely segregated minority schools. That same figure rose to 6% in Los Angeles. Importantly, Asian student isolation remains significantly lower than trends for Black students in the region, though each comprise a similar share of the student population.
At all geographic levels, White students are by far the least likely to attend intensely segregated schools in Southern California. Though White students make up a quarter of the region’s enrollment, they are represented by single digit percentages in Southern California’s most segregated schools. In Orange County, just 1% of White students enroll in 90% to 100% minority schools—though Whites comprise 33% of the overall population in the county. In the Inland Empire counties, where White students make up roughly a quarter of the student enrollment, 2% of Riverside’s White students—and 5% of San Bernardino’s—attend intensely segregated schools.
Student exposure to other races
The average level of exposure students of one race experience to either their racial group or another group provides an alternative assessment of segregation. For example, a 10% exposure rate of Blacks to Whites means that the average Black student is in a school where Whites make up 10% of the student enrollment. The contemporary demographics of Southern California are substantially more complex than earlier battles over desegregation that occurred between just two racial or ethnic groups. Still, both the uneven distribution of White students in the region, and the accompanying unequal share of educational resources and outcomes—like challenging course offerings and graduation rates, which will be discussed shortly—suggest that looking closely at the proportion of White students in a school remains critical (Ladd, 2008).
Using the White share of student enrollment as a baseline, we examine the average White composition of Southern California schools attended by White, Black, Latino, and Asian students. The first line of Table 3 shows that the average White student in Southern California attends a school where close to 50% of their peers are also White, a doubling of the regional average of White schoolchildren. In comparison, Latino students enroll in schools that are, on average, 13% White, while the average Black student enrolls in a school that is 17% White. Finally, Asian students in the region attend schools where nearly 26% of the students are White. As White students make up 24% of Southern California’s population, it is clear that Latinos and Blacks are significantly isolated from White students, and that Whites are actually slightly overrepresented in the schools of Asian students. Latino students across the region experience the lowest levels of exposure to White students. From LAUSD—by far the most important school district in the United States for Latino students—where the average Latino student attends a school that is roughly 5% White, to Ventura, where the Latino exposure to Whites is 22%, Latino students generally attend schools where Whites represent roughly half their share of the overall county or district enrollment.
Exposure Rates to White Students in Southern California.
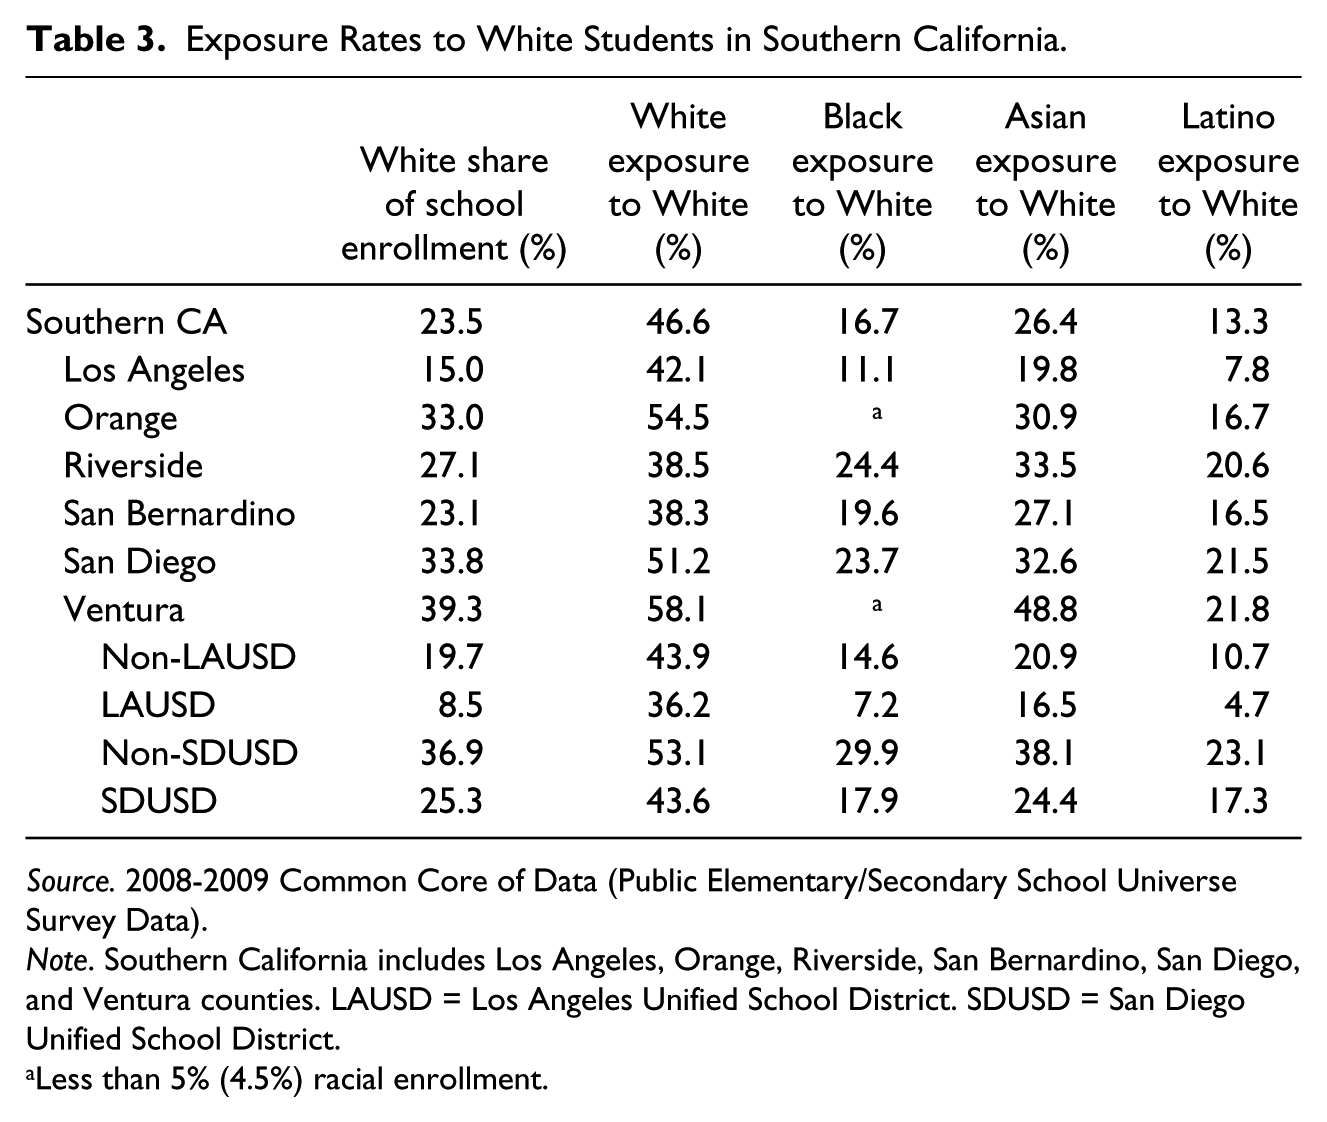
Source. 2008-2009 Common Core of Data (Public Elementary/Secondary School Universe Survey Data).
Note. Southern California includes Los Angeles, Orange, Riverside, San Bernardino, San Diego, and Ventura counties. LAUSD = Los Angeles Unified School District. SDUSD = San Diego Unified School District.
Less than 5% (4.5%) racial enrollment.
Black students across the region experience the highest level of exposure to Whites in Riverside and slightly less so in San Bernardino. In San Diego, both Blacks and Latinos experience disproportionately low levels of exposure to Whites.
Regionally, Latinos make up 56% of total public school enrollment. However, the average White student goes to a school where Latinos comprise a little less than a third of total students (see Table 4). Black students experience much higher levels of exposure to Latinos—a typical Black student attends a school with just over half of the student body identifying as Latino. This means that Black students are often attending schools with far more Latino students than fellow Black students, placing two historically disadvantaged groups of students together in racially complex community settings, where neighborhoods are often transitioning from predominately Black to Latino. Asian students, on average, experience disproportionately low levels of exposure to Latino students. Finally, Whites are typically the most segregated racial group across the nation, but in this region, Latinos are the most isolated: the average Latino student in Southern California attends a school that is almost three-quarters Latino.
Latino Exposure Rates in Southern California.

Source. 2008-2009 Common Core of Data (Public Elementary/Secondary School Universe Survey Data).
Note. Southern California includes Los Angeles, Orange, Riverside, San Bernardino, San Diego, and Ventura counties. LAUSD = Los Angeles Unified School District. SDUSD = San Diego Unified School District.
Less than 5% (4.5%) racial enrollment.
Latino students are also distributed unevenly across the six-county area, and levels of exposure vary accordingly. Los Angeles has the highest concentration of Latino students and also displays the most extreme isolation. Latinos in LAUSD typically attend a school where more than 80% of their fellow students are also Latino. But even in counties with lower shares of Latino students, such as Orange County, such concentrations persist. These results suggest that not only is Southern California the epicenter of the nation’s Latino population, but it is also a region of extreme Latino segregation.
Though Black students comprise a small minority of the student population in Southern California (just 7%), they often attend schools where they are substantially overrepresented (see Table 5). Region-wide, the typical Black student attends a school where Blacks make up 21% of the student body—and in Los Angeles that number climbs to 28%, three times the share of Black students in the county. Down south, in San Diego, where Black students account for 7% of students, the typical Black student goes to a school that is 15% Black. Black students also head to schools where they are overrepresented in the Inland Empire, though by less significant margins.
Black Exposure Rates in Southern California.

Source. 2008-2009 Common Core of Data (Public Elementary/Secondary School Universe Survey Data).
Note. Southern California includes Los Angeles, Orange, Riverside, San Bernardino, San Diego, and Ventura counties. LAUSD = Los Angeles Unified School District. SDUSD = San Diego Unified School District.
Less than 5% (4.5%) racial enrollment.
Like Black students, Asians attend schools with disproportionately higher shares of same-race students (see Table 6) but, because they represent only a tenth of the total regional enrollment, they very seldom attend segregated Asian schools. The average Asian student in Orange County and Los Angeles attend school with 2 and 3 times their share of the county population, respectively.
Asian Exposure Rates in Southern California.
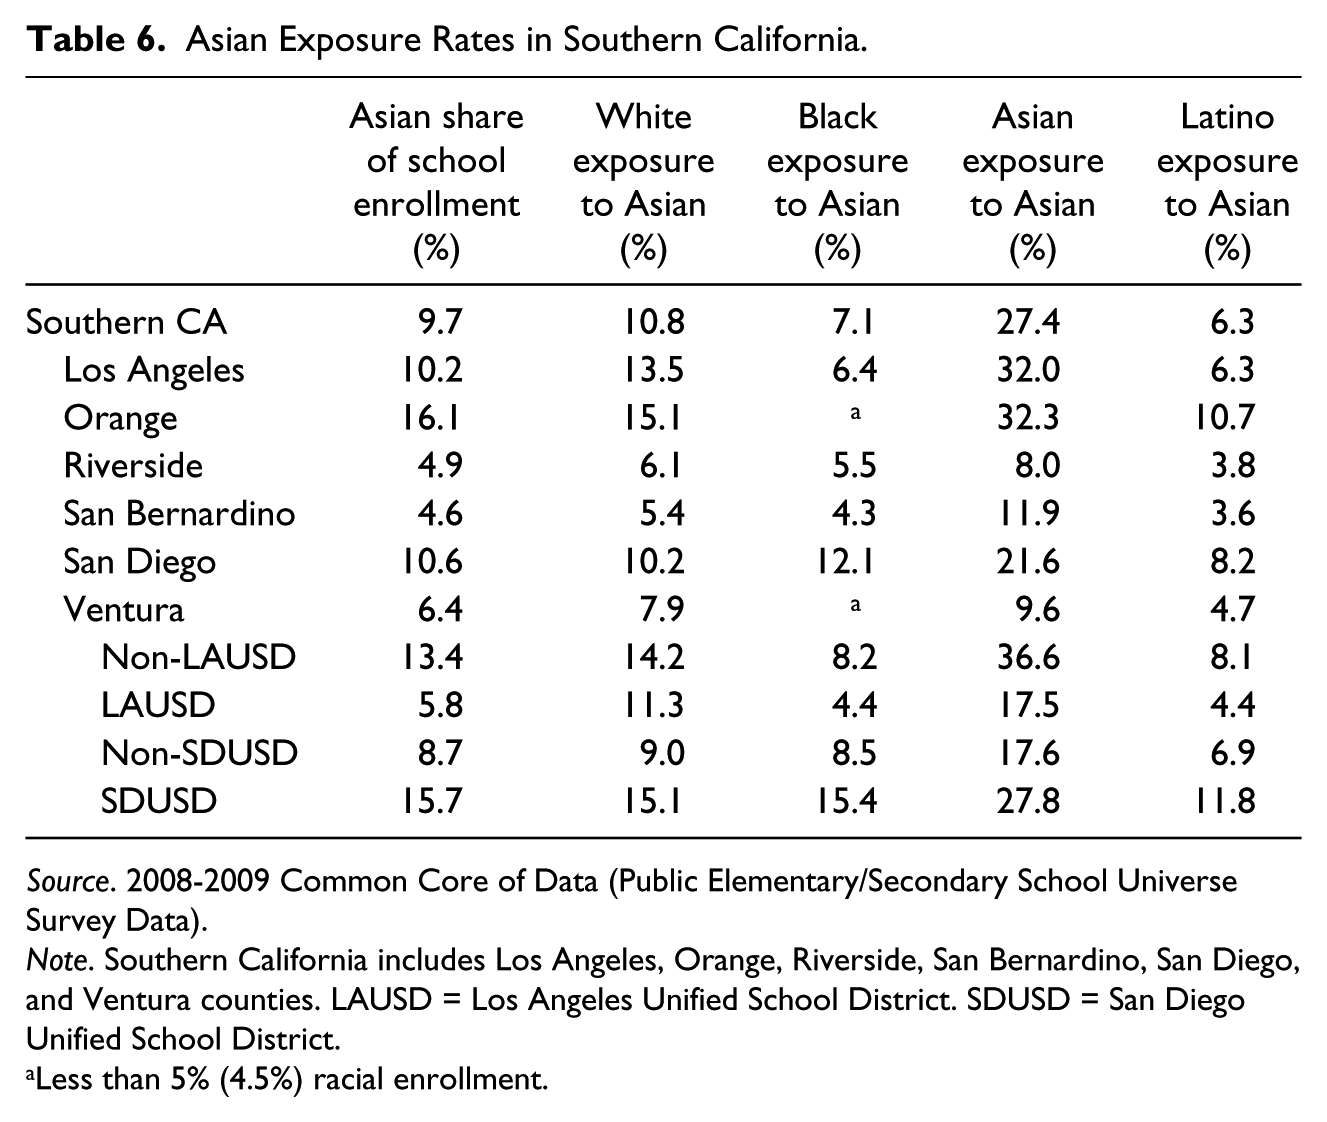
Source. 2008-2009 Common Core of Data (Public Elementary/Secondary School Universe Survey Data).
Note. Southern California includes Los Angeles, Orange, Riverside, San Bernardino, San Diego, and Ventura counties. LAUSD = Los Angeles Unified School District. SDUSD = San Diego Unified School District.
Less than 5% (4.5%) racial enrollment.
Interestingly, although Black and Asian students comprise roughly even shares of the Southern California population, the typical White student in the region attends a school where Black students make up just 5% of the population, but where Asian students account for 11% of the population. This finding suggests that Asian students are the most integrated racial subgroup with White students in Southern California.
Though Southern California is very diverse, students from the major racial and ethnic groups are being educated in dramatically different settings. White students, on average, are attending schools with twice the percentage of same-race peers as their regional student cohort. Black and Latino students, on average, are very isolated from significant contact with Whites, while Asian students have a much more integrated experience. As we explore the layers and dimensions of segregation from opportunity in the region’s schools in the next data section, these numbers will take on greater and greater significance.
Concentration of students by race and poverty status
A popular criticism of the desegregation movement often includes some variation on the statement: just sitting next to a White kid does not mean that a student of color will receive a better education (Adams, 1991). The observation rings true, especially amid the incredible diversity of the Southern California region. Yet, even beyond studies describing the psychological and social harm of separating children by race—research that shaped the outcome of the Brown decision—a vast amount of social science evidence documents the restricted educational opportunities associated with concentrating student poverty (Orfield & Lee, 2005). So when concentrations of minority students are closely overlaid with profound pockets of poverty—as we show in detail below—the racial composition of the classroom begins to matter very much indeed. This “double segregation,” where students are isolated by both race and class, is visible across the region.
More than half of Southern California’s students are eligible for free and reduced price lunch, a rough proxy for student poverty in the region. That figure represents a notable increase in the number of students from all racial groups living in near poverty in just 1 year (from 53% in 2007 to 56% in 2008) and is emblematic of myriad challenges facing under-funded school systems in the area.
In Southern California, almost all students are considered poor once the student body of a middle school or high school begins to serve a population comprised of 80% or more underrepresented minority students. Based on data from the California Department of Education, Table 7 presents the share of poor students in secondary schools across all six counties by the degree of underrepresented student concentration.
Percentage of Secondary Schools with Greater than 50% Poor Students in Southern California.
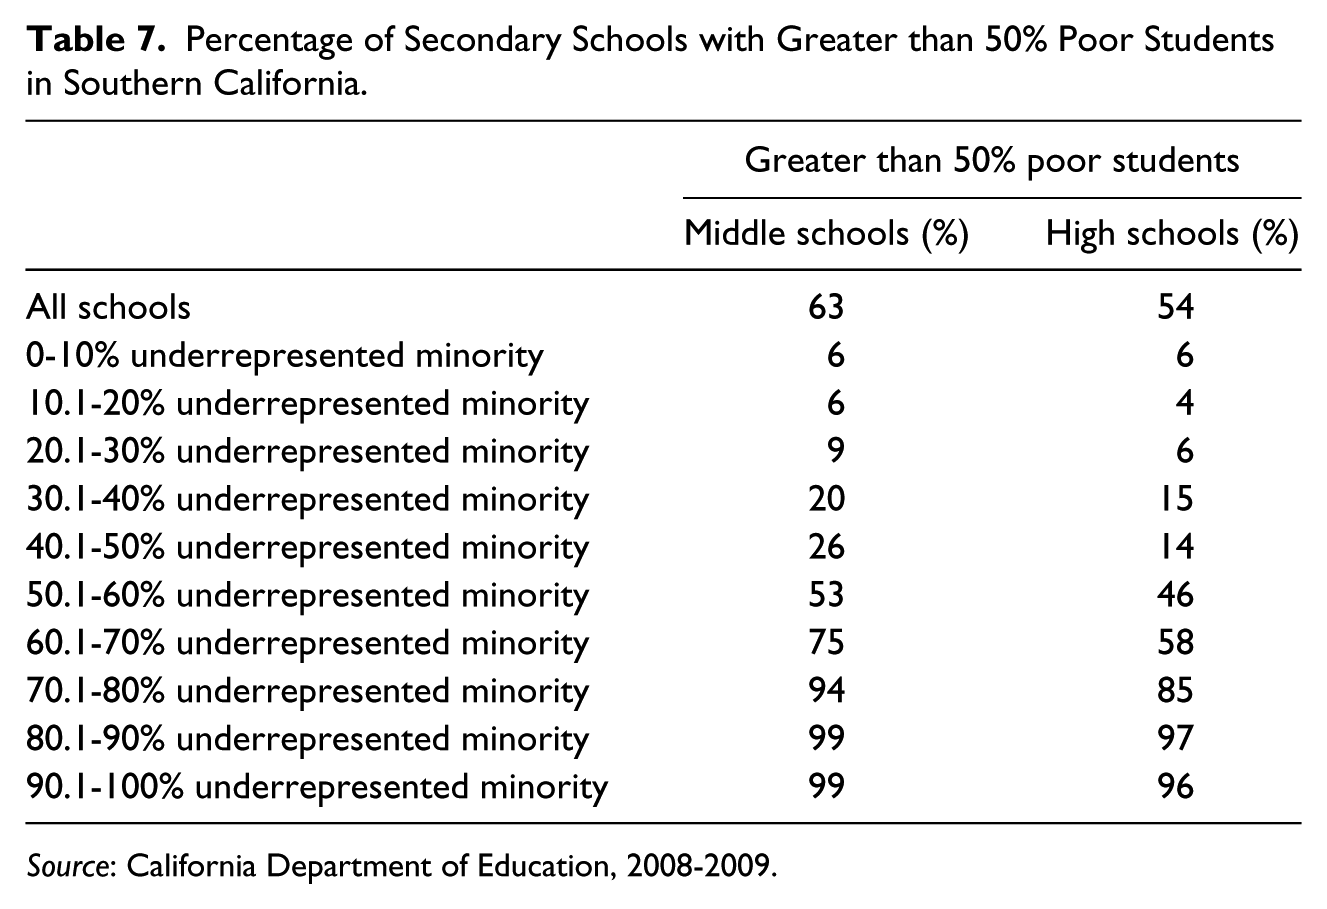
Source: California Department of Education, 2008-2009.
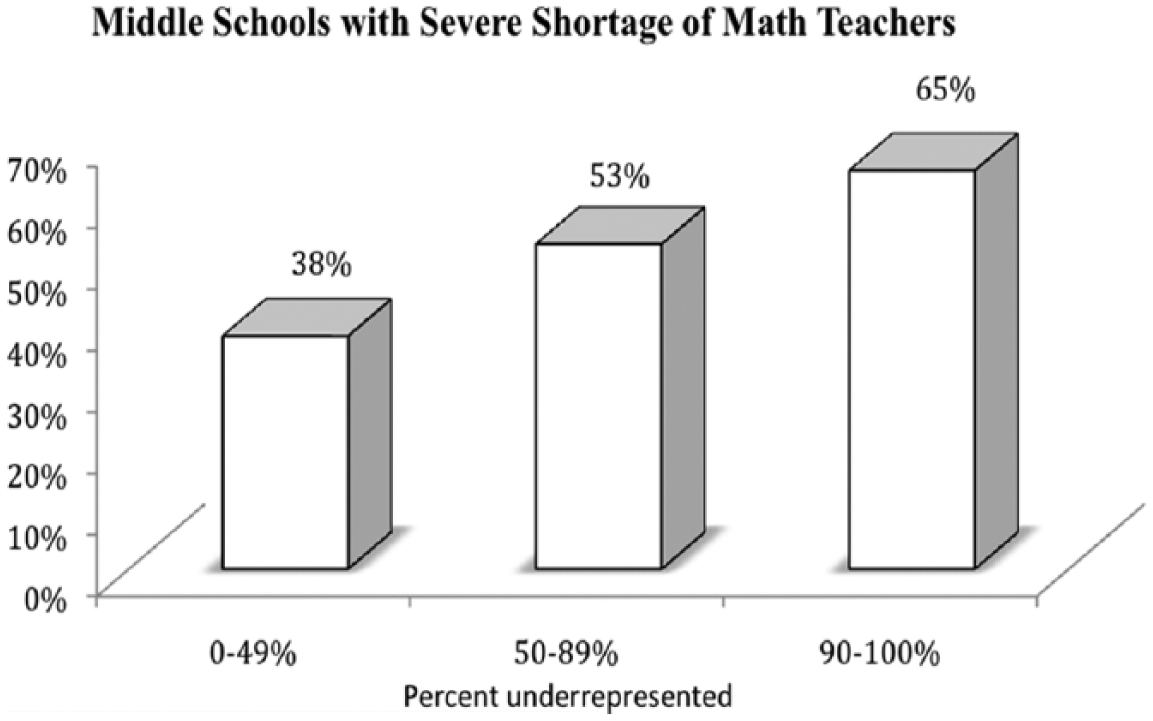
Segregated schools with high percentages of underrepresented minority and poor students also tend to have much lower numbers of middle-class families living nearby. Exploring the average share of households who earn greater than a little over twice the state median income ($125,000) and live in a one-mile radius of a Southern California high school can help illustrate the socioeconomic status (as well as hint at social capital) of the community surrounding high schools. According to this analysis, on average, over a quarter of households (26.2%) surrounding schools with 0% to 49% underrepresented minority students are middle to high class, in comparison with 15.6% and 7.8% of households surrounding majority–minority and intensely segregated schools, respectively (see Figure 1).

Average percentage of households living in one-mile radius of Southern California (Los Angeles, Orange, Riverside, San Bernardino, San Diego, and Ventura County) secondary schools by underrepresented concentration, who earn greater than twice the state median income of 125 K.
On average, only 12.7% of households surrounding schools eligible for Title-I funding (schools where greater than 50% of the student body is poor) earn greater than twice the state median income, in comparison with 24.3% of households who surrounded non-Title 1 schools (where less than 50% of students are poor). In other words, the share of families that could be considered affluent doubled in the neighborhoods surrounding more affluent schools. Thus, residential affluence data support the school-level poverty data and clearly identifies the persistent association between socioeconomic isolation and racial concentration in both schools and neighborhoods.
Students from different racial backgrounds experience very disparate exposure to poor students (see Table 8). Keeping in mind that 56% of Southern Californian schoolchildren are considered poor, the average White student in the region attends a school where poor students make up just 33% of the population. Contrast that figure to the school of the average Black or Latino student, where either 63% or 69%, respectively, of students are poor. A racial chasm of exposure to poverty opens up across the region.
Student Exposure Rates to Poor Students in Southern California.
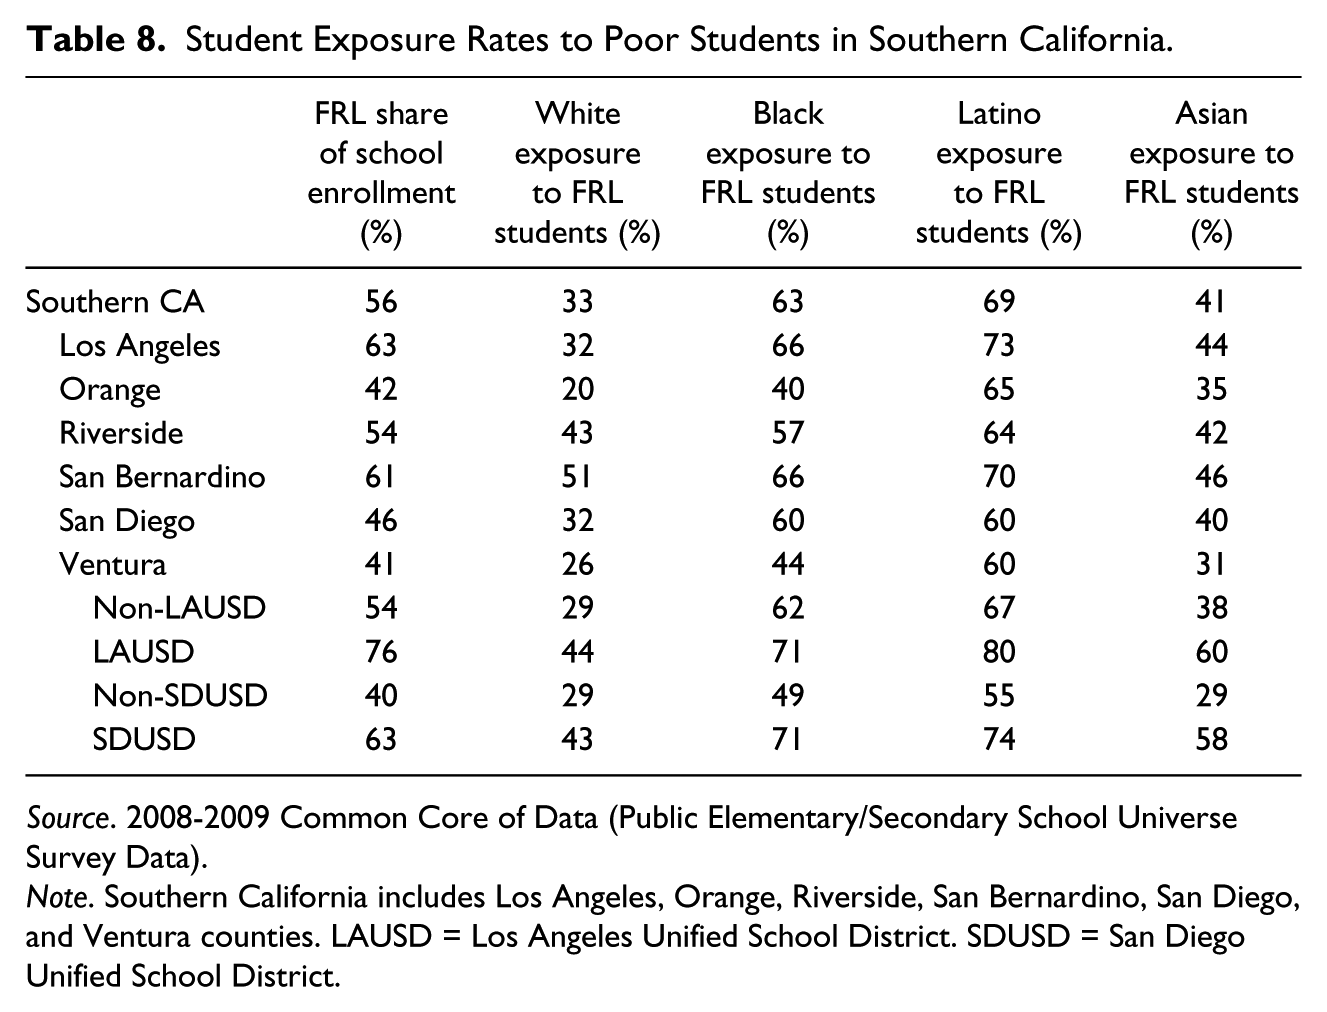
Source. 2008-2009 Common Core of Data (Public Elementary/Secondary School Universe Survey Data).
Note. Southern California includes Los Angeles, Orange, Riverside, San Bernardino, San Diego, and Ventura counties. LAUSD = Los Angeles Unified School District. SDUSD = San Diego Unified School District.
In Los Angeles, which educates the most students in the region, nearly two out of every three students qualify are poor. Yet the average White student in the county goes to a school where a little less than a third of students are poor. In other words, twice the share of poor students exists in the county than in the average White students’ school. Black and Latino students, on the other hand, experience educational settings comprised, on average, of 66% or 73% poor students. In LAUSD, by far the largest district in Los Angeles, the typical Latino student goes to a school where 80% of students are poor. The remaining school districts in Los Angeles report a much lower share of poor students (54% compared with 76% in LAUSD), but Latino students in the other county school systems still attend educational settings with disproportionately high shares of poor students.
In summary, Latino and Black students in Southern California experience a very high level of segregation by both race and poverty. These patterns help produce different educational opportunities and trajectories—examined below—in schools with high and overlapping concentrations of students of color and students in poverty.
Part Three: Separate and Unequal
Segregated and impoverished schools are increasing in Southern California. This section explores whether learning opportunities and resource disparities are linked to such segregation, which can help explain any variation in racial achievement and college matriculation gaps that exist among racial groups in the region.
Racial Opportunity Gaps
For quite some time, prior research has explored a variety of reasons for the gaps among more White and affluent schools in comparison with schools with a higher share of minority and poor students (Coleman et al., 1966; Oakes, 2003; Rumberger & Palardy, 2005). Some factors that prior research has found to influence student achievement and college matriculation include school safety, access to qualified teachers, and access to advanced curricula (Allensworth, Nomi, Montgomery, & Lee, 2009; Cooper, Chavira, & Mena, 2005; Darling-Hammond, 2004; Grodsky & Jackson, 2009; Oakes, 2003). In this section, we explore whether these mediating opportunity factors differ between majority White/Asian schools and segregated schools of color within Southern California.
School safety
Overcrowding creates unsafe and ineffective learning environments. In these environments, students perform worse, absences are higher, the degree of student attention is lower, and violence occurs more often (Ready, Lee, & Welner, 2004).
In the 2007-2008 school year, California had the largest average class size for secondary schools in the nation (NCES, 2007-2008). As a result, a year later more than one fifth of middle and high schools in Southern California counties were identified as critically overcrowded by the state (i.e., those with population densities equal to or greater than 175% of the state’s recommended per-acre pupil population density). However, overcrowding is even more prominent in intensely segregated schools. Between intensely segregated schools of color and predominately White/Asian schools (those enrolling 0%-10% underrepresented minority students), a 17% point difference on average (or a 15% point difference in total) in overcrowding existed across the six counties (see Figure 2).
Percentage of Southern California (Los Angeles, Orange, Riverside, San Bernardino, San Diego, and Ventura County) secondary schools (by underrepresented minority concentration) identified as critically overcrowded by the California Department of Education, 2003, 2008-2009.
Qualified teachers
Teacher quality is a very powerful factor related to educational achievement and attainment. Research has found significant relationships between teachers’ preparation, their certification, and student achievement (Darling-Hammond, 2004). Teacher preparation is also linked to teacher attrition, with those who complete student teaching in college, finish requisite college courses, and attain full state certification are more than twice as likely to stay in the profession (National Commission on Teaching and America’s Future, 2003). As a result, schools with a severe shortage of qualified teachers, where more than 20% of teachers lack full credentials, can greatly reduce student learning and staff retention (Rogers et al., 2007).
Across Southern California, 18% of intensely segregated schools of color—nearly one out of five—experienced a severe shortage of qualified teachers in the 2008-2009 school year. In contrast, not one predominately White/Asian school experienced a severe shortage of qualified teachers and rarely did such a school employ a teacher who was not fully qualified.
In the 2005-2006 school year, 14% of teachers in intensely segregated secondary schools and 8% of teachers in majority–minority secondary schools (those enrolling 50%-90% underrepresented students) lacked a full teaching credential in comparison with only 4% of teachers in majority White/Asian schools (those enrolling 0%-49% underrepresented minority students). During the 2008-2009 school year, these percentages improved to 8% and 5% of teachers missing a full teaching credential in intensely segregated and majority–minority schools of color, respectively. By contrast, for majority White/Asian schools, only 3% of teachers lacked a full credential.
College preparation resources
The University of California and California State University systems developed an “a-g” subject requirement to ensure that all students graduate from high school academically ready for college. Completion of these courses, according to these systems, ensures that students have attained a general body of knowledge, as well as the critical-thinking and study skills required for 4-year, postsecondary institutions. Although these requirements were developed as a tool for greater college readiness and access, only students who fulfill them are eligible for 4-year public colleges. Many high schools, however, especially those serving a majority of students of color, may not be offering a sufficient number of approved courses that prepare students for college. For example, one study showed that low-income youth of color have less curricular intensity even after controlling for prior achievement, and this marginalization moderately affects their college preparation (Attewell & Domina, 2008). In addition, with teachers serving as one of the strongest predictors for student success (Darling-Hammond, 2006), a severe shortage of qualified or appropriately assigned teachers of college preparation courses (80% or fewer of teachers holding the appropriate credential) is a critical concern.
In Southern California, intensely segregated and majority–minority schools of color experienced a greater shortage of a-g courses, college preparatory teachers, and college preparatory mathematics teachers than majority White/Asian schools in the 2008-2009 school year (see Figure 3). For example, 19% of high schools across Southern California offer too few (66% or less) a-g courses to students. On the other hand, just 12% of majority White/Asian schools have such a severe shortage compared with intensely segregated schools of color, where 27% of schools offer too few a-g courses. A similar pattern but greater variation is observed with shortages of qualified, college preparatory and qualified, mathematics, college preparatory teachers across underrepresented school concentration. Intensely segregated schools of color are close to 3 times more likely to experience a severe shortage of a-g teachers and college prep mathematics teachers than majority White/Asian schools.

Percentage of Southern California (Los Angeles, Orange, Riverside, San Bernardino, San Diego, and Ventura County) high schools by underrepresented minority concentration (Black, Latino, American Indian enrollment) with a severe shortage of a-g courses (less than two thirds), and a-g and “c” teachers (20% or more of college preparatory teachers or college preparatory math teachers lack the appropriate subject matter credential).
Mathematics education
Besides qualified, college prep, mathematics teachers, students exposed to advanced math pathways (Algebra II and higher) in high school are significantly more likely to score higher on college entrance exams, enroll and experience success in college, as well as earn in the top quartile of income from employment (National Mathematics Advisory Panel, 2008). If Algebra I by Grade 9 is generally the prerequisite to begin an advanced math pathway in high school, Algebra I by Grade 8 would be a promising indicator of advanced math pathway success.
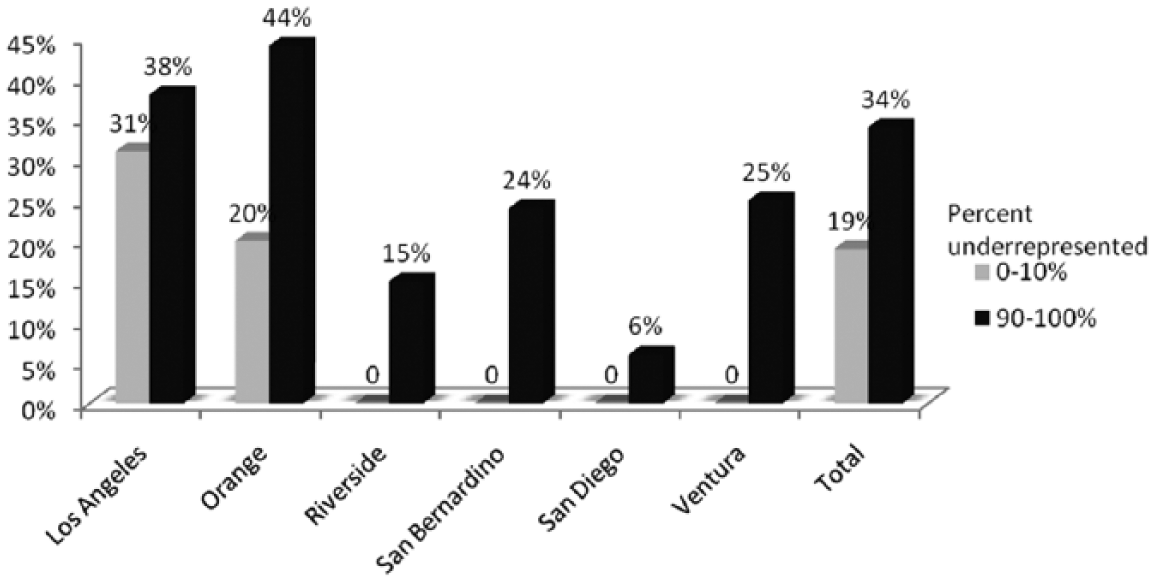
Across Southern California counties, 42% of middle schools, 44% of intensely segregated schools, and 38% of majority White/Asian schools enrolled less than half of their eighth graders in Algebra or the equivalent in the 2008-2009 school year (see Figure 4). In Los Angeles, Riverside, and San Diego counties, the results across underrepresented minority school concentrations are starker, as depicted in the figure below. These results suggest that, in comparison with majority White/Asian schools, intensely segregated schools in these three counties fail to enroll a significant portion of their Grade 8 students into Algebra I to begin their mathematics trajectory.
Percentage of Southern California (Los Angeles, Orange, Riverside, San Bernardino, San Diego, and Ventura County) middle schools by underrepresented minority concentration (Black, Latino, American Indian enrollment) with a severe shortage (less than 50%) of Grade 8 students enrolled in Algebra I.
Mathematical content and pedagogical-content knowledge are strong predictors of mathematics teachers’ instructional—and thus, student learning effectiveness (National Mathematics Advisory Panel, 2008). Some studies have used teaching certification in mathematics as a measure of such knowledge and found certification does improve students’ mathematical performance (Darling-Hammond, 2006). As a result, there is some evidence that middle school math teachers lacking a credential in mathematics can hinder student development.
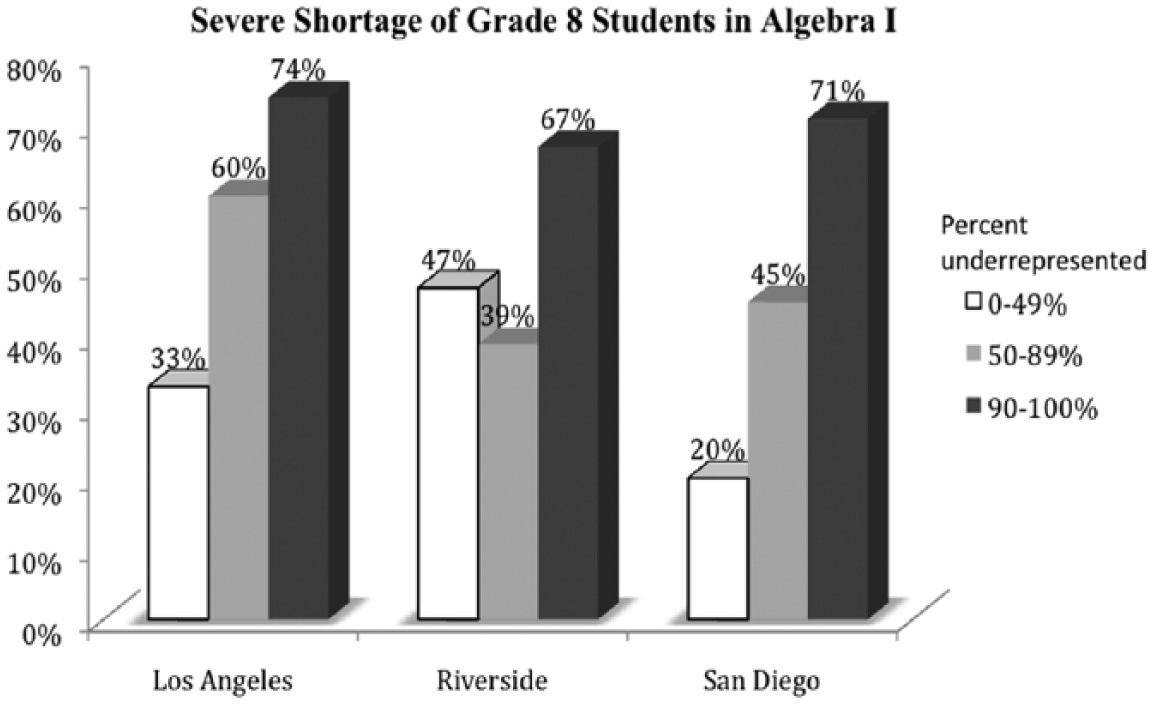
Approximately half of the middle schools in the six Southern California counties have a severe shortage of math teachers (i.e., schools with less than half of math teachers holding a secondary mathematics credential). Figure 5 depicts schools with severe shortage of math teachers by underrepresented minority concentration. Similar to other learning opportunities, a higher concentration of students of color leads to fewer resources. As the graph indicates, close to twice the number of intensely segregated schools experienced a severe shortage of mathematics teachers in comparison with majority White/Asian schools.
Percentage of Southern California (Los Angeles, Orange, Riverside, San Bernardino, San Diego, and Ventura County) middle schools by underrepresented minority concentration (Black, Latino, American Indian enrollment) with a severe shortage (less than 50%) of math teachers holding a secondary mathematics credential.
With inadequate preparation at the middle school level, high schools need to provide intensive curricula and instruction in mathematics to students, particularly students of color. Research has suggested that students of color benefit more from taking rigorous academic courses (i.e., accepted to more prestigious or selective colleges) than White students (Stearns, Potochnick, Moller, & Southworth, 2010). However, Southern California high schools also fail to provide adequate mathematical preparation to students in schools with higher underrepresented minority concentration.
Table 9 presents the percentage of high schools across Southern California counties that fail to enroll at least 50% or more of their total 11th and 12th grade enrollment into advanced mathematics courses beyond Algebra II; Table 10 also presents the percentage of Southern California high schools that fail to enlist at least 10% or more of their freshman cohort into Advancement Placement (AP) Math 4 years later. Both of these tables suggest that the higher the underrepresented minority concentration in school, the less likely a rigorous mathematical curriculum is offered to students, even though these students would benefit the most from such coursework.
Percentage of Southern California High Schools With Less Than Half of Grade 11 and Grade 12 Students Enrolled in Advanced Mathematics Coursework by Underrepresented School Concentration.
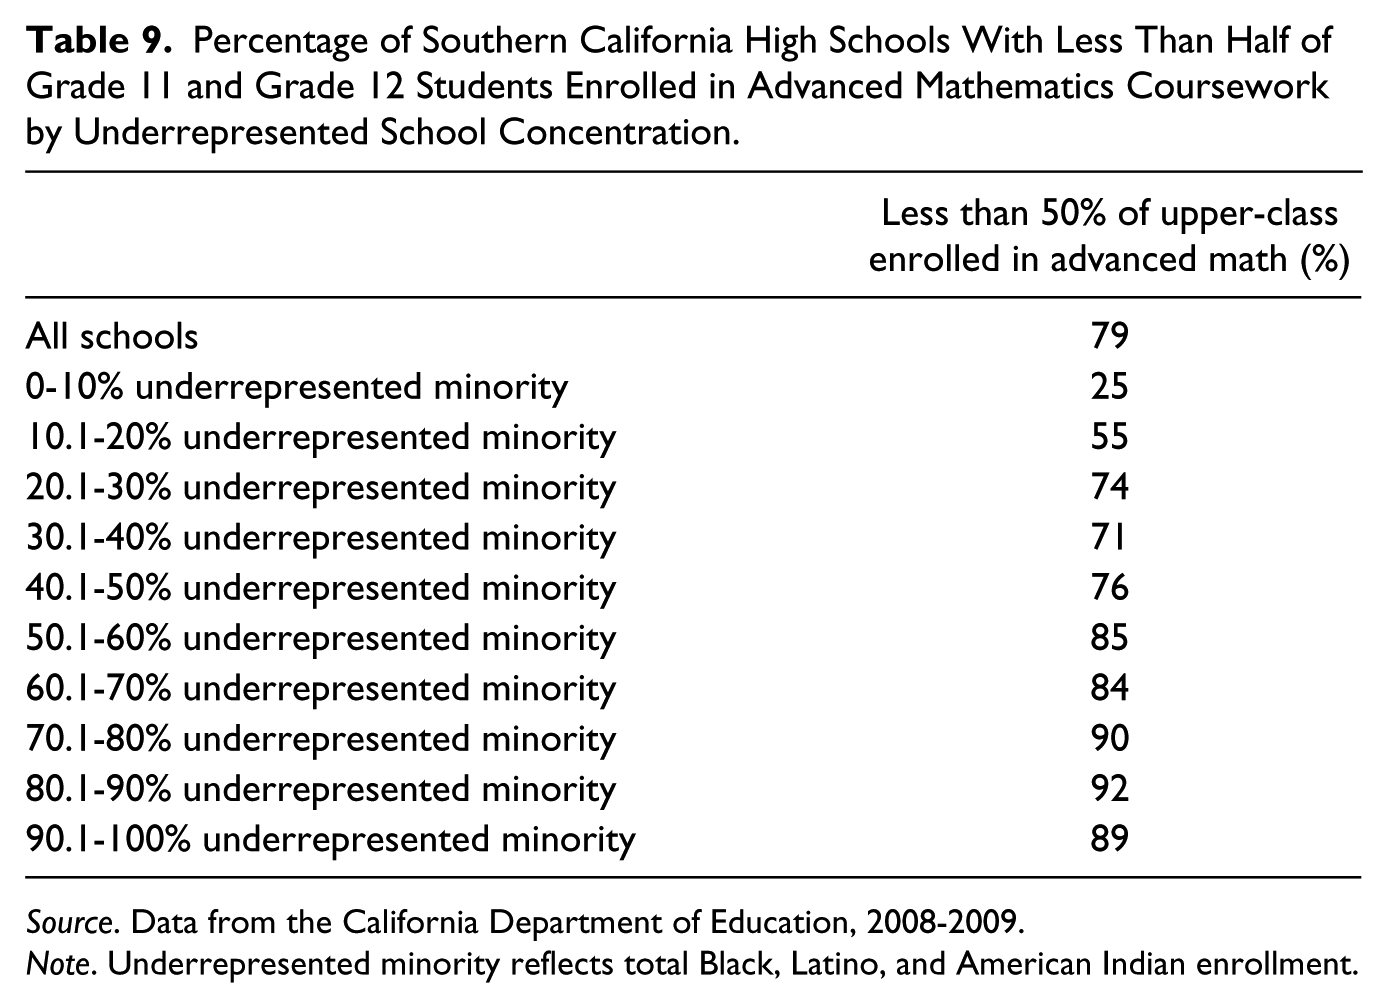
Source. Data from the California Department of Education, 2008-2009.
Note. Underrepresented minority reflects total Black, Latino, and American Indian enrollment.
Percentage of Southern California High Schools With Less than 10% of 2009 Cohort Enrolled in Advanced Placement (AP) Mathematics by Underrepresented School Concentration.

Source. Data from the California Department of Education, 2005-2006, 2006-2007, 2007-2008, 2008-2009.
Note. Underrepresented minority reflects total Black, Latino, and American Indian enrollment.
Similar to Southern California majority–minority and intensely segregated middle schools, high schools with a student body comprised of majority underrepresented students also employ more math teachers lacking the appropriate secondary mathematics credential. In Southern California high schools, the average majority–minority and intensely segregated schools reported a little over half of their math teachers (54.0% and 61.1%, respectively) with the appropriate credential. In majority White/Asian schools, over two thirds of math teachers (68.5%) maintained a mathematics secondary credential.
Racial Outcome Gaps
With research supporting how the aforementioned disparities in learning opportunities and barriers are associated with and can influence student achievement and postsecondary success, it is no surprise that segregated schools of color perform considerably worse than majority White/Asian schools on close to every achievement outcome, including standardized scores, graduation rates, dropout rates, and college matriculation.
In the 2008-2009 school year, segregated schools had far lower graduation rates, as well as lower shares of students who graduated college ready (completed a-g requirements). Figure 6 below presents the 2008-2009 numbers by underrepresented school concentration, as well as the Fall 2009 postsecondary enrollment rates for the California Community College, California State University, and University of California systems.
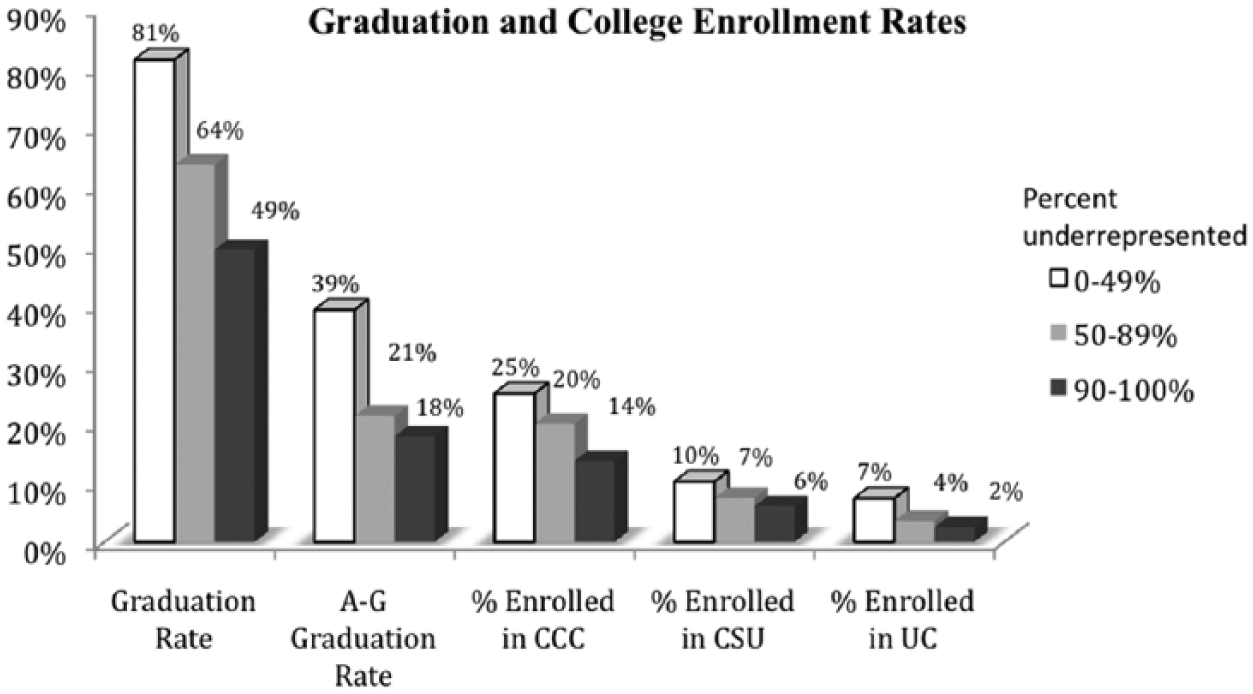
Graduation rates and A-G graduation rates in 2008-2009, as well as the percentage of students who immediately/first-time enrolled in the California Community College (CCC), California State University (CSU), or University of California (UC) systems in Fall 2009.
Across the six Southern California counties, more than 50% of Grade 9 students in intensely segregated schools failed to graduate on time. For majority White/Asian schools, in contrast, over four out of five students graduated. In addition, only 1 out of 5 (18% and 21%) Grade 9 students in intensely segregated and majority–minority schools met the a-g graduation requirements on time, in comparison with close to double this number of students (39%) attending majority White/Asian schools. With college enrollment, 22% and 31% of grade 9 students from intensely segregated and majority–minority schools of color enrolled in some form of California postsecondary institution the immediate fall in comparison with 43% of students in majority White/Asian schools.
Furthermore, across Southern California, 14.6% and 8.3% of intensely segregated and majority–minority schools of color were considered dropout factories in 2008-2009—where over 50% of students failed to graduate on time. This is considerable in comparison with the 2.6% or 20 out of the 735 majority White/Asian secondary schools that failed to graduate at least 50% of their students on time.
These statistics presented in this report do not show an ambiguous pattern. A student who attends a segregated school, especially an intensely segregated one, experiences great barriers and few resources, and that student is subsequently less likely to graduate and immediately enroll in a postsecondary institution. If the same student was in a school with many White and Asian students, she or he is very likely to be in a setting where almost everyone graduates and where there is a much better chance of entering one of the state’s excellent colleges. These are two very different channels of opportunity and they are linked powerfully to race.
Discussion
California was among the first in the country to acknowledge the detrimental consequences of school segregation. In the 1970s, its highest court defined broad desegregation obligations under the constitution. However, with the passage and acceptance of a proposition of 1979, as well as other political and legal matters, the state has failed to implement any comprehensive desegregation plan, leaving a lasting legacy of extreme educational stratification for the demographically transforming Southern California region.
Our findings indicate a systemic trend of severe school segregation, strongly related to inequality in both opportunities and outcomes, and further compounded by a climate of high stakes standards and accountability. One could regret this history but still ask, what can be done at this juncture? How could desegregation be carried out in a megalopolis of such demographic complexity? There is no simple answer but it is feasible to do much more to confront issues of isolation and corresponding educational inequity in the region, and to deal with issues of racial change and resegregation sweeping across the region’s suburbs.
Obviously, the standards for desegregation in this largely Latino, profoundly multiracial, society will be very different. This is not the old Black–White desegregation issue of the South, but it is very clear that there are many advantaged students and successful schools in the region, as well as many students locked into schools that are doubly segregated and unequal along numerous dimensions. Though there are practical limits to desegregation by either race or class, there are many opportunities and many communities where there are possibilities of desegregation—just as there are threats of resegregation and decline or polarization in others. It remains vital, then, to devise policies that distribute educational resources more evenly across the region—or, conversely, that help disadvantaged students access higher performing schools and networks. It is also very important to work for equity and positive race relations in schools where, for example, significant Black populations find themselves as a minority within Latino schools in racially changing communities.
Integration by some combination of socioeconomic status, race and/or linguistic background is legal and offers real possibilities. In a city with neighborhoods polarized by racial-ethnic and socioeconomic status, Berkeley Unified in Northern California offers an important example of a school system committed to pursuing diverse educational opportunities through an innovative student assignment plan. The district divided the city into micro-neighborhoods or planning areas, where each area is assigned a diversity code based on racial, economic, and education indicators, ensuring that every school has a diverse mix of students from different types of neighborhoods. The plan was upheld as constitutional by the California Supreme Court and serves as a model for other diverse districts in the state.
School choice—leveraged in a way that promotes, rather than detracts, from racial diversity—is another avenue for further integration in the region. Choice without planning for diversity often increases stratification. Yet, with appropriate civil rights policies, it can have the opposite impact. In fact, the explosive growth of school choice in Southern California, particularly in San Diego and Los Angeles, may represent untapped possibilities for promoting diversity. There are integrated and segregated magnets, pilot schools, and charters in the area, all of which need appropriate policies for outreach and recruitment, plans for successful diversity, fair treatment, and good transportation for families who need it. Regional magnet schools in Connecticut, for example, have been established on or near urban/suburban boundaries and draw students across district lines into high-quality, integrated educational settings (Bifulco, Cobb, & Bell, 2009).
Effective desegregation is only possible under some circumstances and it will not cure all the inequalities rooted in many aspects of life in our region, but it is reckless to think that we really know how to create and operate “separate but equal” schools on a large scale. That has never been done in the 118 years since Plessy v. Ferguson (1896). The trend in the post-civil rights era has been to point to the rare “break the mold” schools with segregated enrollments and high scores and to ignore how odd it is that we celebrate the one school that succeeds in those terms, as if it shows that the 100 that do not will somehow be transformed. Obviously, we should praise and support those unusual schools and their leaders but also recognize that the mold of segregation is a very strong and harsh one that is rarely broken.
Wherever we can, we should produce stably integrated schools in stably integrated communities. Right now that means, for example, creating school and housing policies to help stabilize the hundreds of racially changing suburbs in the region (Author, 2012), creating schools diverse by race and class in gentrifying urban communities, and reviving and strengthening the magnet schools and integrated dual-language programs in our central cities. It means looking at the impact of our subsidized housing programs on the segregation and resegregation of communities and schools.
Advocacy efforts also play a central role in these struggles. Civil rights organizations and community organizations should study the existing trends and observe and participate in the boundary changes, school siting decisions and other key policies that make schools more segregated or more integrated. Local communities and fair housing organizations could monitor their real estate market to make sure that potential home buyers are not being steered away from areas with diverse schools. Teachers, parents, students, community institutions, and churches need to facilitate discussions about the values of diverse education and help raise community awareness about its benefits. Local journalists should cover the relationships between segregation and unequal educational outcomes and realities, in addition to providing coverage of high-quality, diverse schools. Serious collaboration between school and housing officials, the enforcement of fair housing law, and the strong commitment of local governments is also vital. In this vast megalopolis, in the absence of political leadership, researchers at the community level can play a vital role in explaining the trends, the consequences of these transformations, and thinking about what research shows about alternatives.
Ultimately, the way forward should be directed by an effort to prepare students to work and live in a region of almost unparalleled diversity. Indeed, all racial or ethnic groups in Southern California should have access to schools and faculties that are organized to promote the many academic and social benefits of diversity. Developing these conditions for students is a basic necessity—for their future success and for the success of the region.
Footnotes
Declaration of Conflicting Interests
The author(s) declared no potential conflicts of interest with respect to the research, authorship, and/or publication of this article.
Funding
The author(s) received no financial support for the research, authorship, and/or publication of this article.