



Abstract
In this article, we review factors that are associated with science, technology, engineering, and mathematics (STEM) achievement and describe the development of the Predictors of Black Outcomes in STEM Survey (PBOSS). We retain a well-fitted three-factor model (engagement, continuity, and guiding functions) and find that the PBOSS scores are useful in predicting STEM outcomes. These outcomes include the likelihood of selecting a STEM major and levels of enrolled mathematics courses in college for Black male and female students. The PBOSS provides a useful tool for identifying and cultivating STEM talent as well as opportunities to improve STEM-related curriculum experiences in urban and other educational settings.
Keywords
Broadening participation in the fields of science, technology, engineering, and mathematics (STEM) among racially and ethnically underrepresented diverse populations is a national policy priority. One approach to increasing the number of citizens who possess the requisite skills to succeed in STEM is to improve curricular and instructional experiences in urban environments. Urban environments, given the wealth of people, cultures, and historical innovations that developed during difficult circumstances, provide unique geospatial contexts to initiate change, especially if STEM learning opportunities are carefully designed (Tate, Jones, Thorne-Wallington, & Hogrebe, 2012). In the Handbook of Urban Education (Milner & Lomotey, 2014), several authors describe elements of curriculum and instruction that are essential to improving urban education. Some of the elements include improving urban literacy education (Kirkland, 2014), culturally responsive teaching practices (Gay, 2014), and mathematics education (Martin & Larnell, 2014). Other approaches to improve curriculum and instruction include widespread revisions to K-12 standards, such as implementation of the Next Generation Science Standards (Achieve, 2019).
Curriculum theorists have long debated the meaning of the term curriculum. MacDonald (1971) indicated that definitions of curriculum range from narrow definitions of “the subject matter to be learned” p. (196) to very broad definitions such as “all the experiences students have in school” (p. 196). Broad conceptualizations of curriculum are especially important because they often reflect critical values and experiences that influence outcomes. The values and experiences present in urban school curriculum have influenced levels of rigor provided, student persistence and identity, and other STEM-related outcomes for urban students (Boston & Wilhelm, 2017; Koch, Lundh, & Harris, 2019; Shepherd, 2016). Given the importance of curriculum, tools that measure STEM curriculum quality and associated values, especially tools that capture the perspectives of urban and Black youth, may provide insight for broadening participation in STEM. To address this need, we developed and validated the Predictors of Black Outcomes in STEM Survey (PBOSS). PBOSS is a low-cost screening and curriculum assessment tool that can be used in urban and other settings to inform and shape STEM-related experiences for Black students. Before sharing the findings relative to the development and validity of the PBOSS, we first provide an overview of the literature.
Review of Literature
The U.S. Department of Education (2015) noted that the much of its global leadership can be attributed to the contributions of scientists, engineers, and innovators. However, in an annual report on the conditions of STEM in the United States (ACT, 2017), the authors introduced the findings by noting that “It’s difficult to admit, but the United States is a STEM-deficit nation” (p. 1). The report indicated that of the ACT-tested high school graduates, 20% to 21% of tested students between 2015 and 2017 met career readiness measures for success in first-year college STEM courses. Low STEM readiness is problematic because there is high demand for STEM-based careers, but insufficient numbers of STEM-ready workers to meet these demands (ACT, 2017; Smith, 2016). To attain goals of increasing the number of post-secondary graduates with STEM degrees, the nation must broaden the talent pool by further including underrepresented populations.
One approach to broaden participation has been to recruit talent from countries outside of the United States. Using national and state-level data, a report from the American Immigration Council (2015) showed that approximately 20% to 25% of the share of STEM workforce is comprised of workers who immigrated from countries outside of the United States. Other efforts to meet STEM demands include providing enhanced recruitment and preparation of students, especially underserved students in the United States. Many of these initiatives are evident in programming to bolster computer science education, such as Broadening Participation in Computing Alliance, Computer Science for All, and Computing Education for the 21st Century Programs, offered by the National Science Foundation (2018a, 2018b, 2018c). Underserved students, such as Black students or those in urban environments, offer great potential for meeting STEM-related demand in the United States. Although there are several concerns relative to college readiness for Black students, there are promising strategies for increasing STEM participation for underserved students.
Strategies for Broadening Participation
Prior studies that addressed broadening participation of STEM students in general, and Black students specifically, have increased in recent years and include both quantitative and qualitative, as well as large and small studies. These studies vary from those that focus broadly on increasing the STEM participation pipeline through efforts to change the school culture for all students, to those that identify cognitive and noncognitive factors that broaden STEM participation by minorities at the high school and college levels (see Anderson, 2014, 2016; Doerschuk et al., 2016; Litzler, Samuelson, & Lorah, 2014; McGee & Pearman, 2015; Strayhorn, 2015). Schneider, Broda, Judy, and Burkander (2013) provide an example of an intervention strategy approach to increase college-going culture and STEM participation. Specifically, they use four core components: (a) tutoring and mentoring, (b) course counseling and advising, (c) financial aid assistance, and (d) college visits to increase college-going and STEM interests (Schneider et al., 2013).
Research has also shown the power of course-taking patterns in fostering or diminishing participation of Black and Hispanic students in STEM fields (Adelman, 2006; Anderson, 2014). Using national data and student high school transcripts, these studies document detrimental (or useful) trends of systematically placing Black and Hispanic students in lower (higher) level mathematics or science courses. These findings complement findings, regarding tracking and under resourced schools, from a seminal book published in the 1980s (Oakes, 1985). Despite some of these barriers, practices that foster healthy academic identities and beliefs (McGee & Pearman, 2015), and school–university partnerships (Anderson, 2016) can enhance STEM outcomes for Black students.
Given the disproportionate number of Black males entering science, mathematics, and technological fields, they may require more direct attention toward STEM participation (Jett, 2013). A study conducted by Strayhorn (2015) specifically focused on identifying factors influencing Black male college-readiness and success in STEM majors. Within this mixed method study, Black male participants enrolled in a STEM major completed the Student Success Questionnaire (SSQ) and interviews. The SSQ measured aspects of participant’s collegiate experience including factors such as student engagement, student transition and adjustment, and noncognitive traits. Additional measures assessed self-reported levels of grit (Duckworth & Quinn, 2009), perceived confidence in academic skills using a three-item self-efficacy scale, and precollege interest (in STEM) inventory. When combining these tools, three critical factors were identified as highly influential in broadening Black male student participation in STEM: Precollege STEM self-efficacy, concerted cultivation of initial interest, and sense of belonging in STEM. However, less than one third of the Black men agreed that STEM was of interest to them in their childhood (Strayhorn, 2015). Strayhorn’s (2015) study includes a mix of students from historically Black and predominately White institutions, but much can be learned from studying Historically Black Colleges and Universities (HBCUs) that have historical success with Black STEM students.
HBCUs
HBCUs represent 3% of the nation’s colleges, but produce approximately 27% of the Black STEM recipients of bachelor’s degrees. Likewise, of the top 50 institutions for educating Black graduates to earn science or engineering doctorates, 21 are HBCUs (U.S. Department of Education, 2016). In a meta-synthesis of more than 50 research artifacts, Hicks and Wood (2016) conducted an integrative review and noted four interrelated themes that influence STEM enrollment for first-generation students at HBCUs. The authors found that prior academic experiences and performance, adjusting to college, social integration, and academic integration, were important factors associated with STEM enrollment.
HBCUs also play a significant role in the economic health of the United States. An economic impact study found that HBCUs generate $14.7 billion in economic impact annually and generate 134,090 jobs for local and regional economies (United Negro College Fund [UNCF], 2017). A study published by the Brookings Institute also credited HBCUs with playing major roles in the health of urban areas (Perry, 2017). Overall, HBCUs play a major role in the economy and supply of the Black STEM workforce. Thus, much is to be learned about the unique experiences of HBCU students. As a result, we present the tenets of this current study.
Theoretical Framework
Many of the studies cited in the review of literature identified various factors that contribute to STEM success. Researchers have also synthesized secondary and primary research to offer models that may lead to STEM improvement. One such model is the Trilogy model (Jolly, Campbell, & Perlman, 2004). The authors developed the Trilogy model, which is comprised of three broad research-based factors, which, when combined, are essential for students to progress and succeed in the quantitative STEM disciplines. Over time, definitions of the Trilogy model have evolved, but is principally defined using three interdependent factors: engagement, capacity and continuity.
Engagement—Having an orientation to the sciences and/or quantitative disciplines which draws a student to study. Subcomponents of this factor are identified in the literature as separate subsets of the overall engagement factor: cognitive, behavioral, affective, and vocational. (Student level)
Capacity—Possessing the acquired knowledge and skills needed to advance to increasingly rigorous content in the sciences and quantitative disciplines (e.g., level of math courses in ninth grade).
Continuity—Institutional and programmatic opportunities, material resources, and guidance that support advancement to increasingly rigorous content in the sciences and quantitative disciplines. Continuity describes resources and guidance that support advancement to rigorous content in science and other quantitative disciplines (e.g., teacher practices or school-based strategies).
Because the goal of the present study was to develop an instrument that was associated with Black STEM outcomes in college based on high school experiences, we adopted a four-factor hybrid model based on results of an initial study (see Jones, Anderson, Maxwell, Mahmood, Grant, & Edwards, 2015, and brief summary of the initial study in Online Appendix A). The initial study was conducting using extant data from the High School Longitudinal Study: 2009 (HSLS:09) (Ingels & Dalton, 2011). The initial study led us to combine factors included in the Trilogy model with a fourth factor, known as guiding functions. Guiding functions focus on student beliefs and adaptive learning postures such as self-efficacy, self-regulated learning, and incremental ability beliefs (Boykin & Noguera, 2011) which have been especially salient for Black students. Examples of the importance of guiding functions on achievement are documented in text entitled Creating the Opportunity to Learn: Moving from Research to Practice to Close the Achievement Gap (Boykin & Noguera, 2011). The guiding functions factor also captures many of the affective processes described in the literature review (see McGee & Pearman, 2015; Strayhorn, 2015). There was some overlap and some unique components of both models, thus the commonalities and unique components of both models were combined to form a four-factor model that consists of engagement, capacity, continuity, and guiding functions.
Setting
We conducted the current study at Howard University, a historically Black university, that has earned the reputation of being a top producer of Black undergraduate students who earn degrees in STEM fields. Given the large amounts of deficit research on Black students in STEM, we employed an asset-based approach by assessing the curriculum experiences of Black American students from around the country who have successfully matriculated to a top-rated HBCU that has competitive admission standards. Howard University is located in Washington, DC, and attracts a range of students from urban environments, as well as other educational contexts, locally, nationally, and globally. Therefore, we capitalized on the unique opportunity to learn from students who have successfully matriculated through high school and selected a major in a STEM field. We also compare STEM majors with other Black students who have chosen non-STEM academic pathways. Thus, the purpose of this study is to (a) validate the PBOSS and (b) examine the relationship between PBOSS scores and Black student STEM outcomes in college. We used the same hybrid theoretical framework from the initial study in this current study as well. As noted, the components of the model are engagement, capacity, continuity, and guiding functions, which are derived from the work of Jolly, Campbell, and Perlman (2004) and Boykin and Noguera (2011).
Research Questions
Method
We used results from the initial study to engage a two-step process to investigate the guiding research question in this study. First, we used results from the initial study to develop a 47-item survey to develop the PBOSS. Our team of researchers developed or modified survey items and vigorously debated the content of each item relative to our proposed four-factor model. Second, we piloted the survey with a small group of 64 college students enrolled in mathematics courses of one of our research team members to get initial feedback and make minor modifications before administering the instrument to all students enrolled in a mathematics course. After eliminating two duplicate items, 45 of the 47 mathematics and science items were used for analysis in the current study (see Online Appendix B for original items).
Participants
Participants in this study included 364 Black American students who were enrolled in a mathematics course at Howard University during the spring semester of 2015. Black American is a relative term that may be defined differently in various contexts. Black American in this study was limited to students who identified as African American (non-Hispanic) and did not identify another ethnicity, country or continent of origin, or multiracial on the survey. Twelve ethnicities and multiracial categories were identified by 35 students. These categories were African (17), Bahamian (1), Black and Asian (1), Black and White (6), Ethiopian (1), Haitian (1), Indian (1), Nigerian (2), Pakistani (1), Trinidadian (1), West Indian (1), and White and Native American (1). These 35 students were not included in the analysis because we attempted to minimize additional race/ethnicity-based cultural experiences that may also influence schooling experiences of students.
The final analysis sample of 364 participants included freshman (205), sophomore (94), juniors (39), and seniors (26). Of the participants included in this study, 143 (39%) were enrolled in precalculus or higher and 220 (61%) were enrolled in Algebra II or lower. One student did not respond to the course enrollment survey item. The participants included 219 (60%) non-STEM majors and 145 (40%) STEM majors. STEM majors were identified through self-identified responses that include biology, biology and chemistry, biology and economics, chemical engineering, chemistry, civil engineering, computer engineering, computer science, electrical engineering, health sciences, mathematics, mechanical engineering, nursing, nutrition, nutritional sciences (pre-med), physical therapy, physician assistant, physics, pre-physical therapy, and computer science.
Procedure
To assess the fit of the data to our hypothesized four-factor model, we operated with the principle of proceeding from simple to more complex models. For each model, we used a five-step methodological approach. Specifically, we (a) checked for multivariate normality, (b) fit models using confirmatory factor analysis (CFA) with promax rotation, (c) assessed fit statistics, (d) examined factor loadings, and (e) examined error associated with each of the loadings. We deleted items if loadings were smaller than .30 or the error was inconsistent with other items on the same factor. In addition, we examined modification indices to examine expected parameter changes to see how the chi-square test could be improved. If the modification indices suggested that the chi-square test would improve by 10 points or more, then the item was also deleted. The item was deleted because we had no theoretical rationale for correlating errors. This process was repeated until a good model fit was retained. After an acceptable fit was obtained, we conducted a multi-group CFA to determine whether there were differences in model fit between Black American males and females.
In addition to assessing model fit, we assessed relationships between PBOSS scores and outcomes for Black American males and females. Specifically, we used multiple logistic regression to assess whether PBOSS scores predicted mathematics course placement, and selection of a STEM major. Mathematics course placement included (a) whether the student was enrolled in calculus or higher at the time of survey (coded as 1) versus not enrolled in calculus or higher (coded as 0) and (b) whether the student was enrolled in precalculus or higher (coded as 1) at the time of survey versus not enrolled in precalculus or higher (coded as 0).
Results
Does the Data Fit the Hypothesized Four-Factor Model?
The first research question assessed the fit of our data to our hypothesized four-factor model. Before conducting the CFA, we checked for multivariate normality of the items by examining Q-Q plots. Consistent with prior research on ordinal data (Finney & DiStefano, 2006), our Likert-type items, which ranged from strongly disagree, disagree, agree, or strongly agree, were not normally distributed. To account for the nonnormality of the data, we conducted the CFA using diagonally weighted least squares estimation. As noted previously, we proceeded from the principle of progressing from simple to more complex models when assessing model fit.
We used the lavaan package (Rosseel, 2012) in R to analyze our data. We implemented our CFA approach by assessing the fit of Black American responses on the 45 items relative to our proposed four-factor model by including mathematics and science items. Fit indices in Table 1 show that our data did not fit our initial model well. We attempted to examine modification indices for the initial model to inform additional changes, but the modification indices were excessive. Thus, we attempted to confirm the models separately for mathematics and science using our initial four-factor model.
Models for Confirmatory Factor Analysis of Predictors of Black Outcomes in STEM Survey (N = 364).
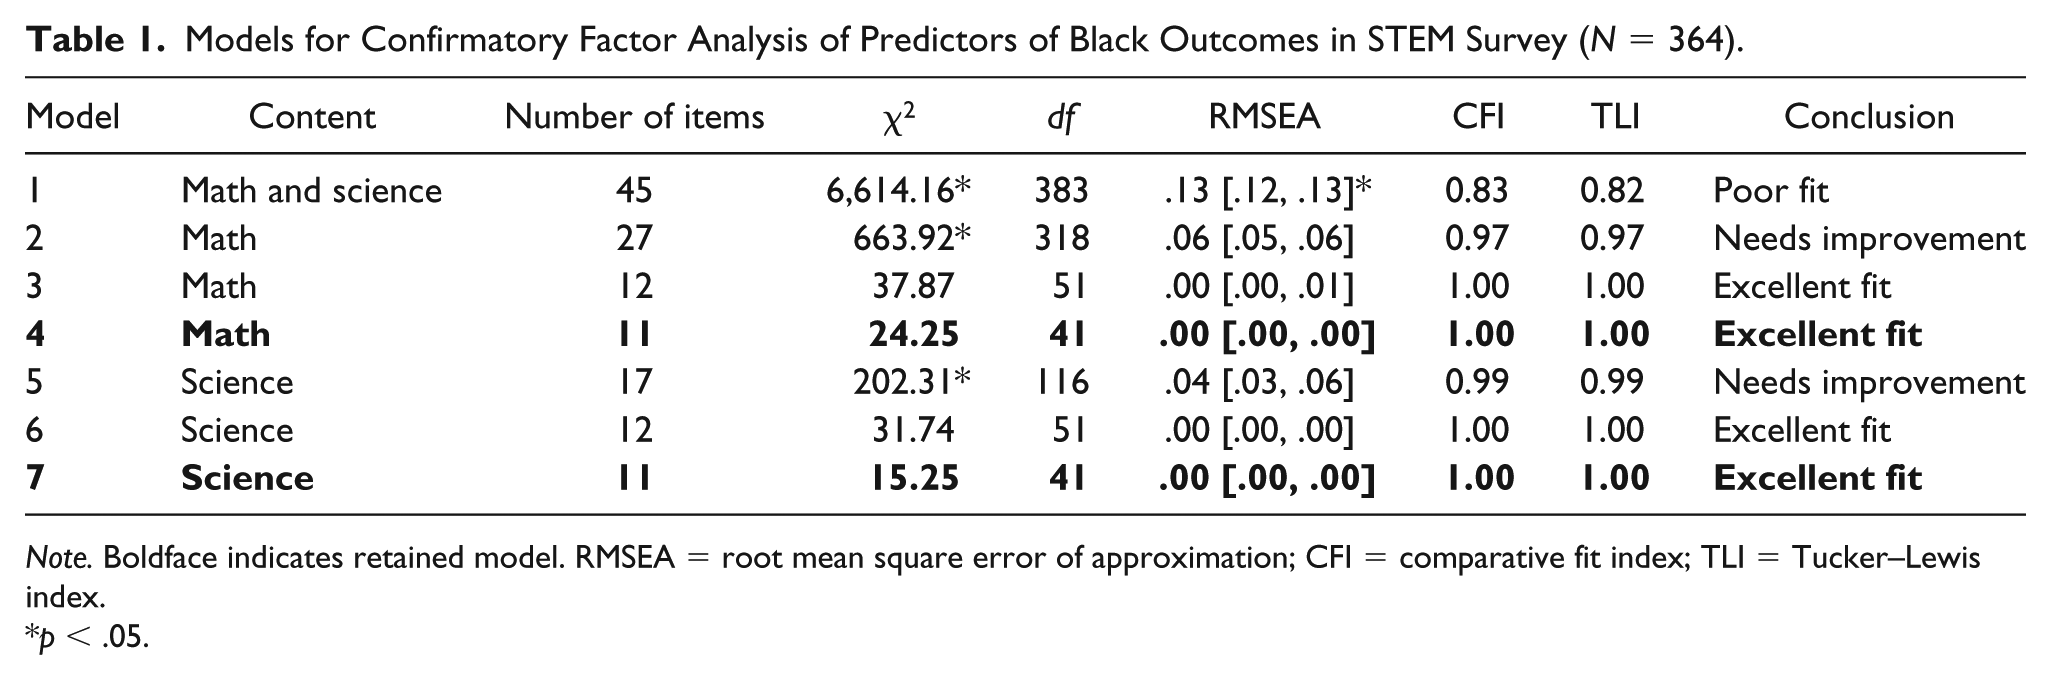
Note. Boldface indicates retained model. RMSEA = root mean square error of approximation; CFI = comparative fit index; TLI = Tucker–Lewis index.
p < .05.
Mathematics
Model 2 in Table 1 shows that the 27 mathematics items fit the hypothesized model better than Model 1. However, the fit indices indicate opportunities for improvement. Thus, we examined standardized factor loadings, standard errors, and modification indices from Model 2, resulting in deletion of 15 mathematics items. None of the capacity items met the criteria for being retained; thus, we dropped this factor from the analysis. Subsequently, we assessed Model 3 after deleting the 15 items. Model 3 represents a well-fitting model, but to remain consistent with our five-step methodological approach, we examined modification indices and deleted one additional item (see Model 4). The data fit Model 4 well so Model 4 was retained for future analysis (presented in a later section).
Science
Capacity was not included in the science model because only one item in our survey represented science capacity. We originally hypothesized that capacity would be one combined factor for mathematics and science. However, this original hypothesis was not supported. Despite the limitations of the capacity factor, fit indices in Model 5 show that the 17 science items fit the hypothesized model, but fit indices indicate opportunities for improvement (see Table 1). Standardized factor loadings, standard errors, and modification indices from Model 5 led us to delete five items. After deleting the five items, we found that our data fit Model 6 well. However, we assessed standardized factor loadings, standard errors, and modification indices once again and deleted one additional item. Our final science model, Model 7, represents an excellent fit as well (see Table 1). Thus, Model 7 was retained for subsequent analysis (presented in the next section). Table 2 provides a summary of the retained items and Figure 1 provides graphical representations of the retained models with the associated loadings.
Summary of Retained Items—Predictors of Black Outcomes Is STEM Survey (PBOSS).

Note. Response options: strongly disagree (1), disagree (2), agree (3), strongly agree (4); C = Continuity; GF = Guiding Functions; E = Engagement.
Item was reverse coded.
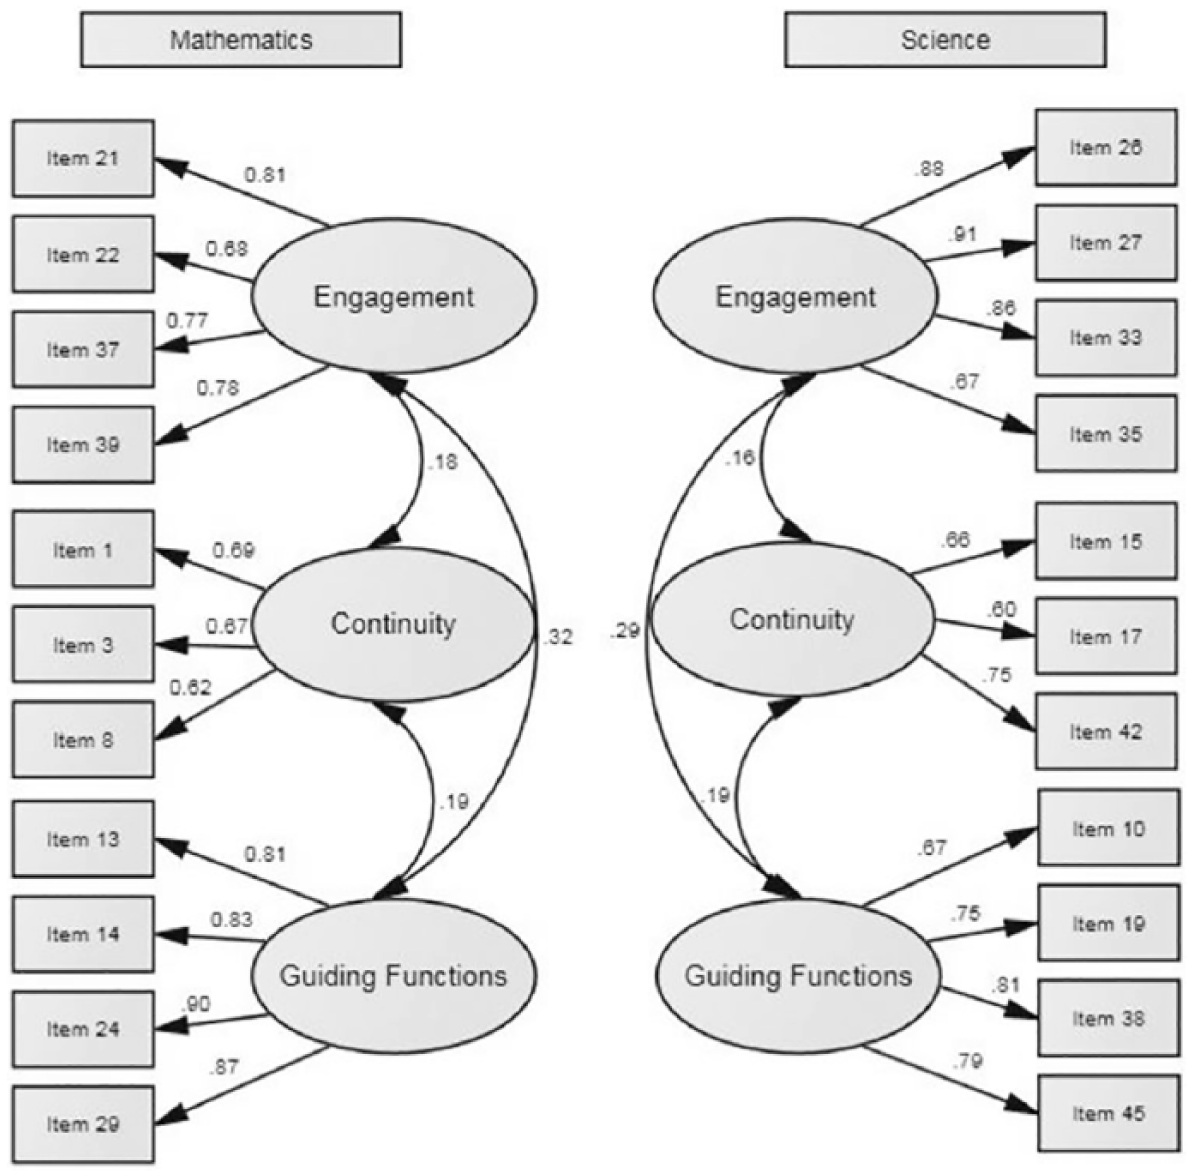
Graphical representation of the Predictors of Black Outcomes in STEM Survey (PBOSS) models for mathematics and science (with standardized loadings).
Are There Differences in Model Fit Between Black American Males and Females?
After identifying good fitting models for the mathematics and science, we assessed whether there were different underlying factor structures for Black American males and females. To assess for factorial invariance, separate multiple group CFA models were assessed for mathematics and science, respectively. To do so, we created two models. First, we generated an unconstrained model, known as the configural invariant model (Model 0), by maintaining the general structure, but allowed the parameters (i.e., loadings, intercepts, residuals, latent variable variances, and covariances) to differ between males and females. Second, we generated a constrained model, known as the fully invariant model (Model 1) by forcing parameters between males and females to be equal. Thereafter, we tested for differences in fit between the two models using analysis of variance. As shown in Table 3, there were no differences in the measure of fit (i.e., chi-square values) for mathematics or science, suggesting that the mathematics and science scales are invariant between Black American males and females.
Multiple Group Confirmatory Factor Analysis Between Black American Males and Females.

Note. RMSEA = root mean square error of approximation; CI = confidence interval; CFI = comparative fit index; TLI = Tucker–Lewis index; χ2 DIFF = scaled chi-square difference test.
p < .01.
As described in the methods section, multiple logistic regression was used to assess relationships between PBOSS scores and STEM outcomes. To generate a score to serve as our independent variable, we combined the retained mathematics and science items into a single score by calculating the mean of the 11 mathematics items and the 11 science items (see Online Appendix B for item descriptions). Gender was also included as a covariate. The means (standard deviations) for mathematics, science, and the overall instrument were 2.69 (.56), 2.75 (0.58), and 2.72 (0.48), respectively. Moreover, the reliabilities for mathematics, science, and the overall instrument were .88, .89, and .91, respectively. To address predictive validity of the PBOSS, we selected three outcomes:
Student is a STEM major (1) versus student is a not a STEM major (0),
Student is currently enrolled in precalculus or higher (1) versus student is enrolled in algebra II or lower (0), and
Student is currently enrolled in calculus or higher (1) versus student is enrolled in precalculus or lower (0).
What Are the Relationships Between Reflections on High School Experiences (PBOSS Scores) and Black Male and Female Selection of a STEM Major STEM?
STEM major
Table 4 shows that for males and females with the same overall score, there were no significant differences in the odds of majoring in STEM. Table 4 also shows that for each one-point increase in mean PBOSS score, the odds of majoring in STEM increase by a factor of 22. Figure 1 shows that the model predicts a smooth “s-shaped” curve indicating that the probability of selecting a STEM major sharply increases when PBOSS scores increase from slightly below average to slightly above average. If students have average PBOSS scores, then the model suggests that the probability of selecting a STEM major is slightly less than 40%.
Multiple Logistic Regression of PBOSS Scores Predicting Selection of STEM Major (N = 363).
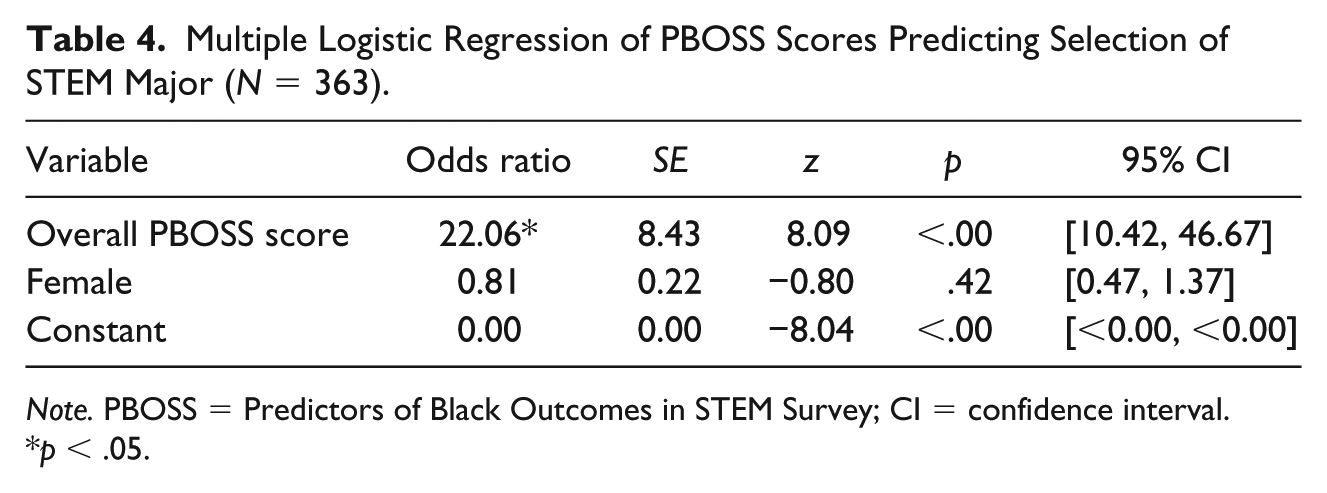
Note. PBOSS = Predictors of Black Outcomes in STEM Survey; CI = confidence interval.
p < .05.
What Are the Relationships Between Reflections on High School Experiences (PBOSS Scores) and Black Male and Female Mathematics Course Placement in College?
Precalculus enrollment
Table 5 shows that for males and females with the same overall score, there were no significant differences in the odds of being enrolled in precalculus (at the time of survey). Table 5 also shows that for each one-point increase in mean PBOSS score, the model predicts that the odds of being enrolled in precalculus increase by a factor of 25. Figure 2 shows that if students had an average PBOSS score, then the model suggests that the probability of being enrolled in precalculus (at the time of survey) was slightly less than 40%. Figure 3 also shows that the model predicts a smooth “s-shaped” curve indicating that the probability of being enrolled in precalculus (at the time of survey) increased sharply when PBOSS scores increase from slightly below average to slightly above average.
Multiple Logistic Regression of PBOSS Scores Predicting Selection of Enrollment in Precalculus or Higher (N = 363).

Note. PBOSS = Predictors of Black Outcomes in STEM Survey; CI = confidence interval.
p < .05.
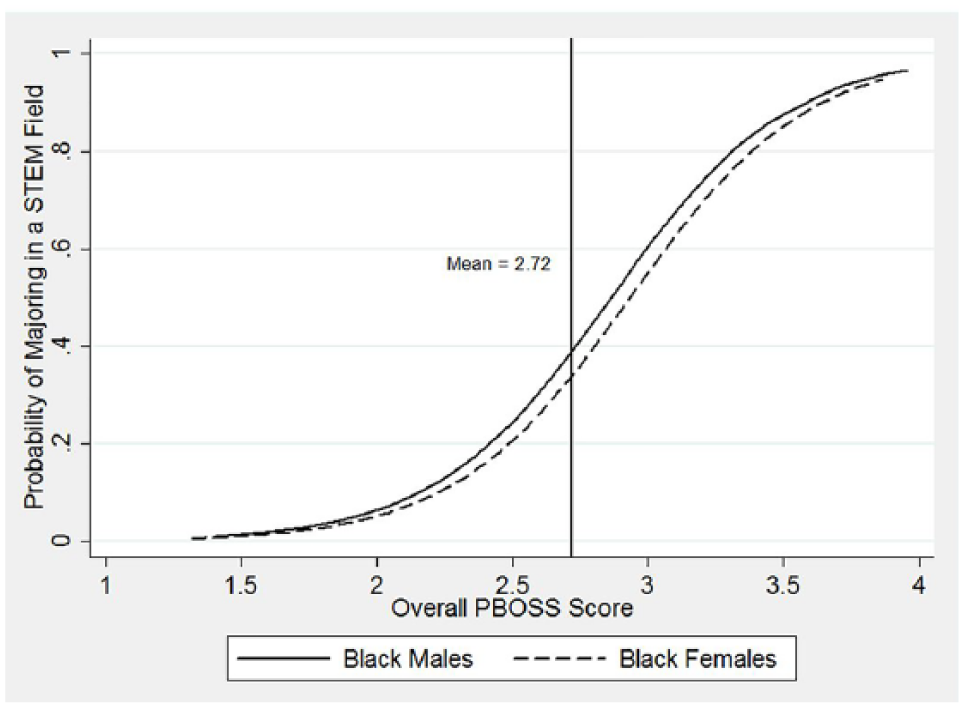
Graph of the predicted probabilities of majoring in STEM relative to overall PBOSS scores.
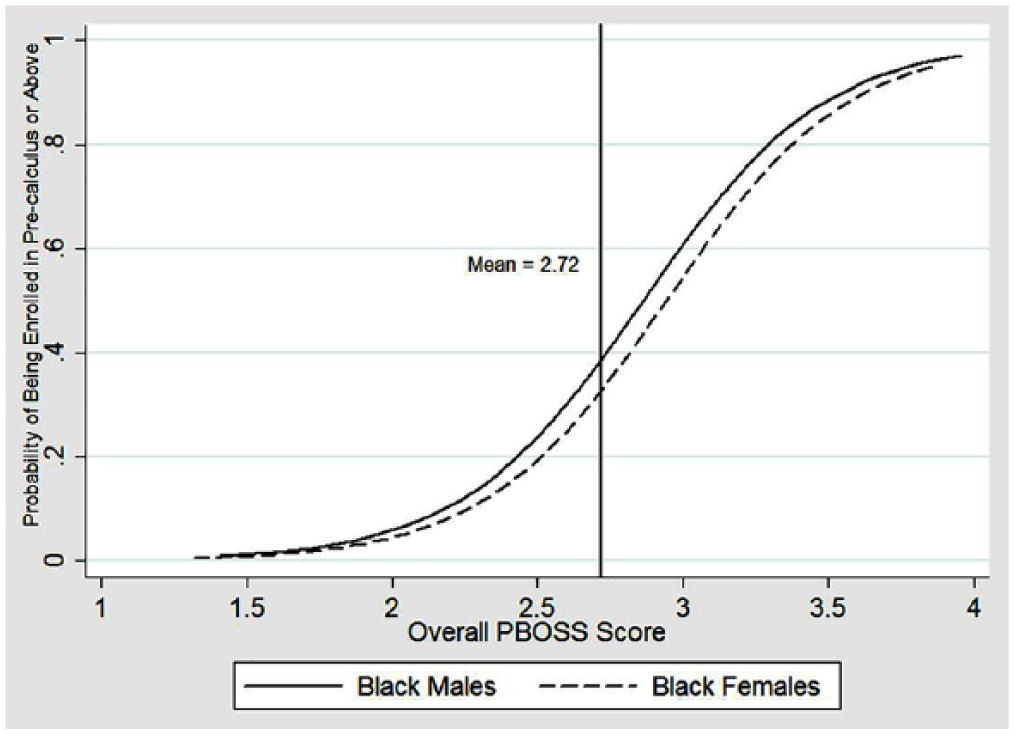
Graph of the predicted probabilities of being enrolled in precalculus relative to overall PBOSS scores.
Calculus enrollment
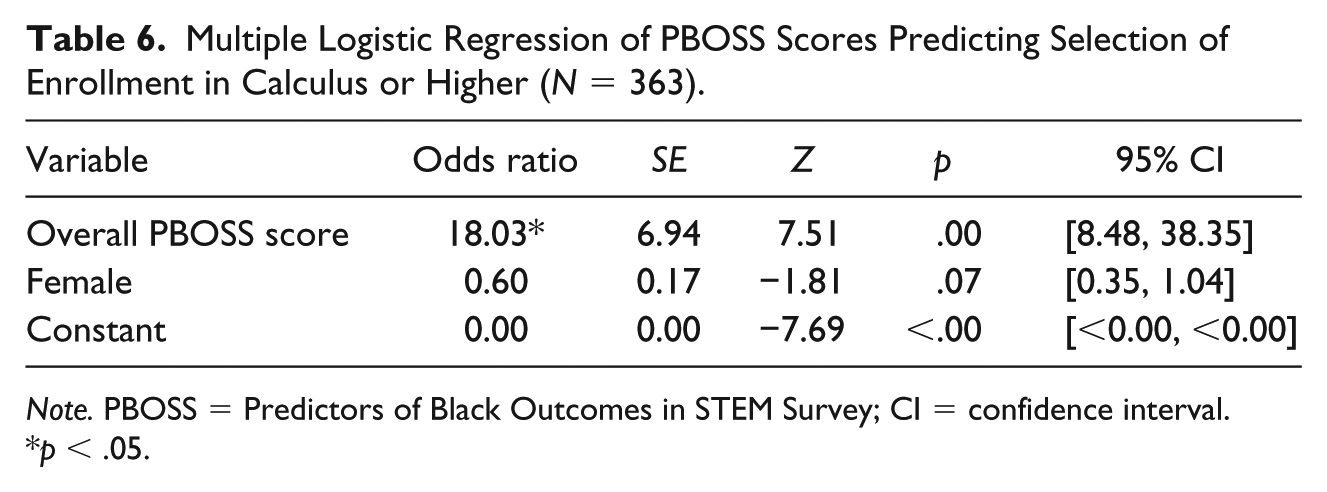
Table 6 shows that for males and females with the same overall score, there were no significant differences in the odds of being enrolled in precalculus (at the time of survey). Table 6 also shows that for each one-point increase in mean PBOSS score, the model predicts that the odds of being enrolled in precalculus increase by a factor of 18. Although not statistically significant (p = .07), Figure 4 shows that the model suggests that differences in the probability between males and females enrolled in calculus (at the time of survey) are slighty more pronounced.
Multiple Logistic Regression of PBOSS Scores Predicting Selection of Enrollment in Calculus or Higher (N = 363).
Note. PBOSS = Predictors of Black Outcomes in STEM Survey; CI = confidence interval.
p < .05.
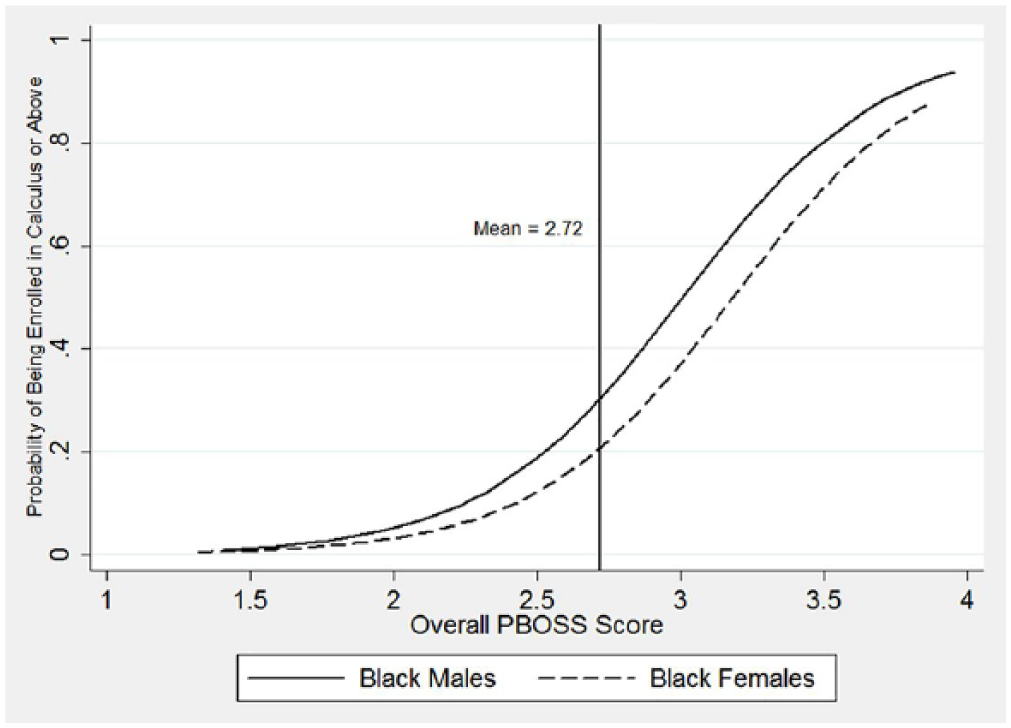
Graph of the predicted probabilities of being enrolled in calculus relative to overall PBOSS scores.
Discussion
Overall, our findings support the use of the PBOSS. We document invariance between Black American males and females, which suggests that, although originally designed for Black American males, the instrument also sufficiently captures experiences of Black American females. In the future, additional research that examines longitudinal data and nuances between Black Americans and the greater Black diaspora could provide additional insight for broadening STEM participation. Moreover, our research in this current study and the initial study shows that one of the factors, capacity, or “possessing the acquired knowledge and skills needed to advance to increasingly rigorous content in the sciences and quantitative disciplines” (Jolly et al., 2004, p. 3), is difficult to measure using survey data alone. Future studies should identify appropriate measures of capacity, but should do so with the perspective that capacity is not fixed, but can change over time.
Scores from the PBOSS highlight the significance of American curriculum experiences for future STEM success and have key implications for urban and other educational settings. We recommend use of the PBOSS with early college students as a low-cost screening tool for identifying students with strong potential and those that may need support to facilitate future success. The PBOSS may be especially useful in urban settings, such as summer bridge programs, community colleges, and other contexts by providing insight regarding unstated curriculum experiences that play critical roles in STEM achievement. Given that approximately 34% of the ACT-tested students who reported that they were not interested in STEM were deemed college-ready for a STEM major ACT (2017), the PBOSS may be used to identify and recruit untapped talent into STEM majors as well. The PBOSS 1 also provides a psychometrically sound tool that can be used in future STEM research.
Supplemental Material
Appendix_A – Supplemental material for Introducing the Predictors of Black Outcomes in STEM Survey (PBOSS): A Tool for Identifying and Cultivating STEM Talent
Supplemental material, Appendix_A for Introducing the Predictors of Black Outcomes in STEM Survey (PBOSS): A Tool for Identifying and Cultivating STEM Talent by Vinetta C. Jones, Kenneth Alonzo Anderson, Mohammad Mahmood and Ayanna Johnson in Urban Education
Supplemental Material
Appendix_B – Supplemental material for Introducing the Predictors of Black Outcomes in STEM Survey (PBOSS): A Tool for Identifying and Cultivating STEM Talent
Supplemental material, Appendix_B for Introducing the Predictors of Black Outcomes in STEM Survey (PBOSS): A Tool for Identifying and Cultivating STEM Talent by Vinetta C. Jones, Kenneth Alonzo Anderson, Mohammad Mahmood and Ayanna Johnson in Urban Education
Footnotes
Declaration of Conflicting Interests
The author(s) declared no potential conflicts of interest with respect to the research, authorship, and/or publication of this article.
Funding
The author(s) disclosed receipt of the following financial support for the research, authorship, and/or publication of this article: The authors received generous research support for this project from the National Science Foundation (Award #1238514).
Notes

Supplemental Material
Supplemental material for this article is available online.
Author Biographies
References
Supplementary Material
Please find the following supplemental material available below.
For Open Access articles published under a Creative Commons License, all supplemental material carries the same license as the article it is associated with.
For non-Open Access articles published, all supplemental material carries a non-exclusive license, and permission requests for re-use of supplemental material or any part of supplemental material shall be sent directly to the copyright owner as specified in the copyright notice associated with the article.
