



Abstract
This paper estimates demand for housing and its attributes in urban Bangladesh using a survey of 4400 owner, renter and squatter households. The results revealed that housing demand is inelastic with respect to income and price; and price elasticity is less than income elasticity in absolute terms. Estimates of demand for housing attributes showed that owner and renter households value structural quality, sanitation and electricity, as well as a living room and dining room/kitchen. Squatter households value living space, pit latrine, water supply and electricity, but place less emphasis on structural quality. Irrespective of these submarkets, income improvement strategies are likely to be the most effective means of enhancing housing consumption. The rental submarket might be improved by rent liberalisation, while slum improvement strategies should focus on tenure security and incremental improvement. However, contrary to current practice, the emphasis should be on the size of squatter dwellings rather than on their structural quality.
Introduction
The role of cities and towns are vital for national development in Bangladesh. The urban residents, 28% of the total population, contribute over 50% of GDP (United Nations Children’s Fund – Bangladesh, 2010). However, such contribution is constrained by the poor quality of life resulting from poor physical capital, including housing and urban amenities. The existing backlog of dwellings and poor quality of amenities in urban areas indicate that prevalent urban policies and programmes are not properly designed/implemented to fulfil the demand of housing and its attributes. For example, about 35% of the population in the largest six cities – Dhaka, Chittagong, Khulna, Rajshahi, Barisal and Sylhet – was living in slums in 2005 (Angeles et al., 2009). The Household Income and Expenditure Survey (HIES) also sheds light on inadequate urban services in Bangladesh (Bangladesh Bureau of Statistics, 2010). Despite the pathetic conditions of housing and its attributes, no efforts have been made to establish demands or reveal preferences for these basic inputs. Even the draft Bangladesh’s National Urban Sector Policy has called for an assessment of housing supply and demand, as well as the collection, analysis and dissemination of information about housing markets on a regular basis in order to create an efficient housing market (Committee on Urban Local Governments, 2011). However, no efforts have been made in this direction. This study seeks to fill this knowledge gap and estimates housing demand and the demand for housing attributes in owner, rental and squatter submarkets of urban Bangladesh.
Urbanisation in Bangladesh
Urbanisation trend and spatial structure
About 41.5 million people, 28% of the total population, were living in urban Bangladesh in 2010. The annual growth rate of the urban population is higher than that of the rural population, consequently the urbanisation level is expected to increase (Figure 1) (United Nations Department of Economic and Social Affairs (UNDESA), 2011). By 2025, urban population is expected to reach 63 million, 1.5 times current level, with an average annual growth rate of 2.8%. Bangladesh’s urbanisation, similar to developing economies, can be attributed to natural increase in urban population, territorial extensions and change in definition of urban area, and rural to urban migration. The third component accounted for 40% of national urban population change during 1974–1981 (Islam, 2006).
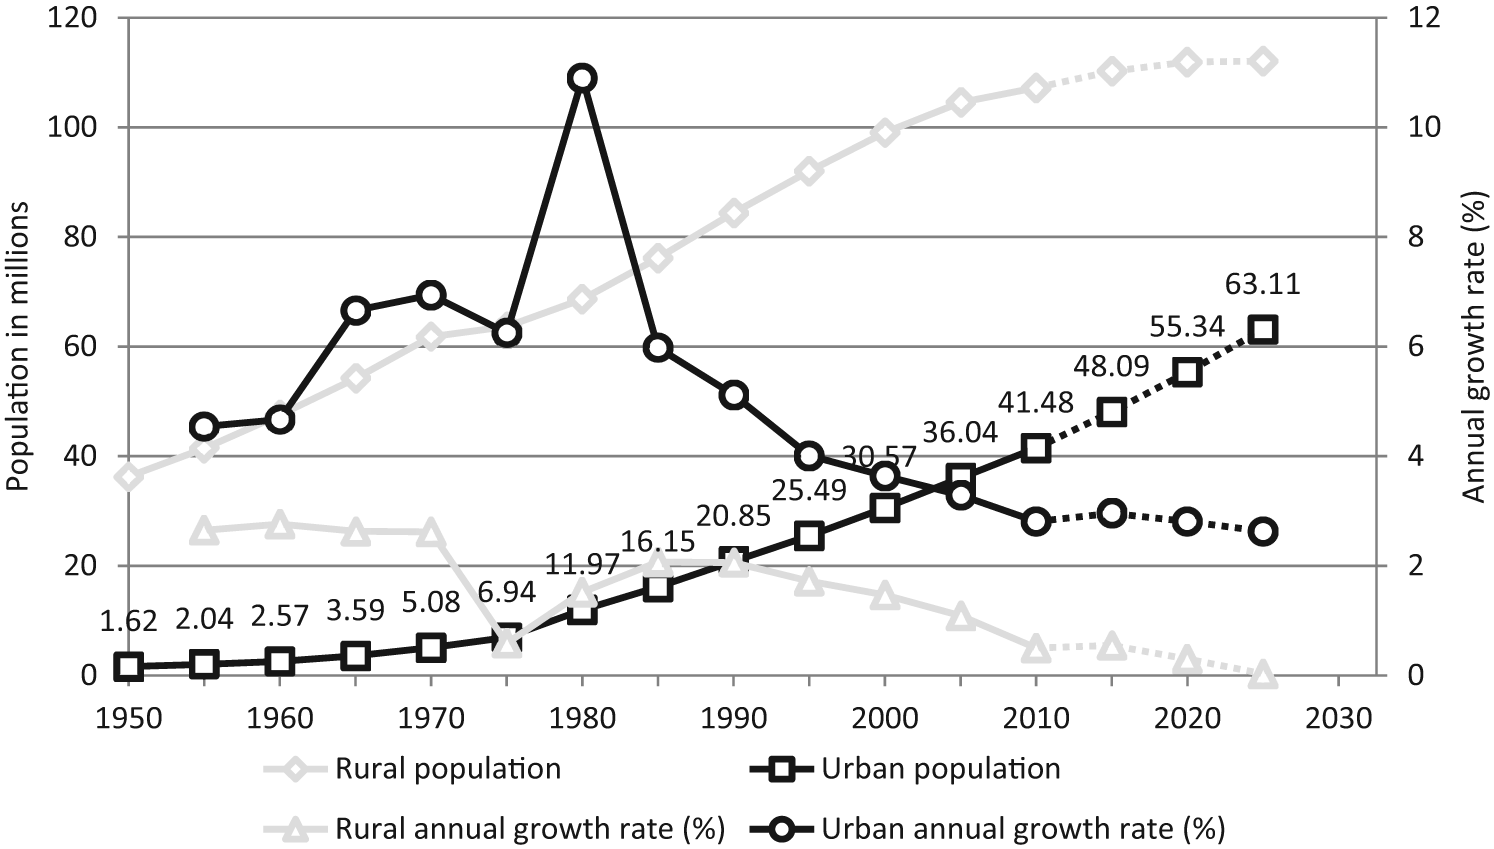
Urban and rural population growth trend in Bangladesh, 1950–2025.
Bangladesh has a broad spectrum of urban areas, comprised of 532 urban centres in 2001. The urban centres included one mega city (over 10 million population); three metropolis (500,000 ~10 million); 17 cities (100,000 ~ 499,999); 126 medium size towns (25,000 ~ 99,999); and 390 small towns (population below 25,000) (Figure 2) (Nazem, 2011). The pattern of urbanisation exhibits primacy with the capital city – Dhaka. It accommodates 15.4 million urban dwellers, about 37% of total urban population of country. The largest three cities after Dhaka constitute about 18% of total urban population – Chittagong (5.0 million), Khulna (1.7 million) and Rajshahi (0.9 million). These four cities collectively accommodate 55% of the urban population, which are also known as Statistical Metropolitan Areas (SMAs).

Bangladesh urban centres and divisions.
Characteristics of households and housing stock
The socio-economic characteristics of households determine housing consumption; therefore, these characteristics should be understood to appreciate the outcomes of the housing stock in urban Bangladesh. Bangladesh is one of the poorest countries in the world. According to a recent estimate, 21% of urban households (head count ratio) were poor (of these 7.7% were very poor); a little better than the rural households, where the poverty level was 35.2% (of these 21.1% were very poor), using the cost of basic needs method. Nevertheless, poverty has reduced both in urban and rural Bangladesh by approximately 7% from 2005 to 2010 (Bangladesh Bureau of Statistics (BBS), 2011). Average monthly consumption expenditures (AVMCE), 1 a proxy to income, were more or less the same in owner and renter households (owner − 12,045 BDT 2 and renter − 11,526 BDT) but squatter households consumed only 6825 BDT, roughly half of the owner/renter households (Table 1). The squatter households also lack education attainment, such as lower incidence of literacy and higher education in comparison with owner and renter households. For instance, the proportions of households’ head without any formal education (HHH-edu1) in owner, renter and squatter were 39%, 32% and 65%, respectively. The same pattern was also observed with higher education, graduation/professional degrees (HHH-edu4), where corresponding values were 10%, 18% and 2%. Moreover, squatter households were disproportionately male-headed (90%) with smaller household size (3.98) in comparison with owner (86%, 4.69) and renter (89%, 4.09) households.
Descriptive statistics of variables used in estimations of housing demand and demand for housing attributes in urban Bangladesh, 2010.

Mostly, but not exclusively, urban poor live in informal settlements. Roughly 40% of low-income urban households do not have access to adequate housing 3 (Nawaz, 2004). In urban Bangladesh, estimated housing shortages were about 1.0 ~ 1.5 million, with about 500,000 dwelling units added annually (Nenova, 2010). Moreover, only 28% of urban housing stocks were composed of permanent dwelling units – brick/cement walls and concrete roof (Bangladesh Bureau of Statistics, 2010). As expected, owner-occupied housing stock was in better condition. For example, the average size of owner-occupied dwellings was (44.4 m2) more than twice that of squatter dwellings (21.5 m2), while the average size of a rental dwelling was 35 m2. The owner-occupied dwellings were large in size, but rental dwellings were overall of better quality. For instance, access to poor quality toilets in rental dwellings was only 21%, in comparison with 34% in owner-occupied dwellings. In the same way, access to drinking water from any sources maintained by the statutory bodies/non-government organisations was 35% in rental housing stock, while only 13% in owner housing stock. Rental dwellings also had better structural qualities in comparison with owner-occupied dwellings. As expected, squatter dwellings were of the worst quality, such as small size, poor structural quality and inadequate access to urban amenities.
Broadly, urban housing stocks can be classified into formal and informal sectors. The housing stock in the formal sector includes public, cooperative, private and individual housing. While the informal sector housing stock consists of private, slum and squatter housing. The role of public agencies in housing delivery of low-income/informal households is marginal. As Islam (2012) pointed out, public agencies do not play a pro-active role in providing low-cost housing but reactive measures against proliferation of informal settlements, such as re-locations and evictions (personal communication, 6 April). Table 2 elaborates typologies of housing stocks with important key players. The key players in formal-sector housing are the Ministry of Housing and Public Works through the Public Work Department (PWD), the National Housing Authority (NHA), the Development Authorities and the Cooperative societies. While informal sector housing is mainly operated through an individual effort in many capacities such as self-help housing.
Housing delivery systems in urban Bangladesh, 2012.

Notes: 1(a), 1(b), 1(c), 1(d) and 2(a) are divided into owner and renter households for the analysis in this study while, 2(b) and 2(c) are considered as squatter households without distinguishing their tenure because of a small sample size.
Source: Derived from Islam (1996, 2004).
Although data or estimates are not available about the composition of housing stocks in urban Bangladesh, a rough estimate of Dhaka’s housing composition can illustrate a national picture. In early 2000s, Dhaka had 60% informal and 40% formal dwelling units (Islam, 2004). The formal-sector housing stocks was composed of public (10%), cooperative (less than 1%), private formal (5%) and individual formal (25%), while informal sector housing stocks consisted of private informal (21%), slum/squatter (35%) and others (4%) (Islam, 2004). In sum, the informal sector contributes a large share of housing, including 35% slum/squatter housing, and their dwelling conditions were poor as revealed by the HIES (BBS, 2010) (Table 1). The large share of informal dwellings is the result of inadequate supply of formal housing, as prevalent in South Asian cities.
Conceptual framework of estimations and data set
Estimations of housing demand
This study used a methodological framework from well-established housing economics literature setting out a model of housing demand, housing supply and market equilibrium. The demand for housing depends on the price of the dwelling and demographic characteristics of the household, including household’s income. The demand analysis postulates a relationship between the quantity of housing demanded, its relative price, the household’s income and demographic characteristics. In this context, one can identify Qh = f (Ph, Y, H1, H2…), where, Qh is the quantity of housing services demanded; Ph is the relative price of housing; Y is the income of household and Hi (i =1 … I) are the household characteristics.
However, measurements of these variables are critical, particularly, Qh, Ph and Y. In this study, quantity of housing services demanded (Qh) is measured by floor area consumption per household. Another equivalent variable could be expenditure on housing in the form of rent. Relative price of housing, Ph, measured by revealed price of dwelling per unit floor area. Another equivalent measurement for housing price could be rental value or sale/purchasing value. Our data set includes rental value (actual rent for renter households and imputed rent for owner households) and revealed price of dwelling in response to a question ‘if you want to buy or construct a dwelling just like this, how much money would you have to pay?’ Alternatively the estimates also used ‘rental value’ instead of ‘revealed price’ but did not find higher explanatory power of the models. Income of household Y could be explained by the household’s consumption expenditure or household’s income from all sources. Fortunately, we have both variables in our data set. However, previous studies showed that consumption expenditure seems to be more stable over income. This study, therefore, used household’s average monthly consumption expenditure (AVMCE) as a proxy for income. Furthermore, analysis included household characteristics: size of household, religion, gender of household’s head, marital status of household’s head, age of household’s head, remittance status of household and locations (4 SMAs, 7 regions and 94 thana). The location variables control specific variations associated with spatial context. More precisely, equation (1) shows housing demand model and also functional form following previous studies (Ahmad et al., 2013b; Mehta and Mehta, 1989; Tiwari and Parikh, 1998). Table 1 presents definitions and descriptive statistics of these variables.

Estimations of demand for housing attributes
It is assumed that households consume a bundle of housing attributes H(h1, h2, … hn) in addition to other composite commodities X whose price is unity. They maximise the utility U(h1, h2, … hn :X) subject to their budget constraint Y= X+P(H) where Y is the household’s income; X is the price of commodities and P(H) is the price of the housing. This implies that the demand for housing attributes can be estimated in the form of a hedonic function P = P(h1, h2, … hn), through which the marginal valuation of each housing attribute is estimated by regressing housing value on housing attributes h1, h2, … hn (Green and Malpezzi, 2003). Equation (2) presents the hedonic price function form used in the estimation of housing characteristics. Table 1 also presents definitions and descriptive statistics of these variables (lower panel).

Data set
This study uses a nationally representative micro data, Household Income and Expenditure Survey (HIES) − 2010, collected by the Bangladesh Bureau of Statistics (BBS), an apex organisation of the Ministry of Planning, Government of Bangladesh. This data set was collected based on a two-stage sample design of 612 primary sampling units (PSU), from 16 strata (six rural, six urban and four Statistical Metropolitan Areas). The sample design was based on rural, urban and SMAs households and not owner, renter and squatter households, as analysed in this study. The analyses for owner and renter households included all subsystems of formal sector and private informal subsystems, while squatter households did not classify in this line because of a small sample size (see notes, Table 2). The HIES-2010 surveyed 4400 urban households from Bangladesh, where housing demand estimates used 2807 owner, 954 renter and 110 slum households, while demand for housing attributes estimates used 2841 owner, 1407 renter and 110 slum households. Additions of these sample sizes by subsystems do not match the total urban households because of missing values of some of the variables used in the estimates. Out of 4400 households, 1120 (25.5%) were from SMAs (Dhaka, Chittagong, Khulna and Rajshashi) and the remaining from non-SMAs. The distribution of samples by divisions were as follows: Barisal (300; 6.8%), Chittagong (780; 17.7%), Dhaka (1440; 32.7%), Khulna (700; 15.9%), Rajshahi (600; 13.6%), Rangpur (380; 8.6%) and Sylhet (200; 4.5%). The survey covered vast socio-economic information such as education, health, migration, economic activities and wage employment, enterprises (agricultural and non-agricultural), housing, income and assets (including remittances), and consumption. Most of the variables were at household level and a few of them at individual level. Particular to our study, the survey had detailed information about households’ characteristics – income from all sources, consumption expenditure, socio-economic characteristics and remittances details. The survey included housing characteristics – size of dwelling, revealed value of housing, rents (imputed rents), number of rooms and access to urban services. These data were collected using Data Entry Program (DEP) which had the provision of detecting validity and consistency errors. In addition, the HIES-2010 had the scope of data correction at field level by revisiting the primary sampling units (PSUs) by the field supervisors in case of detection of error by the DEP. Therefore, the data set seems to be well validated and calibrated of any possible errors.
Estimates of housing demand
Table 3 presents estimations of housing demand for owner, renter and squatter households. All models showed high level of goodness to fit, adjusted R2 ranged between 0.33 and ~ 0.66. The models found multicollinearity within an acceptable range.
Estimation results of housing demand in urban Bangladesh, 2010.

Notes: Owner and Renter equations use thana as fixed effect. Equations use weight. DV = log of floor area in m2. ***p < 0.01, **p < 0.05, *p < 0.1.
Price and income elasticities
Price of housing and income of household were the most important predictors of housing consumption, as revealed through standardised coefficients. The coefficients of price and income variables were significant and inelastic in all models. Price elasticities for owner, renter and squatter households were −0.18, −0.05 and −0.07, respectively. Therefore, a 10% increase in housing price reduces housing consumption by 1.8%, 0.5% and 0.7% in owner, renter and squatter households, respectively, ceteris paribus. The owner-occupied households are adversely affected by the increasing price of dwellings. Whereas, a 10% increase in household income augments housing consumption by 6.9%, 6.7% and 3.9% in owner, renter and squatter households, respectively, as revealed from income elasticities. Since income elasticities were higher than dwelling price elasticities in absolute terms, therefore income of households has greater influence on housing consumption than the dwelling price. Moreover, income is less effective in enhancing housing consumption in squatter households in comparison with owner/renter households.
This study also estimated income and price elasticities by income groups (dividing households into three equal groups: low, middle and high) without considering tenure, on aggregated 4400 households. The results showed small variation in price elasticities – low (−0.12), middle (−0.16) and high (−0.11) – but large variation in income elasticities – low (0.42), middle (0.49) and high (0.82). It means housing demand exponentially increases with income improvement. In the near future, household income is expected to increase (Narayan et al., 2007); therefore, enabling strategies should be made to meet increased housing demand.
These results are similar to findings from other developing countries. Generally, income and price elasticities are inelastic, and income elasticities are greater than price elasticities, in absolute terms (Malpezzi and Mayo, 1987). Previous studies revealed very little difference between income and price elasticities of owner and renter households. This study, however, showed very little difference in income elasticities but a significantly large difference in price elasticities between owner and renter households.
Table 4 presents a comparison of income and price elasticities among selected studies from developing countries cities/regions. Most of these studies have divided the housing market into owner and renter, except Ahmad et al. (2013b), who considered slums in Delhi. Slum households in Delhi showed high price elasticity (0.77) but non-significant income elasticity. The results of squatter households in Bangladesh differ from those in Delhi in two aspects: the squatter households of urban Bangladesh had low price elasticity (−0.17); and income elasticity was significant and of high magnitude (0.39). It means squatters of urban Bangladesh need income improvement programmes, despite low income elasticity, in comparison to their counterpart owner/renter households, to enhance housing consumption, unlike price reduction strategies in Delhi’s slums. Perhaps, this difference is the outcome of Delhi’s land policy, where land supply for low-income households is meagre (Ahmad et al., 2013a; Sivam, 2002, 2003).
Selected estimates of income and price elasticities of housing demand in developing countries.
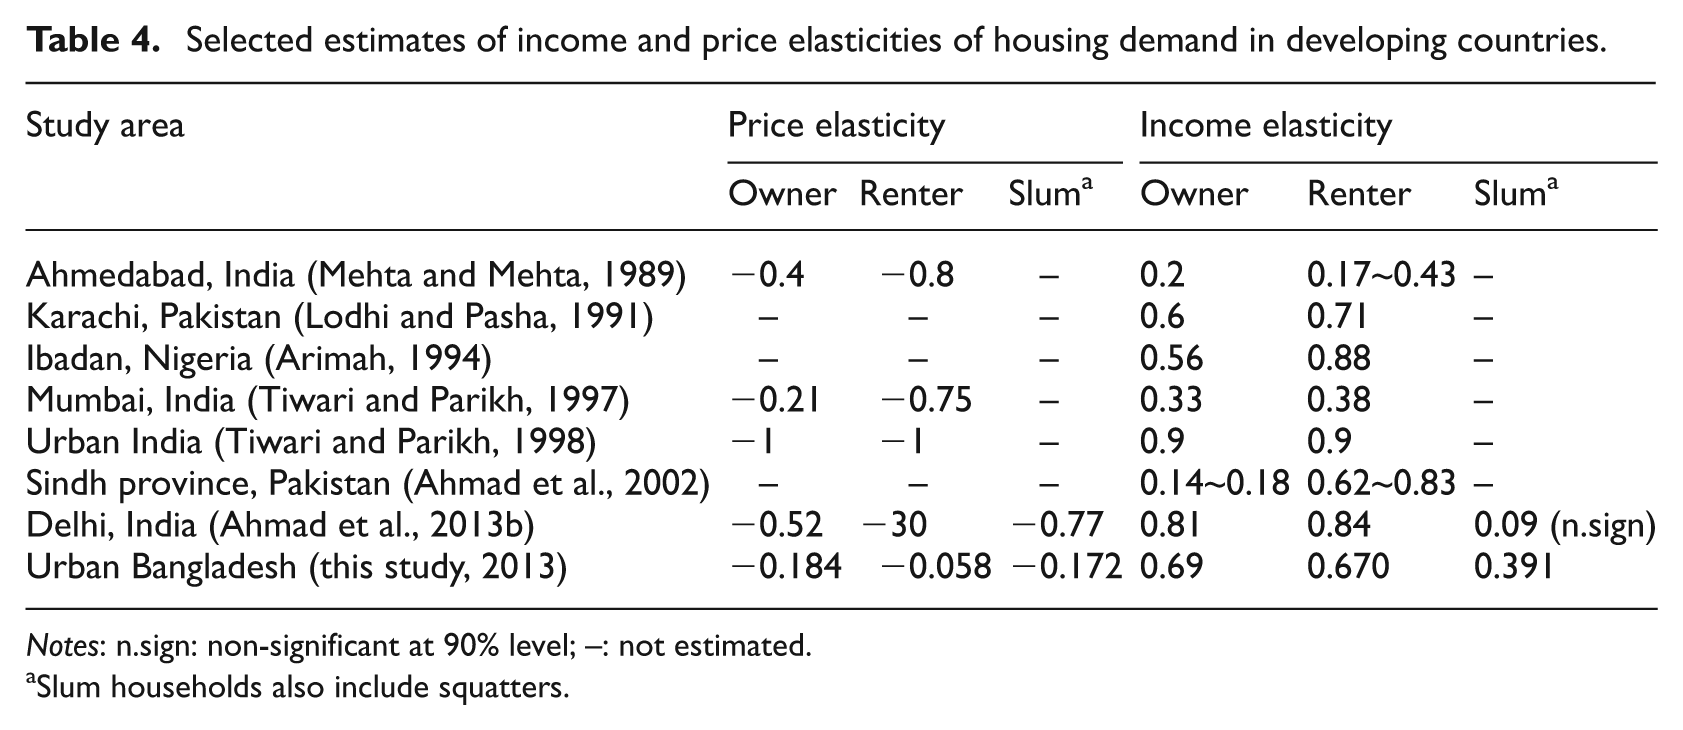
Notes: n.sign: non-significant at 90% level; –: not estimated.
Slum households also include squatters.
Household and location characteristics
In addition to income and price, this study also examined effects of household characteristics and locations on housing consumption. Mayo (1981) showed that results of demographic variables are muddled and difficult to compare across studies. In our study, an older household head consumed more housing. More precisely, with an increase of household head’s age by 10 years, the housing consumption increased by 8% in owner and 5% in renter households, a similar result revealed from urban India (Tiwari and Parikh, 1998). Education attainment also affects housing consumption. For instance, in owner and renter households, with graduate (or more)/professional degree household’s head consumed 25% and 50% more floor area, respectively, in comparison with illiterate household heads, ceteris paribus. This study did not reveal any significant effect of household size or gender of household head on housing consumption. In owner-occupied households, currently married household’s head consumed 12% less floor area in comparison with divorced, separated and widowed household’s head, ceteris paribus.
Interestingly, renter and squatter households located in SMAs consumed 28% and 22.5% less floor area in comparison with non-SMAs located households, provided other factors remained constant. Possible reasons for reduced housing consumption in renter/squatter households in SMAs could be inadequate supply of housing/land and large-scale temporary and seasonal migrants. The migrants might squeeze their housing consumption in order to fulfil other needs including sending remittances to their family. These findings draw attention to provision of housing in rental and squatter submarkets in SMAs. Additionally, housing demand remarkably varied across the regions. In comparison with Barisal, other regions consumed less floor area, ceteris paribus. For instance, owner households located in Sylhet, Khulna, Chittagong and Dhaka consumed 48%, 27%, 21% and 11% less floor area respectively, compared with Barisal-located households (see Figure 2 for spatial location).
Estimates of demand for housing attributes
Table 5 presents estimates of demand for housing attributes in owner, renter and squatter households. All equations showed high goodness to fit, with adjusted R2 between 0.40 and ~ 0.51.
The quantity of housing (dwelling size) is one of the important determinants of housing value. An addition of a room in owner, rental and squatter dwellings increased dwelling values by 9.5%, 10.8% and 36.3%, respectively. It showed relative importance of living room in squatter households, where addition of a room increased dwelling value 3.5 times in comparison with owner/rental dwellings.
Structural quality of dwelling – wall and roof made up of permanent materials – fetched significantly large sums of dwelling values in comparison with wall/roof made of temporary materials. For instance, a dwelling with permanent roof materials (brick/cement) fetched about 34% more dwelling value in comparison with a dwelling of temporary roof materials (CI sheet/wood, tile/wood, hemp/hay bamboo and others) in owner/rental dwellings. However, such structural attributes were not significant for squatters.
Access to better quality of toilet fetched large sum of dwelling values. A dwelling with sanitary or permanent latrines was better valued than the latrine-pit. A dwelling with pit latrine fetched 11.5% ~ 32% more dwelling values than temporary/others forms of latrine. This finding revealed demand for better quality of toilet, irrespective of tenure.
One interesting finding revealed that access to water supply in squatters fetched 127% more dwelling value in comparison with ‘other’ sources of water supply. Also electrification fetched about 52% more dwelling value in comparison with non-electrified dwelling, holding other variables constant in squatter households. In urban Bangladesh, these two urban amenities are proxy for tenure security, therefore, availability of these amenities showed drastic improvement in dwelling values.
Access to drinking water through public services/tube well reduced dwelling values in comparison with other forms of drinking water in renter households, but the same was negative but not significant for owner households. This result was ambiguous to our assumption; ideally it should increase rental values. An estimation (not presented here) with all sources of drinking water in categorical variables (six classes rather than present three) showed none was significant except ‘others’ (which was not specified in the data) revealed significant. The ‘others’ category might be access to bottled water or some better form of drinking water that might have influenced the results.
The demand for housing attributes also varied across the regions in owner, renter and squatter households. For instance, households living in Rangpur, Dhaka and Chittagong have high demand for housing attributes in comparison with Barisal region households. To achieve a balanced spatial development, housing programmes should eliminate these gaps.
Estimation results of demand for housing attributes in urban Bangladesh, 2010.
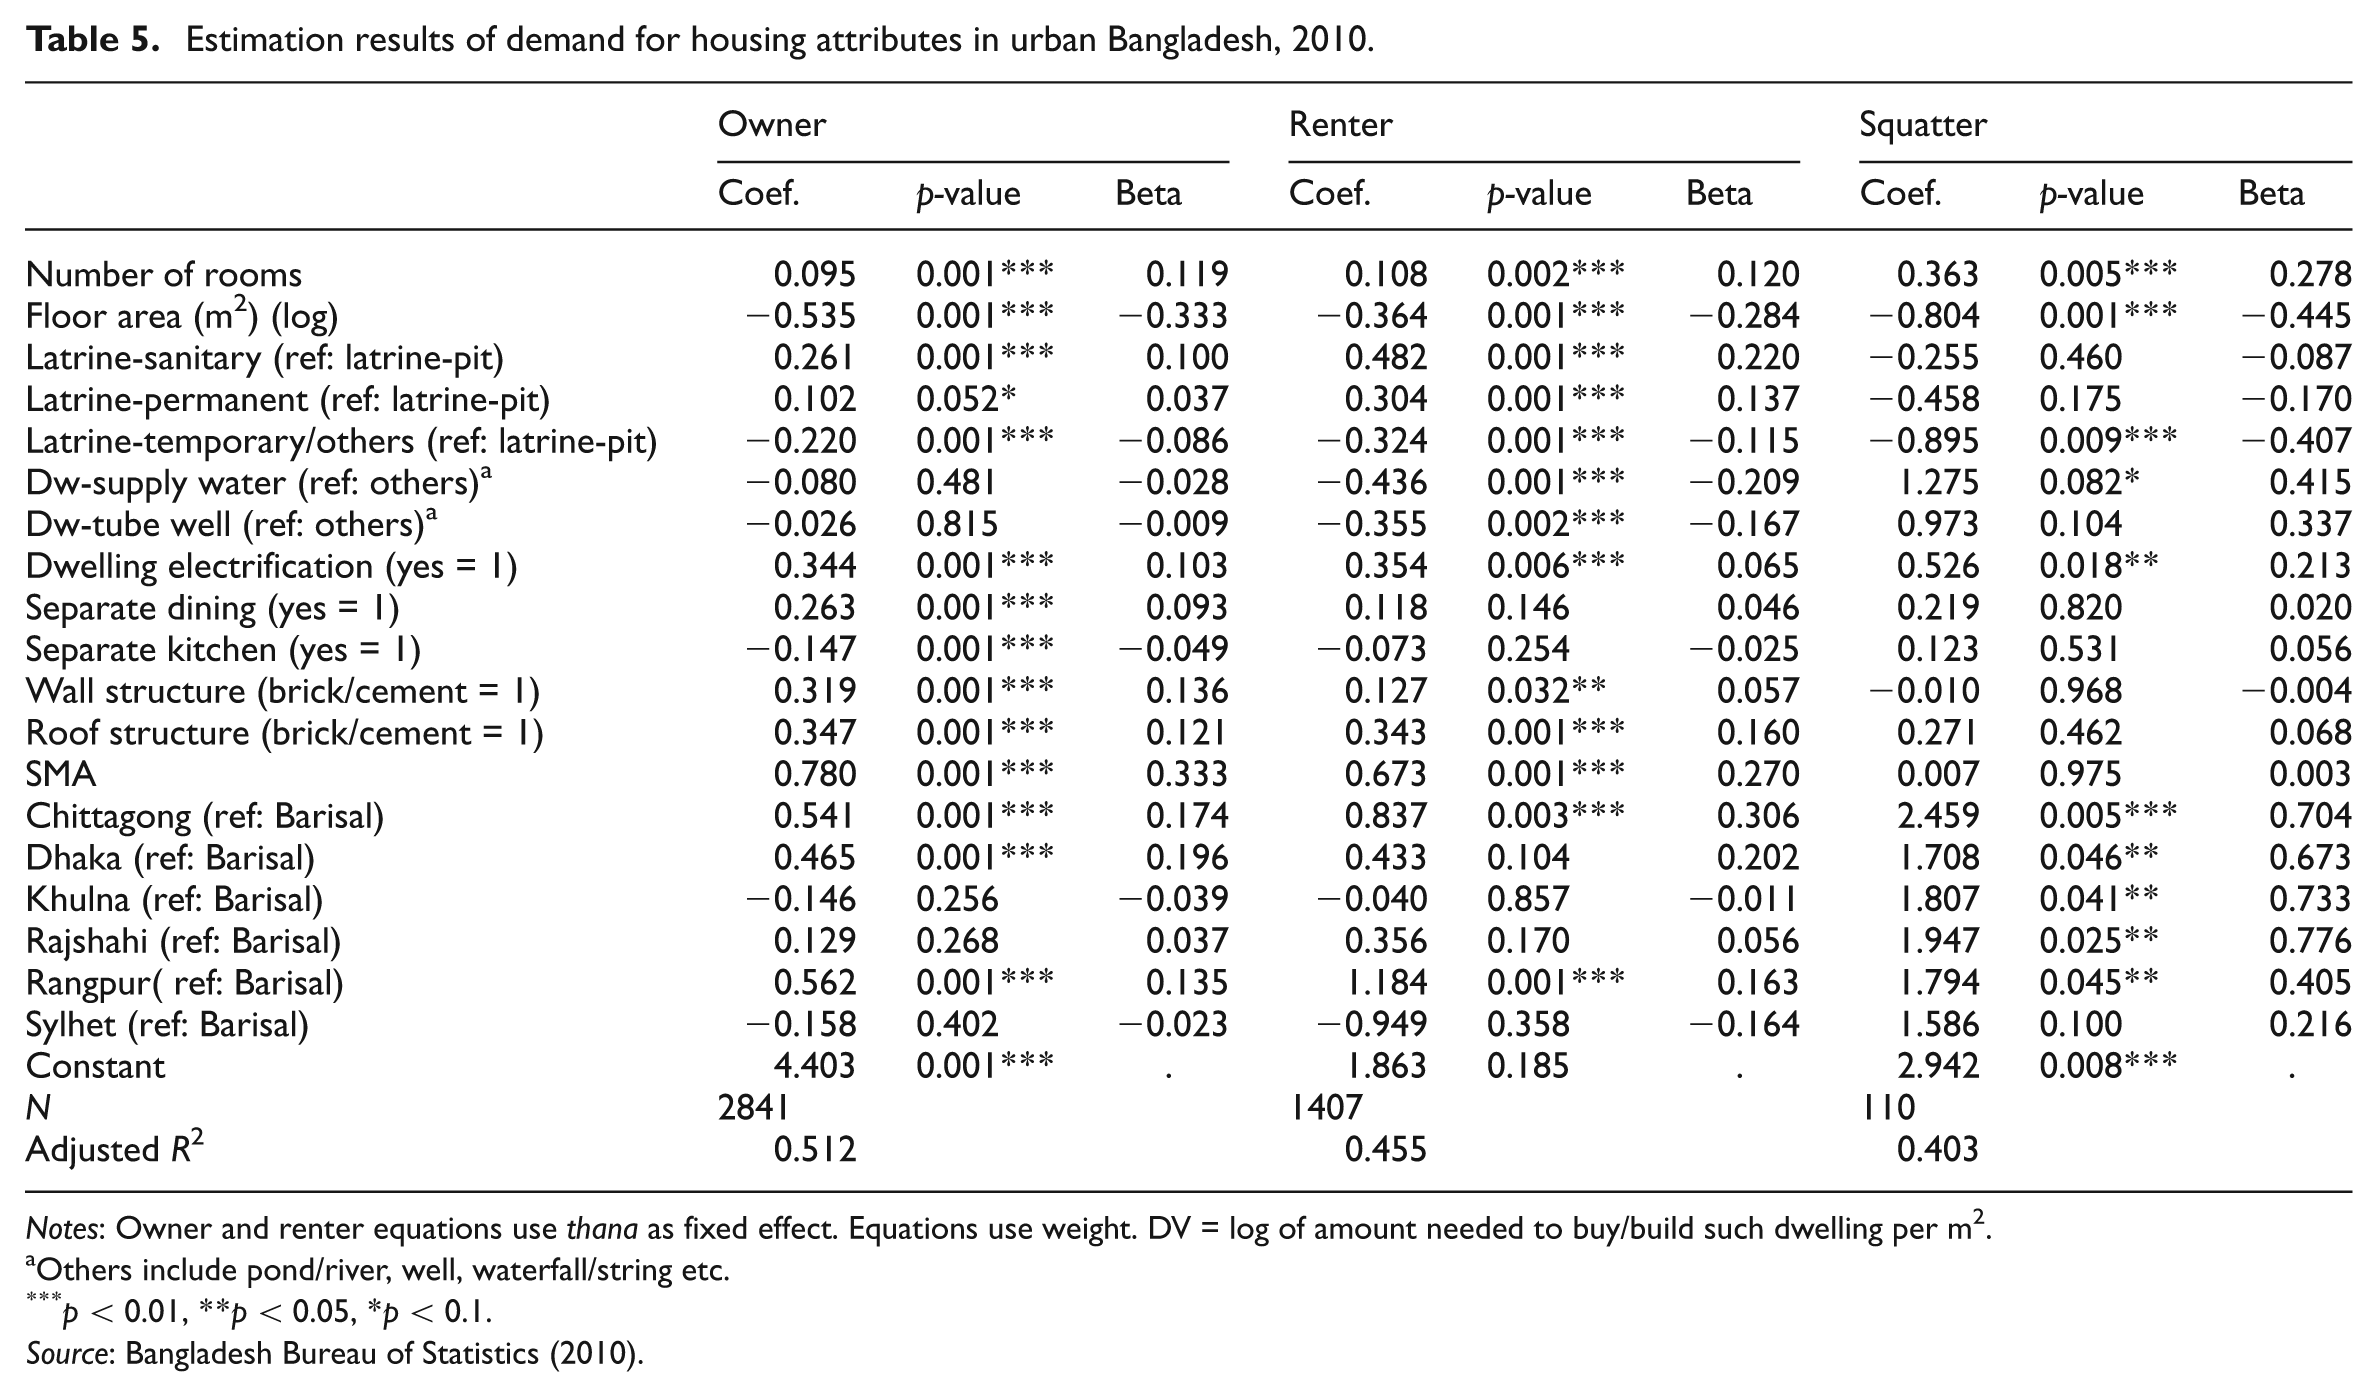
Notes: Owner and renter equations use thana as fixed effect. Equations use weight. DV = log of amount needed to buy/build such dwelling per m2.
Others include pond/river, well, waterfall/string etc.
p < 0.01, **p < 0.05, *p < 0.1.
Conclusions
This study estimated housing demand and the demand of housing attributes in urban Bangladesh, using HIES − 2010. To the best of our knowledge, this is the first attempt to analyse Bangladesh’s urban housing markets empirically. Descriptive analyses showed that socio-economic characteristics of owner and renter households were comparable but squatter households remained in a disadvantaged position. Surprisingly, renter households had better dwelling quality than owner households.
The estimates revealed that housing demand was inelastic with the price of dwelling and the income of household. Overall, magnitude of price elasticity was smaller than that of income, in absolute terms. This implied that housing demand was more responsive to the income of household than the price of dwelling. Taking into consideration that current housing consumption in urban Bangladesh is close to the minimum level of basic needs there is little space to further reduce housing consumption despite a rise in dwelling price. Therefore, income improvement strategies with expected economic growth in urban Bangladesh (Narayan et al., 2007), will enhance housing consumption. Such economic growth will also enhance housing consumption among low-income/squatter households but to a lesser extent. However, government policies and programmes are focused on housing supply to high-income groups and, at the same time, infuse tenure insecurity among squatter/slum dwellers (Ahmed, 2007).
On the one hand, high housing demand in corroboration with increased supply raises an issue of unsustainable consumption and production, whereas on the other hand, low housing demand with reduced supply among disadvantaged communities raises a question for their survival and dignified life. Appropriate interventions, as suggested in this paper, will reduce urban vulnerability as well as enhance equitable distribution of resources and urban sustainability, which are urgently needed in urban Bangladesh.
In comparison with owner-occupied households, renter households had almost comparable income elasticity but extremely low price elasticity. Despite the modest demand, renter households consume small-sized dwelling units (about four-fifths) than owner households owing to imposed constraints on the rental housing market. It also raises a question behind the wisdom of existing price control regulations in rental housing and seeks to strengthen the rental housing market. In fact, a well developed rental housing market has great potential to reduce the overall housing deficit and diminish proliferation of informal settlements (Kemp, 2011). Moreover, renter households in SMAs had demand for good quality small-sized dwelling units in comparison with non-SMAs renter households (and vice versa). In order to enhance housing consumption in renter households, income subsidy will be more effective than the rent subsidy, provided governments capacity to subsidise them.
As discussed above, the income elasticity of squatter households was over one-half of the owner/renter households and income elasticity was more than twice price elasticity, in absolute terms. Therefore, ultimately income improvement strategies will be the most effective tool for enhancing housing consumption. Meanwhile, squatter dwellers have high willingness to pay for living room. In addition, they also have willingness to pay for pit latrine, municipal water supply and electricity access, perhaps because of strong association with tenure security. These findings corroborate in situ upgradation and tenure security in squatter/slum settlements, as revealed from other low-income cities such as Peruvian cities (Field, 2005). Moreover, our study did not find evidence for structural quality demand, similar to Delhi’s slum dwellers (Ahmad et al., 2013b). Often planning interventions in low-income cities are not evidence-based and even contradictory to it, such as massive evictions (Nawaz, 2004) and emphasis on structural quality, which led to poor quality of housing outcomes, as visible in Bangladeshi cities. Three policy interventions are suggested: provision of tenure security (as evidenced from urban amenities); recognition and promotion of incremental housing, provided structurally feasible and available unbuilt space (given high value of a living room); and income improvement programmes. In the current situation, private players exclude disadvantaged communities because of their profit-oriented motivation. Furthermore, a lack of inclusive public policies exaggerate the problem. Therefore, public agencies must work under an overarching goal of inclusive growth to bridge the gap between demand and supply.
Bangladesh’s urban centres, as mentioned above, are highly vulnerable on account of their coastal location, dense population and poor socio-economic bases. The vulnerability further intensifies because of climate change. However, urban settlements are on the agenda of climate change adaptation globally (UN Habitat, 2011), including Bangladesh’s community-based adaptation programme. These findings provide useful guidelines for human settlements-based adaptation, focusing on squatter/low-income households in urban centres.
Footnotes
Acknowledgements
The author is thankful to the Bangladesh Bureau of Statistics (BBS) for providing data sets used in this study. Earlier versions of this article were presented in the 48th ISOCARP Congress –Fast Forward: Planning in a (hyper) dynamic urban context, Perm, 10–13 September 2012, and the Sixth Urban Research and Knowledge Symposium –Cities of Tomorrow: Framing the Future, Barcelona, 8–10 October 2012. The author gratefully acknowledges the comments and suggestions received on both occasions and by the editor, Mark Stephens, and two anonymous referees of Urban Studies for improvement of the manuscript. The article is the sole responsibility of the author and does not express the views of the institutions to which the author is affiliated.
Funding
The author is grateful to the Japan Society for the Promotion of Science (JSPS) for supporting through JSPS-UNU Postdoctoral Fellowship and Grants-in-Aid for Scientific Research.