
Abstract
The recent financial crisis has revealed the financial vulnerability faced by a significant number of households in the UK. Households experiencing financial problems may potentially fall into arrears in meeting financial obligations such as rent, mortgage payments or household bills. Indeed, such arrears have been regarded as one of the most direct measures of financial stress at the household level. In this paper, we explore the relationship between household repayment behaviour and neighbourhood ties in order to identify possible channels of support for households experiencing financial stress. We analyse data on 17,723 households drawn from wave 1 of the UK longitudinal study, Understanding Society, merged with information on neighbourhood ties defined at the postcode area level elicited from a sample of 48,906 individuals. Our findings, which relate to the post financial crisis era, suggest that households in regions characterised by strong neighbourhood ties are less likely to report being in arrears and that this relationship is particularly apparent in the case of housing costs. This inverse relationship is strongest in regions characterised by a high density of individuals who feel able to turn to someone in the neighbourhood for support or advice. Thus, neighbourhood and community groups, which enhance social interaction and neighbourhood ties, may be effective channels of support for financially vulnerable households.
Introduction
The recent financial crisis has revealed the financial vulnerability that a significant number of individuals and households face in many developed economies, with households simultaneously holding relatively high levels of debt and limited savings to fall back on in times of financial adversity. The increase in household debt over the past three decades in many countries has been well-documented in both the economics literature and the wider media. 1 Such increases in the level of debt at the household level have led to concern amongst policy-makers in a number of countries over the extent of financial vulnerability and risk faced by households, especially in the context of the current financial and economic climate. 2 As argued by Hamilton (2003), increases in household borrowing may make households vulnerable to reductions in their income or to changes in the interest rate. Households holding debt with limited financial assets are particularly vulnerable to financial shocks related to job loss, a fall in real wages or changes in their personal circumstances such as divorce or changes in household expenditure and financial commitments due to, for example, having children. Households experiencing such changes in their financial situation may encounter problems with meeting their financial obligations leading to financial hardship, which may result in them falling into arrears in meeting payments.
There is a growing empirical literature exploring household finances (see e.g. Guiso et al., 2002, for a comprehensive review of this area), with the analysis of financial hardship at the household level, including the propensity to fail to meet financial obligations, attracting increasing attention in the economics literature.
The focus in the existing literature has been on mortgage payment problems with most studies analysing US data. Furthermore, there has been a particular focus on default behaviour rather than arrears in both the empirical and theoretical literature (see Leece, 2004, for a comprehensive review of the economics of the mortgage market). Arguably, a better understanding of arrears behaviour might lead to a greater ability to forecast mortgage defaults, which would have been particularly significant during the recent financial crisis. 3 The early research on rent and mortgage arrears exploited aggregate data to explore trends in mortgage arrears and repossessions with the focus on structural factors, such as interest rates and income gearing, and factors related to ability to pay, for example unemployment and marriage break-down (see the recent comprehensive survey on possessions and arrears by Aron and Muellbauer, 2010). We discuss the small body of relevant UK literature below.
In an early contribution, Brookes et al. (1994), using aggregate time series data on the proportion of mortgages in arrears or repossessed over time, find no role for income or the divorce rate in explaining mortgage arrears, although the divorce rate and inflow into unemployment are found to influence repossessions. Whitley et al. (2004), exploring the growth in household arrears using aggregate time series data, find that housing equity, unemployment, income and interest payments influence mortgage arrears. Figueira et al. (2005) employ an error correction model to explore the long-run and short-run dynamics in the aggregate level of mortgage arrears. Their findings highlight the importance of changes in the rate of unemployment, loan-to-income and debt-to-service ratios.
The small yet growing number of household level studies represent an important contribution to our understanding of housing payment problems since, as argued by Leece (1995), the use of aggregate time series data may mask household responses to changes in the economic environment. Furthermore, as stated by Burrows (1998), the probability of falling into mortgage arrears is a complex interaction of socio-economic and personal factors. Examples of household level studies include Lambrecht et al. (1997), who analyse a sample of defaults and repossessions, 1987–1991, in the UK and find that the average time to default is positively related to income and inversely related to interest rates. Analysing debt arrears in general, Bridges and Disney (2004), using the 1999 Survey of Low Income Families, jointly model the probability of being in arrears and debt repayments and, conditional on being in arrears, the magnitude of the arrears. In their sample, 45% of households are in debt arrears. Interestingly, they find no strong evidence of persistence in debt arrears. Böheim and Taylor (2000) use the British Household Panel Survey (BHPS), 1991–1997, to explore the incidence of housing payment difficulties and evictions and repossessions and their descriptive statistics indicate a large degree of persistence in housing payment problems. More recently, Dawson and Henley (2012) explore the relationship between unrealised financial expectations and mortgage repayment problems using the BHPS and find that over-optimism is associated with a higher probability of mortgage payment difficulties.
There has also been some analysis of the consequences of falling into housing payment arrears in the existing literature. For example, Taylor et al. (2007) explore the impact of unsustainable housing commitments on psychological well-being using the BHPS, 1991–2003. Their findings suggest that arrears and housing payment problems are associated with significant psychological costs for male household heads, whilst, for female household heads, persistence in unsustainable housing costs leads to psychological costs. Duygan-Bump and Grant (2008), who analyse arrears using the European Community Household Panel 1994–2001, find that falling into arrears has long-term consequences for employment, self-employment and home ownership and health. Finally, Gathergood (2009), focusing on mortgage-holding households, explores the prevalence of mortgage arrears and mortgage repayment risk in the UK using the BHPS. Unemployment, long-term sickness and relationship break-down are all found to predict mortgage arrears.
In this paper, we contribute to the growing literature exploring financial problems at the household level. We focus on arrears since, as argued by Whitley et al. (2004), household arrears are one of the most direct measures of financial stress in the household sector. Additionally, as argued by Breunig and McKibbin (2011), measures of arrears may be regarded as the first symptoms of household financial stress which may ultimately lead to bankruptcy, foreclosure and repossession. Hence, furthering our understanding of the determinants of household arrears should be of particular interest to policy-makers, especially in the context of the current economic climate. In this paper, using household level data for the UK, we focus on the relationship between three types of arrears and neighbourhood effects. Thus, we focus on financial problems defined more broadly than housing payment problems and therefore adopt a wider approach than the existing literature.
Our main contribution, however, lies in our focus on the relationship between neighbourhood effects and the probability of being in arrears. It is apparent that neighbourhood ties may influence the likelihood of being in arrears via a variety of channels. For example, as argued by Breunig and McKibbin (2011: 1004), ‘it is no doubt embarrassing to admit failure to pay bills on time’. It may be the case, therefore, that concern for the perceived social stigma associated with being in arrears, which may be related to an expected loss in social standing in the neighbourhood due to exhibiting ‘socially unacceptable’ behaviour, may serve to lower the probability of being in arrears, with such a relationship being heightened in regions characterised by strong neighbourhood ties. Alternatively, it may be the case that, in regions characterised by strong neighbourhood effects, the provision of informal support or the sharing of information and advice may serve to lower the likelihood of being in arrears. In a similar vein, Georgarakos and Fürth (2012) explore the relationship between social capital and household repayment behaviour. Their findings suggest that high stocks of social capital, as measured by generalised trust and participation in voluntary organisations, are inversely associated with the probability of being in arrears.
Data and methodology
Our analysis is focused on wave 1 of Understanding Society, which is the follow-up survey to the British Household Panel Survey (BHPS), a survey conducted by the Institute for Social and Economic Research comprising approximately 10,000 annual individual interviews, from 1991 to 2008. The BHPS was replaced by Understanding Society in 2009, which is a longitudinal survey of approximately 40,000 households in the UK, with face-to-face interviews carried out in January 2009 and January 2011 for wave 1, where the actual number of completed (usable) household interviews yields 30,169 observations. Thus, the sample size is considerably larger than in the BHPS, which is particularly important given the regional aspect to the analysis conducted in this paper. In addition, Understanding Society provides an opportunity to explore repayment behaviour in the post financial crisis era. 4 Once we exclude observations with missing values on key variables, households in Northern Ireland (this is discussed further below) and restrict the sample to those households that are either paying off a mortgage or paying rent, the sample employed in our econometric analysis is reduced to 17,723 households. 5
We explore the incidence of three different types of household arrears, where the information relating to arrears is elicited from the responses to the following questions, which are asked at the household level. Firstly, ‘many people find it hard to keep up with their housing payments. In the last twelve months, have you ever found yourself behind with your rent/mortgage?’ 6 Secondly, ‘in the last twelve months, have you ever found yourself behind with paying your Council Tax?’ 7 Thirdly, ‘sometimes people are not able to pay every household bill when it falls due. May I ask you, are you up to date with all your household bills such as electricity, gas, water, rates, telephone and other bills or are you behind with some of them?’ 8 The possible responses were: up to date with all bills; behind with some bills; or behind with all bills. Those households indicating they were behind with some or all bills were coded as being in arrears with household bills. In the sample of 17,723 households, 15% report being in arrears with the rent or mortgage, 12% report being in arrears with their council tax and 10% report being behind with household bills. With respect to regional variation in reporting arrears, see Table 1, where there is considerable variation across the regions especially in arrears in housing costs and arrears in bills. Table 2 presents the correlation matrix between reporting the three types of arrears. It is apparent that the correlations are all positive and statistically significant indicating that financial hardship in one dimension may be associated with financial hardship in other dimensions.
Arrears by region (%).
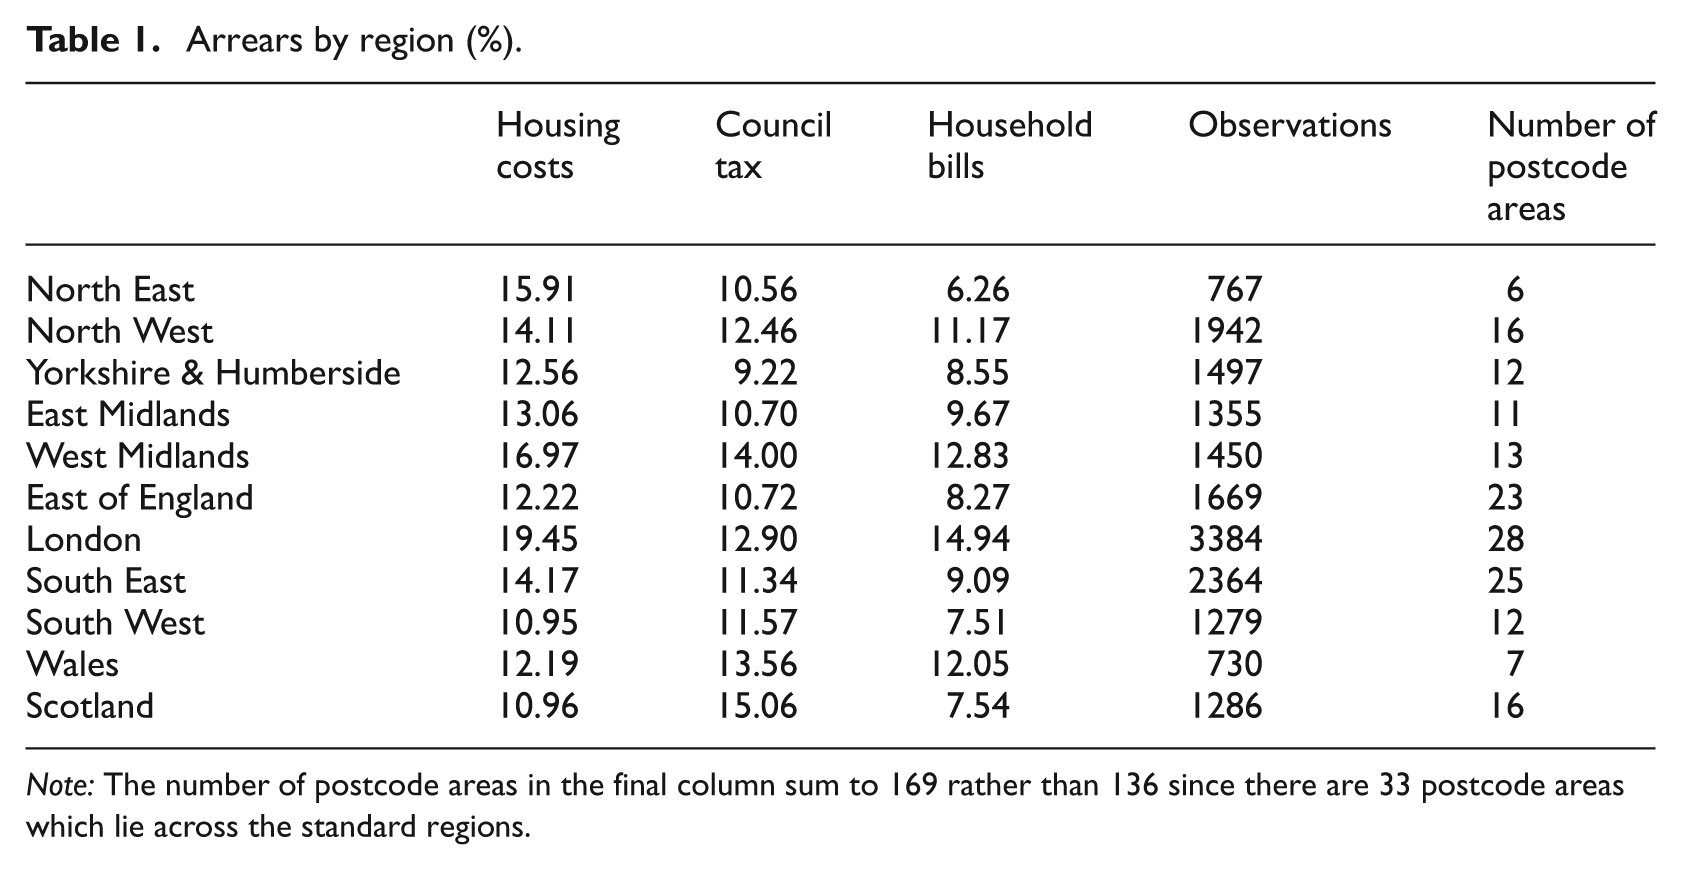
Note: The number of postcode areas in the final column sum to 169 rather than 136 since there are 33 postcode areas which lie across the standard regions.
Correlation between arrears variables.
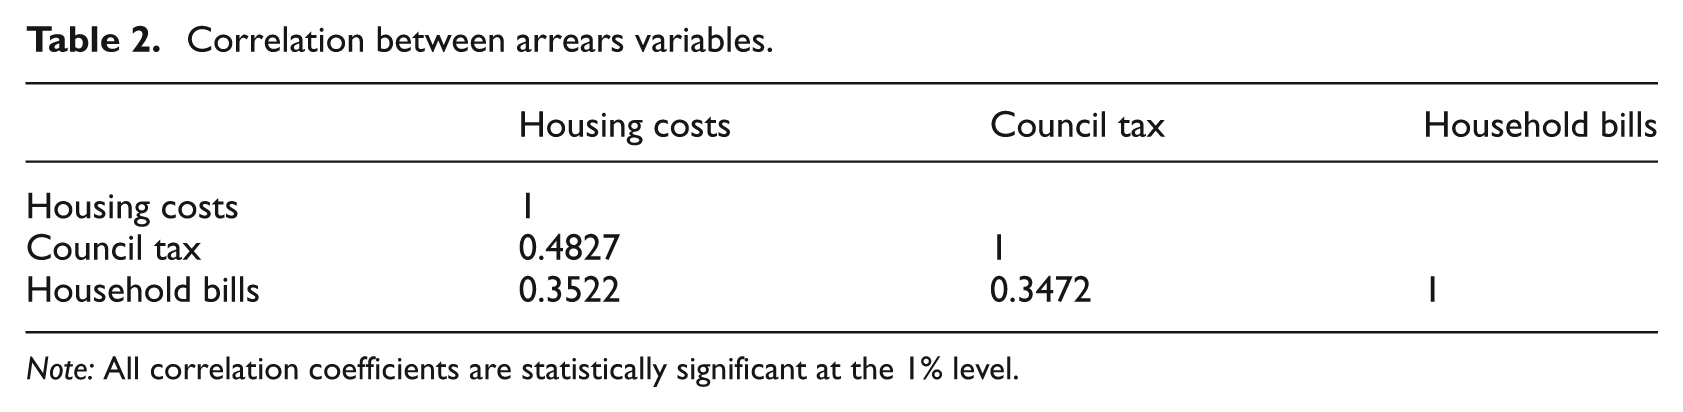
Note: All correlation coefficients are statistically significant at the 1% level.
We initially focus on exploring the determinants of the probability that households report each of the three types of arrears via a binary probit framework as follows:


where j = 1, 2, 3 represents the three types of arrears, there are h = 1, …H households,
In contrast to the existing literature, in order to explore the robustness of our results, we also employ a system probit framework to allow for the potential interdependence between reporting the three different types of arrears. For example, a household facing difficulty in meeting housing payments may potentially also fall behind in paying other household bills. Thus, given the positive correlations presented in Table 1 above, we explore the robustness of our findings by estimating a system of three equations which capture housing cost arrears (equation 2a), council tax arrears (equation 2b) and, finally, arrears in household bills (equation 2c). The key advantage of estimating a system of equations is that it allows us to account for the correlation via unobservable household characteristics that may affect all three types of arrears (such as the financial literacy of the household members or other financial commitments not observed in the data). We specify a system of three latent equations as follows:

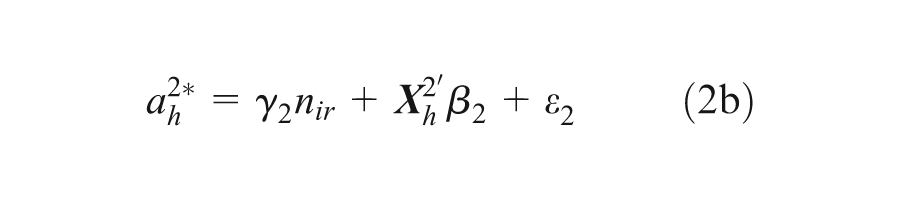
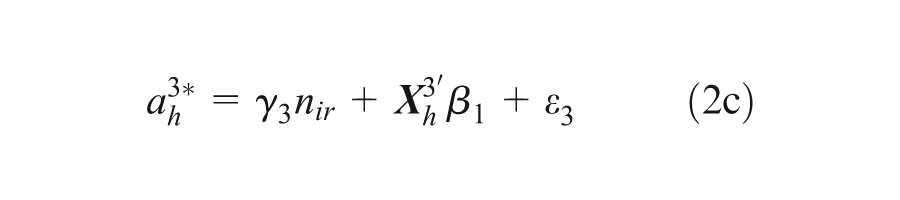
Assume that the error terms in the three latent equations are independently and identically distributed and jointly follow a multivariate normal distribution with mean 0 and covariance matrix

With respect to neighbourhood ties, we focus on the effects of aggregate perceptions relating to neighbourhood ties in a particular region such that a change in an individual’s ties to the neighbourhood cannot influence the aggregate measure of ties to the neighbourhood in that region. Thus, this approach, where we control for the density of neighbourhood ties in the household’s region of residence, reduces the probability of endogeneity bias. Given that, by construction, neighbourhood ties are invariant at the regional level, we cluster the standard errors at the regional level (see Moulton, 1990).
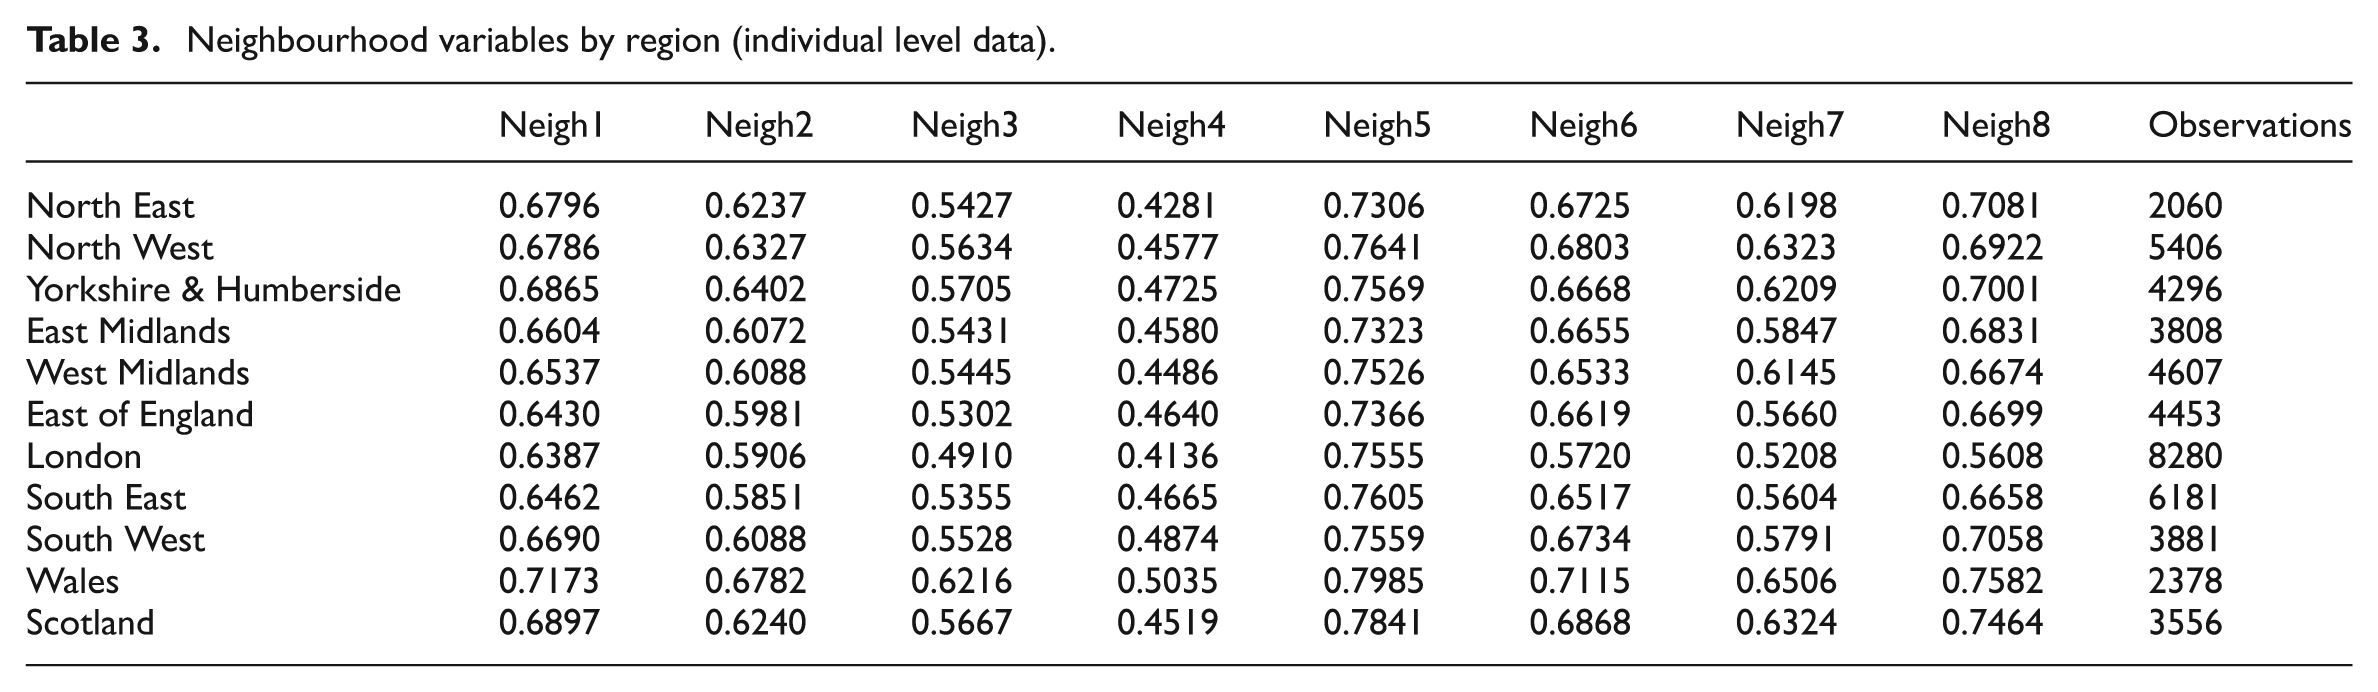
For robustness, we explore eight different measures of neighbourhood ties, based on questions asked to all adults residing in the sample of households, namely: I feel like I belong to this neighbourhood; The friendships and associations that I have with other people in my neighbourhood mean a lot to me; If I needed advice about something I could go to someone in my neighbourhood; I borrow things and exchange favours with my neighbours; I would be willing to work together with others on something to improve my neighbourhood; I plan to remain a resident of this neighbourhood for a number of years; I like to think of myself as similar to the people that live in this neighbourhood; and I regularly stop and talk to people in my neighbourhood. The possible responses to each of the eight questions were: strongly agree; agree; neither agree nor disagree; disagree; or strongly disagree. We initially consider the responses from the individual level data in wave 1 of Understanding Society comprising completed interviews with 48,906 adults to calculate the proportion of individuals responding strongly agree or agree across each of the standard regional classifications: North East; North West; Yorkshire and Humberside; East Midlands; West Midlands; East of England; London; South East; South West; Wales; and Scotland. 9 Table 3 presents the mean value of the neighbourhood variables across each of the 11 regions. It is apparent that there is considerable variation across the neighbourhood variables as well as across the regions. Given the wide geographical area covered by the 11 standard regions, we have constructed the neighbourhood variables at the postcode area level, which translates into 136 postcode areas. The last column in Table 1 presents the number of postcode areas within the 11 standard regions. The empirical analysis is thus based on the neighbourhood variables defined at the postcode area level. Given the high degree of correlation between the eight neighbourhood variables (see the correlation matrix presented in Table 4) we include each measure separately rather than simultaneously in equations 1, 2a, 2b and 2c.
Neighbourhood variables by region (individual level data).
Correlation between neighbourhood ties variables using postcode area data.

Note: All correlation coefficients are statistically significant at the 1% level; neigh1 = belonging, neigh2 = friendships and associations, neigh3 = advice, neigh4 = borrow and exchange favours, neigh5 = willing to work together, neigh6 = plan to remain resident, neigh7 = think of myself as similar, and neigh8 = regularly stop and talk.
Following the existing literature, we control for a range of head of household and household characteristics. We control for a set of standard demographic and socio-economic characteristics of the head of household controls including: gender; marital status; age (the omitted category is aged over 65); highest educational qualification (the omitted category is no education); self-assessed health (the omitted category is poor or very poor health); and employment status. With respect to household characteristics, again we control for standard characteristics such as: housing tenure (the omitted category is renting from the private sector); household income; number of adults in the household; and number of children in the household. Given our focus on the financial situation of households, we also exploit the detailed information available in Understanding Society and include a set of variables capturing financial commitments of the household, namely: monthly housing costs; monthly food expenditure; and annual fuel expenditure. Finally, it is apparent that the household’s standard of living may influence their financial situation, which we proxy with the following set of variables: car ownership; whether the following are in the household, colour television, video recorder/DVD player, satellite dish/Sky TV, cable TV, deep freeze or fridge freezer, washing machine, tumble dryer, dishwasher, microwave oven, home computer/PC, compact disk player, landline telephone or mobile telephone. We also control for month of interview to capture any seasonal differences in repayment behaviour. Summary statistics relating to variables employed in the empirical analysis are presented in Table 5.
Summary statistics (selected variables).

Results
In Table 6, we present the results from estimating the three univariate probit models, where the estimated coefficients are presented in Table 6 Panel A and the marginal effects are presented in Table 6 Panel B. We focus the discussion initially on our key covariates of interest, namely the variables relating to the density of neighbourhood ties. It is apparent from Table 6 Panel A that all of the estimated coefficients on the neighbourhood variables are negative in the case of mortgage and rent arrears and, with the exception of willingness to work with others to improve something in the neighbourhood, are all statistically significant. In the case of council tax arrears, only the estimated coefficients on belonging to the neighbourhood and the importance of friendships and associations in the neighbourhood are on the borderline of statistical significance, whereas, with respect to arrears with bills, six of the estimated coefficients of the neighbourhood variables attain statistical significance. We focus our discussion below on the estimated marginal effects.
Univariate probit models.

Note: (1) Additional controls: month of interview; (2) standard errors are clustered at the regional level; (3) controls included for whether the following are in the household: colour television, video recorder/DVD player, satellite dish/Sky TV, cable TV, deep freeze or fridge freezer, washing machine, tumble dryer, dishwasher, microwave oven, home computer/PC, compact disk player, landline telephone, mobile telephone; (4) household income and food expenditure are monthly; (5) fuel expenditure is annual; (6) neighbourhood ties variables are included one by one. The full specification above relates to the specification including ‘belonging’; (7) full results for all models are available on request.
It is apparent from Table 6 Panel B that the marginal effects associated with the neighbourhood variables in the case of arrears in housing costs (i.e. rent or mortgage) are all large relative to the effects of head of household and household characteristics and, with the exception of the variable capturing willingness to work with others on something to improve the neighbourhood, are all statistically significant. The marginal effects are all negative indicating that households residing in regions characterised by strong neighbourhood ties are less likely to report being in arrears with housing costs. It is apparent that the largest inverse effect is associated with being able to go to someone in the neighbourhood for advice. Similarly, being able to borrow things or exchange favours is inversely associated with the probability of being in arrears with housing costs suggesting that the informal provision of support and advice in neighbourhoods may serve to lower the probability of falling into financial difficulties in paying housing costs. The second largest marginal effect relates to thinking of oneself as similar to the people living in the neighbourhood. The importance of feeling a sense of belonging to the neighbourhood as well as identifying with individuals in the neighbourhood suggest that avoiding arrears in housing costs may be related to a desire to conform with ‘socially acceptable’ behaviour. Interestingly, the marginal effect relating to regularly stopping and talking to people in the neighbourhood is also relatively large and has the strongest statistical significance amongst the neighbourhood variables. Such a finding highlights the potential importance of informal social interaction in mitigating such financial problems.
The pattern of neighbourhood effects associated with council tax arrears is not so clear cut, with only two of the marginal effects of the neighbourhood variables attaining statistical significance, albeit at a borderline level. Such findings, therefore, suggest that the influence of social pressure and/or the provision of informal advice and support do not appear to be important in the context of such payments. This may reflect the fact that council tax payments represent a smaller portion of the household budget than rent or mortgage payments. Alternatively, given the controversy surrounding the introduction of council tax in the UK, the perceived social stigma associated with falling behind with such payments may not be so great. Additionally, for households facing council tax payment difficulties, councils do offer schemes associated with spreading payments or a reduction in council tax depending on personal circumstances (see www.gov.uk/council-tax/ for further details). Thus, specific arrangements as well as guidelines are available for those households who face difficulties in paying council tax.
With respect to arrears in household bills, six of the marginal effects related to the neighbourhood variables attain statistical significance: importance of friendships and associations in the neighbourhood, being able to get advice from someone in the neighbourhood, borrowing things and exchanging favours with neighbours, planning to remain a resident of the neighbourhood, thinking of oneself as similar to others in the neighbourhood and regularly stopping and talking to people in the neighbourhood. These six variables are inversely associated with the probability of reporting being in arrears with household bills. It is apparent that the provision of advice or support in the case of this type of financial difficulty continues to exert a statistically significant influence, with borrowing things and exchanging favours being associated with the largest marginal effect. This is also the case for the extent of social interaction in the neighbourhood, with, for example, regularly stopping and taking to neighbours having the second largest inverse effect on the probability of reporting being in arrears with household bills, providing further evidence endorsing the importance of informal social interaction in mitigating financial problems.
Thus, it seems to be the case that neighbourhood effects appear to be particularly important in the case of housing cost payments, which are arguably the most important part of the household budget both in terms of the financial outlay and in terms of securing accommodation for the household. Moreover, falling into arrears in housing costs can ultimately lead to eviction or repossession. Hence, keeping up to date with such payments plays a crucial role in remaining in a particular neighbourhood. This pattern of results is also apparent in Table 7, where we explore the robustness of the findings by employing a system probit approach. Moreover, the estimated correlation parameters reported in Table 7 are all large and highly statistically significant thereby endorsing the joint modelling approach. 10
Multivariate probit models: Summary of results.

Note: See note to Table 6.
With respect to commenting briefly on the effects of the other control variables, the findings are relatively consistent across the three types of arrears and are in line with the existing literature. It is apparent that individuals in the oldest age category are less likely to report being in any of the three types of arrears than individuals in the other age categories. Higher levels of education (i.e. degree level) and being in excellent or very good health also appear to lower the likelihood of being in arrears. The results suggest that larger households are more likely to report being in arrears. Finally, in accordance with expectations, income and owner occupancy are both associated with a reduced probability of being in arrears. 11
Robustness: Ordered probit and zero inflated ordered probit models
In order to further explore the robustness of our findings, we analyse a series of ordered probit models where the dependent variable is an index of the number of types of arrears reported at the household level. The index runs from zero to two, where 77% of households report no arrears, 13% report being in only one type of arrears and 10% report being in two or more types of arrears. 12 Once again, due to the high correlation between the eight neighbourhood variables, we estimate eight ordered probit models, with standard errors clustered at the regional level and with each of the different controls for neighbourhood ties entered separately rather than simultaneously. In Table 8, we summarise our results presenting the estimated coefficients and marginal effects associated with each of the eight neighbourhood variables. It is apparent that, with the exception of willingness to work together with others in the neighbourhood, all of the estimated coefficients on the neighbourhood variables are negative and statistically significant. The pattern of the marginal effects suggests that neighbourhood ties are positively related to the likelihood of reporting not being in arrears of any type and inversely associated with the likelihood of being in one type or two or more types of arrears. The effects of a high density of individuals in the region responding that they feel like they belong to the neighbourhood and that there is someone in the neighbourhood to turn to for advice both have relatively large effects on the probability of the household reporting not being in arrears. In addition, the effects of feeling similar to the people that live in the neighbourhood and regularly stopping and talking to people in the neighbourhood are both characterised by highly statistically significant effects.
Ordered probit model: Summary of results.
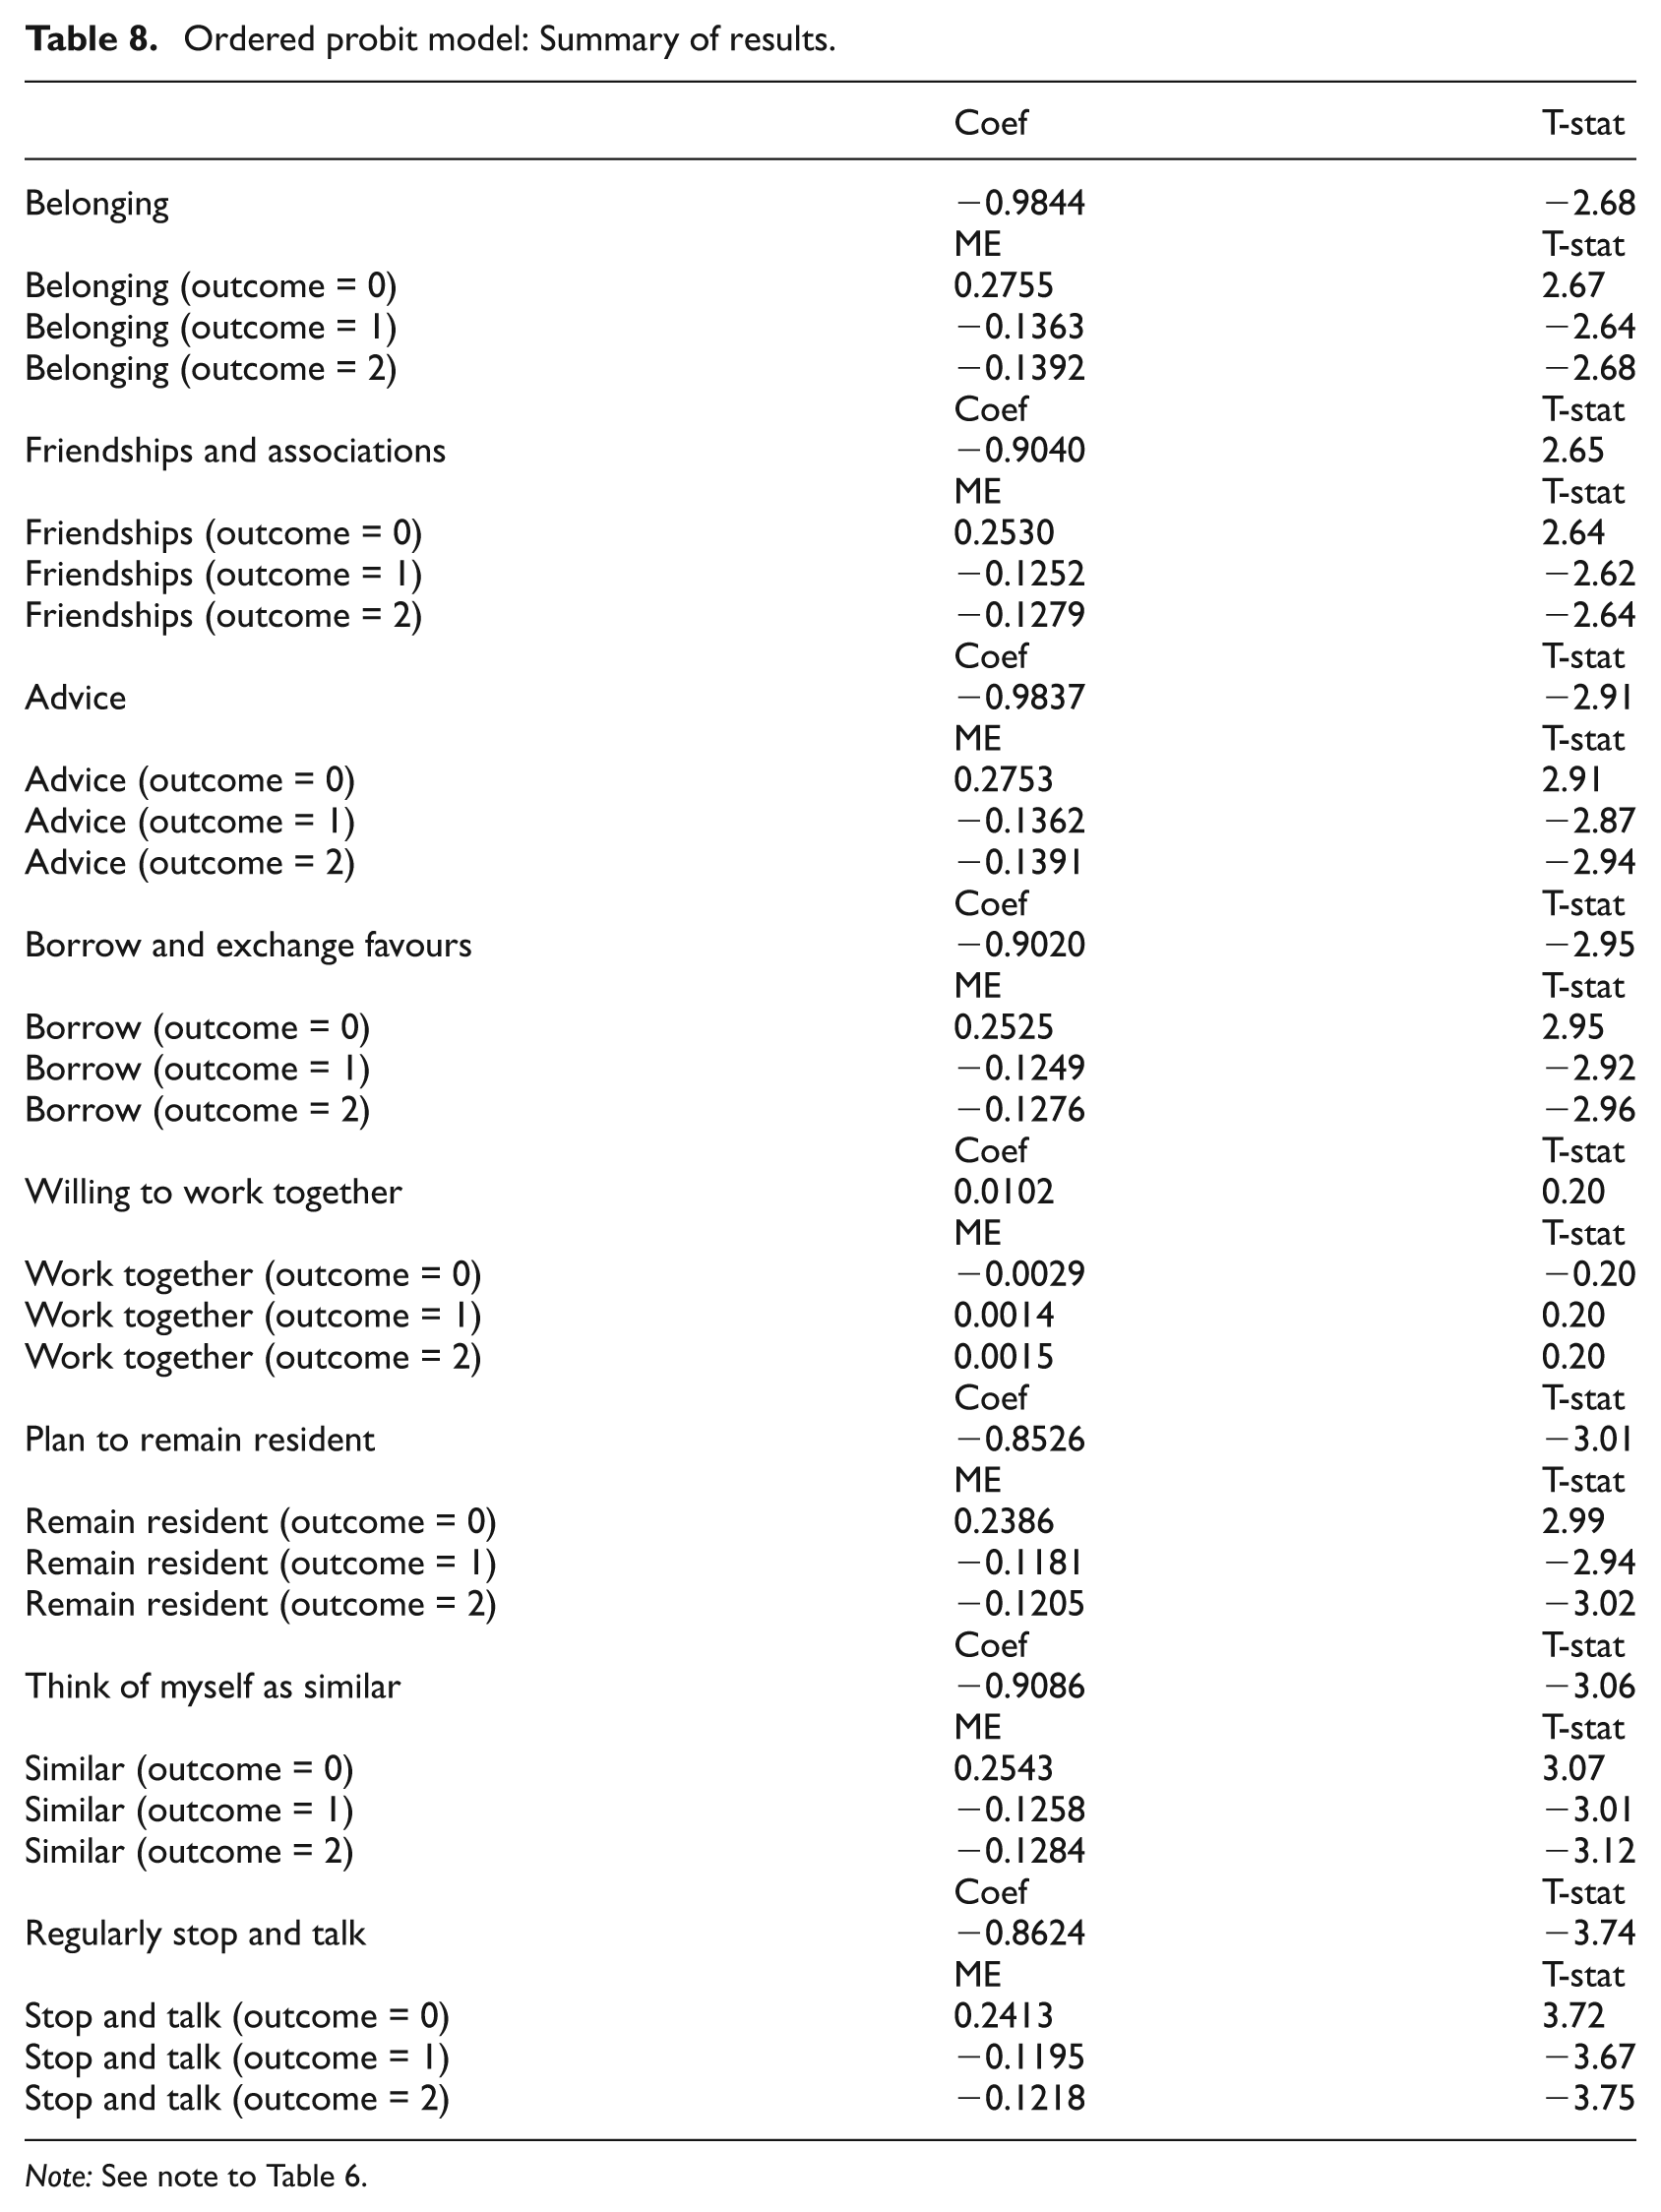
Note: See note to Table 6.
It is apparent that the dependent variable is characterised by a large proportion of zero observations, which suggests that an econometric approach suited to a zero inflated ordered dependent variable may be appropriate. In order to further explore the robustness of our findings, we employ the zero inflated ordered probit (ZIOP) approach of Harris and Zhao (2007), based on two latent equations: a splitting probit equation and an ordered probit equation. 13 The excessive number of zeros observed in the dependent variable may arise due to the existence of two types of zeros. Although we would expect a large proportion of the population to report not being in arrears at a particular point in time, it may be the case that due to the stigma associated with being behind with financial obligations, some households report not being in arrears when this is not the case. As noted above, Breunig and McKibbin (2011) highlight the embarrassment associated with admitting failure to pay bills. Furthermore, their analysis indicates the effects of survey design on the reporting of financial difficulty at the household level, with the self-completion questionnaire approach being associated with higher levels of reported financial difficulty than the face-to-face interview approach. Given that Understanding Society is administered as a face-to-face interview, we might therefore expect an excessive level of zeros in the information reported on arrears. Thus, concern regarding admitting to being in arrears may serve to inflate the number of zero observations recorded in the data.
In the inflation equation (i.e. the splitting equation), we include variables relating to the interview conditions, namely: the length of time taken to complete the household questionnaire. From the individual questionnaire, we elicit additional information relating to whether the interviewer thought the respondent was somewhat or very suspicious about the study after the interview was completed, an index of the interviewer’s observations regarding the respondent’s understanding of the questions ranging from excellent, good, fair to poor/very poor and an index of the interviewer’s observations about the respondent’s cooperation during the interview ranging from excellent, good, fair to poor/very poor. We also control for the head of household’s age, gender, marital status and highest level of educational attainment as well as the number of adults and children in the household. The controls in the ordered probit part of the model (i.e. the outcome equation) are as before. The results are summarised in Table 9, where we present estimated coefficients assuming independent error terms across the two parts of the model and where we assume the error terms are correlated (where the estimated correlation parameter is reported in Table 9). It is apparent from the summary of the findings that the pattern of the results follows that of Table 8, thereby endorsing the importance of neighbourhood effects for household repayment behaviour.
Zero inflated ordered probit models: Summary of results.

Note: See note to Table 6.
Conclusion
We have explored the relationship between household repayment behaviour and neighbourhood ties analysing a sample of households drawn from wave 1 of Understanding Society, based on information elicited between January 2009 and January 2011 therefore relating to the post financial crisis era. Our findings suggest that households residing in regions characterised by strong neighbourhood ties are less likely to report being in arrears. Our findings are particularly pronounced in the case of housing costs which may reflect the importance of keeping up to date with mortgage or rent payments for continuing to reside in a particular neighbourhood. Moreover, the estimated effects are generally large relative to those related to household and head of household characteristics, highlighting the importance of neighbourhood ties in influencing financial behaviour at the household level and the importance of allowing for such factors when forecasting arrears at the regional level. More accurate forecasting of repayment problems and being in arrears may serve to provide a more accurate regional picture of financial distress and vulnerability for policymakers to use in the design of regional policy.
Our findings may reflect concern over being regarded as exhibiting ‘socially unacceptable’ behaviour in regions characterised by a high density of strong neighbourhood ties. Additionally, in regions with strong neighbourhood ties, the informal provision of support and advice may serve to lower the likelihood of reporting arrears. Our findings are robust to a range of measures of neighbourhood ties covering many facets of such ties ranging from identifying with individuals living in the same neighbourhood to planning to remain living in the neighbourhood. In addition, we explore the robustness of our findings by employing different econometric modelling approaches and thereby lending further support for the role of neighbourhood effects in influencing household repayment behaviour.
The findings from our empirical analysis, thus, highlight the importance of considering the role of community and neighbourhood influences in financial behaviour and decision-making at the household level. With respect to practical implications, it is apparent that agencies operating at the community level such as the Citizens Advice Bureau or neighbourhood or community groups may play an effective role in enhancing neighbourhood ties and social interaction in areas where such ties are currently weak, which in turn may provide informal channels of support and/or financial advice to households facing repayment difficulties. Thus, our findings highlight possible channels of support for financially vulnerable households.
Footnotes
Acknowledgements
I am very grateful to two referees and the editor for constructive comments and excellent suggestions, and to Mark Harris, Arne Risa Hole, Jennifer Roberts and Karl Taylor for excellent advice. I am grateful for financial support from the Leverhulme Trust for the Major Research Fellowship 2011-007. Understanding Society is conducted by the Institute for Social and Economic Research at the University of Essex. Understanding Society was accessed via the UK Data Service and the National Grid Reference information was accessed via the Secure Data Service. Neither the original data creators, depositors or funders bear responsibility for the further analysis or interpretation of the data presented in this study. I am very grateful to the UK Data Service for supplying Understanding Society wave 1 and to the Secure Data Service for excellent support. The normal disclaimer applies.
Funding
This study was funded by the Leverhulme Trust Major Research Fellowship 2011-007.