
Abstract
Over the past 20 years, California has made substantial investments in intra-metropolitan passenger rail infrastructure, expanding existing systems and building new ones. According to advocates of New Urbanism, such investment should encourage the growth of mixed-use transit-oriented development, defined as a high-density mix of residential and commercial uses within walking distance of rail stations. Little research to date has examined whether rail investment stimulates retail activity, which is a key component of mixed-use development. In this paper, I test whether the opening of new rail stations across California’s four largest metropolitan areas is associated with changes in retail employment near the stations. Results indicate that new rail stations were located in areas with previously high employment density, somewhat outside the city centres. New station openings are not significantly associated with differences in retail employment in three of the four MSAs, and negatively associated with retail in the Sacramento MSA. There is weak evidence that areas around new suburban stations serving commuter rail lines are more likely to gain retail employment, while centrally located, intra-city rail stations see decreases in retail activity.
Introduction
According to advocates of ‘New Urbanism’, one goal of public investment in rail transit is to encourage mixed-use transit-oriented development, defined as a high-density mix of residential and commercial uses within walking distance of rail stations. In theory, by reducing transportation costs for residents in the surrounding neighbourhood, new transit stations should increase land values, spurring higher density development and higher-value uses (Transit Cooperative Research Program, 2004). Numerous studies have attempted to identify the impacts of rail transit systems on surrounding neighbourhoods in US metropolitan areas. Most test the relationship between rail stations and property values; results vary widely both across MSAs and across stations or neighbourhoods within an MSA (Bowes and Ihlanfeldt, 2001; Debrezion et al., 2007; Duncan, 2011; Hess and Almeida, 2007, Lin, 2002; Mathur and Ferrell, 2009). Analysis of other outcomes, such as transit ridership, population density, employment composition, urban form, and aggregate social welfare, reveal similarly heterogeneous results (Baum-Snow and Kahn, 2005; Bollinger and Ihlanfeldt, 1997; Ewing and Cervero, 2010; Giuliano and Agarwal, 2010; Kahn, 2007; Lund et al., 2004; Winston and Maheshri, 2007). However, no research has yet examined the impacts of rail investment on a key component of mixed-use development: retail activity. In this study, I contribute to a broader understanding of TOD by examining whether the development of new rail transit stations in four California metropolitan areas has increased retail employment near stations.
As a land use class, retail should be highly compatible with neighbourhoods surrounding rail stations: the increased pedestrian traffic generated by transit riders should increase retail business, whereas high traffic may be considered a negative amenity for residential development. Moreover, municipalities often give planning preference to commercial developments over residential ones because of the fiscal benefits generated by business taxes; this is particularly true in California, because Proposition 13 limits local revenues from property taxes (Gruen, 2010). Neighbourhood retail services, such as grocery stores, pharmacies and restaurants, have important quality of life implications for residents, such as the availability and price of healthy food (Hayes, 2000). Therefore, the extent to which rail investments improve the quantity or quality of neighbourhood retail services is potentially a valuable social benefit from public expenditures. This is particularly true for rail investments in low-income and minority neighbourhoods, which tend to have fewer retail and household service establishments, and where those that do exist offer inferior quality goods at higher prices (Alwitt and Donley, 1997; Bartie et al., 2007; Carr and Schuetz, 2001; Sloane et al., 2005). Moreover, because low-income households are less likely to own automobiles, they may face greater barriers to reaching commercial centres outside their immediate neighbourhoods.
This study examines how rail transit expansions in California’s four largest metropolitan areas – Los Angeles, Sacramento, San Diego and San Francisco–San Jose – have affected the quantity of retail in surrounding neighbourhoods. As shown in Table 1, the number of rail stations in these regions has nearly doubled over the past 20 years, through expanding existing rail systems and developing new ones. The stations vary considerably in their locations, physical characteristics, type of rail system, and neighbourhood economic and demographic characteristics, both within and across MSAs, offering the chance to investigate how station heterogeneity affects retail growth. Only a few prior studies have incorporated detailed information on station or neighbourhood traits, such as street density, parking availability and topography (Bowes and Ihlanfeldt, 2001; Duncan, 2011).
Fixed-line transit systems in California.
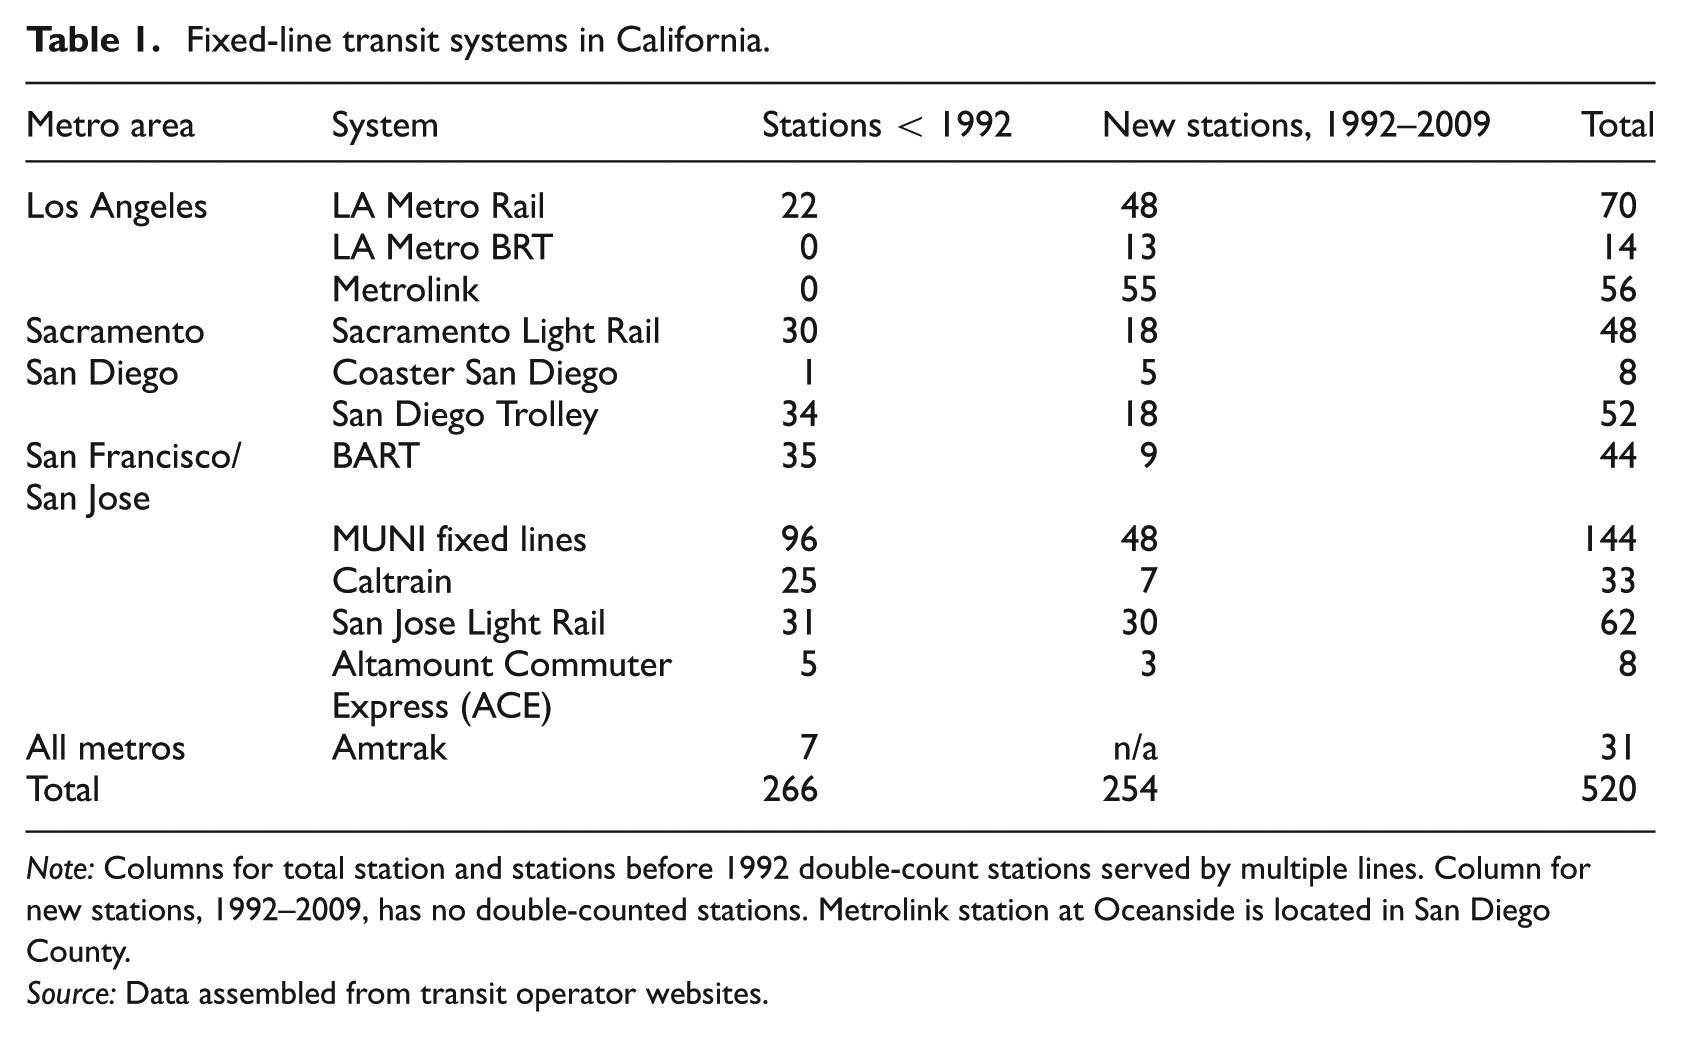
Note: Columns for total station and stations before 1992 double-count stations served by multiple lines. Column for new stations, 1992–2009, has no double-counted stations. Metrolink station at Oceanside is located in San Diego County.
Source: Data assembled from transit operator websites.
The urban economics literature provides several models of retail firm location that provide a theoretical framework for why public transportation should affect the amount and composition of local retail outlets. The addition of a new rail station to a neighbourhood decreases transportation costs between neighbourhoods that are connected by the rail line, thus expanding the market area – and number of potential consumers – for stores at each station. If rail stations attract additional riders to the neighbourhood, either residents who move to the area or commuters who work nearby, the station will effectively increase the buyer density in the neighbourhood, and so should lead to an increase in the number of retail establishments and employees (Berry, 1967; Stern, 1972). A larger consumer base may also encourage product differentiation, leading to greater diversity of store types by goods and services offered (Fischer and Harrington, 1996). Previous empirical studies on the impacts of rail stops on other outcomes, such as property values, population and employment, have shown that the extent of impacts depend crucially on increases in ridership (Baum-Snow and Kahn, 2005; Bollinger and Ihlanfeldt, 1997; Brown et al., 2013; Kahn, 2007). Therefore whether rail stations increase the quantity (or quality) of surrounding retail will depend on the number of transit users at that location. Moreover, an increase in retail establishments near a newly built train stop could represent either a net increase in retail activity through new store creation or redistribution from other, less accessible sites, as stores relocate closer to the rail station.
This paper examines changes in retail employment around more than 500 rail stations in California, using geocoded data on retail establishments from the National Establishment Time Series (NETS) database. To begin, I examine neighbourhood characteristics for the one-quarter mile areas around rail stations. I compare new station neighbourhoods to two control groups: older station areas and census tracts that are more than one-half mile away from rail stations but within three miles of at least one station. Then I test whether new station opening is associated with changes in retail employment immediately around the stations, relative to the control tracts and older station areas. This study makes several contributions to the prior literature on TOD. First, I focus on an economic outcome that has been hypothesised as a benefit of TOD but which has not previously been analysed. Second, by using longitudinal data that span growth in transit systems, I can test for changes after new stations open while controlling for pre-existing neighbourhood differences. Third, by using consistent data and methods for four large metropolitan areas, I allow for comparisons across different cities and station types.
Results indicate that new rail stations were located in areas with previously high employment density, somewhat outside the city centres, with relatively low household incomes. The relationship between new station opening and nearby retail activity varies across and within metropolitan areas. Across all cities and neighbourhoods, new station openings are not associated with a significant difference in retail employment. In Sacramento, the estimated effect is significant but negative; retail employment is lower after new station opening. In Los Angeles and San Francisco, the effect is negative but not statistically significant, while in San Diego the effect is positive but insignificant. Stations within five miles of the CBD have high previous retail employment densities, but new station openings are weakly negatively associated with retail employment. New commuter rail stations are positively associated with retail employment, although starting from a low baseline. The differences in growth of nearby retail may reflect unobserved variables, such as difference in transit ridership or different valuation of transit access across neighbourhoods.
The remainder of this paper is organised as follows. The first section provides background on rail systems in the four MSAs and discusses how station characteristics might affect retail growth. The next section describes the data and empirical methods, followed by a presentation of the results of descriptive statistics, while the final section discusses policy implications and concludes.
California rail systems
This paper focuses on fixed-route transit systems in California’s four largest metropolitan areas: Los Angeles–Long Beach, Sacramento, San Diego, and San Francisco–San Jose. In 2009, 520 stations belonging to 11 fixed-route transit systems operated in these MSAs. The majority serve light rail lines, with a few heavy rail lines (BART, Caltrain, and the LA Metro Red and Purple lines) and one bus rapid transit (BRT) system (the MTA’s Orange Line). 1 This section describes rail systems’ growth during the 1992–2009 study period, and discusses how station and rail system characteristics might affect surrounding development patterns.
Data assembly
Transit station locations and characteristics were assembled from transit operator websites. Station names and locations were collected from system maps, along with indicators for all systems and lines using each station. Addresses were geocoded to obtain latitude and longitude coordinates and match stations with census tracts. Information on the initial year of rail service at each station was obtained from transit operator websites and supplemental sources, including Amtrak’s Great American Stations website and contemporaneous media coverage. 2
Expansion of California rail systems
Most of California’s metropolitan areas are relative newcomers to rail transit systems, compared to East Coast cities: San Francisco is the only California city among the seven ‘legacy’ MSAs with rail transit in 1970 (Baum-Snow and Kahn, 2005). But all four of the state’s largest MSAs had some rail stations by 1990, and nearly all of the transit systems expanded between 1992 and 2009 (Table 1).
The new stations represent various types of growth. LA’s Metropolitan Transit Authority (MTA) built new subways, light rails, and a new BRT line. Most of these stations connect neighbourhoods within the City of Los Angeles, but two lines extend to the nearby cities of Long Beach and Pasadena. The other main rail system in the LA region is the Metrolink commuter rail system, operated by the Southern California Regional Rail Authority. The entire Metrolink system was developed between 1992 and 1995, and serves all five counties in the LA CMSA (Los Angeles, Orange, Riverside, San Bernardino, and Ventura). The Sacramento Regional Transit District operates a light rail system, begun in 1987 and expanded during the study period. San Diego’s Metropolitan Transit System operates three light rail lines under the San Diego Trolley; two lines were built in the 1980s, the third was added in 1990 and expanded throughout the study period. The San Diego region is also served by the North County Transit District’s Coaster commuter rail, built in 1995.
The San Francisco–San Jose MSA has the oldest and most extensive transit network in California. The San Francisco Municipal Railway System, or MUNI, is a system of buses, trolleys and cable cars, some of which have operated along the same routes for nearly a century, but with expansions continuing through the 1990s and 2000s. MUNI stops are only located within the City of San Francisco. The Bay Area Rapid Transit (BART) is a heavy rail system running throughout the region, including the East Bay cities of Oakland and Berkeley; the earliest BART stations were built in the 1970s, within expansions continuing to current years. In the San Jose area, the Santa Clara Valley Transportation Authority operates three light rail lines, primarily in the City of San Jose, but extending to several other cities in Santa Clara and San Mateo Counties. These stations opened between 1987 and 2005. A regional commuter rail, Caltrain, runs through the spine of the Bay Area, from San Francisco to San Jose and extending south to Gilroy. Most Caltrain stations were opened before 1992, with a few later expansions. The newest and smallest rail system in the Bay Area is the Altamount Commuter Express, which began operating in 1998, from San Jose north to Fremont and extending east to Stockton. 3
Compared to US metropolitan areas on the East Coast, or many older cities in other countries, rail transit forms a relatively small share of commuting in California. In the San Francisco–San Jose MSA, around 5% of all commuters use rail transit, compared to about 0.5% of commuters in the study’s other metropolitan areas. Perhaps reflecting the relative age and density of rail networks, the dominance of rail within public transit varies considerably across and within MSAs. Roughly 31% of transit riders in the City of San Francisco commute by rail. By contrast, only 6% of transit riders in the City of Los Angeles use rail transit. 4
The location and characteristics of stations varies across MSAs and across rail systems within MSAs (Table 2). Although most current passenger rail services have operated for a relatively short time (column 1), some transit systems use stations and track infrastructure built as part of earlier passenger or freight rail systems (column 2). 5 Many of these stations were built prior to 1940 as part of inter-city passenger rail services, most notably belonging to the historic Atchison, Topeka and Santa Fe Railway. 6 MUNI and the San Jose and Sacramento light rail systems are quite dense, with the average station less than one mile from its three nearest stations, while stations in the commuter rail systems of BART, Caltrain and Metrolink are quite widely spaced (column 3). 7 Not surprisingly, stations serving the intra-city rail systems (especially MUNI, San Jose rail, Sacramento rail and MTA rail) are located, on average, closer to their cities’ Central Business Districts than the commuter rail systems (column 4). Availability of parking lots or garages designated for transit riders also varies by rail system: none of the MUNI stations have parking, about 35–45% of stations serving other intra-city systems have parking, while more than 80% of stations on commuter rail systems have designated parking, some with several thousand spaces. The last three columns in Table 2 indicate the predominant land use category in areas around the station, as of 1992. 8 Across all MSAs, 42% of stations were built in commercial areas, in which employment was composed mostly of activities such as finance and insurance, professional services, retail, and food service. About 30% of stations were located in areas dominated by industrial uses, such as manufacturing, transportation and warehousing; this may reflect the tendency for new stations to be opened along existing freight lines. The same percentage of stations were located near institutional uses, such as public administration, education, and health care.
Mean Station characteristics, by MSA and rail system.
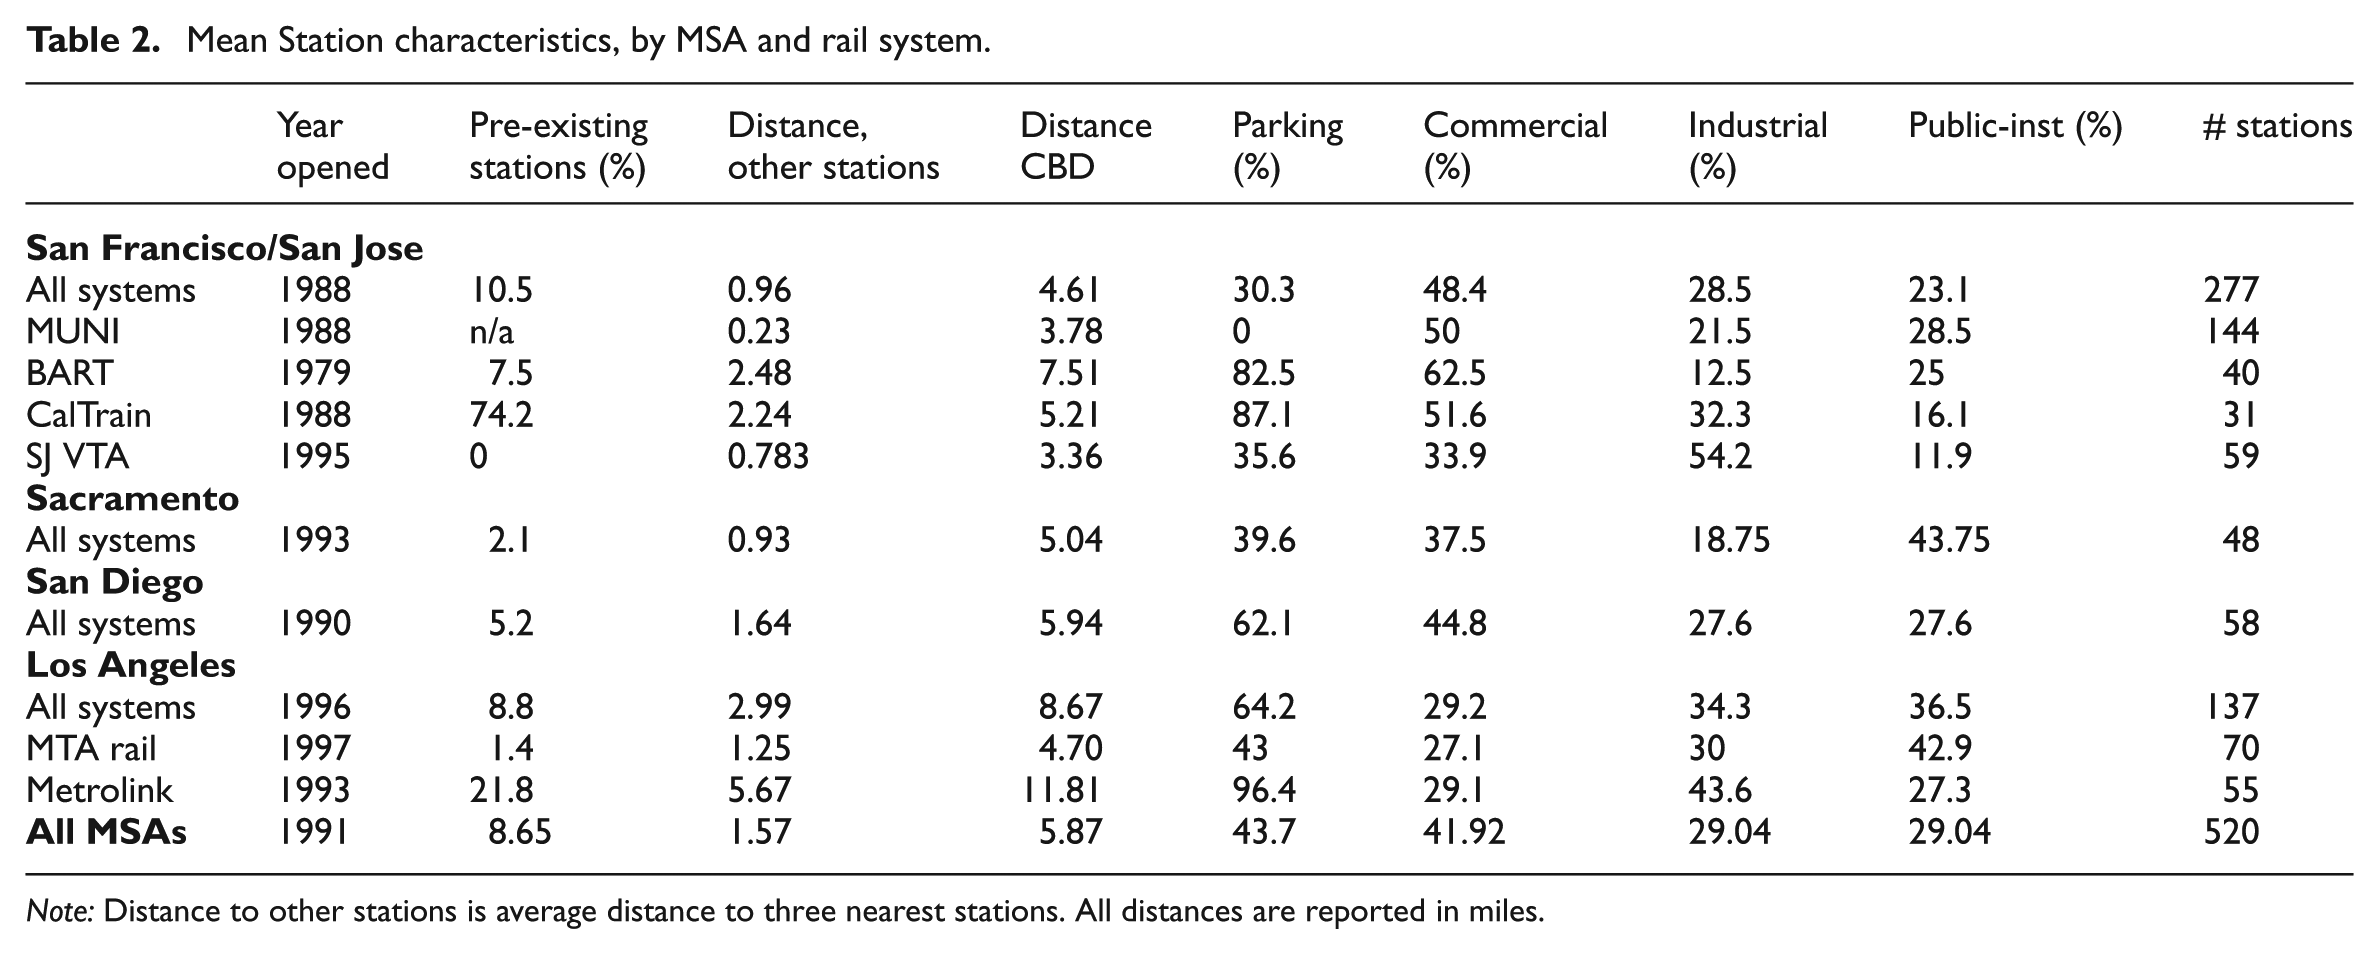
Note: Distance to other stations is average distance to three nearest stations. All distances are reported in miles.
Could station characteristics impact nearby retail development?
The variation in station characteristics may plausibly impact nearby economic activity, directly through physical context and indirectly through differences in transit ridership (Duncan, 2011; Voith, 2005). Broadly speaking, the type of station attributes that may affect retail growth can be grouped into four categories: station physical characteristics, neighbourhood physical characteristics, neighbourhood economic and demographic characteristics, and neighbourhood regulatory and political environment.
Comparing two stations along Metrolink’s Orange County Line illustrates how station and neighbourhood physical conditions might impact nearby development. The Fullerton station, developed in 1923 by the Union Pacific Railroad, is built in decorative Spanish Colonial style. It links to the surrounding street grid in a dense commercial area near the city’s downtown. The Laguna Niguel/Mission Viejo station has only a boarding platform, surrounded by large surface parking lots, lying between two major freeways. While the Fullerton station could easily be incorporated into a New Urbanist-style, pedestrian-friendly transit oriented development, such development would be difficult, if not impossible, at the Laguna Niguel station. More generally, station and neighbourhood physical features offer different opportunities for nearby development. Most light rail stations and tracks lie above ground, creating a break in the street grid, relative to underground subway systems. Like the Laguna Niguel stop, many stations along commuter rail lines are surrounded by large surface parking lots for park-and-ride passengers; parking lots or garages form a physical barrier between transit riders and nearby economic activity. Several rail lines, such as the MTA Green Line, run down the median of freeways, again forming a barrier to contiguous development.
A priori, it is unclear whether new stations built in older, denser neighbourhoods should experience more retail growth than stations built in low-density, undeveloped areas. On the one hand, neighbourhoods that already have high density residential or commercial uses have existing infrastructure and may provide a critical mass of consumers (Brooks and Lutz, 2014 highlight the persistence of development patterns around Los Angeles streetcar lines). On the other hand, older neighbourhoods tend to have fragmented land ownership and few vacant parcels, requiring costly land assembly and redevelopment for large-scale projects.
The reuse of existing and historic stations has several potentially important implications for retail growth subsequent to station re-opening. First, the locations of these stations were not selected based on current economic conditions; they may not be in optimal locations relative to current population and employment centres. Second, the built environment surrounding older stations is more likely to be already developed than the surroundings of greenfield stations, which may make these areas more costly to adapt (although older stations may have higher density of retail prior to station opening, as a legacy of the existing development patterns). Third, for architecturally or historically important stations, historic preservation mechanisms may hinder nearby redevelopment (a number of the older stations are listed on the National Registry of Historic Places).
In general, we would expect economic and demographic characteristics to affect the likelihood of retail growth around a station. Households with more disposable income or wealth represent desirable consumers for retailers. Previous research has shown that some population characteristics, such as share of college-educated population, share of households with children, and share of owner-occupied homes, are negatively correlated with retail activity, potentially because these households prefer exclusively residential neighbourhoods (Schuetz et al., 2012; Waldfogel, 2008). Higher income households are also more likely to own cars, and may not view rail transit as an important amenity.
Two station attributes which I cannot directly observe are likely to affect the prospects for retail growth around new stations. First, the regulatory and political environment will affect the potential not only for retail, but for any type of transit-oriented development. If a new station opens in an area not zoned for commercial activity, or zoned for low density development, then little retail growth is likely to follow. Specifically, while retail activity should be compatible with other commercial uses – and new retail establishments should face few regulatory barriers to entry in those areas – areas previously occupied by industrial uses may be a more challenging environment for retailers, possibly requiring zoning changes or environmental remediation. Buildings occupied by public agencies, schools, and other institutions may not permit nearby retail activity. Conversely, local officials may offer incentives for projects near transit, relative to other locations; such incentives may include density bonuses in designated areas, reduced permitting fees or fast-tracking of development approvals. If developments near stations receive preferential treatment, it is unclear whether TOD projects represent a net increase in jobs or displacement from other locations. It is not feasible to assemble data on zoning around the 520 stations, so I rely on proxies such as non-retail employment density and primary land use prior to station opening to infer zoning constraints.
Second, stations with higher ridership (meaning more potential consumers) should be more attractive to retailers. Time-varying ridership data per station are not available. My closest proxies are the number of lines serving each station and the density of nearby stations; rail transit will be a more desirable mode of transportation at stations that are part of a denser network, offering access to more destinations.
Methodology and data description
This paper seeks to determine whether expanded rail transportation has improved access to retail services by increasing the amount of retail activity in neighbourhoods surrounding new rail stations. The empirical strategy is a modified difference-in-difference approach, which compares retail employment density near newly opening transit stations, before and after the stations open, to retail employment for two sets of control neighbourhoods. Most potential riders will come from a one-quarter mile radius of the station, with impacts declining rapidly beyond that (see Kolko, 2011), so the primary treatment area is defined as one-quarter mile radius of each newly opening station. 9 Stations that opened prior to 1992, and thus were in operation during the entire study period (1992–2009), form one set of control areas. The second set of control areas are census tracts outside a half-mile boundary of any transit station (new or existing), which should not be directly affected by stations, but within a three mile radius of at least one station, and within the same PUMA as another station. Limiting control areas to a three-mile radius and the same PUMA yields comparison groups that have somewhat similar demographic and economic characteristics to the treatment areas, as well as similar proximity to amenities (parks, school districts, etc.). 10 Figure 1 shows the quarter mile boundaries for areas around transit stations in Downtown Los Angeles, as well as the control tracts that fall outside the larger half-mile boundary.
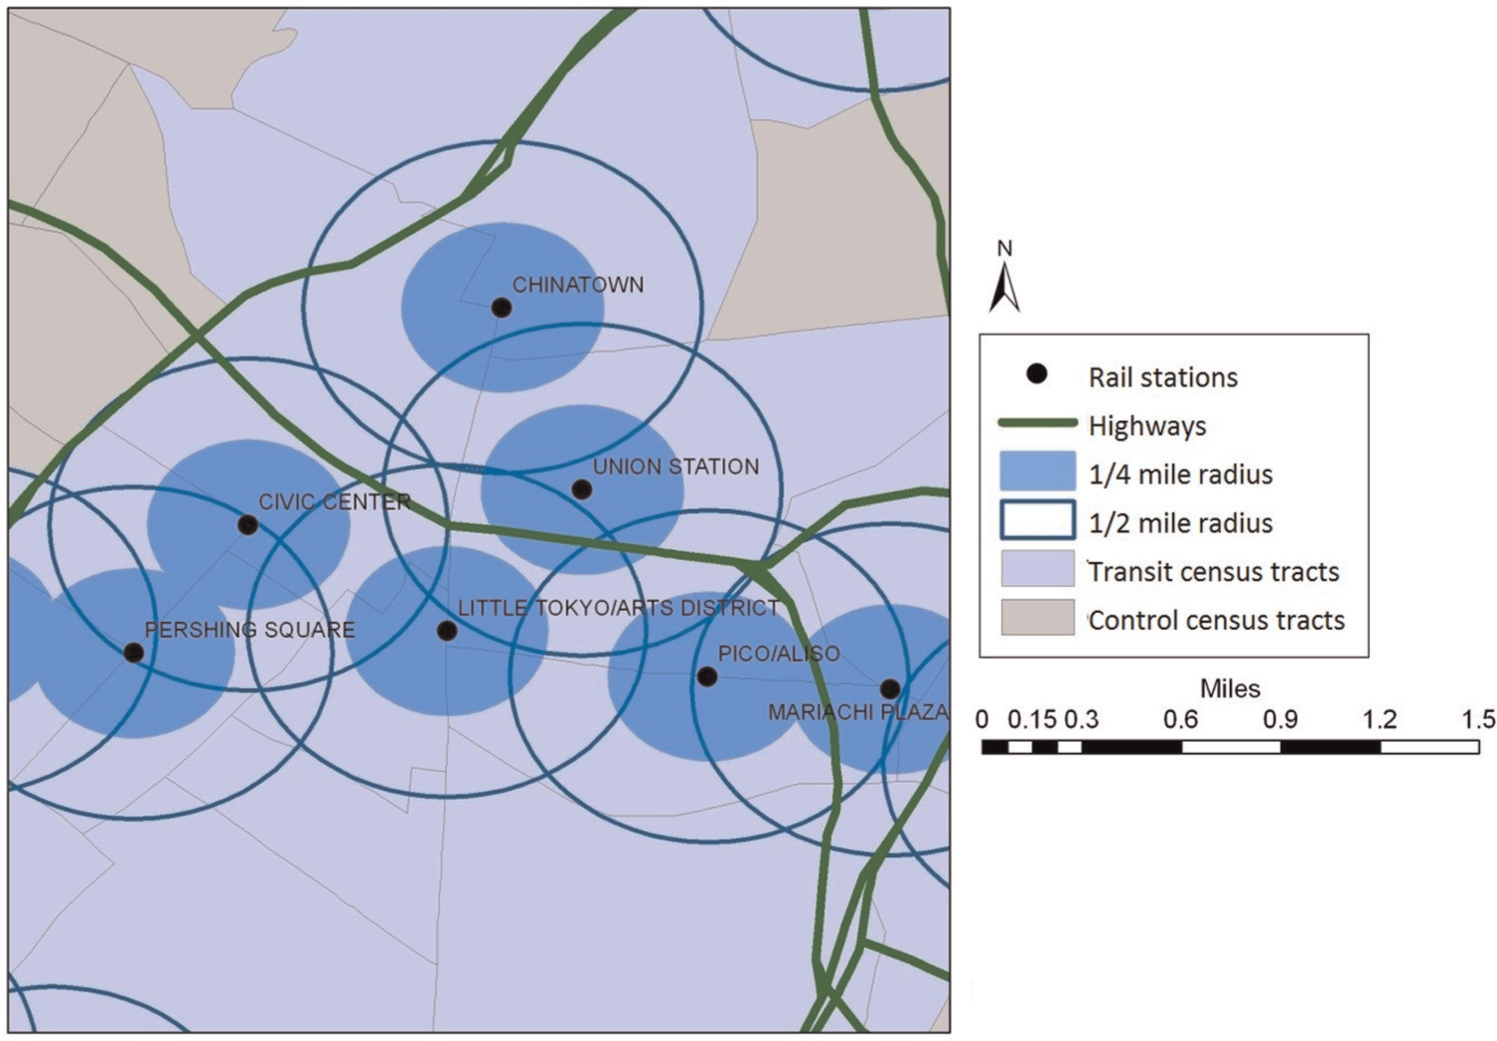
Treatment areas around transit stations, Downtown Los Angeles.
The general form of the difference-in-difference regression is shown below:
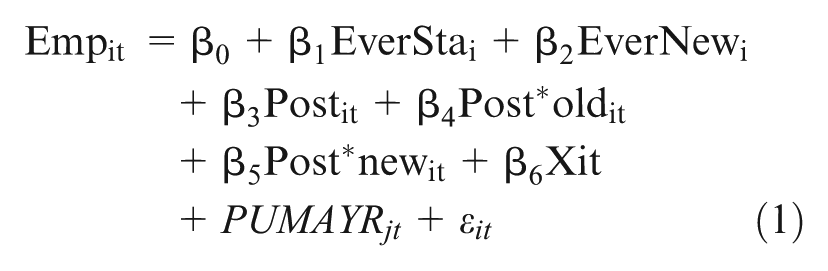
where i indexes the neighbourhood and t indexes the year. The dependent variable, Emp, is the number of retail employees per square mile in the subject neighbourhood. EverSta is a dummy variable indicating whether a station ever exists in the neighbourhood; EverNew indicates the presence of a station that opens after 1992. These variables are constant within neighbourhoods over time, so the coefficients are interpreted as time-invariant differences in retail employment between three types of neighbourhoods (old or new station areas relative to control tracts). Post indicates the time period following a new station opening. For post-1992 stations, this variable switches from zero to one in the year the station opens. For pre-1992 stations and control areas, the Post period is determined by the opening year of the nearest new station. Post*old and Post*new are interactions between the Post time dummy and old or new station status. Thus the coefficient on Post indicates differences in retail employment in control areas, after a nearby new station opens. This tests whether new stations affect retail activity in control areas, for instance by displacing retail from control to treatment neighbourhoods. Similarly, the coefficient on Post*old indicates differences in retail employment around older stations after nearby new stations open; for instance, it is possible that adding new stations to the network increases the advantage to retailers of locating near older stations. The coefficient on Post*new indicates differences in retail employment around new stations after the stations are operational, relative to control tracts and older stations during the same time period. Post*new is the coefficient of most interest in determining whether new stations attract retail employment. 11 X is a vector of control variables, such as non-retail employment density, population density and distance to CBD. PUMAYR are a set of PUMA-year fixed effects, to control for unobserved attributes of local labour and real estate markets that may affect retail employment, such as school quality or proximity to large institutional employers. These larger neighbourhood fixed effects are allowed to vary by PUMA over time.
Data on retail employment densities and non-retail employment are calculated using the National Establishment Time Series (NETS) database for California, 1992–2009. This dataset contains the business name, geocoded address, NAICS industry code and total employment. Using GIS, I select all retail and food service establishments (NAICS 44–45 and NAICS 722) within one-quarter mile area of sites where stations exist at any time during the study period, as well as in control tracts. NAICS codes for all establishments are used to categorise the primary economic activity in each station area and control tract: commercial, industrial, public-institutional, or undeveloped. 12 None of the station areas and very few of the control tracts are in undeveloped areas. The other industry categories serve as proxies for the type of building stock and land use regulation likely to be prevalent in each neighbourhood, indicating the relative demand for and ease of developing retail activities.
A key question of interest is whether the effects of new rail stations vary by prior demographic, economic or physical characteristics of the neighbourhood. As Redfearn (2009) points out, estimating average effects across all transit stations may obscure substantial differences in localised impacts. Duncan (2011) finds that proximity to San Diego trolley stations increases property values more in pedestrian-friendly neighbourhoods. Hess and Almeida (2007) find that in Buffalo, rail stations positively affect property values in high-income areas but have negative impacts in low-income neighbourhoods. Anecdotal evidence from Los Angeles suggests that development patterns around new transit lines have varied considerably: new residential and commercial activity has occurred around Metro’s Gold Line in Pasadena and the Red Line stations in Hollywood, while very little development has occurred around the Blue Line stations in South LA. To test whether baseline characteristics influence the trajectory of retail around new stations, the basic estimates from Equation 1 are estimated for several sample stratifications: by MSA, within-MSA location, rail system type, parking availability and initial land use. 13 Within-MSA location is defined by proximity to the Central Business District (within or outside five miles). Rail systems are classified as either intra-city (connecting neighbourhoods within one city) or commuter rail (linking suburbs to the CBD). Intra-city rail systems are the Los Angeles MTA rail and BRT, Sacramento light rail, San Diego Trolley, San Francisco MUNI, and San Jose light rail. Commuter rail systems are Southern California Metrolink, San Diego Coaster, and in the Bay Area BART, Caltrain, and ACE. 14
Data on population characteristics are taken from the 1990 and 2000 census and the 2005–2009 American Community Survey. Because station areas are defined as the one-quarter mile circle surrounding stations, they do not align with census tract boundaries. GIS tools were used to calculate the amount of land from each census tract that falls within the one-quarter mile treatment area for each station. Census variables for each tract are weighted by land shares to calculate average characteristics for each treatment area. Variables include population density, median household income, share of housing units built before 1940, and ethnic composition. Variable definitions and sources are shown in Table 3; summary statistics are shown in Appendix Table A.
Variable definitions and sources.
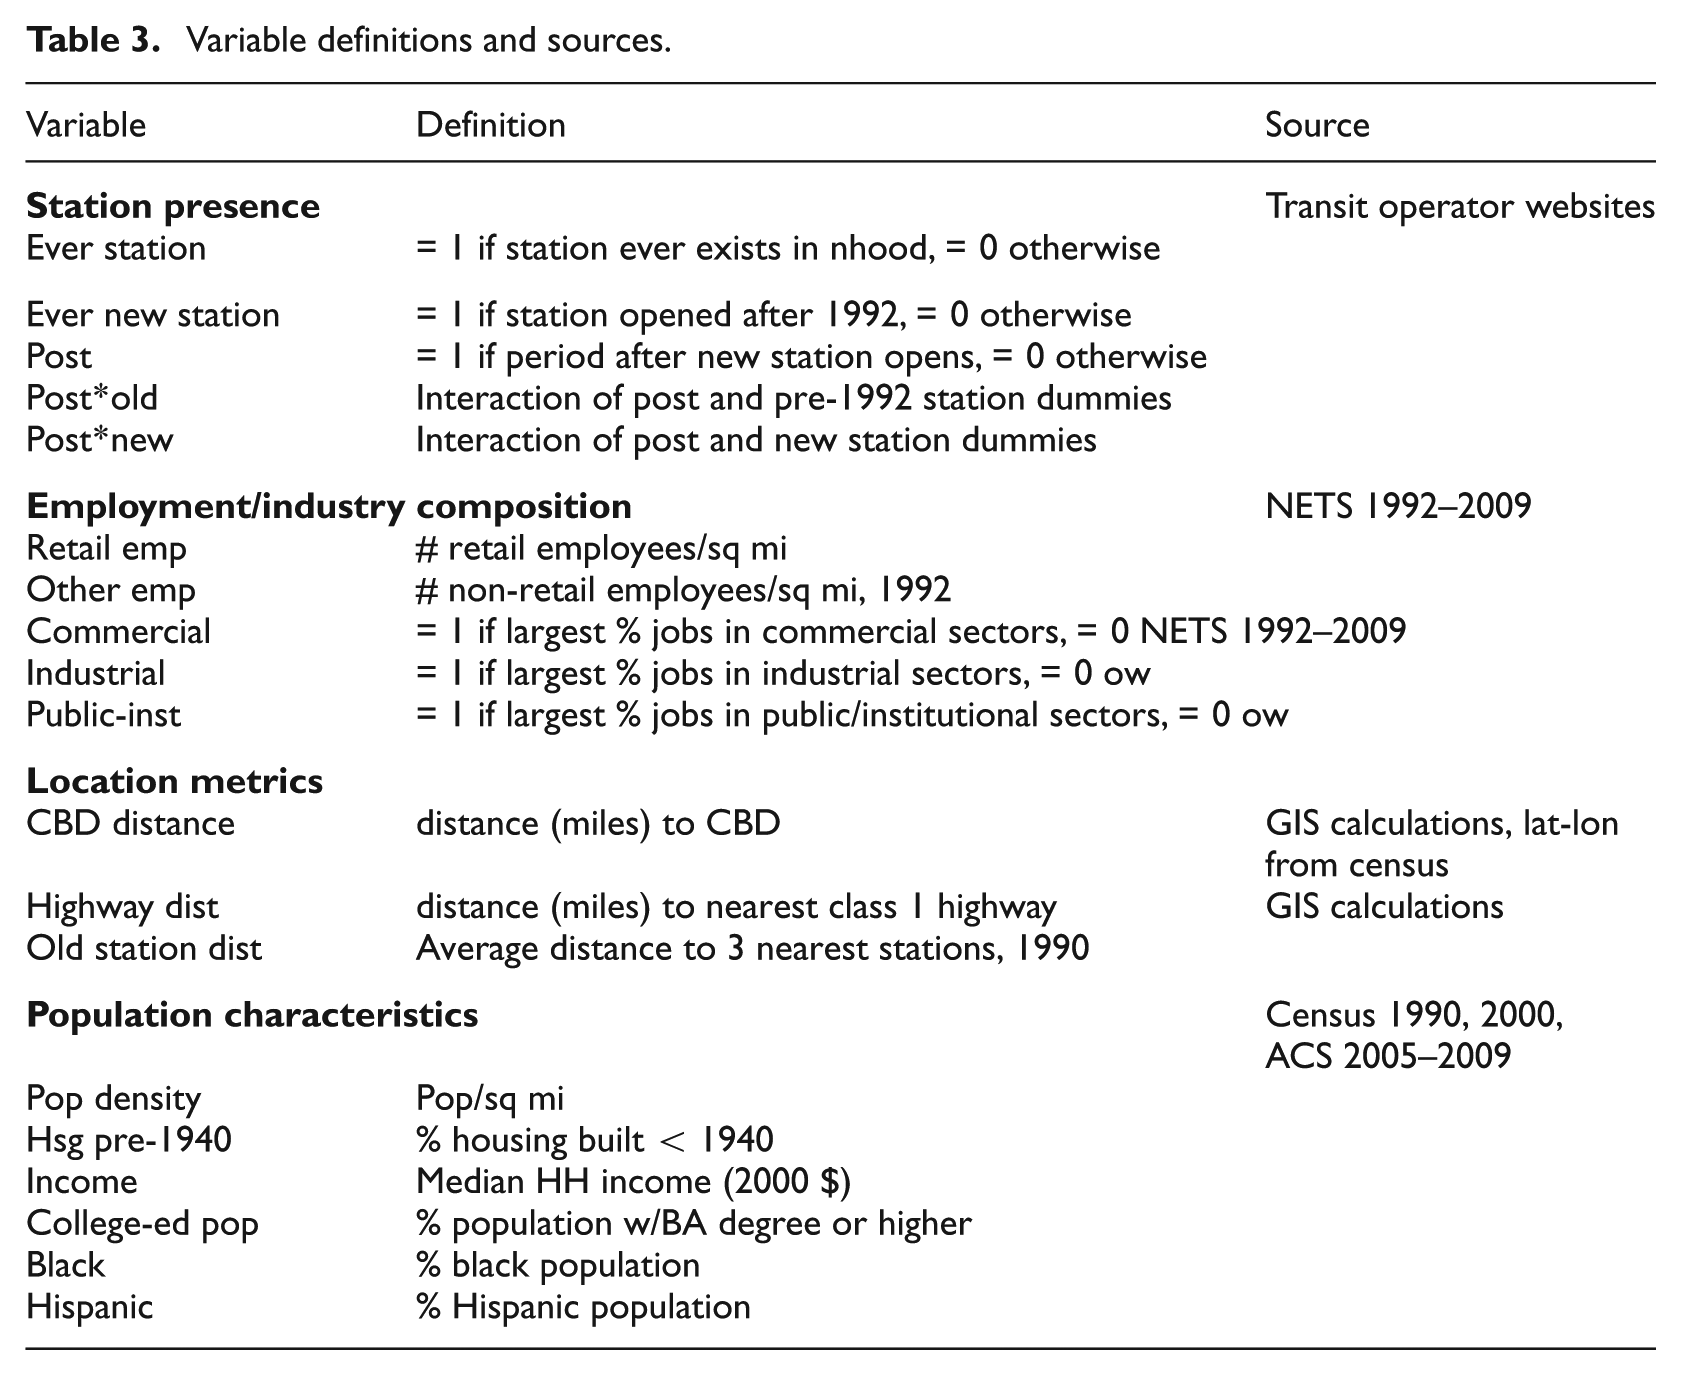
Several geographic variables are also included in the analysis. Distance from each station and from the centroid of each control tract to the nearest Central Business District are calculated using latitude and longitude coordinates. The CBD is defined as the census tract with the highest total employment density, using the NETS data. One CBD is identified for each of the designated central cities within the MSA, using 2000 OMB definitions. Standard urban economics suggest that property values and employment densities will decrease with greater distance from the CBD (Alonso, 1964; Mills, 1972; Muth, 1969). Proximity of stations and control tracts to major highways are also calculated using GIS. The analysis also includes a measure of station density, specifically the average distance of each station to its three nearest neighbour stations. Higher distances to nearby stations indicate lower network density.
One potential concern with identifying the effects of new rail stations on retail activity is that transit investments may occur simultaneously with changes in local land use or fiscal policy, designed to enhance the use of transit (for instance, an increase in allowable density of development or reduced tax rates). Unfortunately, collecting systematic data on those policies for all neighbourhoods that receive train stations, and comparing them with similar policies for neighbourhoods that do not receive rail stops, is not feasible, but this is an important area for future research.
Empirical results
Where are stations located?
As shown in Table 2, the location and characteristics of new stations with respect to other stations and the CBD varies across MSA and across systems within MSAs. San Francisco has the oldest transit network of the four MSAs (average year open 1988) and among the highest station density (mean distance to other stations less than one mile), while LA’s network is the most recent (mean year open 1996) and the least dense (nearly three miles between stations). The San Francisco–San Jose region has the largest number of stations and the greatest number of separate transit systems, with MUNI making up more than half the region’s stations. LA’s stations are shared between the intra-city MTA rail and the inter-city Metrolink commuter rail. Most of San Diego’s stations belong to the intra-city San Diego Trolley, although the suburban Coaster system has been expanding. Figure 1 illustrates the density of stations in Downtown Los Angeles; seven MTA rail stations exist within one mile of at least one other station. Indeed for several stations, there are overlaps in the quarter-mile radius of the station, which is expected to draw the most riders and should see the greatest development impact.
Table 4 compares the physical, economic and demographic characteristics of new station areas to old station areas and control tracts. Columns 1–3 show the mean and standard deviation for several key characteristics, while columns 4–6 present differences between the three neighbourhood groups. Several differences are particularly notable. New station areas had much higher initial overall employment density than control tracts, and were in fact comparable to older station areas in baseline employment density. One possibility is that transportation planners believed that locating new stations in employment centres would maximise ridership, by serving an existing base of consumers. It may also have been easier to gain neighbourhood acceptance for stations in heavily commercial areas; Goetz (2013) suggests that the support of the business community can be crucial in implementing successful transit projects. However, the 1990 population density of new station areas was lower than that of both older station areas and control tracts. Both newer stations and control tracts are farther from the CBD than older stations. And the median household income of neighbourhoods around both old and new stations was significantly lower than control tracts. Lower-income households are less likely to own cars, so may be more likely to benefit from access to rail transit. Alternatively, higher income households may have greater political influence to block unwanted new development.
Neighbourhood characteristics of station areas (1992/1990).
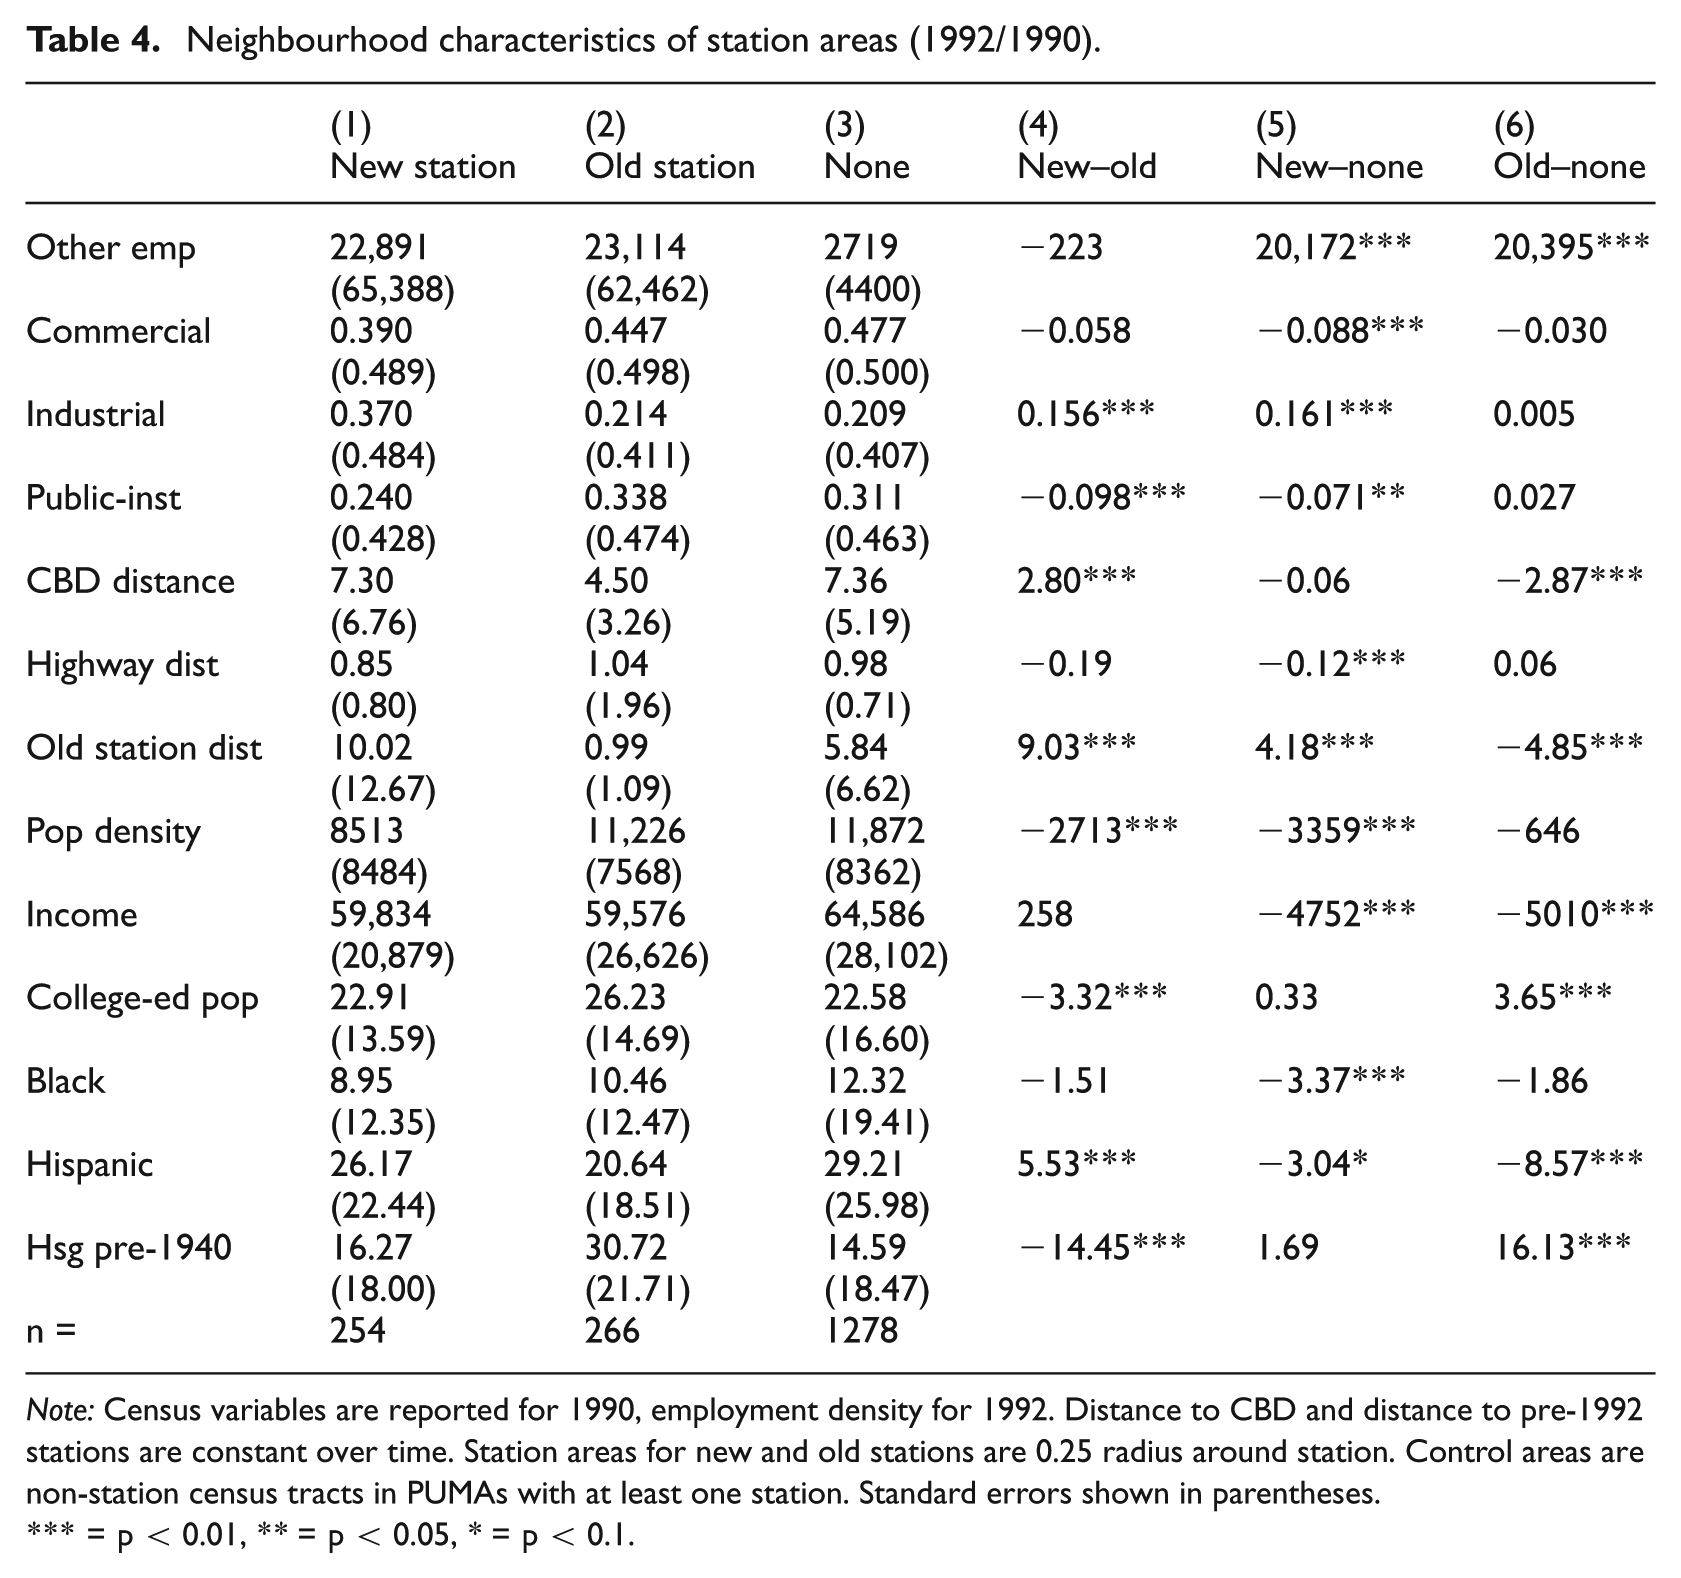
Note: Census variables are reported for 1990, employment density for 1992. Distance to CBD and distance to pre-1992 stations are constant over time. Station areas for new and old stations are 0.25 radius around station. Control areas are non-station census tracts in PUMAs with at least one station. Standard errors shown in parentheses.
= p < 0.01, ** = p < 0.05, * = p < 0.1.
Overall, the comparison of new station areas to older stations and control tracts confirms that station placement was not exogenous. New stations were placed in highly dense commercial areas somewhat outside the city centre, with relatively low population densities and low incomes – areas that should have the potential to accommodate, and could benefit from, additional commercial activity.
Is retail employment higher after new stations open?
To determine whether the opening of new stations is associated with a change in nearby retail employment, I first present differences in means of employment density, before and after stations open, then estimate difference-in-difference regressions for the full sample and stratified by several characteristics of neighbourhoods and rail systems.
Table 5 compares average retail employment densities across the three neighbourhood groups, as well as pre- and post-station densities for new station areas. The first section of the table presents results for all metropolitan areas combined. Average retail employment density is higher in old and new station areas than in control tracts: 653 employees per square mile in control tracts, compared to 2268 near older stations and 2439 near new stations. Moreover, retail employment density in the areas about new stations appears to increase in years after the stations opened, rising from 2066 employees per square mile to 2668. But this average change for all new station neighbourhoods conceals large differences across MSAs, as shown in the lower four sections of Table 5.
Retail employment density, by presence of station (1992–2009).
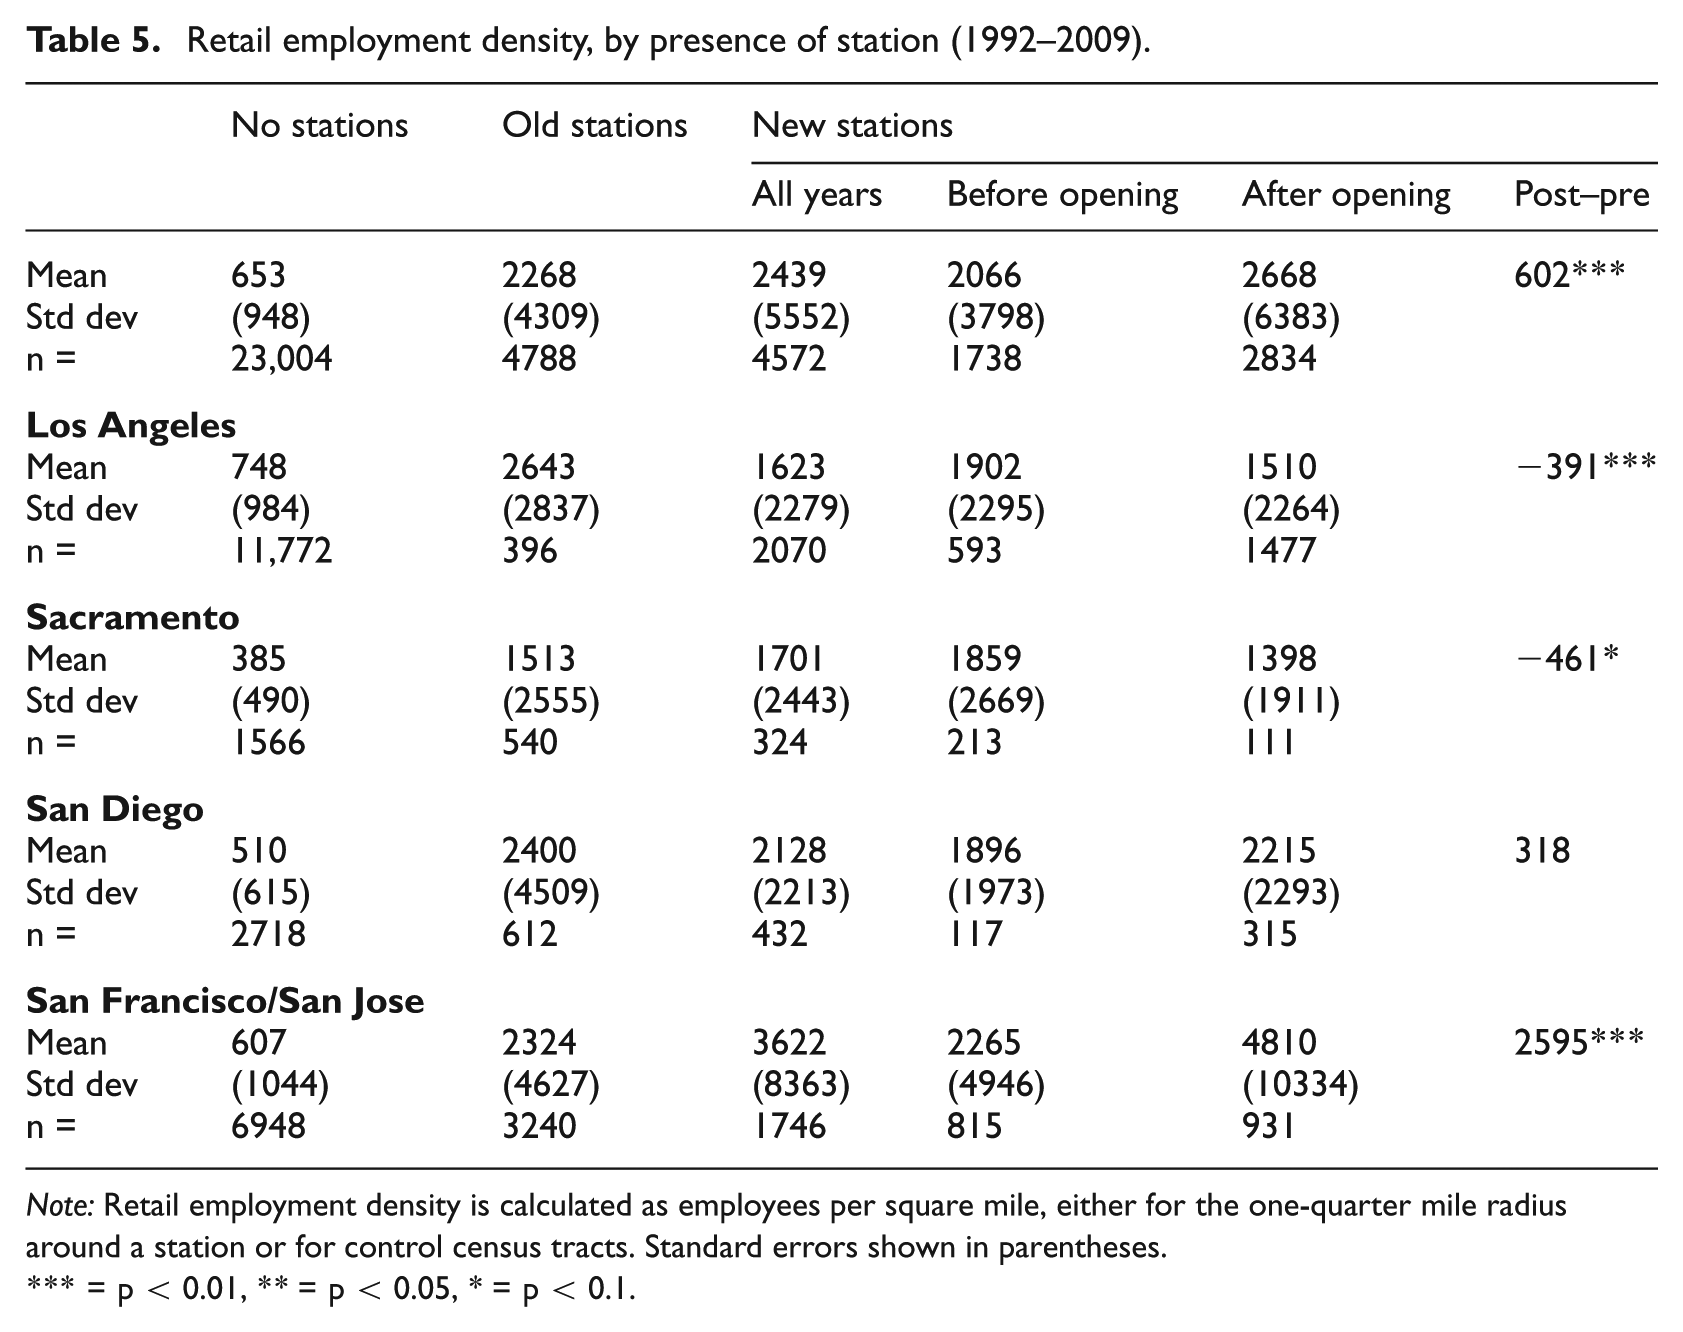
Note: Retail employment density is calculated as employees per square mile, either for the one-quarter mile radius around a station or for control census tracts. Standard errors shown in parentheses.
= p < 0.01, ** = p < 0.05, * = p < 0.1.
In the Los Angeles and Sacramento MSAs, retail employment density within one-quarter mile of new stations actually decreases after these stations open. In Los Angeles, retail density around new stations both before and after opening is lower than retail density around older stations; this reflects the placement of new Metrolink stations in suburban regions, as well as some MTA rail stations in low density areas. Prior to opening, the average new station area had 1902 retail employees per square mile, which drops by nearly 400 employees after opening (statistically significant at the 1% level). In Sacramento, new station areas initially had higher retail employment density than older station areas (1859 employees compared to 1513), but after the stations open, retail employment drops by approximately 460 employees per square mile, although significant only at the 10% level. Retail employment density around new stations in San Diego increased by approximately 300 employees per square mile after stations opened, although the change is not statistically significant. The only MSA in which new station openings are associated with a positive and significant change in retail employment is the San Francisco–San Jose metropolitan area. Retail employment around new stations is initially 2265, similar to that around older stations (2324), but increases to 4810 after station opening – more than doubling retail employment within a constant land area.
The differences in means summarised in Table 5 offer some insight into raw changes in retail employment around station areas, but do not provide causal evidence of a link between station opening and employment. In particular, the descriptive statistics do not address the counterfactual question of whether changes in retail employment are due to new stations opening, or pre-existing neighbourhood characteristics. To conduct a more robust test of the relationship between station opening and surrounding retail employment, I move to a regression framework. The results confirm that across the combined sample, both old and new station areas have higher initial retail density than control tracts. But there are not consistent, statistically significant differences in retail employment after station opening, either around new stations or in either of the two comparison groups. Stratifying the sample in a number of dimensions also confirms that proximity to stations has heterogeneous effects, across and within MSAs.
The first two columns in Table 6 show results of regressions including only the indicators of neighbourhood station status and post-new station period. All regressions include PUMA–year fixed effects, to account for secular changes in retail employment over time that may vary by larger market areas. Coefficients in columns 1–2 indicate that neighbourhoods ever within one-quarter mile of stations have higher retail density than control tracts, and that newer station areas have lower average employment density than older stations. The coefficients on post-opening period (column 2) are positive but not statistically significant for any of the neighbourhood types; this suggests there is no consistent relationship between newly operating rail stations and retail employment, either in treatment or control areas. The key coefficient of interest, Post*new, has the largest magnitude of the three Post variables but also relatively large standard errors.
Does retail employment growth increase after station opening?
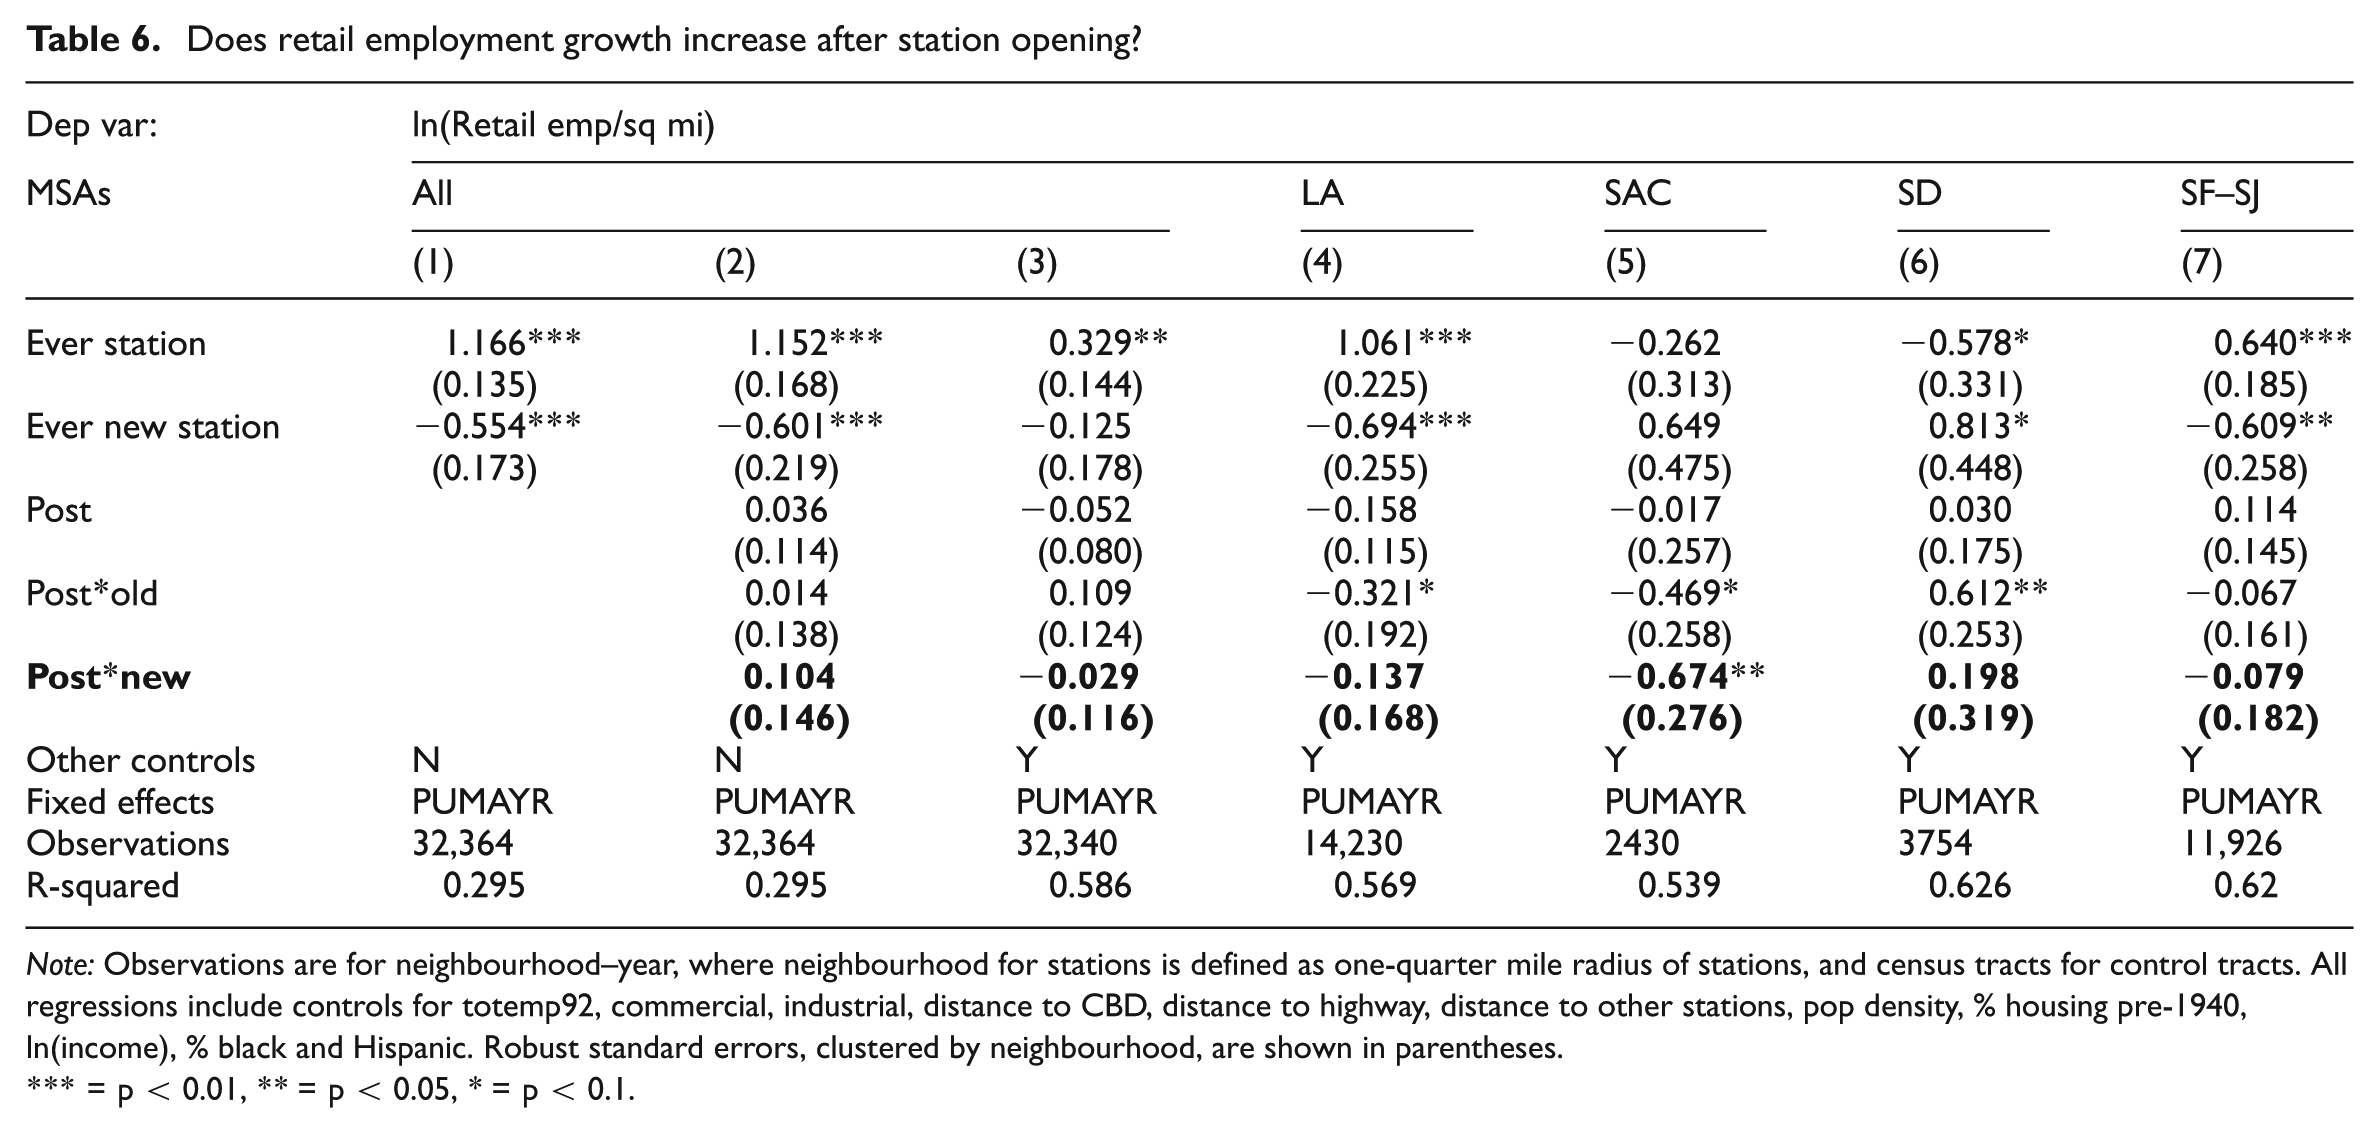
Note: Observations are for neighbourhood–year, where neighbourhood for stations is defined as one-quarter mile radius of stations, and census tracts for control tracts. All regressions include controls for totemp92, commercial, industrial, distance to CBD, distance to highway, distance to other stations, pop density, % housing pre-1940, ln(income), % black and Hispanic. Robust standard errors, clustered by neighbourhood, are shown in parentheses.
= p < 0.01, ** = p < 0.05, * = p < 0.1.
The model in column 3 includes variables for economic, demographic and locational characteristics, to control for prior differences between neighbourhoods. While the coefficient on Ever station remains positive and statistically significant, the magnitude drops considerably, and the coefficient on Ever new station decreases in absolute value and becomes statistically insignificant. This suggests that pre-existing differences in retail employment around new station areas, relative to older stations and control tracts, is explained by baseline neighbourhood conditions. As in column 2, none of the coefficients on post-opening period are statistically significant; the coefficient on Post*new flips from positive to negative but is statistically and substantively close to zero. The coefficients on baseline neighbourhood characteristics generally perform as expected; results are shown in Appendix Table B. 15
As with the descriptive statistics, pooling all four MSAs obscures varying relationships between retail employment and station status across the metro areas; however, there is no significant evidence that retail employment increases after station opening. Los Angeles and San Francisco exhibit similar patterns: new station areas have higher initial retail employment than control tracts, although lower than older station areas (columns 4 and 7). In both MSAs, new and old stations experience a drop in retail employment after new stations open, relative to control tracts, although not statistically significant (the coefficient on Post*old is marginally significant for LA). San Diego displays an inverse pattern: new station areas have higher pre-opening retail employment than either control tracts or old station areas (column 6). Both old and new station areas have higher average retail employment after new stations open, relative to control tracts, although only the Post*old coefficient is statistically significant. In Sacramento, there are no statistically significant pre-opening differences across neighbourhood types, but both old and new station areas have lower average retail employment after new stations open, relative to control tracts (column 5). The magnitude of the Post*new coefficient is quite large; applying the coefficient estimates to the average number of retail employees implies a drop of nearly 70%, or about 250 fewer retail employees, within one-quarter mile of new stations after opening. The estimated coefficients on control variables are largely consistent across MSAs, suggesting that the fundamental drivers of retail activity are similar across cities (Appendix A).
Stratifying the sample by MSA is a fairly crude proxy for underlying differences in station and neighbourhood characteristics, however; station traits and location vary substantially within MSAs. Table 7 presents coefficients from regressions stratified along four dimensions: intra-MSA location, rail system type, availability of on-site parking, and initial land use category. Most of the estimated coefficients on post-opening period for new stations are statistically insignificant, but the signs demonstrate some interesting – and potentially counterintuitive – patterns. Based on standard retail location models, we would predict that transit stations with high ridership and frequent service (namely, those close to the CBD and served by intra-city rail) should have more impact on surrounding development than areas near suburban commuter rail stations. Likewise, we might anticipate that stations surrounded by large parking lots and garages, which serve as impediments to contiguous development, would reduce the incentive for retailers to locate nearby. The estimated signs on Post*new run contrary to these hypotheses, although most results are not statistically significant.
Retail employment near stations, by station/neighbourhood characteristics.
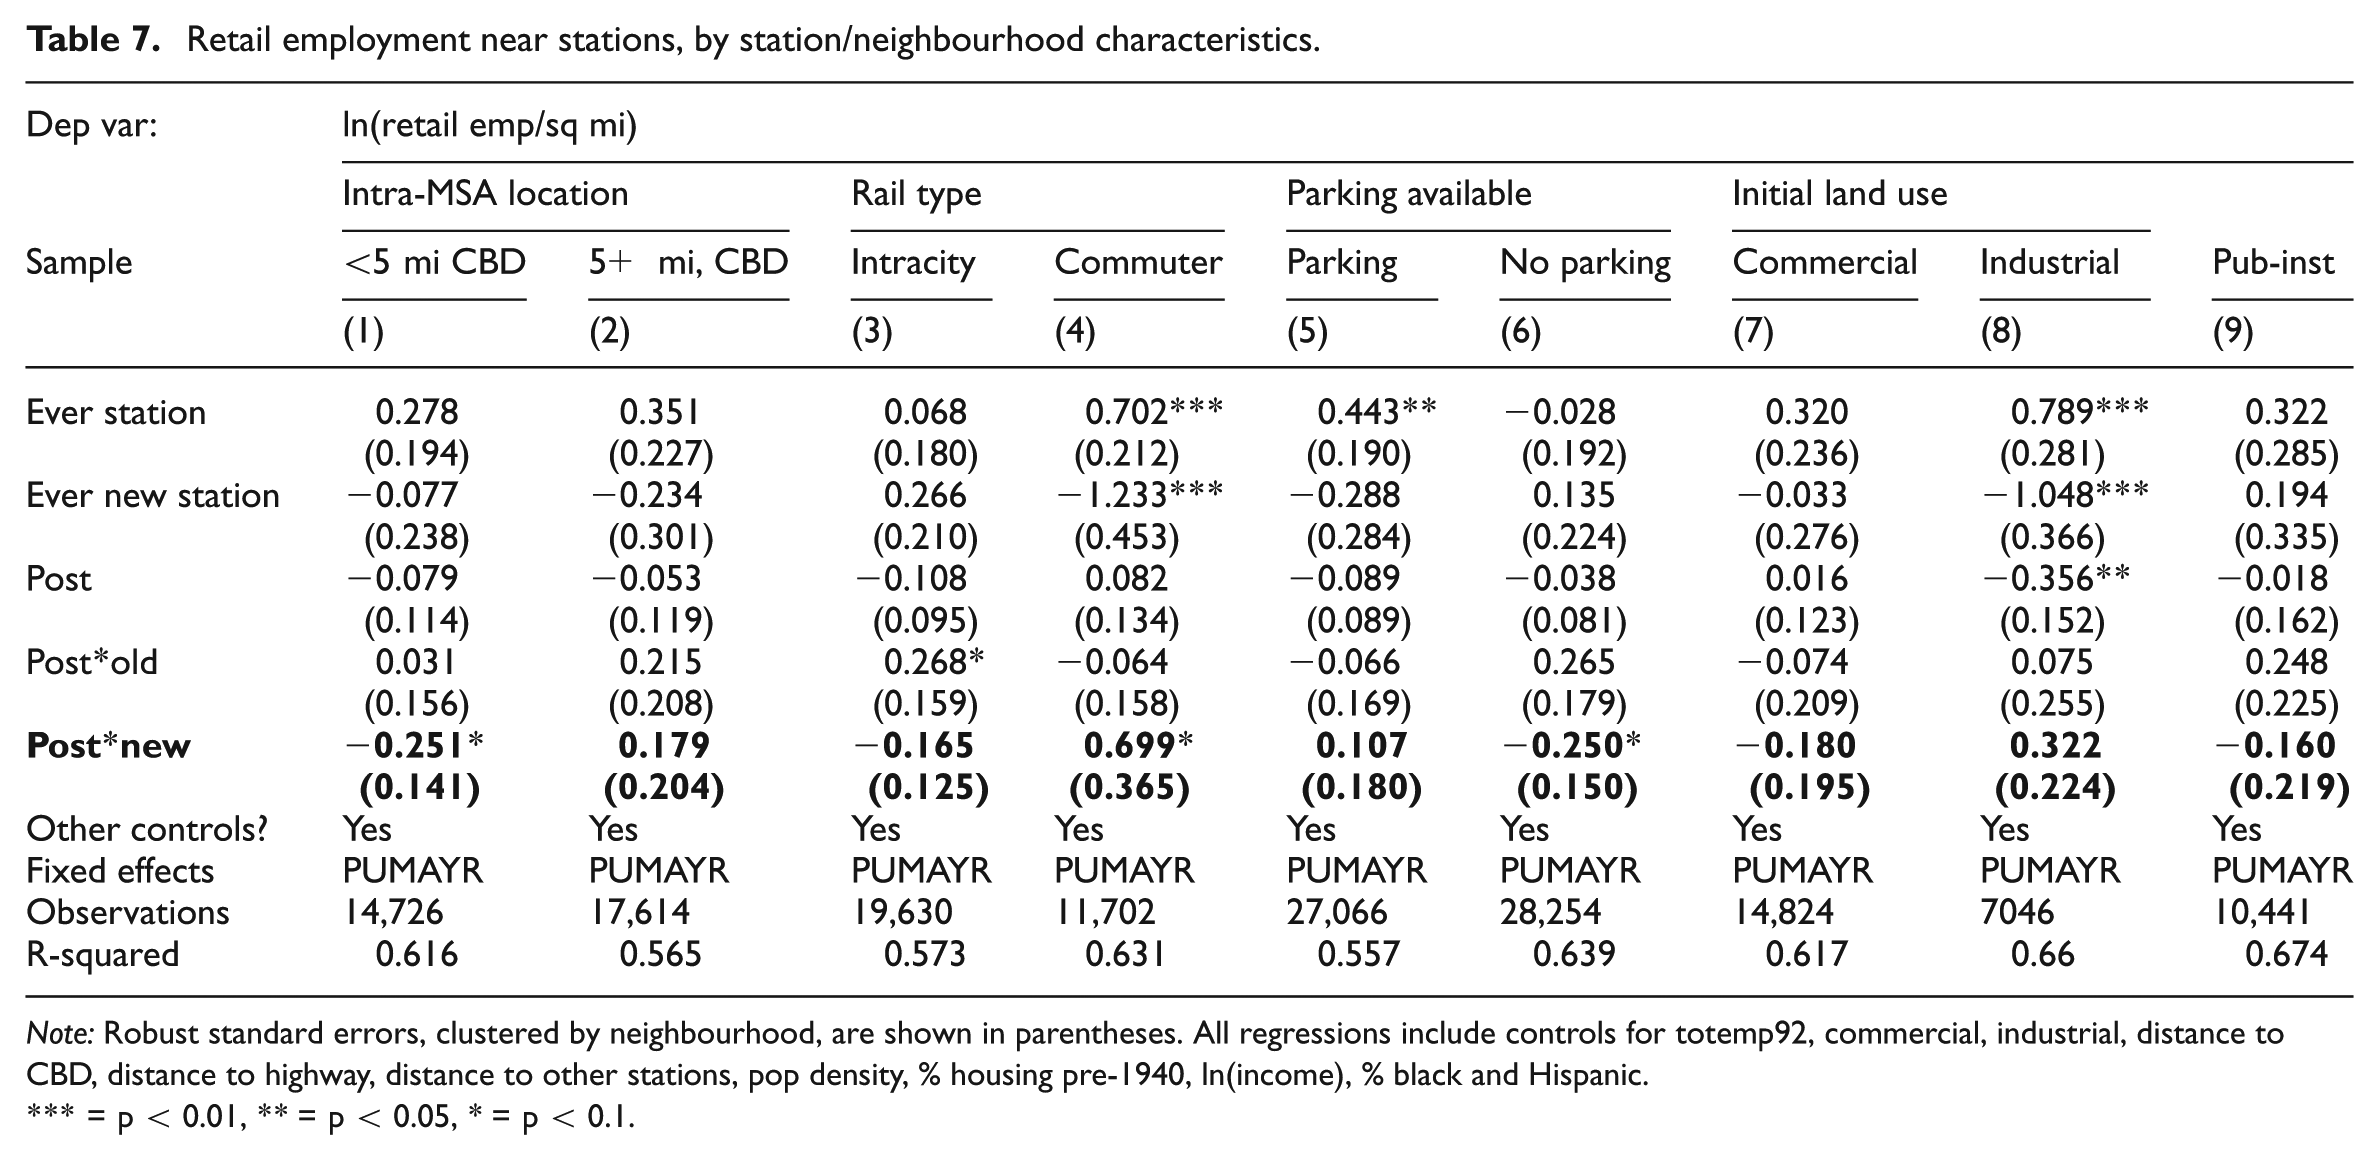
Note: Robust standard errors, clustered by neighbourhood, are shown in parentheses. All regressions include controls for totemp92, commercial, industrial, distance to CBD, distance to highway, distance to other stations, pop density, % housing pre-1940, ln(income), % black and Hispanic.
= p < 0.01, ** = p < 0.05, * = p < 0.1.
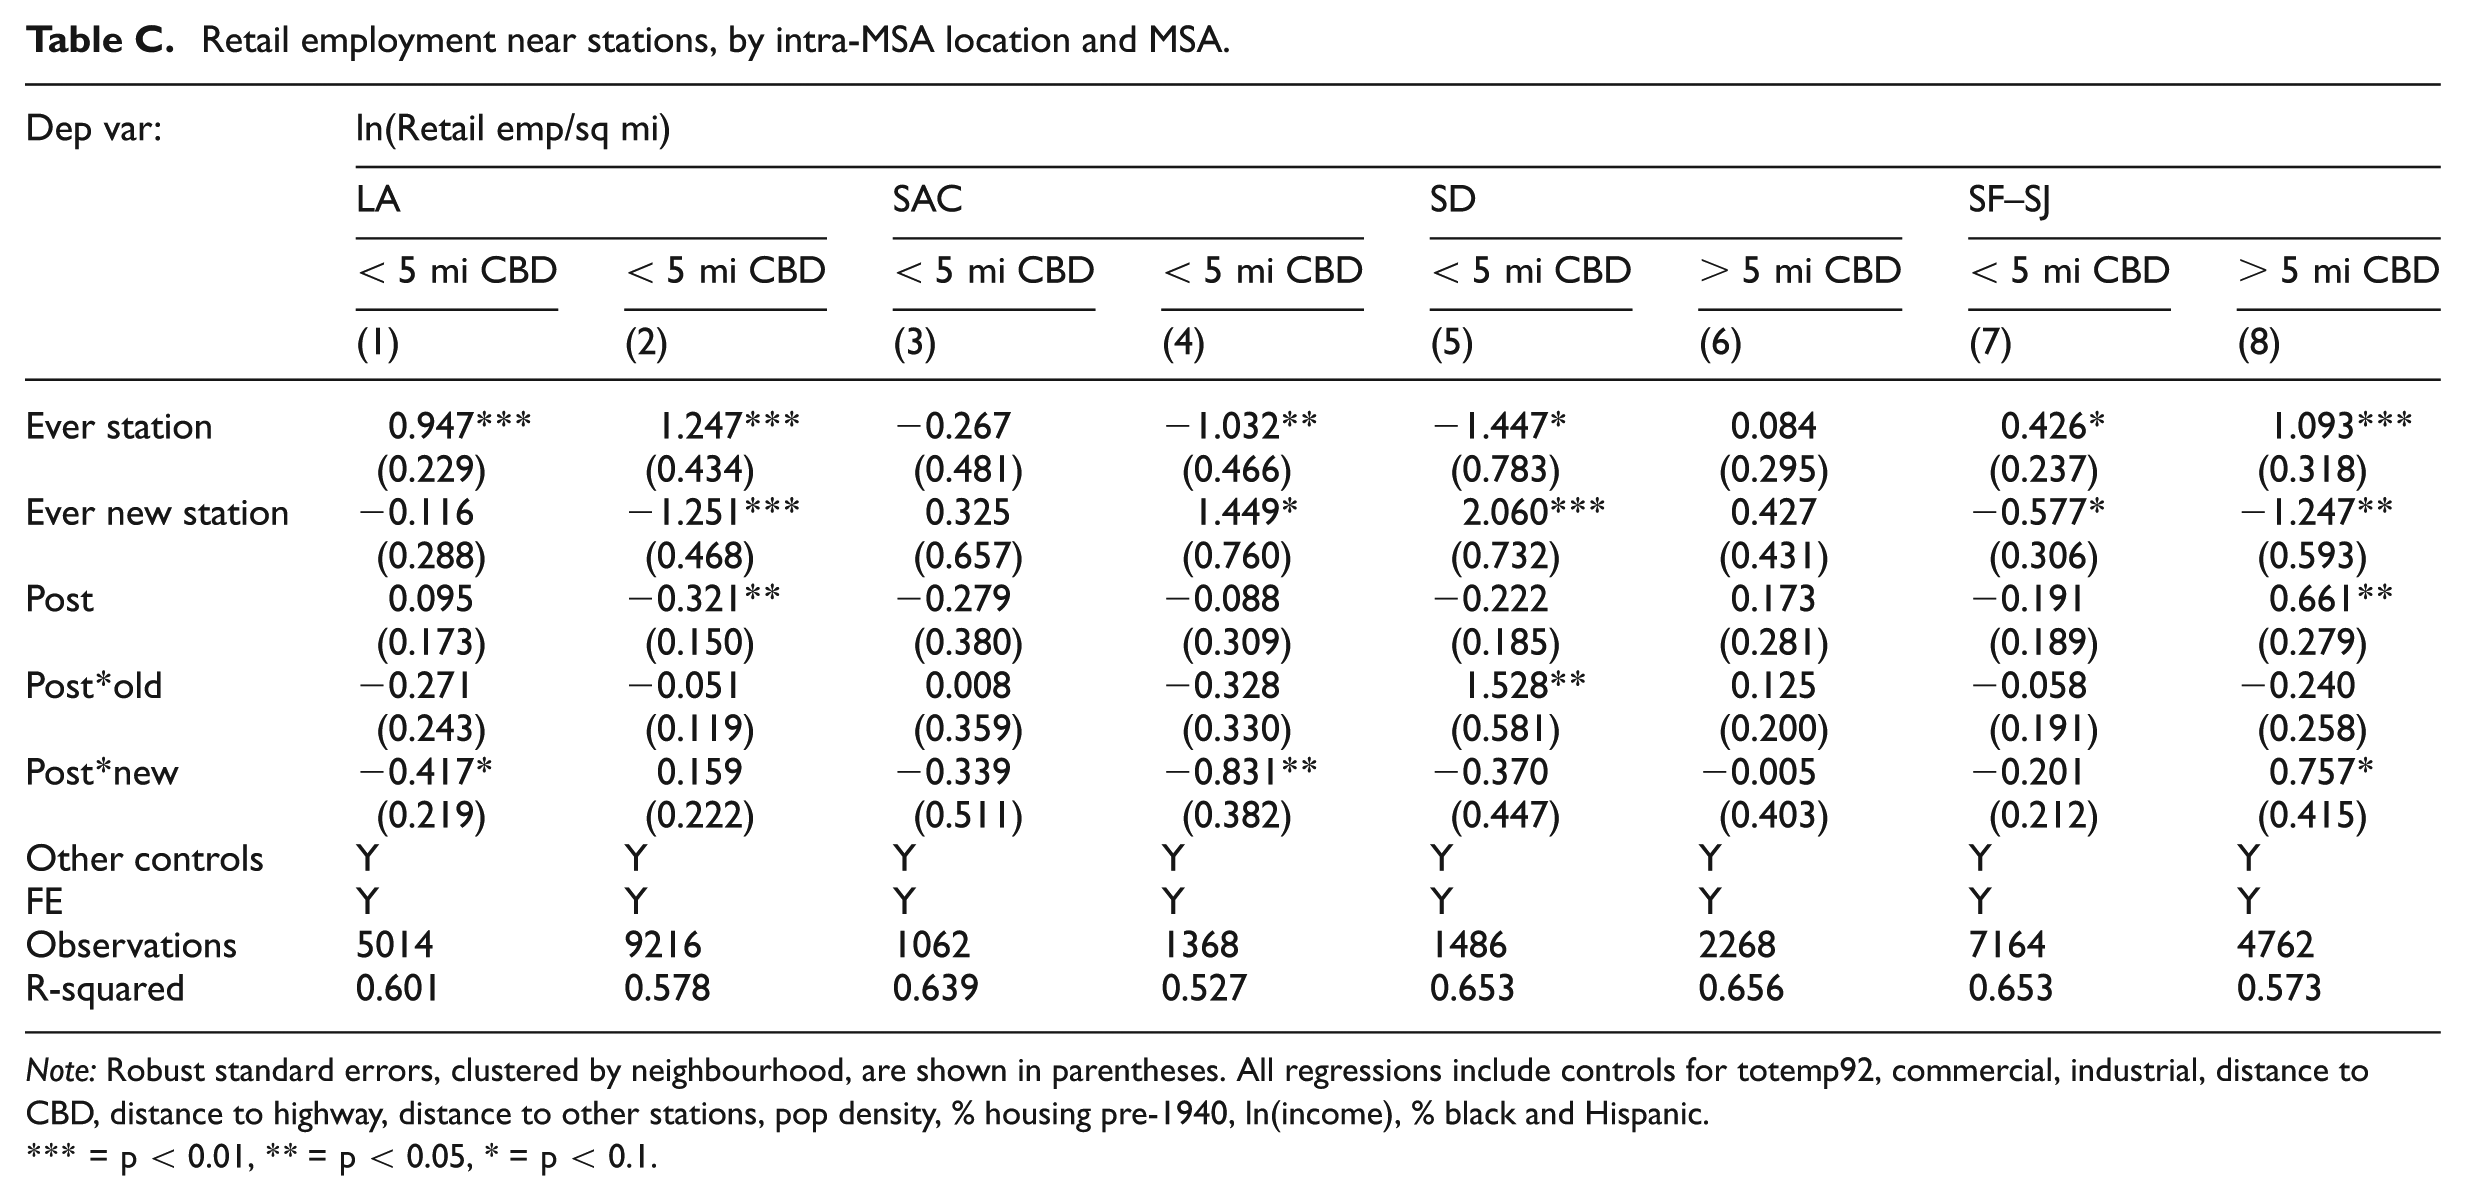
Comparing post-opening periods for stations by location and station characteristics, retail employment is lower after opening for new stations within five miles of the CBD (column 1) and without on-site parking (column 6). These coefficients are significant at the 10% level, and similar in magnitude (there is substantial overlap between these two groups, since most centrally located stations do not have on-site parking). These coefficient estimates imply a post-opening decrease of about 29% for stations without parking, and about 33% for stations within five miles of the CBD. From a baseline average of around 500 retail employees near those stations, this translates to a loss of about 140–170 employees. By contrast, retail employment is higher after opening for stations served by commuter rail, also significant at the 10% level (column 4). The magnitude of the Post*new coefficient is quite large for commuter rail stations, implying a 78% increase in retail employment per square mile after opening. From a baseline of around 160 employees, this would be a gain of approximately 125 additional employees within the one-quarter mile station area. The coefficients on Post*new are positive but insignificant for stations more than five miles from the CBD (column 2) and those with on-site parking (column 5), and negative but insignificant for intra-city rail stations (column 3). Stratifying the sample by initial land use yield no statistically significant coefficients on Post*new (columns 7–9). Similar analyses, stratifying by MSA and proximity to CBD, produce mostly similar results (Appendix Table C).
Discussion and policy implications
Over the past 20 years, local and regional governments in California have made substantial investments in new or expanded rail transit systems. Policymakers often justify expenditures on transit by arguing that stations will generate economic development, increases in jobs, property values, and other amenities. In this paper, I describe the characteristics and locations of new rail stations in California’s four largest MSAs, and examine whether new station openings are associated with growth in nearby retail activity.
Results indicate that new rail stations were located in areas with previously high employment density, somewhat outside the city centres, with relatively low household incomes. These areas therefore offer potential for physical and economic development surrounding the stations. However, there is considerable variation in the baseline characteristics of neighbourhoods selected for rail stations, both within and across MSAs, which may affect the prospects for nearby development. In addition, the new stations vary in their physical characteristics, intra-MSA location, and the type of rail networks to which they belong. Stations that attract higher ridership will presumably be more attractive targets for retail or residential development, because of their ability to draw in consumers. Further analysis finds that, on average, new station openings are not significantly associated with changes in nearby retail employment. These results vary somewhat by MSA and station characteristics. New station openings are not significantly associated with differences in retail employment in the Los Angeles, San Diego or San Francisco MSAs, while retail employment is lower after new station opening in Sacramento. There is weak evidence that new station openings are associated with decreased retail employment around centrally located stations and those without parking, but with increased retail employment near commuter rail stations.
Although somewhat counter to the predictions of urban planners and standard economics models, several possible explanations are consistent with these results. There may be unobserved features of urban spatial structure, transit systems, or populations that make transit access a more valuable amenity in certain neighbourhoods. For instance, areas close to the CBD may already be saturated with retail; the baseline retail employment density within five miles of the CBD is more than double that of tracts farther away. Centrally located neighbourhoods may have higher barriers to large-scale development projects, including high land costs, fragmented land ownership, and cumbersome development processes. Consumers may prefer to conduct their shopping by car rather than by train, particularly when purchasing bulky or heavy items. The MSAs in this study are relatively car-oriented (as indicated by rail transit’s low share of commuting trips). Thus developers may prefer to construct new shopping centres surrounded by abundant parking, which will be difficult to do directly adjacent to transit stations.
The mixed results of the empirical analysis make it difficult to draw clear and consistent implications for policymakers and planners. Like a growing number of studies, these results serve as a reminder that the impacts of transit infrastructure on surrounding neighbourhoods will vary, based on complex interactions between station and neighbourhood characteristics. In part, the difficulty lies in determining the primary purpose of building transit stations and rail networks. Is the goal of such investment to improve functioning of the transportation systems within a metropolitan area, or is it to spur economic development? Building rail stations in centrally located neighbourhoods that already have a high density of residents or businesses seems likely to improve access to existing jobs, goods and services, but may not result in increased economic activity if these areas are congested or require costly redevelopment. By contrast, suburban stations will likely serve fewer potential passengers, but may offer greater potential for greenfield development projects oriented around the station. The results raise questions about whether building new stations will be an effective economic development tool for underserved neighbourhoods in central cities. Planners and policymakers considering the expansion or development of rail systems should therefore consider pre-existing neighbourhood conditions, and weigh competing goals, before deciding where to make new transit investments.
Footnotes
Appendix
Retail employment near stations, by intra-MSA location and MSA.
| Dep var: | ln(Retail emp/sq mi) |
|||||||
|---|---|---|---|---|---|---|---|---|
| LA |
SAC |
SD |
SF–SJ |
|||||
| < 5 mi CBD |
< 5 mi CBD |
< 5 mi CBD |
< 5 mi CBD |
< 5 mi CBD |
> 5 mi CBD |
< 5 mi CBD |
> 5 mi CBD |
|
| (1) | (2) | (3) | (4) | (5) | (6) | (7) | (8) | |
| Ever station | 0.947*** | 1.247*** | −0.267 | −1.032** | −1.447* | 0.084 | 0.426* | 1.093*** |
| (0.229) | (0.434) | (0.481) | (0.466) | (0.783) | (0.295) | (0.237) | (0.318) | |
| Ever new station | −0.116 | −1.251*** | 0.325 | 1.449* | 2.060*** | 0.427 | −0.577* | −1.247** |
| (0.288) | (0.468) | (0.657) | (0.760) | (0.732) | (0.431) | (0.306) | (0.593) | |
| Post | 0.095 | −0.321** | −0.279 | −0.088 | −0.222 | 0.173 | −0.191 | 0.661** |
| (0.173) | (0.150) | (0.380) | (0.309) | (0.185) | (0.281) | (0.189) | (0.279) | |
| Post*old | −0.271 | −0.051 | 0.008 | −0.328 | 1.528** | 0.125 | −0.058 | −0.240 |
| (0.243) | (0.119) | (0.359) | (0.330) | (0.581) | (0.200) | (0.191) | (0.258) | |
| Post*new | −0.417* | 0.159 | −0.339 | −0.831** | −0.370 | −0.005 | −0.201 | 0.757* |
| (0.219) | (0.222) | (0.511) | (0.382) | (0.447) | (0.403) | (0.212) | (0.415) | |
| Other controls | Y | Y | Y | Y | Y | Y | Y | Y |
| FE | Y | Y | Y | Y | Y | Y | Y | Y |
| Observations | 5014 | 9216 | 1062 | 1368 | 1486 | 2268 | 7164 | 4762 |
| R-squared | 0.601 | 0.578 | 0.639 | 0.527 | 0.653 | 0.656 | 0.653 | 0.573 |
Note: Robust standard errors, clustered by neighbourhood, are shown in parentheses. All regressions include controls for totemp92, commercial, industrial, distance to CBD, distance to highway, distance to other stations, pop density, % housing pre-1940, ln(income), % black and Hispanic.
= p < 0.01, ** = p < 0.05, * = p < 0.1.
Funding
Funding for this project was provided by the METRANS Transportation Center at USC and the Lusk Center for Real Estate (grant no. 11-04).