




Abstract
Claims of the self-segregation of minority ethnic groups during the early 2000s were much critiqued in the British academic literature, which pointed instead to decreasing ethnic segregation via the rather benign demographic processes of births and deaths, and internal migration from urban clusters. Despite the attention that these opposing debates received, a detailed study of change in ethnic residential segregation during the period has yet to be undertaken for the whole of England and Wales, and the recent release of 2011 Census data has now made this possible. This paper contributes to the literature by providing a systematic overview of national-level change in residential segregation in a changing socio-political climate, considering how minority ethnic distributions have altered in the last decade. The paper explores the specific case of England and Wales, but in doing so makes a contribution to our understanding of the contemporary evolution of ethnic geographies and the dynamics of diverse places, beyond this specific region. Using a commonly employed measure of spatial unevenness, the Index of Dissimilarity, at the smallest possible geographical level, the findings demonstrate how there has been increased residential mixing between each ethnic group (the White British majority and all minority groups), and that urban locales have experienced a decrease in segregation between 2001 and 2011. The findings disturb the association of ethnic diversity with ethnic divisions in (particularly urban) space and provide support for the somewhat ‘every day’ processes of de-segregation, rather than a cause for concern over increasingly entrenched neighbourhoods.
Introduction
The now infamous Sleepwalking to Segregation speech, 1 delivered by Trevor Phillips in 2005 as Chair of the Commission for Racial Inequality, claimed that British society was becoming divided and estranged via a process of self-segregation between communities. This has been much critiqued in the academic literature, which has pointed instead to decreasing ethnic segregation via the somewhat benign demographic processes of births and deaths, and internal migration from urban clusters (Finney and Simpson, 2009a, 2009b; Stillwell and Phillips, 2006). This research challenged the bold characterisation of ethnically diverse locales as the sites of selective isolation by minority groups from some ‘mainstream’, providing evidence of dispersal from, rather than retreat into, ethnic concentrations. British-based studies of 1991 and 2001 Census data including Simpson (2007) and Gale (2013) showed that, although minority ethnic populations grew, residential segregation decreased.
Despite the attention that Phillips’ headline-grabbing claim generated, a detailed study of change in ethnic residential segregation during the period in which these debates were aired has yet to be undertaken for the whole of England and Wales, and the recent release of 2011 Census data has now made this possible. The summary briefings by Simpson (2012) and Catney (2013) provided the first assessments of change nationally and locally, showing decreasing segregation between ethnic groups. Johnston et al. (2013, 2015) have made early contributions, employing a segregation typology to demonstrate an increase in residential mixing since 2001 nationally and in London, while Harris (2014) considered changes in ethnic composition between neighbouring areas. This paper contributes to the literature by providing a systematic overview of national-level change in residential segregation in a changing socio-political climate, considering how minority ethnic distributions have altered in the last decade. The paper explores the specific case of England and Wales, but in doing so makes a contribution to our understanding of the contemporary evolution of ethnic geographies and the dynamics of diverse places, beyond this specific region.
British segregation in context
The last decade has witnessed a diversification of immigration streams to the UK (Vertovec, 2007), and intensifying public debate about (and accompanied by electoral response to) major social issues such as welfare, immigration, the relevance and preservation of a ‘British’ national identity, and the impacts of diversity on local place (Duffy and Frere-Smith, 2014). 2 In the early 2000s, policy became very explicit about the need to better understand and ‘solve a problem’ of spatial concentrations and the (un-)integration of minorities, shifting from a multiculturalism model (in essence, celebrating differences) towards community cohesion (favouring a shared culture, identity and belonging). Reports commissioned on the urban centres of Bradford, Burnley and Oldham explored the extent of divisions between ethnic and religious groups (for context on the disturbances which inspired these reports, and a critical discussion of subsequent policy and the reports’ references to segregation, see Robinson (2005) and Phillips (2006)). While community cohesion is no longer so explicitly a part of national and local policy, it remains in political rhetoric and policy planning (DCLG, 2012; Phillips et al., 2014). Mutual and multi-way interaction within communities can, of course, have very positive outcomes; intercultural engagement has the potential to erode misunderstandings and tensions between groups (DCLG, 2012; Phillips et al., 2014). However, the policy developments that followed the renewed focus on residential segregation were accompanied by controversies over the reliability of the evidence on which they were made, and their usefulness in tackling structural inequalities between ethnic groups. A policy focus on ‘integration’ over the eradication of ethnic inequalities has been highlighted as a potentially dangerous route to the stigmatisation of particular neighbourhoods (Finney and Simpson, 2009a).
Indeed, the geographies of ethnic residential segregation arise from a complex interplay between choice and constraint for a range of inter-related social, cultural and economic factors. Certain locales may act as protective havens or spatial traps; in this latter context segregation might be viewed as a form of (geographical) inequality. The following is a brief, and by no means a comprehensive, review of the associated literature for the British case, but provides some examples of the opportunities for and barriers to (de)-segregation over time.
Housing and internal migration
While over-generalisation should be avoided, there are common housing and locational aspirations between ethnic groups in Britain (Finney and Harries, 2015; Phillips, 2006). Suburbanisation and urban–rural migration is not ethnic group-specific, and there is ample evidence of deconcentration by minority ethnic groups away from the inner city, attracted by, for example, more space, better schools and lower crime rates (e.g. in Leeds and Bradford: Phillips, 2006; Stillwell and Phillips, 2006), or, less positively, pushed out by housing pressures. As a whole, this migration represents de-segregation from urban clusters of minority groups (Gale, 2013; Simpson and Finney, 2009).
Of course, financial restrictions are important in determining the feasibility of this type of residential mobility. Initial clustering in areas of cheap inner city housing is a common model for immigrants and in some cases their descendants. Yet there may be constraints to post-immigration internal migration beyond the monetary. In the UK, research into the discriminatory role of housing institutions in shaping the residential locations of individuals and families from minority ethnic groups is more limited than in the USA (e.g. Roscigno et al., 2009), however some studies have highlighted biased treatment through exclusion from the full array of housing options, and stereotyping of neighbourhood preferences, in both urban and rural settings (Phillips, 2006; Reeve and Robinson, 2007).
Economic position
Financial capital can represent either opportunities for equality in location and housing type, or constraint in residential choices. Rees and Butt (2004) described metropolitan deconcentration by economically successful minority groups, and Catney and Simpson (2010) demonstrated that migration away from immigrant settlement areas was not ethnic group-specific, but determined by economic position. This spatial mobility will not be an aspiration for all people; however, inequality of opportunity translates into barriers for residential mobility and can reinforce existing residential patterns. There is considerable evidence for persistent minority ethnic disadvantage in the UK labour market, in terms of entry into employment, and in the experiences of those employed (including prospects for career progression, pay, hours worked, the nature of contracts, etc., for which employer discrimination is, at least in part, responsible; for an overview see Catney and Sabater, 2015).
The spatial distribution of labour market opportunities has, of course, also had an impact on residential patterning. Immigrant gateway areas often have a greater supply of jobs and are therefore attractive to newcomers and their descendants. This partly explains both historical immigrant streams (for example, South Asian immigration associated with the textile industry in Bradford in the 1950s and 1960s) and contemporary preferences for certain locales by new waves of immigration (as an example, rural employment opportunities have been directly related to the new geographies of settlement of immigrants in the UK, particularly from Eastern Europe (Lymperopoulou, 2013)). The pull of higher education institutions also plays a role in these settlement patterns, but may be more temporary given the tendency for student migrants to return to their country of origin once their studies are complete.
Human capital
In addition to financial capital, other personal factors including education levels and language will affect settlement patterns, particularly of recent immigrants. Proficiency in the host country’s dominant language empowers individuals to negotiate access to housing, education and the labour market, affecting, for example, employment and earnings (Dustmann and Fabbri, 2003). The protection and support of particular neighbourhoods might be important for those with lower fluency levels.
Settlement history, chain immigration and networks
As with other countries with a history of major immigration flows, traditional entry points of arrival (or ‘gateway areas’) to the UK are often the sites of subsequent immigration flows from the same origin (Stillwell and McNulty, 2012). Thus, even with subsequent internal migration and emigration away from these points of entry, there has been a refuelling of the population from immigration, as well as high fertility given the youthful age structures of recently arrived groups. Traditional immigrant settlement areas include London and other major cities (e.g. Birmingham and Manchester), in addition to areas associated with particular labour opportunities, as discussed earlier. Places with a history of settlement are therefore also attractive to future immigrants, where they can benefit from well-established networks (for jobs, housing and other support), strong links with their place of origin (including family reunification, but also less personal connections), and religious institutions and other services (e.g. culinary, clothing, etc.).
Shared culture and practices
Some of the attributes of settlement areas will also be attractive to subsequent generations. As Peach’s (1996) discussion of ‘good segregation’ highlighted, in turn specialist institutions are maintained though their support by a resident local community. Living in a neighbourhood with others with a shared ethnic and/or religious affiliation can have protective effects against racism and other negative social outcomes. The positive role that certain neighbourhoods can play might therefore maintain co-ethnic clusters, either because of voluntary (preferential) or forced (protective) factors.
This paper explores the persistence of spatial inequalities between ethnic groups during a period of increasing diversity and changing social and political attitudes and policy foci on related issues. In both historical and contemporary studies of segregation, the spotlight has focused intensely on urban areas. This is true for the British case, but it is also true internationally (as examples of many: Holloway et al. (2012) on US metropolises, Walks and Bourne (2006) on Canadian cities, Johnston et al. (2001) on Sydney, and several studies of European cities in Finney and Catney (2012)). Using recently released data from the 2011 Census, a commonly employed statistical measure of segregation is used in this paper to consider how spatial unevenness has changed between each ethnic group across small areas in England and Wales. Change in segregation for all (subnational) areas in England and Wales since 2001 is explored, then for urban areas. In doing so, the paper offers some insight into how spatial inequalities might be expected to change over time, in nations attractive to immigrants and of high diversity of immigrant and settled populations.
Measuring residential segregation
There is a complement of indices measuring the different ‘dimensions’ of segregation (Massey and Denton, 1988). Change in segregation in England and Wales is analysed here by focusing on arguably the most commonly applied segregation measure, the Index of Dissimilarity (D). The use of a single measure has been critiqued by Johnston and colleagues (2003), but applied elsewhere (e.g. Dorling and Rees, 2003). The application of this sole measure here can be justified for three main reasons: (1) it is well-established in the literature (both academic and policy); (2) it is fairly intuitive and therefore benefits from being generally well-understood; and (3) it provides a useful summary guide as to where and for which groups change in segregation is occurring.
D measures the degree to which two groups x and y are (un)evenly spread:

where x i is the number of people in group x in area i, X is the total number of people in that group in the study area, y i and Y are the equivalent for group y, and there are n zones. D takes a value of zero where the groups are equally distributed (for example, the share of the two groups is 65/35 in all areas) and 100 when the groups are completely unequal (all areas are 100% group x or 100% group y).
Simpson (2004: 662) reminds us that ‘settlement patterns at any point in time can be described numerically as racially segregated’. The emphasis in this paper is thus on change over time, and the direction of change in segregation.
Ethnic group Census data and geography
Ethnic group counts are available from the England and Wales Census at several geographies. This analysis uses data for the lowest level geography, Output Areas (OA) (n = 181,408 in 2011; mean population approximately 300 people), nested within local authorities (comprising districts and unitary authorities, hereafter referred to solely as ‘districts’; n = 348 in 2011; mean population approximately 161,000 people). Between 2001 and 2011, the number of districts reduced from 376 given a merging of some districts into larger areas; 2001 and 2011 OAs are nested within the 348 2011 districts. Changes to OAs were minimal in the period, with just 2.6% either being split or merged (Office for National Statistics, 2012). The nominal change in zones and the small size of OAs means there is likely to be minimal effect of boundary changes on segregation levels and so these changes are ignored for this study.
Population estimates which account for the undercount of minority ethnic groups in the 2001 Census have been used throughout (Sabater and Simpson, 2009); these figures therefore differ slightly from the standard published Census tables. 3 An application of these data to a study of segregation between 1991 and 2001 is offered by Sabater (2010). The population was better-estimated in 2011, and therefore these data are used here as published.
Ethnic group population change, 2001–2011
For context, Table 1 provides population counts and percentages of ethnic groups in 2011, and percentage point change from 2001. The final column is the percentage of each group residing in urban OAs, as a proportion of that group. Urban areas are defined using the 2001 Office for National Statistics rural-urban classification of (2011) OAs. 4 According to this coarse categorisation, roughly 80% of OAs in England and Wales were defined as urban.
2011 England and Wales population by ethnic group and percentages in urban areas, and percentage point change from 2001.

Notes:
n/a: not applicable.
Counts are in thousands, rounded to the nearest thousand.
The total population in 2001 in thousands to the nearest thousand was 52,360.
Sources: 2011 Census, Table KS201EW (Crown Copyright), and complete population estimates based on the 2001 Census (Crown Copyright). Author’s own calculations.
Given their growth and size, in this paper ethnic groups identified as ‘Other’ are included for analysis, although possible shifts in self-identification between groups mean that comparisons of ‘Other’ groups over time should be undertaken cautiously (Simpson et al., 2014). In 2011, the new ethnic group White Gypsy or Irish Traveller was introduced under the White category and this is merged with Other White for comparative purposes. The other addition to the ethnic group categorisation in 2011, Arab, is merged with Any Other.
The largest ethnic group category by some way is White, comprising, in 2011, 86% of the England and Wales population. White British constituted the largest White group, and indeed by far the largest ethnic group in England and Wales, at over 45 million individuals. There has been absolute growth of all minority ethnic groups, with change in the relative proportions of ethnic groups most notable for Other White and Other Asian. Growth of groups other than White British has been consistently high in London districts, but not exclusive to the capital, with new geographies of ethnic diversity emerging (Catney, 2015). Ethnic group populations may decline or grow because of high mortality and low fertility in older ethnic groups and emigration (e.g. White British and White Irish), immigration (e.g. Other White, especially by Eastern Europeans), births (e.g. Mixed groups), or change in affiliation over time; and growth may slow for groups with a longer immigration history to the country (e.g. Caribbean) (Simpson and Jivraj, 2015).
The urban residential bias in the England and Wales population is most obvious for minority ethnic groups, with the exception of the White Gypsy or Irish Traveller group. The White British population was four-fifths urban-based in 2011, but more than 97% of South Asian (Indian, Pakistani and Bangladeshi) and Black groups resided in urban areas. The Mixed and Chinese groups have high proportions in urban areas, but less so than other ‘non-White’ minority groups.
Small area ethnic group segregation
The Index of Dissimilarity (measured for OAs within England and Wales, for each group compared with the rest of the population) decreased for all minority ethnic groups, with percentage point decreases ranging from −15 (Mixed White and Asian) to −2 (Other White). The White British group experienced a small increase in unevenness with respect to other ethnic groups (1 percentage point).
This section considers segregation at the small area level, exploring change in segregation for each district. Unevenness is calculated for OAs within each district, giving an Index of Dissimilarity value (defined earlier, hereafter D) for every district in England and Wales, which might be thought of as a measure of ‘neighbourhood’ segregation within districts. Simpson (2007) discussed how comparison of levels of population unevenness between places is not mathematically robust and therefore in this paper D is explored within the same districts in England and Wales, but not between them. Ethnic groups are merged for more efficient representation of the results; aggregations of groups are defined under Figure 1. However, the heterogeneity of these groups should be noted (for example, there is no single ‘Mixed’ community, and the Other groups are highly variable in their cultural affiliations and immigration histories).
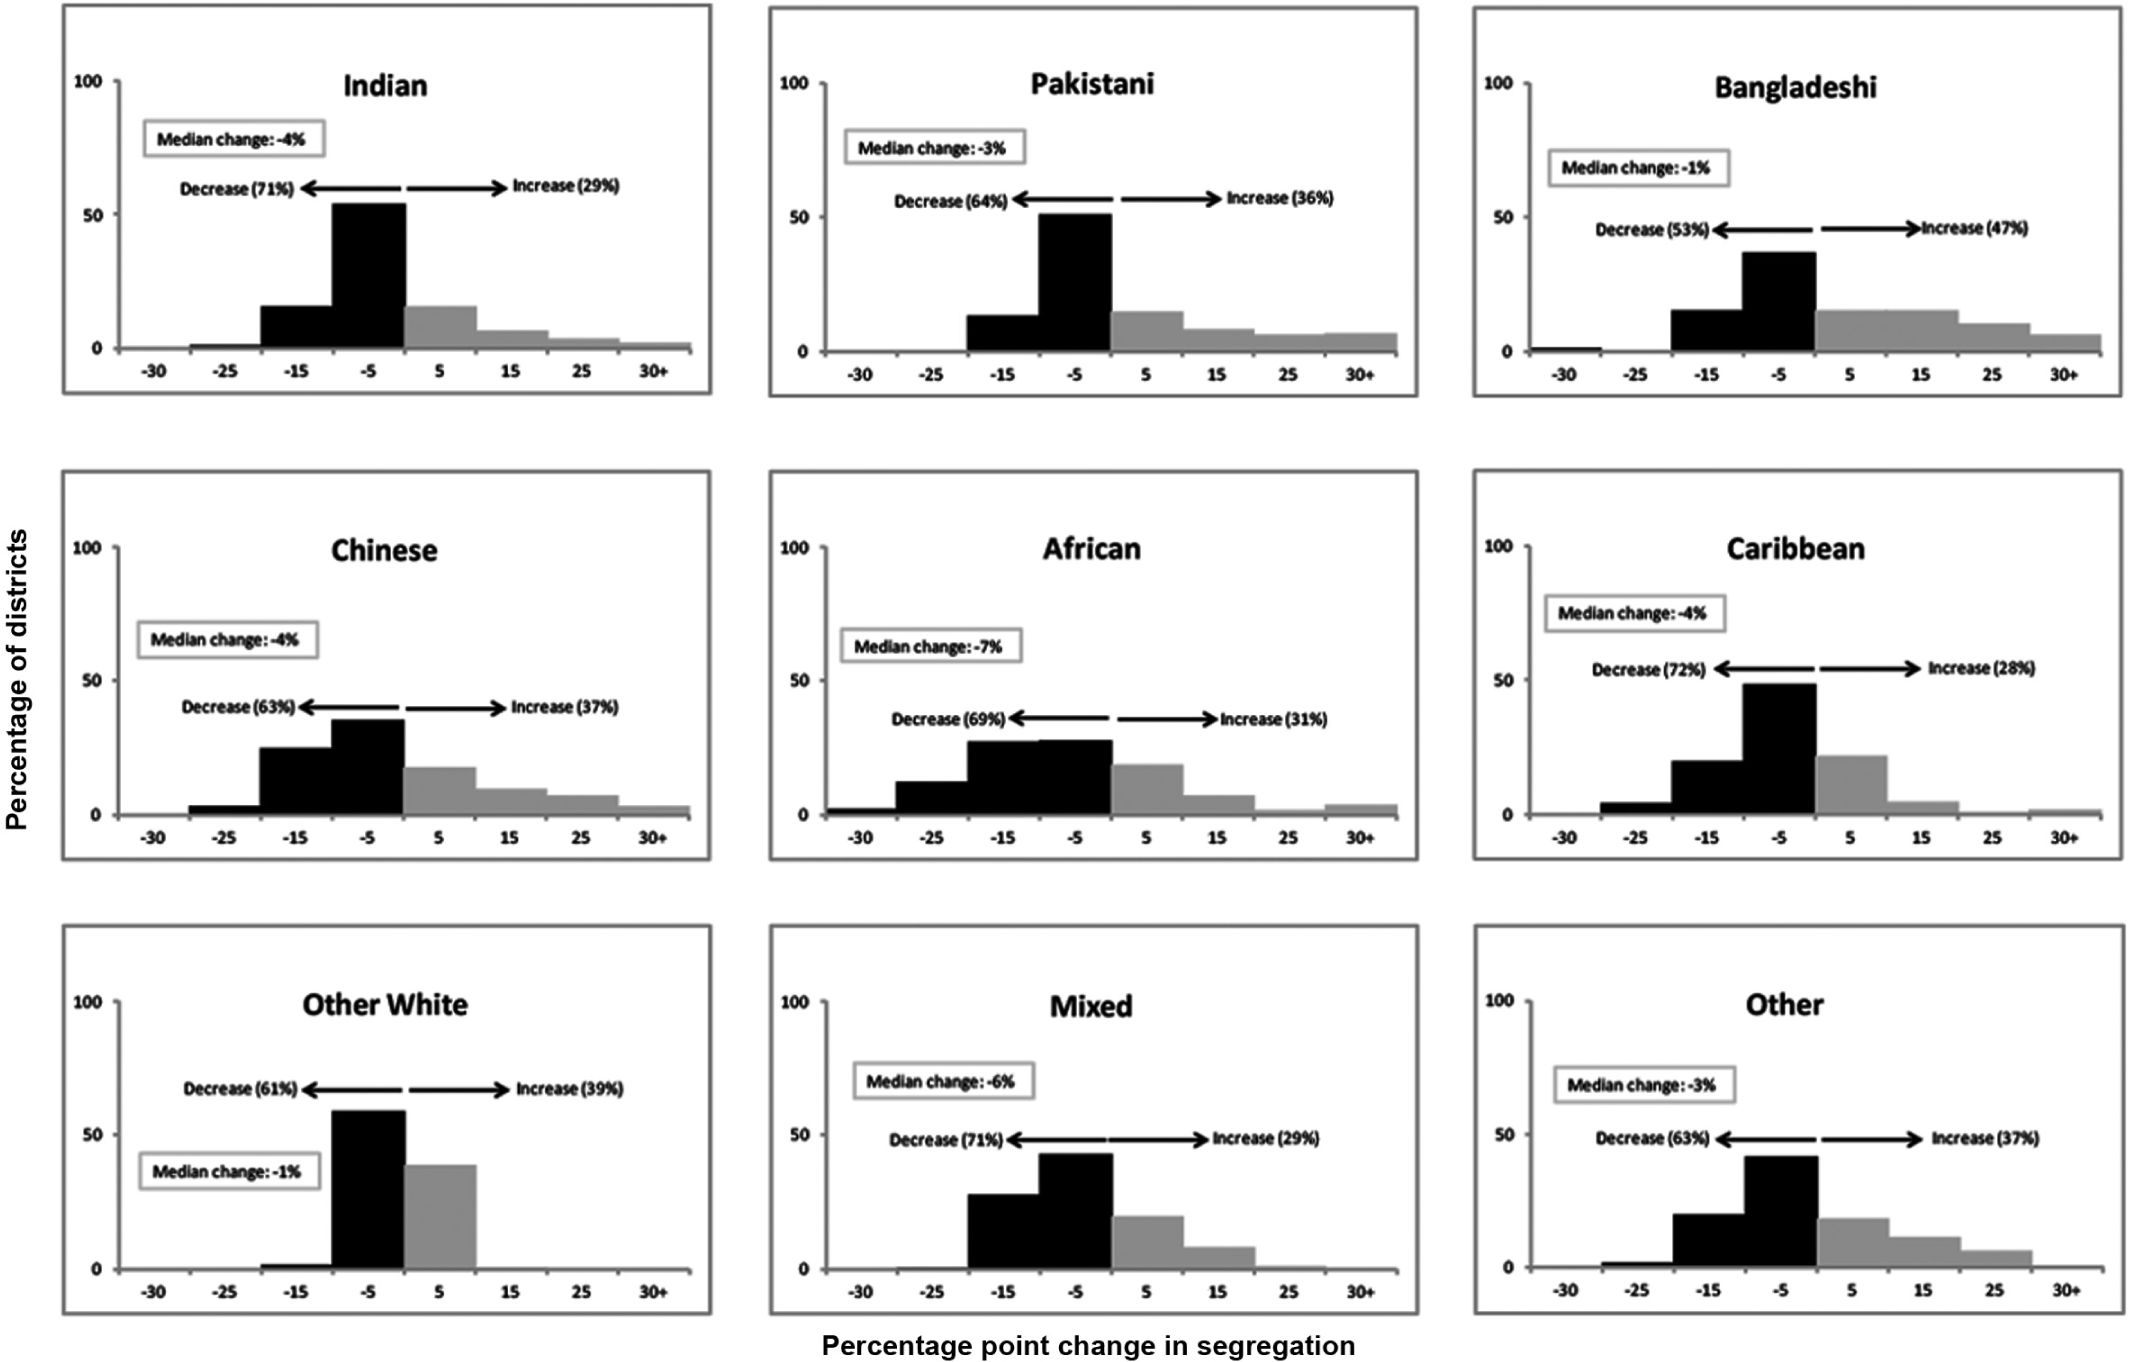
Change in segregation for minority ethnic groups, for OAs in districts of England and Wales, 2001–2011.
A small change to a small population base can lead to misleading values of D. In this analysis, a threshold based on a minimum population count has been applied, for each ethnic group. The smallest median population for all ethnic groups included in the analysis was for Bangladeshis in 2011, at 206. A threshold of a minimum of 200 people in a district in 2001 and 2011, for each ethnic group, was therefore applied. This resulted in a different number of districts being included in the analysis for each ethnic group; the numbers of districts included (see notes under Figure 1) are themselves informative of the extent to which ethnic groups are spread nationally.
The White British group is by far the largest group and is populous throughout England and Wales, so no districts have been excluded for this group given the applied threshold. The White Irish group has a long history of immigration to Britain, and while initial clusters from original immigration may remain in cities such as Liverpool, Manchester and London, this group is fairly evenly distributed. The Other White group is also very spatially dispersed; EU Accession immigration since 2004, which contributed significantly to the growth of this group (Simpson and Jivraj, 2015), is different from other immigration streams which have tended to be initially clustered in gateway areas. While immigration to these settlement areas is still important, destination choice by migrants of Polish origin and those from other 2004 EU Accession countries is rather more dispersed, including to rural areas in the UK, made attractive by labour opportunities (Lymperopoulou, 2013). Hence, only one district was excluded by this measure for the aggregated group which combines White Irish and Other White (and White Gypsy or Irish Traveller in 2011). Just 11 districts were excluded for the combined Mixed group; many affiliating with this group are the children of parents with different ethnic group identification (Simpson and Jivraj, 2015), and it is perhaps not surprising that this combined group would be more dispersed and therefore meet the minimum threshold across most districts in England and Wales (although it is interesting to note just how dispersed this group is). While the Chinese group remains a relatively small ethnic group, it is spatially dispersed (Simpson and Finney, 2009), and thus this group had among the fewest excluded districts. The Indian group met the threshold in all but a quarter of districts. Groups more traditionally concentrated in distinct urban areas (for example, the Bangladeshis, who are mainly concentrated in London districts and who are also a proportionately small ethnic group), had the most districts excluded.
The following analyses are split into two parts, looking first at change in the spread of minority ethnic groups, who have received the most attention in public and academic discourse on segregation, before considering the White British (majority) ethnic group.
Change in minority ethnic spread
Figure 1 shows the proportion of districts which saw an increase or decrease in segregation between 2001 and 2011. It is immediately clear that the majority of districts have seen a decrease in segregation for all minority ethnic groups. Decrease in segregation has been consistently greatest for the Caribbean group, which, along with the Indian, Mixed and African groups, has seen a decrease in over two-thirds of districts. The African group experienced the largest median change in segregation (−7 percentage points), followed by the composite Mixed group (−6). Of course, for some ethnic groups in some districts while segregation has decreased this is from a relatively high starting point, as would be expected given the mechanisms which create co-ethnic clusters outlined at the start of the paper (and see Simpson, 2007).
Very few districts saw a large increase in segregation for any minority ethnic group, and where this occurred it was in areas where there were small proportions of that ethnic group, rather than in the areas where the group was most populous (i.e. under 1% of the district’s total population, for all ethnic groups which saw an increase of 30 percentage points or higher, with one exception for the Other group, at just over 1%). As an example, for the Pakistani group, every district which experienced an increase in segregation by 10% or more had in 2011 a Pakistani population of less than 1% of the district’s total. The ten districts which experienced an increase in segregation greater than 40 percentage points only just met the threshold population of 200 for inclusion in the analysis for that respective ethnic group, in one or both years. For many districts with this large increase in segregation, the population increased proportionately yet in absolute terms only by a small number of individuals. Segregation values for an ethnic group may increase where that group is found only in a small number of areas within a district and there is growth within those neighbourhoods, or there is ‘pioneer’ migration into a small number of areas from a relatively low population base. Thus, a small population and the geographical distribution of an ethnic group in combination may lead to an ‘increased’ segregation value, even when there is greater residential mixing.
What does this change in segregation look like spatially? As examples, Figure 2a and b are maps of change in segregation for the Chinese and Indian groups, for OAs in districts. The maps are population cartograms, where each district is shown approximately proportional in size to its resident population. This has the benefit of improved visibility of highly urbanised areas such as London (where 33 of the 348 districts in England and Wales lie) which may be difficult to discern in Euclidean space. Selected districts act as reference points in Figure 2.
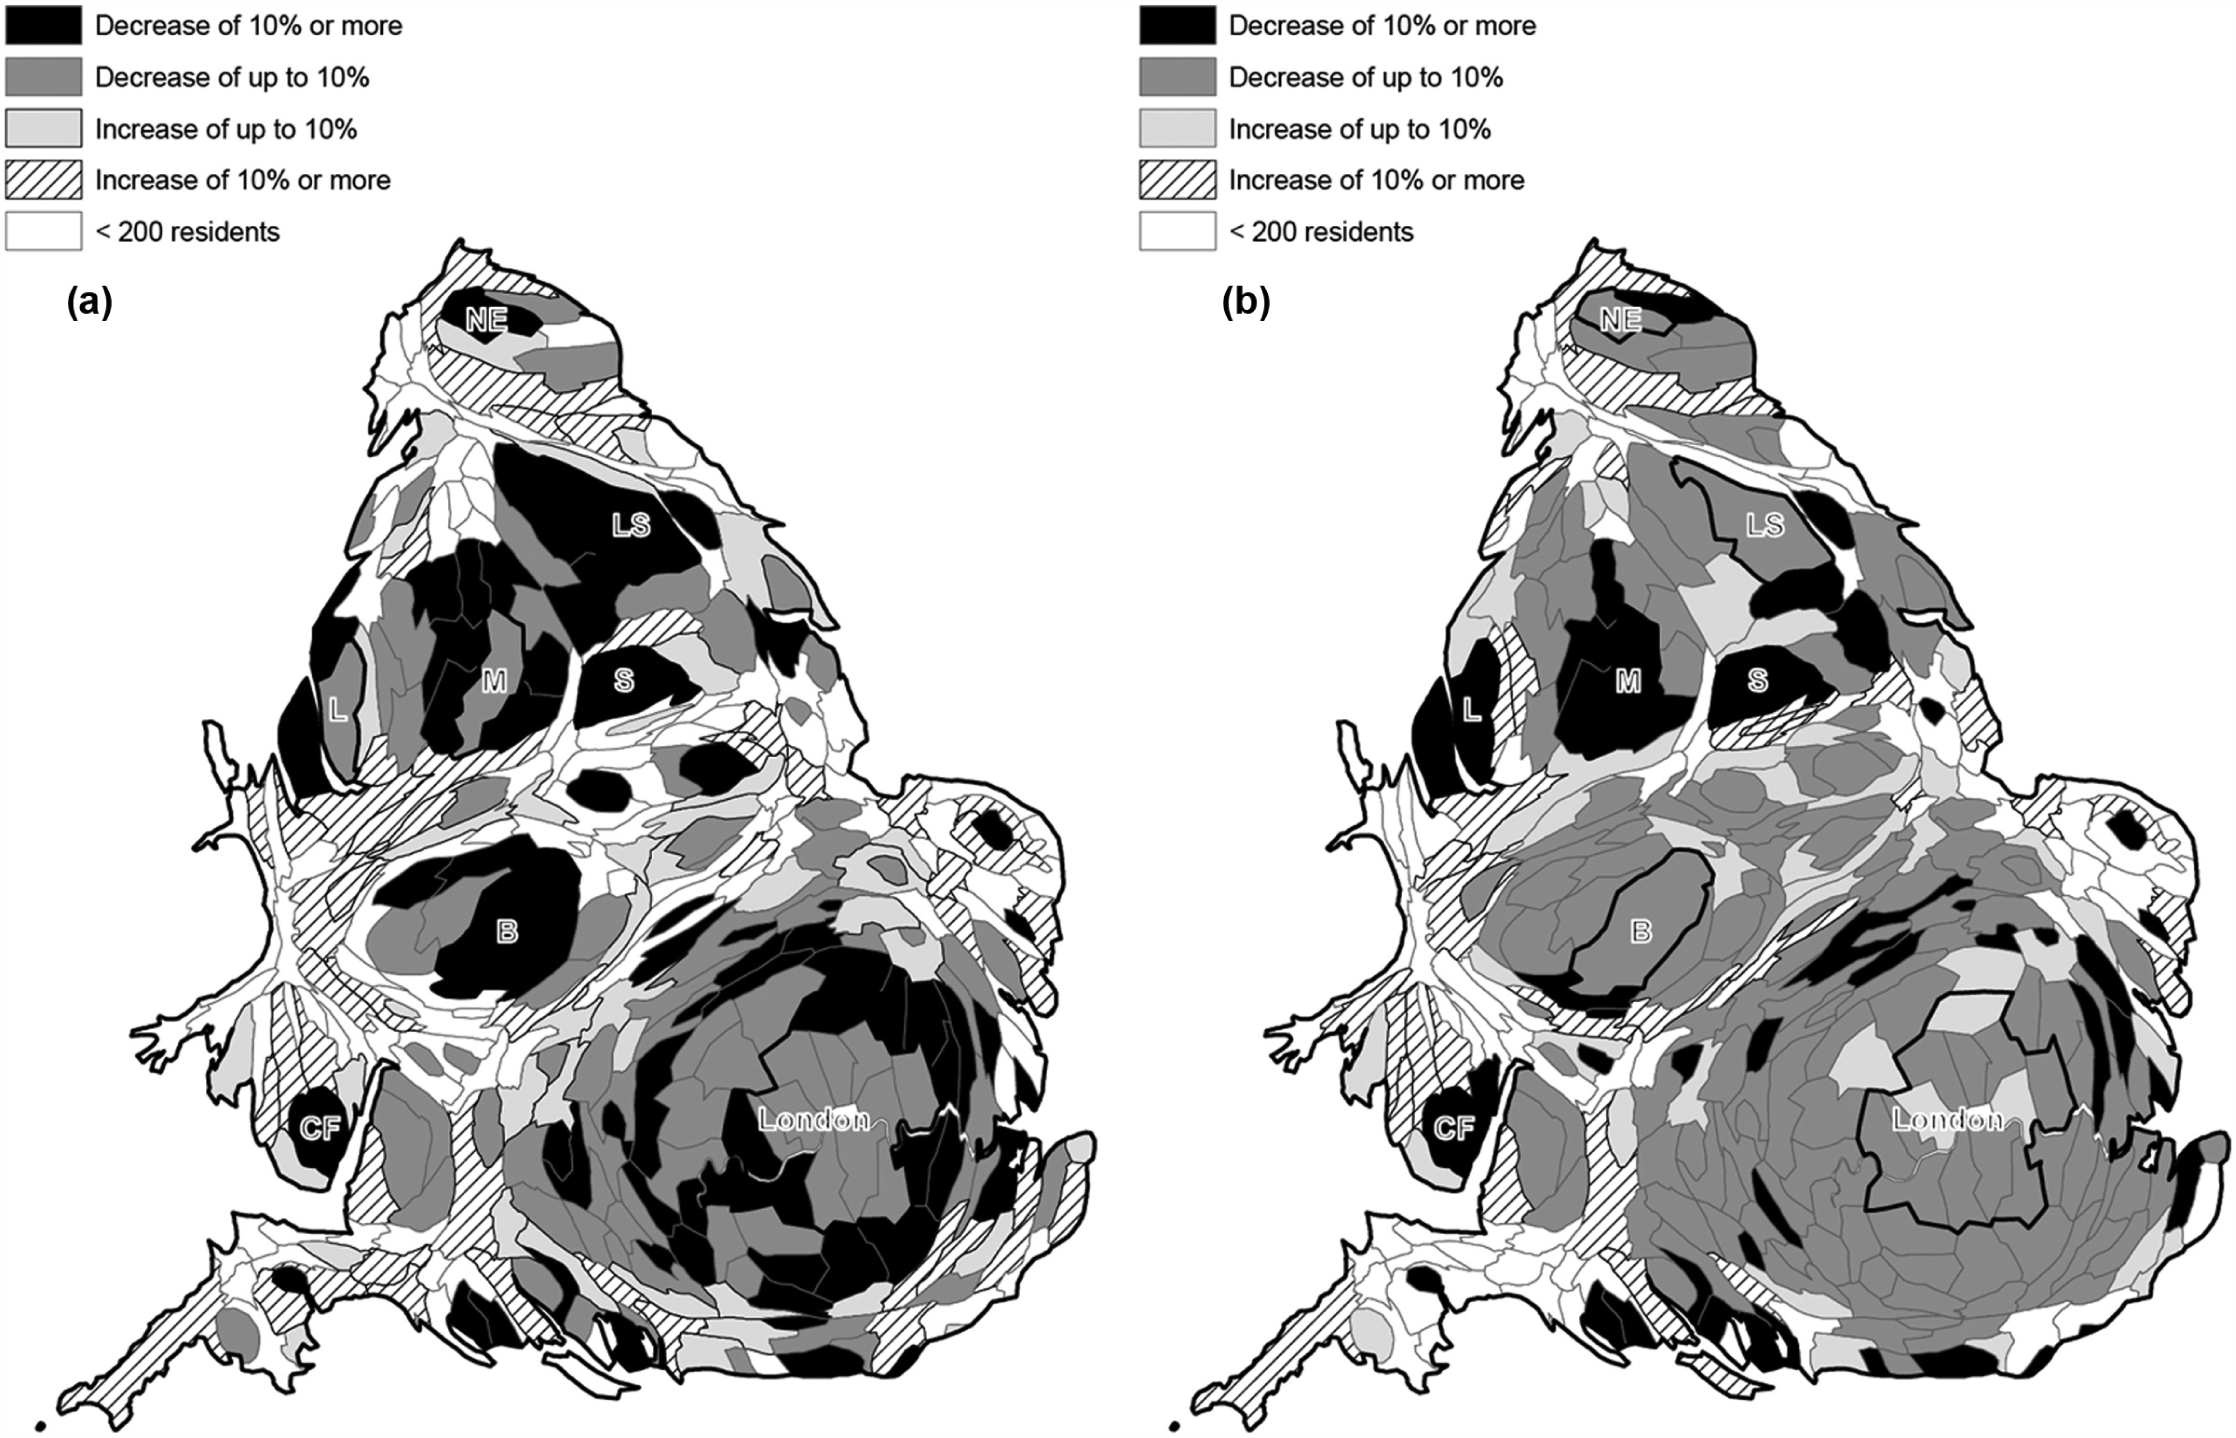
Maps of change in segregation, 2001–2011, for (a) Chinese and (b) Indian ethnic groups.
The maps show an obvious urban element to decreases in segregation, occurring both North and South. Many of the districts which experienced a decrease in segregation have large populations, and are major urban areas. Nearly two-thirds of districts which met the population threshold experienced a decrease in segregation by the Chinese group (Figure 1), and these are shown in Figure 2a. Districts with the largest decreases included Bolton, Bury, Croydon and Slough. Increases in segregation of the Chinese population were mainly in rural areas where their populations were very small. The Indian group (Figure 2b) shows decreasing segregation in large urban areas such as Liverpool and Manchester, and some marginal increase in rural areas.
It is not possible to show cartographically change in segregation for all groups given space constraints, however, for many of the minority ethnic groups included in Figure 1, segregation has decreased by over 5 percentage points in large and highly diverse cities such as Leicester and Birmingham. These districts have seen a decrease in segregation for all ethnic groups except Other White, which had a very small increase. Manchester experienced a decrease in segregation for all ethnic groups, including by 13 percentage points for the Indian ethnic group. In Bradford (a city commonly viewed as the ‘archetypical’ segregated UK city; see Finney and Simpson (2009a) for a critique), segregation has decreased for all minority ethnic groups, except a marginal (1.5 percentage points) increase for the Other White group. Reduced segregation here included 16 percentage points for the African and 13 percentage points for the Chinese ethnic groups. This pattern of decreases in mainly urban areas and increases in rural areas can be observed for all ethnic groups, although inner London offers an exception for the African and Caribbean groups.
This decline in segregation in urban areas is explored further in Figure 3, using a classification scheme which groups districts into an urban-rural category based on their socio-economic and demographic characteristics, and administrative status; see Champion (2005), here applied to 2011 districts with an aggregation of the most urban area types into the broader categories inner and outer London, metropolitan areas and other large cities. 5 Examples of metropolitan districts include Birmingham, Leeds, Manchester and Liverpool. Other large cities include Leicester, Nottingham, Bristol and Cardiff. D is calculated for OAs across each of the four most urban categories, so that one D value is given for each typology, for each group, for 2001 and for 2011. Figure 3 shows change in these values over the decade. In line with Figure 2, the picture is one of decreased residential segregation in urban areas. Inner London has experienced a decrease in segregation for most ethnic groups, with an increase of under 1.5 percentage points for the Caribbean and African groups. Outer London’s decreasing segregation was particularly notable for the ethnic groups Bangladeshi (−12 percentage points), Chinese (−11) and Mixed (−8). Segregation has decreased in metropolitan districts for all minority ethnic groups. For all minority ethnic groups (except a very small increase for Other White), segregation decreased in the urban districts classified as other large cities, in particular for the African group, with a decrease of 20 percentage points.
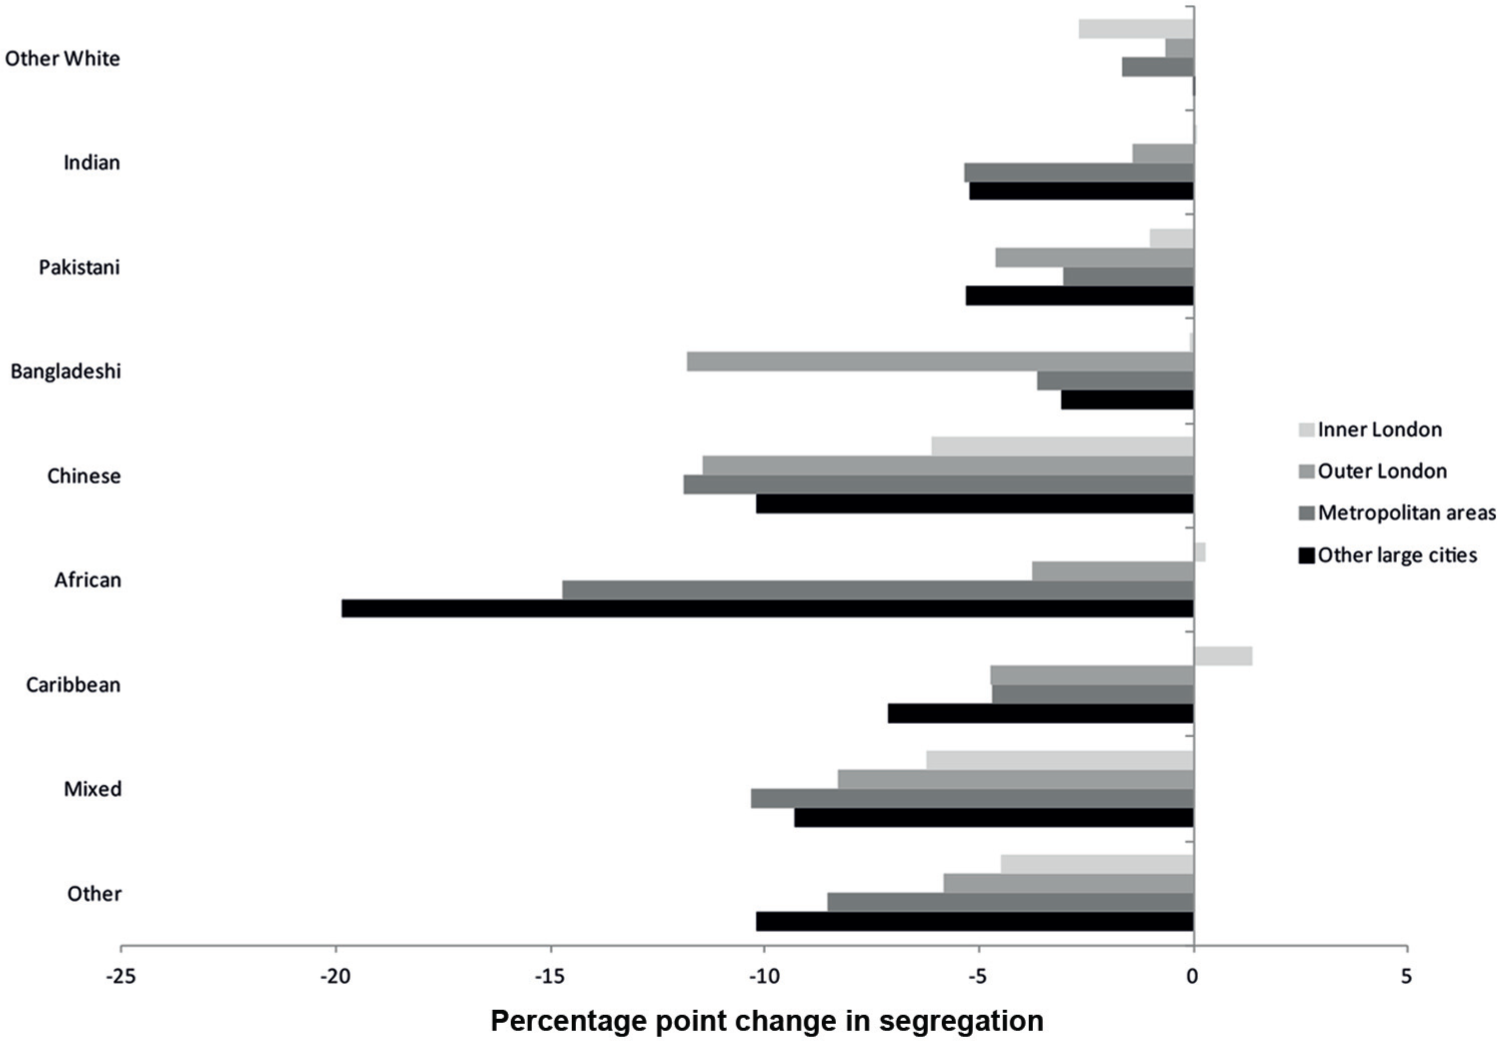
Percentage point change in segregation within urban areas in England and Wales, 2001–2011.
Change in White British segregation
Figures 1, 2 and 3 focused on minority ethnic groups. Comparable figures are not shown for the White British group, but are now summarised. While all minority groups experienced a decrease in segregation for the majority of districts (Figure 1), for the White British group, 86% of districts saw an increase in segregation, although the vast majority (92%) of these districts fell within the increase of 0–10 percentage point range. Within this, more than half of the districts increased their White British segregation by 5 percentage points or less. If districts in England and Wales are aggregated into the urban typologies employed in Figure 3, the White British group experienced a slight increase in segregation in all four urban area types. The group’s greatest increase in segregation was in inner London, at 3 percentage points. Outer London and metropolitan areas increased their White British segregation by 2 percentage points, and there was little change (less than 0.5 percentage point increase) in segregation in other large cities. As with most minority ethnic groups, large cities including Leicester, Birmingham and Manchester experienced decreased segregation by the White British group. Segregation remained low for this group, with a D value of 56.6% for OAs in 2011, an increase of 1 percentage point since 2001. Over 50% of districts were more than 90% White British in 2011 (from nearly 75% of districts in 2001); a district which is 100% White British has a perfectly even distribution and movement of members of another ethnic group into any area within that district must increase unevenness. Thus, D will increase despite greater residential mixing in neighbourhoods. Change in White British segregation levels has thus been interpreted here in the context of new ethnic group mixing in less diverse locales. Johnston et al. (2015) demonstrate this new mixing in predominately White spaces in London. To add to our understanding of this change, the following section explores residential mixing between every ethnic group, White British and minority.
Change in segregation between each ethnic group
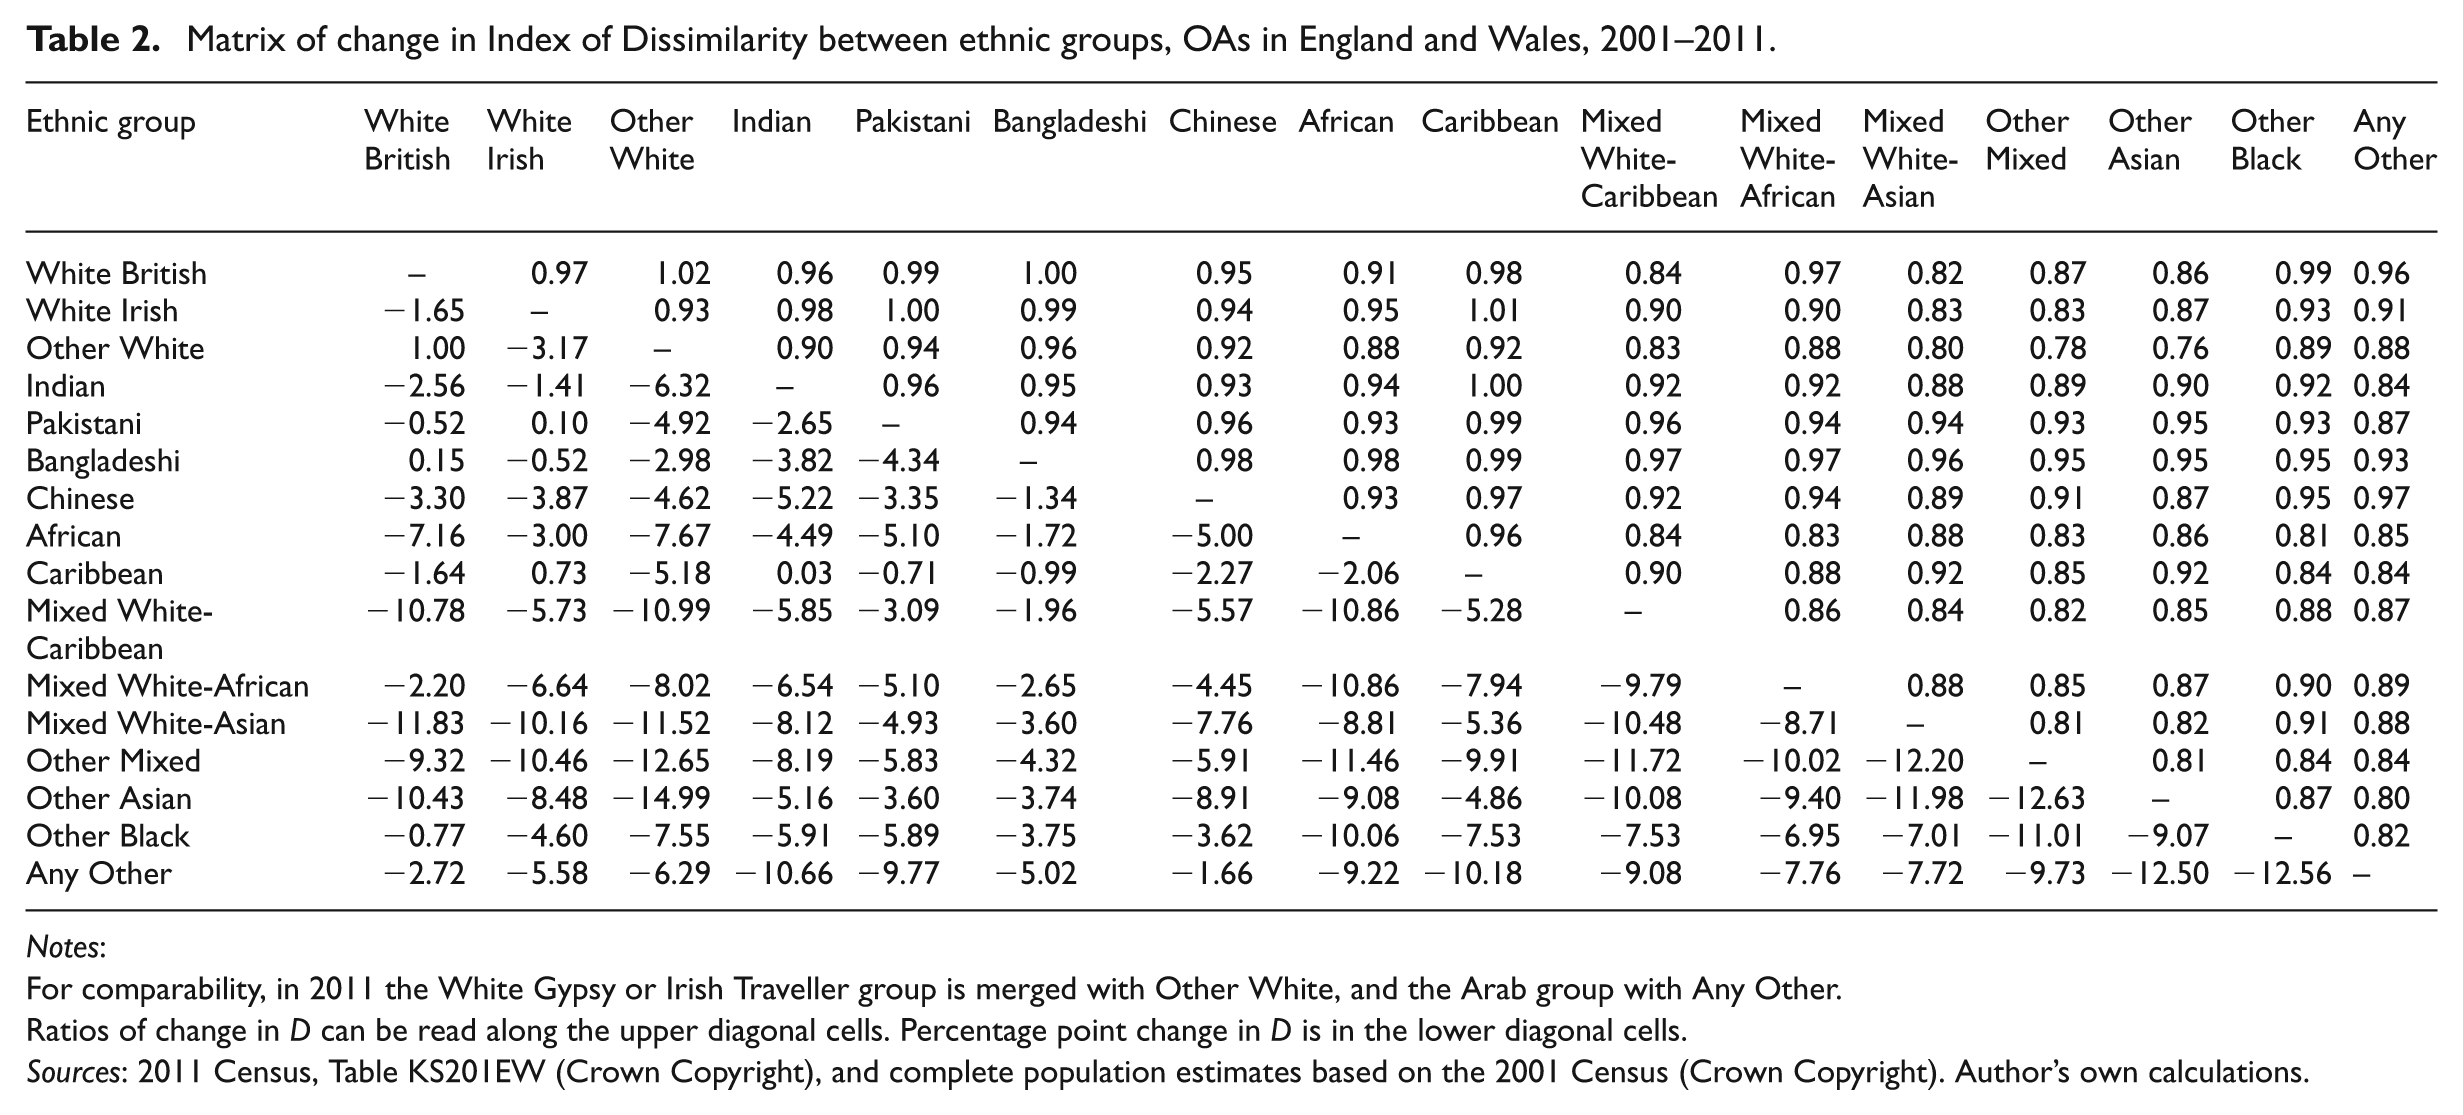
While the analysis so far has followed the common approach of focusing on the spatial separation of one ethnic group compared with the rest of the population, this section explores segregation between individual ethnic groups. Thus, D is computed for each ethnic group compared with every other ethnic group (e.g. the White British group compared with the Bangladeshi group), for all OAs in England and Wales. Table 2 provides a matrix of change in these D values, expressed as percentage point change (lower diagonal) and a ratio of 2011:2001 values (upper diagonal). The ratios represent proportional change and complement the percentage point values. Ratios above one indicate an increase in unevenness between the two given groups over the period, while those below one show a decrease in unevenness.
Matrix of change in Index of Dissimilarity between ethnic groups, OAs in England and Wales, 2001–2011.
Notes:
For comparability, in 2011 the White Gypsy or Irish Traveller group is merged with Other White, and the Arab group with Any Other.
Ratios of change in D can be read along the upper diagonal cells. Percentage point change in D is in the lower diagonal cells.
Sources: 2011 Census, Table KS201EW (Crown Copyright), and complete population estimates based on the 2001 Census (Crown Copyright). Author’s own calculations.
Changes in segregation were relatively modest, although there is a clear pattern of decreasing segregation between ethnic groups since 2001–between the White British and minority ethnic groups, and between each minority group. Segregation did not increase between the Chinese, African, Mixed or Other groups and any ethnic group. Where an ethnic group experienced an increase in segregation, it was between that group and just one or two ethnic groups. The largest ratio of change towards increased unevenness was 1.02, between the White British and Other White (percentage point change 1.00), the next being between the Caribbean and White Irish group (ratio 1.01; percentage point change 0.73). The largest decreases in unevenness were between the groups Other Asian with Other White, Other Mixed and Any Other; Other Mixed with Other White and Mixed White and Asian; and Any Other with Other Black.
The only ethnic groups for which there has been an increased segregation with the White British group are Other White (discussed earlier) and Bangladeshi (ratio change 1.00; percentage point change 0.15). The usual practice of comparing one ethnic group with all others provides a useful summary, however ‘all others’ are an aggregation of heterogeneous groups which reside in different geographical locales. This means that the segregation value for the White British group (and thus the population other than White British as a whole, given that this measure of segregation is symmetrical) may increase, while White British-individual minority group segregation decreases. This scenario appears contradictory, but it is explained by the co-residence of minority ethnic groups in the same neighbourhoods. Where two or more minority ethnic groups are found in the same neighbourhoods, but the share of the White British ethnic group is relatively small in these areas, the segregation value for White British in relation to all others will be more than the value for the White British in relation to any minority group individually.
Discussion and conclusions
The problematisation of minority ethnic clusters in the UK was, at least in part, an outcome of a political and policy rhetoric in the early 2000s which suggested the self-segregation of minorities in certain local neighbourhoods – a sentiment which has lingered beyond more direct policy interventions (Phillips et al., 2014; Robinson, 2005) and impacted upon how diverse neighbourhoods are perceived (Finney and Simpson, 2009a). The 2011 Census revealed a growth of ethnic diversity in England and Wales in the early 2000s (Catney, 2015), and this paper shows how this has been accompanied by greater residential ‘integration’. Spatial unevenness was measured here for the smallest Census areas using the commonly applied Index of Dissimilarity. Results indicated a decrease in the geographical unevenness of minority ethnic groups in their residential locales, particularly in urban locales more traditionally associated with high diversity, and, in politicised debate, with high segregation. A matrix of change in unevenness for every ethnic group combination demonstrated how there is less segregation between nearly every minority group, and between minority and majority groups. While focusing specifically on the case of England and Wales, the findings presented make a wider contribution by disturbing the association of increasing ethnic diversity with increased ethnic divisions in (particularly urban) space.
This paper began with a reference to the heavily critiqued claim that Britain had sleepwalked its way into segregation, 6 and the counter-claim that the more banal processes of demographic change (fertility, mortality and migration) had together created greater residential mixing (Finney and Simpson, 2009a, 2009b). The Index of Dissimilarity does not explain why segregation might persist or change over time, but with careful interpretation it can hint at these processes. As Peach (2009: 1384) outlines, D is ‘effective both as a diagnostic and predictive measure of inter-ethnic relations and as an analytical tool in understanding the dynamics of social interaction’. Academic analyses to date have been fairly united in their conclusion that internal migration (between regions and neighbourhoods but within national boundaries) is a key player in the dispersal of minority ethnic group urban concentrations in Britain (Gale, 2013; Rees and Butt, 2004; Simpson, 2004; Simpson and Finney, 2009; Stillwell and Phillips, 2006). While at the time of writing 2011 Census internal migration data by ethnic group had not been released, one can be confident that such residential changes will have been a major factor in altering the ethnic make-up of neighbourhoods. Recent research has evidenced the growth and spread of ethnic diversity into new locales, as it becomes ever more commonplace in the socio-cultural landscape (Catney, 2015) – an outcome of a combination of internal migration and new immigration streams to suburban and rural areas following opportunities in the labour market (Lymperopoulou, 2013) and asylum dispersal strategies.
In addition, segregation might be high in some areas because of a spatial unevenness between the White British and minority populations which, if the former group leaves (through mortality or out-migration), might lead to decreased minority segregation (Harris, 2014). Preliminary analysis of change in D values presented here for each ethnic group and percentage change in the White British population suggests only a weak relationship. The only notable exception to this is the Bangladeshi group, for which the districts which met the population threshold are largely highly urban and many are London-based. As Harris (2014) demonstrated, reduction in unevenness for some groups is partly a function of White British population loss, but this does not explain the widespread reductions in segregation observed between 2001 and 2011. Future work (particularly through analysis of internal migration) could untangle the relative contributions of the possible processes of minority outflow from concentrations and White British loss from more diverse places, to these changing patterns of segregation.
The introductory sections highlighted the complex interplay of forces for change in ethnic geographies, and the choices and constraints which may act to reinforce or erode residential segregation. Initially high segregation by immigrants is an expected starting point, but concentrations may persist between generations as a result of barriers to upward spatial mobility. As an example, ethnic inequalities in housing tenure (Finney and Harries, 2015) will inevitably impact upon residential geographies, reflecting housing supply, and limiting the opportunity for spatial (and other forms of) mixing. Despite improvements in housing policy and provision, constraints in housing choice and stereotyping still operate (Reeve and Robinson, 2007). These factors, coupled with the direct and personal experiences of racism within some rural communities (e.g. Garland and Chakraborti, 2006), will influence feelings of safety and inclusion, and in turn affect the settlement patterns of marginalised people who cluster in refuge from the threats of racism. Persistent inequalities in the labour market (Catney and Sabater, 2015) will inevitably lead to barriers in progression up the housing ladder and minimise neighbourhood options.
The intersectionality between ethnicity, gender, age, migrant status, socio-economic position and opportunity, religion and a host of other factors will of course be important in explaining the causes and consequences of barriers to migration. The measurement of segregation via indices such as presented here are not equipped to test questions of migration equality, however the results offered in this analysis provide evidence of a fairly measured but steady spatial ‘integration’ between ethnic groups. The immigrant settlement areas discussed at the start of the paper will continue to have an important role and that is where co-ethnic concentration would naturally be expected to be highest. A combination of migration (by minority and majority groups), constraints to this mobility, neighbourhood preferences, plus the balance of fertility and mortality, will have operated together to create the patterns of segregation and change observed in this paper. While these factors cannot be disentangled here, the decreases in segregation evidenced provide support for the somewhat ‘every day’ and benign processes of ‘sleepwalking into de-segregation’, rather than a cause for concern over increasingly entrenched neighbourhoods.
A number of policy recommendations might be drawn from the issues raised in this paper. New geographies of ethnic diversity suggest a need for practical, positive and sensitive support for immigrant arrivals (for example, language support and information on housing opportunities), for ‘pioneer’ internal migrants to less diverse locales (for example, in countering racism), and for existing residents who may be experiencing community change in traditionally ‘White’ neighbourhoods (for example, in promoting mutual tolerance and trust between communities). However, there are also policy challenges about facilitating spatial mobility. While particular locational outcomes should not be seen as a goal for ethnic minorities, which would run dangerously close to sentiments of spatial assimilation (see Wright et al., 2005, for a critique), where housing and locational preferences cannot be met we might understand this as a form of spatial inequality between ethnic groups. In turn, these processes and their outcomes need further academic attention in order to better understand the mechanisms behind changing ethnic geographies and their consequences.
This paper has focused on one form of segregation: unevenness across space. Additional measures (in particular, the degree of ‘exposure’ between members of one ethnic group and another; Massey and Denton, 1988) would provide fuller understandings of changing inter-ethnic interactions. Mixing between ethnic groups can take place in many spheres of life – living next door to a person of a different ethnic group is not the only (nor indeed necessarily best) measure of inter-ethnic social interactions; people may mix more ‘meaningfully’ outside their own neighbourhood context, in the workplace, schools, social settings, or even in cyber-space. The different possibilities for socio-cultural interaction are increasingly complex and challenging to capture, but represent opportunities for enhanced inter-community mixing and social relations.
Footnotes
Acknowledgements
Thanks to the University of Manchester editorial team for the Centre on Dynamics of Ethnicity (CoDE) Census Briefing series, for comments on an allied briefing which fed into this paper, in particular to Stephen Jivraj, Ludi Simpson and Nissa Finney. Thank you to Stephen Jivraj and Ludi Simpson for the provision of ethnic group population estimates for 2001 output areas, and 2011 urban-rural area classifications. Stephen Jivraj is also thanked for providing cartogram shapefiles. The anonymous reviewers are thanked for their insightful comments on an earlier draft of this paper. Census output is Crown copyright and is reproduced with the permission of the Controller of HMSO and the Queen’s Printer for Scotland.
Funding
This research was undertaken as part of the author’s Leverhulme Trust Early Career Fellowship. Sincere and grateful thanks to the Leverhulme Trust for funding for the project ‘Geographies of Ethnic and Social Segregation in England and Wales, 1991–2011’ (ECF–2011–065).