
Abstract
Extending Small and McDermott’s ‘conditional perspective’, Blalock’s minority competition theory is used to explain how the relationship between African Americans and the number of supermarkets in a zip code depends on the city in which it resides. The 2010 American Community Survey and ZIP Business pattern data are examined with hierarchical general linear models to explore whether the previously observed negative relationship between the percentage of African Americans and the number of supermarkets in a zip code depends on the percentage of African Americans in the city. The results show that the relationship between the percentage of African Americans and the number of supermarkets depends on the percentage of African Americans in the city in the U-shaped pattern predicted by minority competition theory. Applications of minority competition to other theories of the unequal distribution of resources in cities are discussed.
As the main provider of groceries (US Census 1997), supermarkets are a major component of modern life. As a result, the disadvantages communities face when lacking supermarkets can be far reaching. Being one of the largest employers in the USA, supermarket placement patterns affect the job prospects of nearby residents (Strait, 2001). Supermarkets also provide public spaces for the maintenance of informal social ties (Oldenburg, 1989) and, similar to other signs of disorder, lacking supermarkets may help to stigmatise a neighbourhood (Eisenhauer, 2001).
Currently, the most discussed problem resulting from a lack of supermarkets is the effect on health. Known colloquially as the ‘food desert’ literature, a large body of research has shown that residents of ‘food deserts’ 1 tend to have worse health outcomes including higher rates of obesity, cardiovascular disease and diabetes (e.g. Franco et al., 2009; Lopez, 2007; Michimi and Wimberly, 2010; Morland and Evenson, 2009; Powell et al., 2007; though see Block et al., 2011; Boone-Heinonen and Shikany, 2011). Exacerbating the problem of access to healthy food, those in areas with limited access to supermarkets pay more for their food (Chung and Myers, 1999). Concerns over inequalities in the ‘food environment’ have fostered non-profit (e.g. Social Compact, Market Makeovers, Nashville Mobile Market) and city government (e.g. Birmingham, Detroit, Los Angeles) efforts and have raised questions surrounding the issue of ‘food justice’ (Alkon and Norgaard, 2009).
Previous research on ‘food deserts’ has shown that supermarkets are more common in central city locations and less common in areas with higher rates of poverty and a higher proportion of African Americans (c.f. Beaulac et al., 2009; Larson et al., 2009; Lovasi et al., 2009; McKinnon et al., 2009). This research tends to assume or imply that these neighbourhood demographics are the cause of supermarket locations. Similarly, policy-makers tend to assume that in order to attract supermarkets to underserved areas one must either change the areas’ demographics or artificially differ the negative consequences of these demographics on supermarket profits (e.g. Anderson, 2007; Karpyn et al., 2012; Pothukuchi, 2005). By assuming demographics cause supermarket location, the ‘food desert’ literature (and related policy) lacks an understanding of the broader causes of the relationship between demographics and supermarket location; the lack of understanding of the broader causes of these relationships may be most striking for the non-economic negative relationship between African Americans and supermarkets.
The dynamics of the city in which a neighbourhood resides provides an opportunity to understand the broader causes of the relationship between neighbourhood demographics and supermarket location. Small and McDermott (2006) present a ‘conditional perspective’ of organisation placement patterns, arguing that the relationship between neighbourhood demographics and organisation location depends on the characteristics of the city. Using 2000 national data, Small and McDermott (2006) show that the zip code placement patterns of 10 organisations (including supermarkets) in relation to the rate of poverty of the zip code depends on which region of the USA the city is in and the poverty rate of the city as a whole.
Focusing on supermarket location patterns, this paper extends Small and McDermott’s (2006) ‘conditional perspective’ to the finding that higher percentages of African Americans in a neighbourhood leads to fewer supermarkets. Applying Hierarchical General Linear Modelling to ‘geocoded’ census 2010 national data, this paper examines whether the relationship between the number of supermarkets and the percentage of African Americans in a zip code depends on the city in which the zip code resides. In answering this question, it is suggested that ‘minority competition theory’ (Blalock, 1967) helps explain how city characteristics (specifically, the percentage of African Americans in the city) moderate the relationship between the percentage of African Americans and number of supermarkets of a zip code.
Minority competition theory
Perhaps known more widely as racial threat theory, Blalock (1967) proposed minority competition theory as a way to describe how macro-level processes affect motivations to discriminate which, in turn, affects racial inequalities. Research on minority competition has typically focused on the affect of the percentage of minorities on punishment practices (also called punishment power by Blalock). While not universally supported, minority competition theory 2 has found that increases in the percentage of minorities relates to such phenomena as support for punitive policies (Jacobs and Carmichael, 2002; King and Wheelock, 2007), interracial killings (Jacobs and Wood, 1999), high school punitiveness (Welch and Payne, 2010) and disenfranchisement (Behrens et al., 2003). Despite the large body of punishment-related research there are few studies on the impact of minority competition on the unequal distribution of resources across groups.
Minority competition theory can prove useful in studies of neighbourhood resource disparities. Minority competition theory is a three-part process. First, the majority gives little attention to minorities when their population is small; however, as the minority population grows, the majority will increasingly perceive this minority as a threat to neighbourhood resources. These neighbourhood resources could include street renovations, school funding, fire departments or, as focused on here, needed retail establishments such as supermarkets. One limitation of this study is the lack of measures of motivations to discriminate. Possibilities for future conceptualisations of how minority competition motivates discrimination against investing in neighbourhoods with a high percentage of minorities are presented in the conclusion. Despite not having empirical measures of discrimination – while measures of motivations to discriminate should be desired where available (e.g. Quillian, 1996; Stults and Baumer, 2007) – Blalock (1967) argues that by studying how the percentage of minorities relates to unequal outcomes between groups we can infer how discrimination occurs (also see Behrens et al., 2003; Jacobs and Carmichael, 2002; Welch and Payne, 2010).
Second, as the majority increasingly perceives the minority as a threat to neighbourhood resources they will increasingly use discriminatory means to push these resources away from minorities. These discriminatory means may come in a variety of forms: For example, stronger majority political coalitions and activism that push neighbourhood resources away from minorities (Blalock, 1967: 74, 106–108), increased concern that commercial development projects should be located away from minorities or increased labelling and stigma of ‘minority coded’ businesses (e.g. Blalock, 1967: 107; Sullivan, 2014). Again, this paper lacks measures of the specific forms of discrimination that push resources away from minorities (though possibilities are discussed in the conclusion). 3
Third, the increased discrimination that pushes neighbourhood resources away from minorities leads to greater disparities in neighbourhood resources. The factors that mediate the effect of minority competition on neighbourhood resource disparities provide fertile ground for future research. This paper simply investigates whether minority competition (in the form of the racial composition of a city) affects the negative relationship between African Americans and supermarkets in the way predicted by minority competition theory.
In essence, minority competition theory argues that as a minority group becomes a greater threat to the resources of the majority group, this majority group will increasingly use discriminatory means that keep resources away from this minority. While there are other factors involved in the threat minorities pose to the majority, a higher percentage of minorities is largely understood as the primary way minorities will provoke a perceived threat in the majority. However, since discrimination is cumulative, as the percentage of minorities grows the minority group will become less of a threat (because of their greater handicap). For example, a 5% minority increase will create a greater degree of inequality going from 10% to 15% compared with 30% to 35% (Blalock, 1967: 147–150). Continuing with this idea, as others have noted (e.g. Horowitz, 1985; Turk, 1969), as the percentage of minorities becomes large (non-descript), they will be able to gain at least a marginal ability to attenuate the already high effects of discrimination. 4 As such, minority competition theory predicts a non-linear relationship (a decreasing then slightly reversing slope) between the percentage of minorities and inequality.
Although it was also theorised to predict unequal economic outcomes, minority competition research incorporating economic indicators tends to use them as causal variables of motivations to discriminate: also known as ‘economic threat’ (e.g. Eitle et al., 2002; King and Wheelock, 2007; Parker et al., 2005; Stults and Baumer, 2007). The minority competition theory elaborated by Blalock conflates economic indicators as both causes of motivations to discriminate and as outcomes of the competitive threat minorities provoke that motivate discrimination. Though future theorising should attempt to do so, this paper does not elaborate how to separate economic indicators as causes and effects of motivations to discriminate. Instead, it is simply argued that the minority competition process can prove useful when examining causes of the unequal distribution of resources across neighbourhoods.
The aim of this study is to suggest that minority competition processes affect racial inequalities in neighbourhood resources. The focus here is on supermarkets because of the influence supermarket locations have on communities and its residents. Research on supermarket placement has focused on neighbourhood demographics as causal variables finding that, among other things, a higher percentage of African Americans will decrease the number of supermarkets in an area. However, it is suggested here that this relationship between the percentage of African Americans and number of supermarkets in a neighbourhood is contingent upon city minority competition dynamics. Specifically, it is hypothesised that the effect of the percentage of African Americans on the number of supermarkets in a zip code depends on the (non-linear) competitive threat of African Americans in the city in which the neighbourhood resides: an increase in the percentage of African Americans in a city will increase the negative relationship between African Americans and supermarkets in the zip codes of a city, though this increasing effect will slow and even somewhat decline at higher levels.
Method
Summary statistics for the variables used in this study are presented in Table 1. The level 1 unit of analysis is the five-digit zip code, which is to be preferred over smaller geographic units such as census tracts for economic activity (Bingham and Zhang, 2001; Small and McDermott, 2006). 5 Data for the number of supermarkets in a zip code come from the Census 2010 ZIP business patterns. The North American Industry Classification System (NAICS) code 445110 for ‘Supermarkets and Other Grocery (except Convenience) Stores’ is used in this study. While the NAICS separates convenient stores from grocery stores and supermarkets, many of the stores in NAICS 445110 may be conceptually similar to convenience stores (i.e. they do not sell fresh produce). For example, Horowitz et al. (2004) found that only 18% of small grocery stores in predominantly racial minority neighbourhoods sold healthy foods. Further, a lack of larger supermarkets (compared with small groceries) has been associated with higher grocery prices (Chung and Myers, 1999). Given the suspect availability of fresh produce at average market prices in smaller grocery stores, this study only looks at stores with over 20 employees. Though not formally presented in this paper, a measure of stores with over 50 employees was also used (c.f. Alwitt and Donley, 1997; Moore and Diez Roux, 2006) which led to similar results. Differences in models using stores with over 50 and over 20 employees are noted in the results.
Summary statistics.
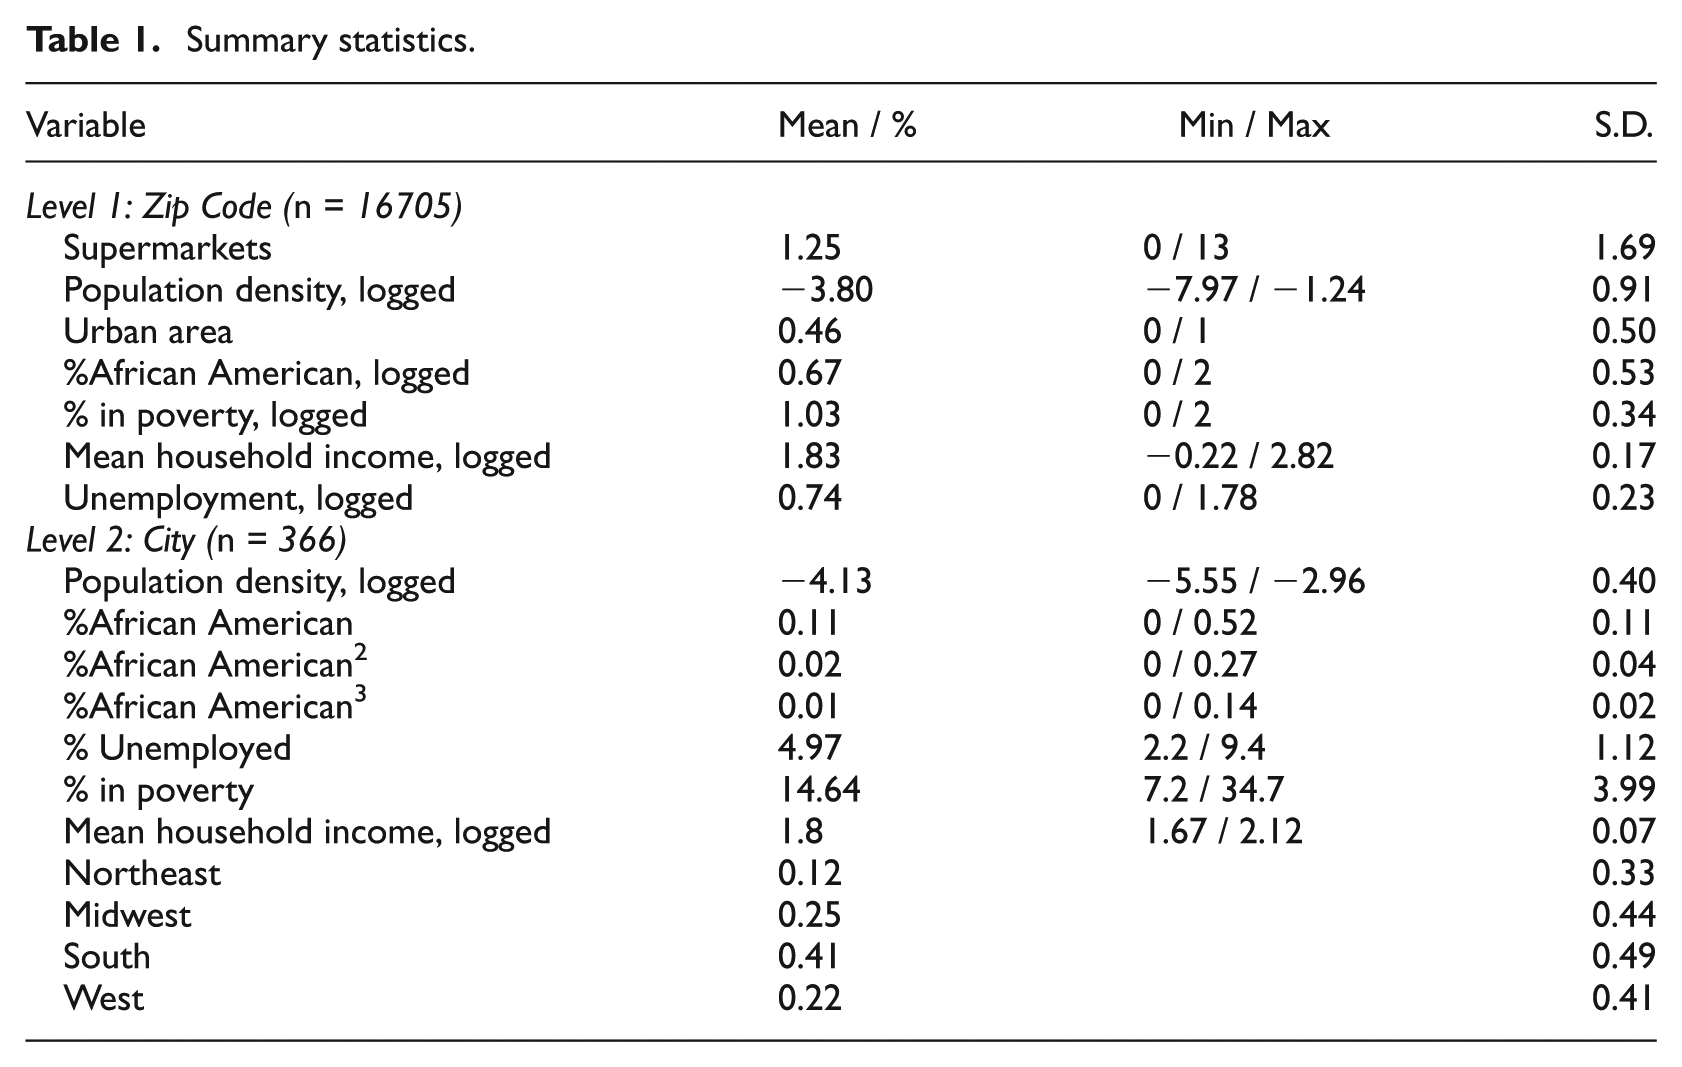
Data for the level 1 and level 2 independent variables come from the 2007–2011 American Community Survey 5-year estimates. The level 1 variables are at the ZIP Code Tabulation Area (ZCTA) level (n = 16690).
6
The level 2 variables are at the metropolitan statistical area (MSA) level (n = 366). MSAs are
The percentage of African Americans is the main level 1 variable of interest in this paper. Central city location (binary) and population density (population divided by area) are also included in the models analysed. 8 Given the concern over economic variables explaining the relationship between African Americans and supermarket location I use three different economic measures: (1) percent unemployed (2) percent in poverty and (3) mean household income of a zip code. Owing to a high correlation between poverty and household income I use two models: one with poverty (model 1), one with household income (model 2). Modelling unemployment separately did not change the results so I include unemployment in both models.
This study largely follows the level 2 control variables used in the only other paper to investigate city effects on the neighbourhood resources organisations provide (Small and McDermott, 2006). One addition here is mean household income (modelled separately from poverty). Again, I use these three economic variables – percent in poverty, mean household income and percent unemployed – to control for the effect of economics while measuring the effect of the percentage of African Americans. Other level 2 control variables include population density and a categorical variable for region with the following common categories: Northeast, Midwest, West and South (the reference category). The main level 2 variable of interest is the percentage of African Americans in the city. As is common in investigations of minority competition theory, quadratic terms are used with percentage African American to identify the non-linear (U-shaped) relationship predicted by minority competition theory.
Many of the variables analysed are highly skewed with distributions resembling a Poisson distribution. Given their highly skewed distributions I used the logarithm of many variables, adding a constant when the variable contained zeros (e.g. King and Wheelock, 2007). Logarithms make variables less interpretable but, in this case, model fit takes precedence. 9 Every level 1 variable (except central city location) is logged. MSA (level 2) mean household income and population density are also highly skewed so I use the logarithm of each. MSA unemployment and poverty are normally distributed. MSA percent African American is not normally distributed but it is transformed with a quadratic for theoretically important reasons.
Given the skewed distribution of supermarkets all models are estimated as a Poisson distribution with over-dispersion (Raudenbush and Bryk, 2002). Level 1 variables are group mean centred to allow for truly separate analyses of level 1 relationships and the moderation of these relationships by level 2 variables (Enders and Tofighi, 2007). Also, all level 2 predictors are entered at both the random percent African American slope and the intercept to parse out their unique effects, which may be correlated otherwise (Raudenbush and Bryk, 2002: 151).
Results
Table 2 presents the logged odds from models with only zip code (level 1) predictors. Model 1 controls for percent poverty while model 2 controls for mean household income. The significance and directions of population density, central city location and mean household income on supermarket placement is consistent with previous research. Unemployment and the percent of people in poverty are both significant but positive. For example, for every 10% increase in the percent in poverty in a zip code, there is a 15% increase (e 0.141) in the number of supermarkets. However, the positive relationship between poverty and supermarkets is not robust: using grocery stores with over 50 employees instead of over 20 leads to a negative percent poverty slope (though the positive relationship between unemployment and supermarkets remains).
Fixed effects of zip code characteristics on the number of supermarkets.
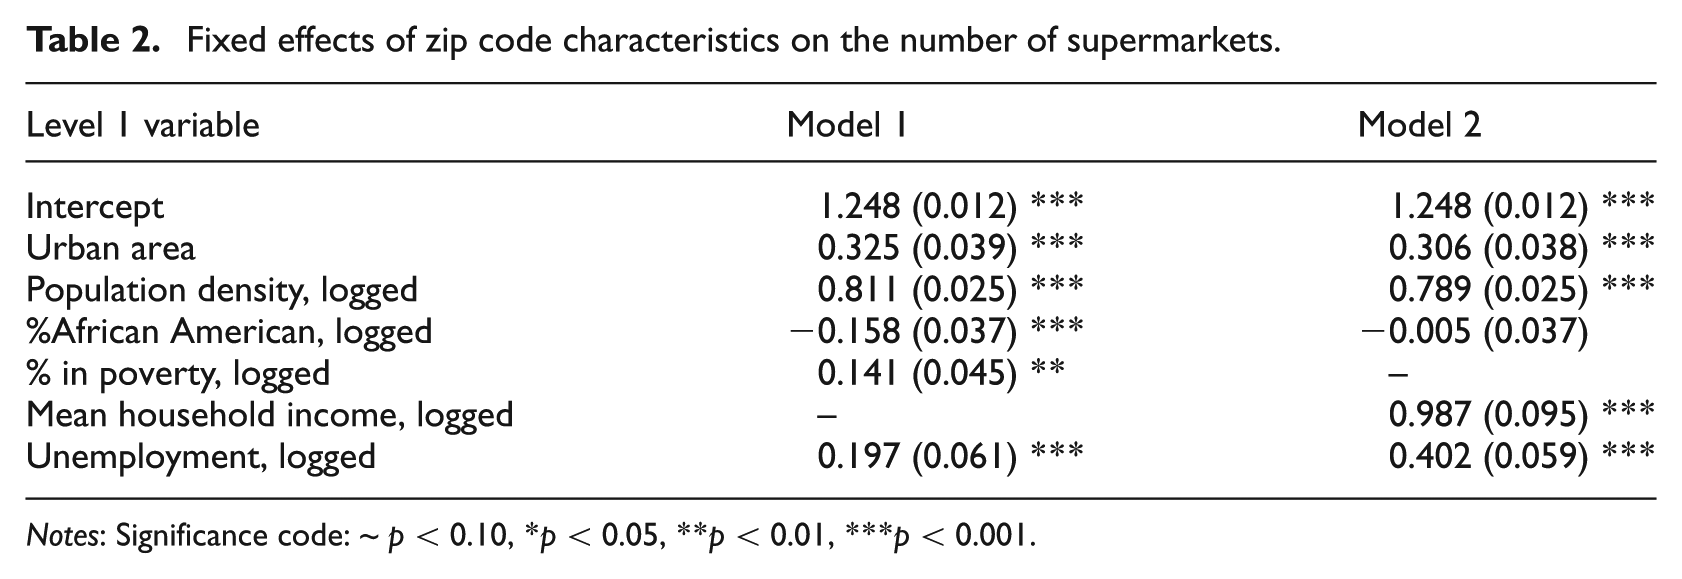
Notes: Significance code: ~ p < 0.10, *p < 0.05, **p < 0.01, ***p < 0.001.
The main variable in this analysis – the percent of African Americans in a zip code – is statistically significant and negatively related to the number of supermarkets when controlling for percent in poverty (Model 1). When controlling for mean household income percent African Americans is not significant. However, the non-significance of percent African American is not robust: using stores with over 50 employees leads to a significant and negative percent African American slope. (Outside of the noted variations, models remain substantively the same when using stores with over 50 employees).
Table 3 presents the logged odds from the multilevel Poisson model predicting the number of supermarkets in a zip code. 10 Model 1 controls for percent poverty while model 2 controls for mean household income. Both the level 1 intercept and the level 1 slope of percent African American in a zip code are random with level 2 predictors. Looking at the predictors of the random intercept, city population density significantly (positively) predicts the number of supermarkets per zip code in a city. Also, a higher unemployment rate leads to more supermarkets in a city. Further, household income and percent in poverty are not significant at the intercept. However, these effects of city-level economics on supermarket location are not robust: when using stores with over 50 employees unemployment is no longer significant while poverty (negative) and household income (positive) become significant at the random intercept. Though tangential to this paper, these results suggest the importance of theoretical specificity when measuring the affects of different economic indicators on different types of neighbourhood resources. 11 Finally, the region variable shows that there are more supermarkets per zip code in the West compared with any other region, followed by the South, Northeast and Midwest. This difference by region may reflect the more recent (post-1970s) growth of Southern and Western MSAs that grew alongside a US economy oriented towards service industries (compared with the older MSAs of the Northeast and Midwest that grew under a manufacturing oriented economy) (e.g. Small and Newman, 2001; Strait, 2001; Wilson, 1987).
Effects of zip code and MSA variables on the number of supermarkets, random intercept and %African American slope.
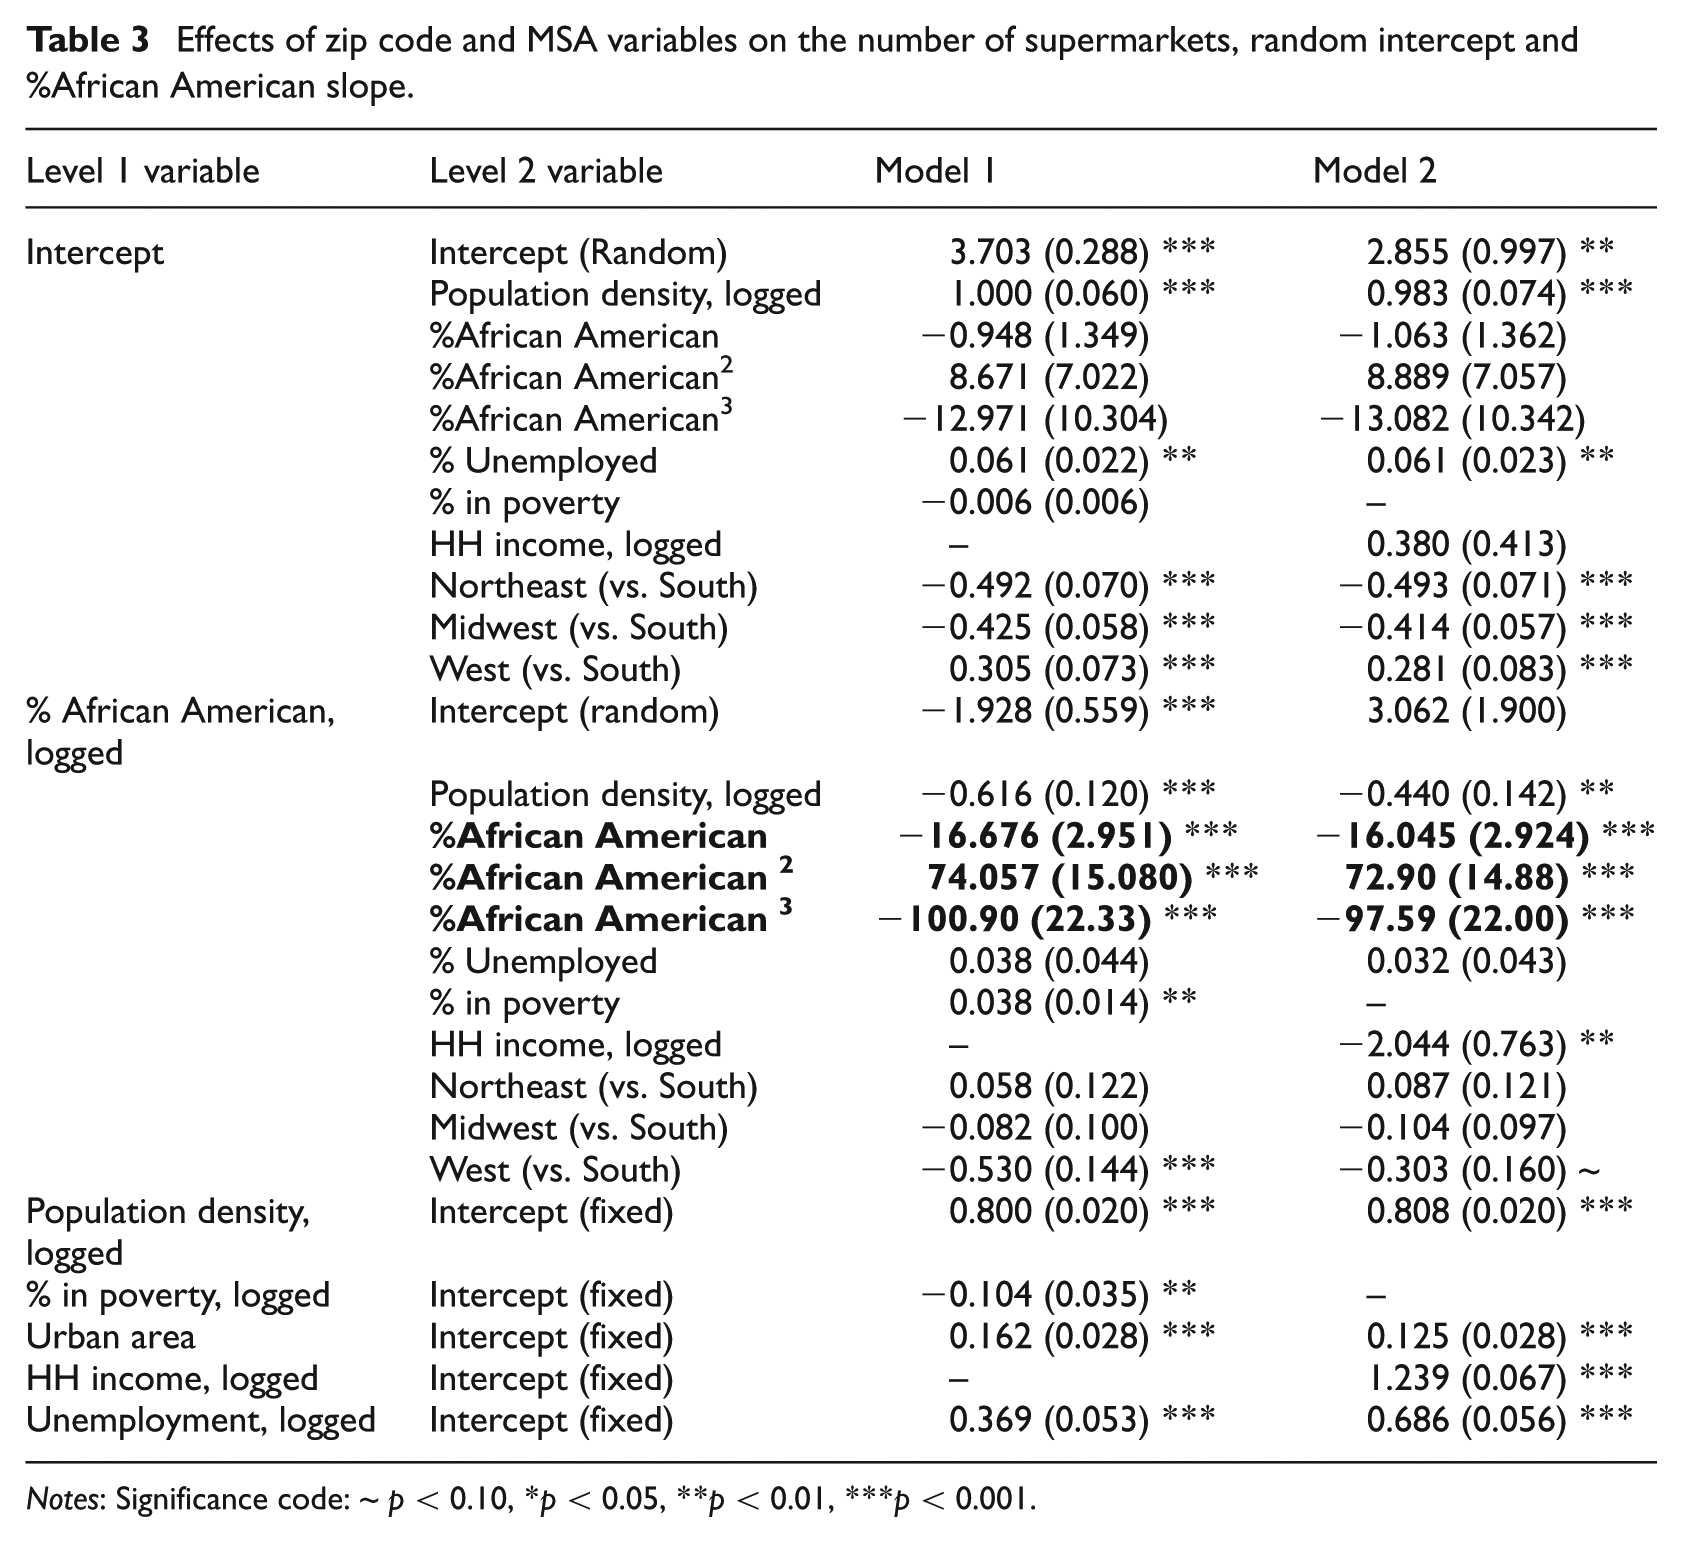
Notes: Significance code: ~ p < 0.10, *p < 0.05, **p < 0.01, ***p < 0.001.
Table 3 also presents the level 2 predictors of the relationship between the number of supermarkets and percentage African Americans in a zip code. Looking at the predictors of the percent African American slope, city population density is significant and negative in both models. The percent in poverty and household income are both significant: less poverty and more mean household income in a city means fewer supermarkets in zip codes with more African Americans. These results suggest that supermarkets are more likely to avoid predominantly African American zip codes in more affluent and more densely populated cities.
The primary focus of this paper is whether and how the percentage of African Americans in a city moderates the relationship between the number of supermarkets and percentage African Americans in a zip code. Table 3 demonstrates the relationship suggested by minority competition theory. For both model 1 and model 2 the level 1 percent African American slope is significantly and non-linearly moderated by the percentage of African Americans in the city. Figure 1 further elaborates the non-linear moderation of the percentage of African American in the city on the relationship between the percentage of African Americans and number of supermarkets in a zip code. (Figure 1 uses the results from model 2, though using model 1 leads to a nearly identical graph). Figure 1 graphs the slope of the percentage of African Americans on the number of supermarkets in a zip code across different levels of the percentage of African Americans in a city. At very low percentages of African Americans in a city, the negative slope is small. The negative slope is largest at medium levels of percent African American in the city. After 17% African American in the city (the inflection point), the negative slope begins to decrease slowly. Finally after around 33% African Americans in the city the slope again becomes increasingly negative; however this last point is less meaningful since less than 6% of MSAs have a percentage of African Americans over 33% (and less than 2.5% have over 40%).
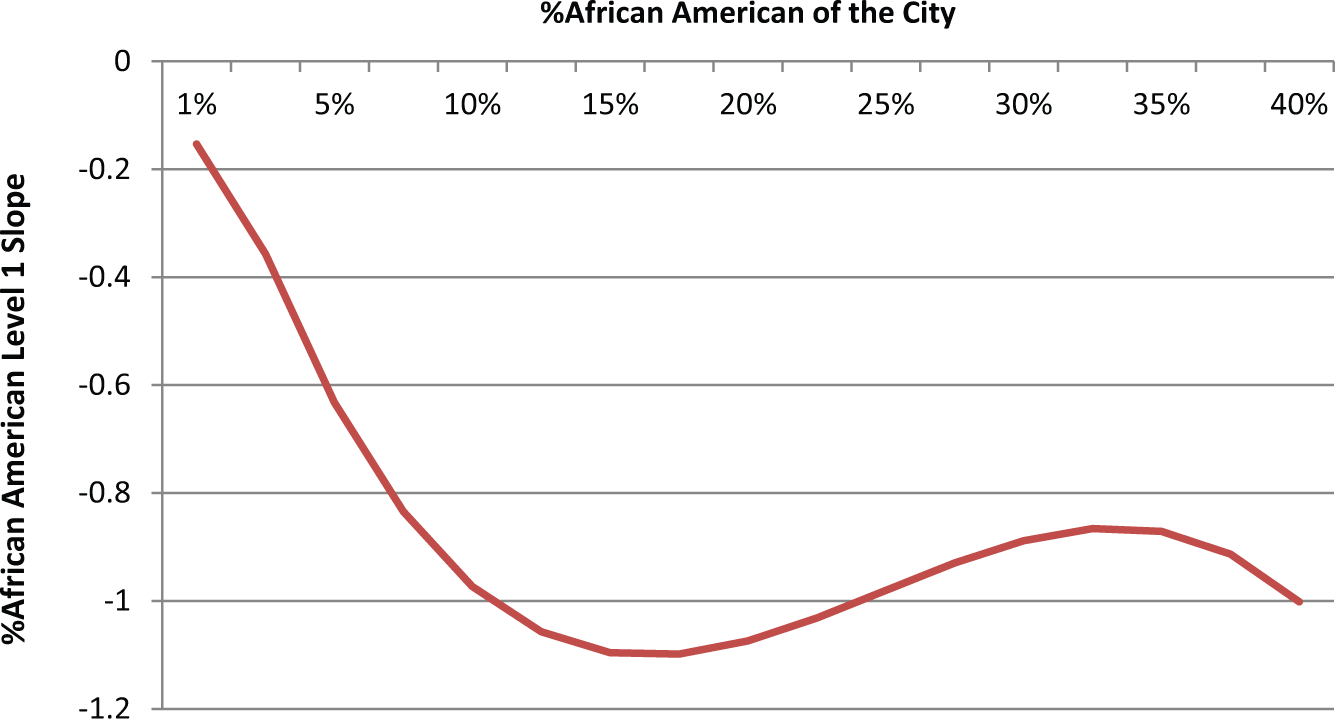
The Level 1 %African American Slope Depends on the %African American of the City
Discussion
This paper extends Small and McDermott’s (2006) ‘conditional perspective’ of ‘neighbourhood effects’ by investigating whether the relationship between African Americans and supermarkets in a zip code is moderated by the city-wide percentage of African Americans in the way predicted by minority competition theory (Blalock, 1967). Consistent with previous research on supermarket placement patterns, the results show a negative relationship between the percentage of African Americans and number of supermarkets in a zip code. However, the variation between cities in this percent African American slope is statistically significant: the relationship between the percentage of African Americans and number of supermarkets in a zip code depends on the city in which the zip code resides.
The minority competition theory predictor – the percentage of African Americans in a city and its quadratics – significantly predicts the between-city variation in the African American slope. Reinterpreting the results in terms of minority competition theory, the results suggest that at low levels of African Americans in a city there is low perceived threat and low inequality in the placement of supermarkets. As the percentage of African Americans in the city increases, supermarkets are increasingly located away from African Americans; however, at high levels of African Americans in a city, the increasing unequal distribution of supermarkets away from African Americans declines – theoretically because of the cumulative effect of discrimination and the increased ability to somewhat attenuate discrimination when numbers are high. These results indicate that, at least for supermarkets, minority competition theory can prove useful in explaining how city dynamics moderate the location of organisations away from African Americans.
Conclusion
This article primarily extends the conditional perspective of ‘neighbourhood effects’ elaborated by Small and McDermott (2006) to the effect of the percentage of African Americans on the number of supermarkets. The article is also a call to incorporate minority competition theory into studies of the location of neighbourhood resources away from African Americans. As noted, previous studies of minority competition tend to take the economic resources of minorities as a potential cause of perceived threat. Extending minority competition theory is somewhat problematic because of its conflation of economic resources as both a cause and effect of the perceived threat of competition by the majority. Future theorising and research should attempt to separate economic resources as cause or effect. Different measures of perceived economic threat and the actual distribution of resources may be helpful. Longitudinal studies will likely provide the best opportunity for examining whether increases/decreases in the economic resources of a minority group precede or proceed perceived threat.
Along the lines of investigating causes of perceived threat and inequality, Quillian (1996) argues that a true test of minority competition theory should incorporate the mediating effect of individual beliefs about threat (which leads these individuals to take discriminatory action). Such measures of perceived threat may include concerns over losing neighbourhood resources or that neighbourhood resources will become unavailable to them as they increasing locate near minorities. This paper lacks the discrimination/prejudice component of the minority competition model that future research will hopefully provide.
Further, the specific mechanisms of how discrimination occurs should be examined: As the majority begin to take notice of a growing minority population as a threat to their resources, what discrimination will result? Two methods of discrimination seem most likely. First, the majority may increasingly use political (e.g. coalitions or activism) or civic avenues (e.g. networks or economic development initiatives) to steer resources away from the minority (e.g. Blalock, 1967: 74, 106–108). Second, the majority may increasingly undervalue (or even disdain) resources located near the minority: understanding resources near minorities as ‘not their own’ and/or inferior to resources located near the majority (e.g. Blalock, 1967: 107; Sullivan, 2014; Sullivan and Shaw, 2011). Increases in concerted efforts to push neighbourhood resources away from minorities, along with the undervaluing of resources located near minorities, would magnify resource inequalities.
Even more, the actors involved in minority competition dynamics should be empirically elaborated. While measures of individual prejudice and discrimination are certainly apt, the perceived threat of minorities by the majority may or may not reflect the attitudes of individual residents (Blumer, 1958). The effect of city racial composition on resource disparities may be mediated by broader discriminatory processes – for example, through a culture of minority threat in the city. For instance, a culture of minority threat may provoke a heightened sense of privilege in the majority (that predominantly majority areas deserve comparatively more resources) (Blumer, 1958), a heightened collectively understood stigma of minority dominant areas and their resources (Anderson, 1990; Blalock, 1967: 107), a built environment that portrays minority dominant areas and the resources therein as inferior (Caldeira, 2001), or a more salient attitude that, since others are prejudiced, home or store sales will suffer where minorities are more common.
Further, when investigating those who discriminatorily react to the perceived threat of a minority group, urban regime theory (Stone, 1989) and urban political economy (Logan and Molotch, 1987) may provide avenues for future research. Both urban regime and urban political economy theory look past the demand-based, pluralist view of the distribution of resources. Instead, these theories focus on elite coalitions and ‘growth machines’ that construct and organise the city in ways that serve their particular interests. In large part, these theories ignore the independent effects of racial dynamics, viewing race as one component to consider in the pursuit of the economic interests of those who govern (Kraus, 2004). As a group conflict theory in its own right, minority competition theory can be studied along with these theories to investigate the unequal distribution of resources in cities. One possibility is that minority competition affects elites through the perceived distinctness of a minority group when their numbers are large (Blumer, 1958). For example, when the percentage of African Americans grows larger, efforts attempting to foster growth may treat African Americans as a group distinct from – and increasingly threatening to – the mainstream ‘growth machine’ projects. Further, there may be an interaction between elites and a culture of threat in a city – where elites exploit the majority group’s perception of a minority group threatening their resources, sometimes for the gain of elites, sometimes for the gain of the majority (e.g. see Tomaskovic-Devey and Roscigno, 1996).
Finally, as noted, supermarkets were chosen because of their influence on communities. While the correlates of supermarkets are discussed in this paper, the ways a city can moderate the effect of living in an area with limited access to supermarkets are not investigated. Using a similar methodology, future research might look at city-specific dynamics that moderate the impact of living in an area with limited access to supermarkets (or other detrimental neighbourhood characteristics). For example, community organisations and government efforts to help disadvantaged neighbourhoods may alleviate the stigma or negative health impacts of living in an area without supermarkets. While efforts by cities to bring supermarkets to underserved areas are rare (Pothukuchi, 2005), alternative city-specific initiatives (e.g. see Anderson, 2007; Karpyn et al., 2012) such as subsidies for fruits and vegetable sales in underserved areas or well-funded public transportation and food stamp programmes may also prove a ‘conditional perspective’ of the effect of supermarkets on communities and its residents.
Footnotes
Funding
This research received no specific grant from any funding agency in the public, commercial, or not-for-profit sectors.