



Abstract
Food deserts are associated with lower quality diets and higher obesity rates. One hypothesis for their emergence is that retailers avoid food deserts because demand side factors such as low income limit demand for healthy foods. A competing hypothesis is that supply side factors cause prohibitively high costs of operation for grocers – leading to limited access to healthy foods and thus low expressed demand. The direction of causality has important implications for improving diets and health of food desert residents. This paper analyses Detroit food desert residents’ fresh vegetable purchasing behaviour using data from a non-profit grocer. The evidence confirms that these consumers respond to prices and income similarly to the average American, however, they face a different set of constraints. Both supply and demand side factors are at work – access problems are critical, but even with better access low incomes and other demand side issues limit vegetable consumption.
Introduction
A food desert is often described as a location where there are few to no supermarkets or other retailers that offer fresh fruits and vegetables (FFV) or other healthy food products (Moore and Diez Roux, 2006; Morland et al., 2002). One hypothesis for the emergence of food deserts is that retailers do not locate in food deserts because of demand side factors (Bitler and Haider, 2011). The reasoning is that the local residents are on the lower end of the socio-economic scale and therefore do not have the money to buy healthy foods, do not have the education to understand the importance of healthy eating, and/or for cultural and other reasons simply prefer not to eat healthy foods, especially fruit and vegetables (Bitler and Haider, 2011; Short et al., 2007).
A competing hypothesis is that the lack of expressed demand for healthy foods is largely a consequence of living in a food desert without access to supermarkets. The lack of supermarkets is sometimes explained as the consequence of supply side factors leading to high costs of operating a supermarket (Bitler and Haider, 2011), such as high crime rates, unsatisfactory transport infrastructure, or zoning impediments (Bitler and Haider, 2011; Guy et al., 2004; Short et al., 2007). The paucity of supermarkets in low-income neighbourhoods has been observed by several authors, and the complications they present to the inhabitants are many (Larson et al., 2009; Short et al., 2007). Living in low-income neighbourhoods has been shown to be associated with poor dietary patterns and higher obesity rates (Cassady et al., 2007; Cummins and Macintyre, 2006; Drewnowski and Specter, 2004; Larson et al., 2009). Low availability and poor access to supermarkets in such areas are cited as important reasons for the disproportionately high rates of overweight, obesity, and their comorbidities among low-income populations and certain ethnic minorities in the United States (Larson et al., 2009; Morland et al., 2002).
The literature establishes a direct link between vegetable prices and body mass index (BMI) (Powell and Chaloupka, 2009; Vernarelli et al., 2011). A number of studies show that residents of low-income areas with high rates of obesity pay higher prices, especially for healthy foods (Cummins and Macintyre, 2006; Drewnowski and Specter, 2004). This is of great concern because cost and availability of healthy food may mediate the relationships among neighbourhood environment, diet quality, and obesity. It is well established that fruits and vegetables are under-consumed, and are related to health and wellness issues for all Americans, but the problem is even greater in low income populations of colour, especially African Americans in urban areas such as Detroit (Gallagher, 2007; Grimm et al., 2010).
Residents of food deserts are 23.4% less likely to eat the recommended servings of fruits and vegetables per day than are residents with ready access to affordable fruits and vegetables (Blanchard and Lyson, 2006). The 2010 dietary guidelines for Americans recommends consumption of at least five servings of vegetables and four servings of fruits per day (USDA and HHS, 2010); however, fewer than 1 in 10 Americans meet their recommendations (Kimmons et al., 2009). In 2009, the percentage of adults who consumed three or more servings of vegetables per day was 26.3% (Grimm et al., 2010). This could be aggravated in food deserts where access is also a significant problem.
The debate about the direction of causality – low demand for healthy foods causing food deserts versus limited healthy food access in food deserts causing low expressed demand – has important policy implications for improving diets and health of low-income, inner-city residents. Weatherspoon et al. (2013) state that part of the issue is the lack of understanding of urban food desert consumers by retailers of all sizes and organisational structure. There has been a dearth of economic analysis of the consumer history, trends, and limitations that would assist retailers in tailoring their formats to enhance the offerings of healthy food items in these areas. There are two primary reasons why this is the case. First, since few supermarket chains are located in these areas, scanner data either do not exist or are not available. Second, in most states, electronic benefit transfer (EBT) card expenditures are not publicly available for consumer demand analysis. Hence, there are few, if any, sales data opportunities to analyse the purchasing behaviour of food desert residents. And, without data determining where to locate and the appropriate product mix to offer, it is difficult for retailers because there simply is no information on latent demand for healthy foods. Overall, the food desert literature provides only limited testing of the supply and demand side hypotheses because of these data constraints. This paper seeks to address this gap by using a unique dataset to quantify inner-city Detroit food desert consumer preferences.
This study is an extension of Weatherspoon et al. (2013), in which fresh fruit price and expenditure elasticities of demand were estimated, that is, consumers’ responsiveness in terms of quantity of fresh fruits purchased with respect to price and income changes. In that paper, consumers’ price elasticity was found to be negative and significant, and of a similar magnitude as elasticities that have been estimated for the average American (compare to Durham and Eales, 2010; You et al., 1996). A negative price elasticity of demand means that the demand for a good decreases when its price increases. Low-income consumers’ sensitivity to changes in income/expenditure was found to be positive and significant, indicating that food desert consumers responded to economic factors in the same manner as the general population. The main, and unique, difference between the results in Weatherspoon et al. (2013) and previous studies on consumer preferences (Durham and Eales, 2010; compare to You et al., 1996) is that Weatherspoon et al. (2013) found that several fruits were luxury goods in the studied community (in economic theory, goods are regarded as luxury goods when an income increase causes a proportionally greater increase in demand (Theil, 1980)).
The paper at hand is critical in establishing food desert consumers’ vegetable purchasing behaviour, which is different enough from fruit demand, studied in Weatherspoon et al. (2013), to warrant being examined separately. While both fruit and vegetables are important for a healthy diet, fresh vegetables may be an even bigger challenge in food deserts and limited resource populations such as those living in Detroit, given the preparation and storage necessary. Most fresh vegetables require refrigeration, preparation and/or cooking, whereas most fruit can be eaten raw and unprepared as snacks. Anderson et al. (1998) identified cooking time as problematic in an intervention to increase fruit and vegetable intake. Fruit are mostly sweet while vegetables come in a wide range of flavours and are rarely sweet and often ‘bitter’. Both fruits and vegetables are great sources of nutrients, but it is also important to assess the consumption of fruits and vegetables separately to better target dietary and health shortcomings since vegetables are higher in certain antioxidant nutrients and the recommendations are less likely to be met by limited resource populations than fruit (Cassady et al., 2007; Drewnowski, 2009; Kaur and Kapoor, 2001; Scott et al., 1996; Trudeau et al., 1998). Therefore, the factors behind vegetable consumption preferences are likely different from those for fruit (Trudeau et al., 1998).
This paper hypothesises that Detroit inner-city consumer behaviour with respect to vegetables is similar to the average American’s behaviour in terms of price elasticities (responsiveness to price changes). Empirical falsification of this hypothesis – and in particular the finding that vegetable consumption is low and non-responsive to price changes – would be interpreted as support for the demand hypothesis. Empirical corroboration of this hypothesis would be interpreted as support for the supply hypothesis. The specific method is to econometrically estimate the income (expenditure)-, own- and cross-price elasticities of vegetables sold in one of Detroit’s food deserts and compare them to national averages.
The next section will put the Detroit food desert setting in perspective. It is followed by the data and methods sections. The results section presents empirical findings for the top-selling vegetables, and interpretations of the findings. Conclusions and policy implications are presented last.
Detroit’s food desert in perspective
Detroit is a salient example of an urban food desert – arguably America’s oldest and largest. With a total population of 713,777 (82.7% African-American) in 2010 (US Census Bureau, 2011), it is estimated that one-half of the Detroit’s residents live in a food desert (Gray, 2008).
The city is characterised by a large income disparity, with a Gini coefficient of 0.488 ± 0.01 (US Census Bureau, 2011), and a median household income of $28,357 (2006–2010) as compared to the state of Michigan at $48,432 (US Census Bureau, 2011). Over 34% of Detroit’s population lives below the poverty level (US Census Bureau, 2011).
Detroit has an unemployment rate of 22.7%, which is one of the highest in the US (Michigan Department of Technology, Management and Budget, 2010), and in 2008 Forbes ranked the city among the top 10 fastest dying cities in America (Zumbrun, 2008). Detroit has also been characterised as America’s fifth most obese city (Centers for Disease Control, 2010; Ruiz, 2007).
Until recently, Detroit had no full-service supermarket chains operating within its bounds. Gallagher (2007) estimated that in 2007 gas stations, liquor stores, party stores, dollar stores, bakeries, pharmacies, and convenience stores, offering a limited, if any, choice of nutritious foods, comprised 92% of Detroit’s food stamp retailers. In 2013, two supermarket chain stores (Whole Foods and Meijer) opened within the city boundaries. Given the vast geographical expanse of Detroit (139 square miles with 40 square miles of vacant land (Gallagher, 2009)) and the poor public transportation system, the majority of inner-city Detroit consumers are still forced to shop at non-mainstream grocery outlets, such as convenience and liquor stores.
Detroit’s inadequate public transportation system exacerbates its food access problems – a light rail train covers only the immediate downtown area, and a limited number of bus routes link the centre to the more affluent suburban food oases. Each shopping trip provides an inconvenience to the consumer, as it requires walking to and from a bus stop, transferring, and carrying bags. The lack of adequate transportation is especially problematic given Detroit’s high proportion of disabled persons – 19.5% as compared to the 11.9% found in the rest of the US (US Census Bureau, 2011) – as this population is more likely to have difficulty grocery shopping, especially if major travelling is required.
Vegetable intake by Detroit residents has been shown to be below the recommended levels for average Americans – 77.2% of its residents are not consuming adequate fruit and vegetables (Fussman et al., 2008). The inability to purchase fresh vegetables and other affordable, nutritious food is perhaps the most significant factor contributing to unhealthy diets in Detroit. More specifically consumption was lower in neighbourhoods that did not have an increased variety of dark-green and orange vegetables available at the stores when compared with those that had five or more varieties (Izumi et al., 2011).
The study area, Piety Hill, is a 92% African-American, inner-city Detroit neighbourhood, roughly bounded by John C. Lodge Freeway, Clairmount Street, Woodward Avenue and Euclid Street (see Figure 1). The approximately 1635 residents (US Census Bureau, 2011) span all ages, from young singles, to families, to senior citizens. Piety Hill’s mean income is lower than that of 96% of US neighbourhoods; its childhood poverty rate of 38% is higher than for 90% of US neighbourhoods (NeighborhoodScout.com, n.d.). A micro custom report (MAPAS) for the ¼ mile radius circle centred in the neighbourhood revealed a poverty rate that exceeds 60% for the 18–64 year age group. Only 20% of the population holds an associate’s degree or higher, and 27% of the population neither finished high school nor obtained a General Equivalency Diploma (MAPAS, n.d.). Reported violent crime rates are three times the Detroit average and over 11 times the national average (NeighborhoodScout.com, n.d.). Prior to the introduction of Peaches & Greens (P&G) in November 2008, the immediate neighbourhood’s single food retail outlet was a windowless, gated corner store with a single sign that advertised liquor, beer, wine, and lotto tickets. At the time of data collection, it took 56 minutes by bus from the study site to reach a full service supermarket chain (according to Google maps), while 49% of households did not own a car (NeighborhoodScout.com, n.d.). There is an independent grocer within one mile of P&G that has upgraded its FFV category since these data were collected.
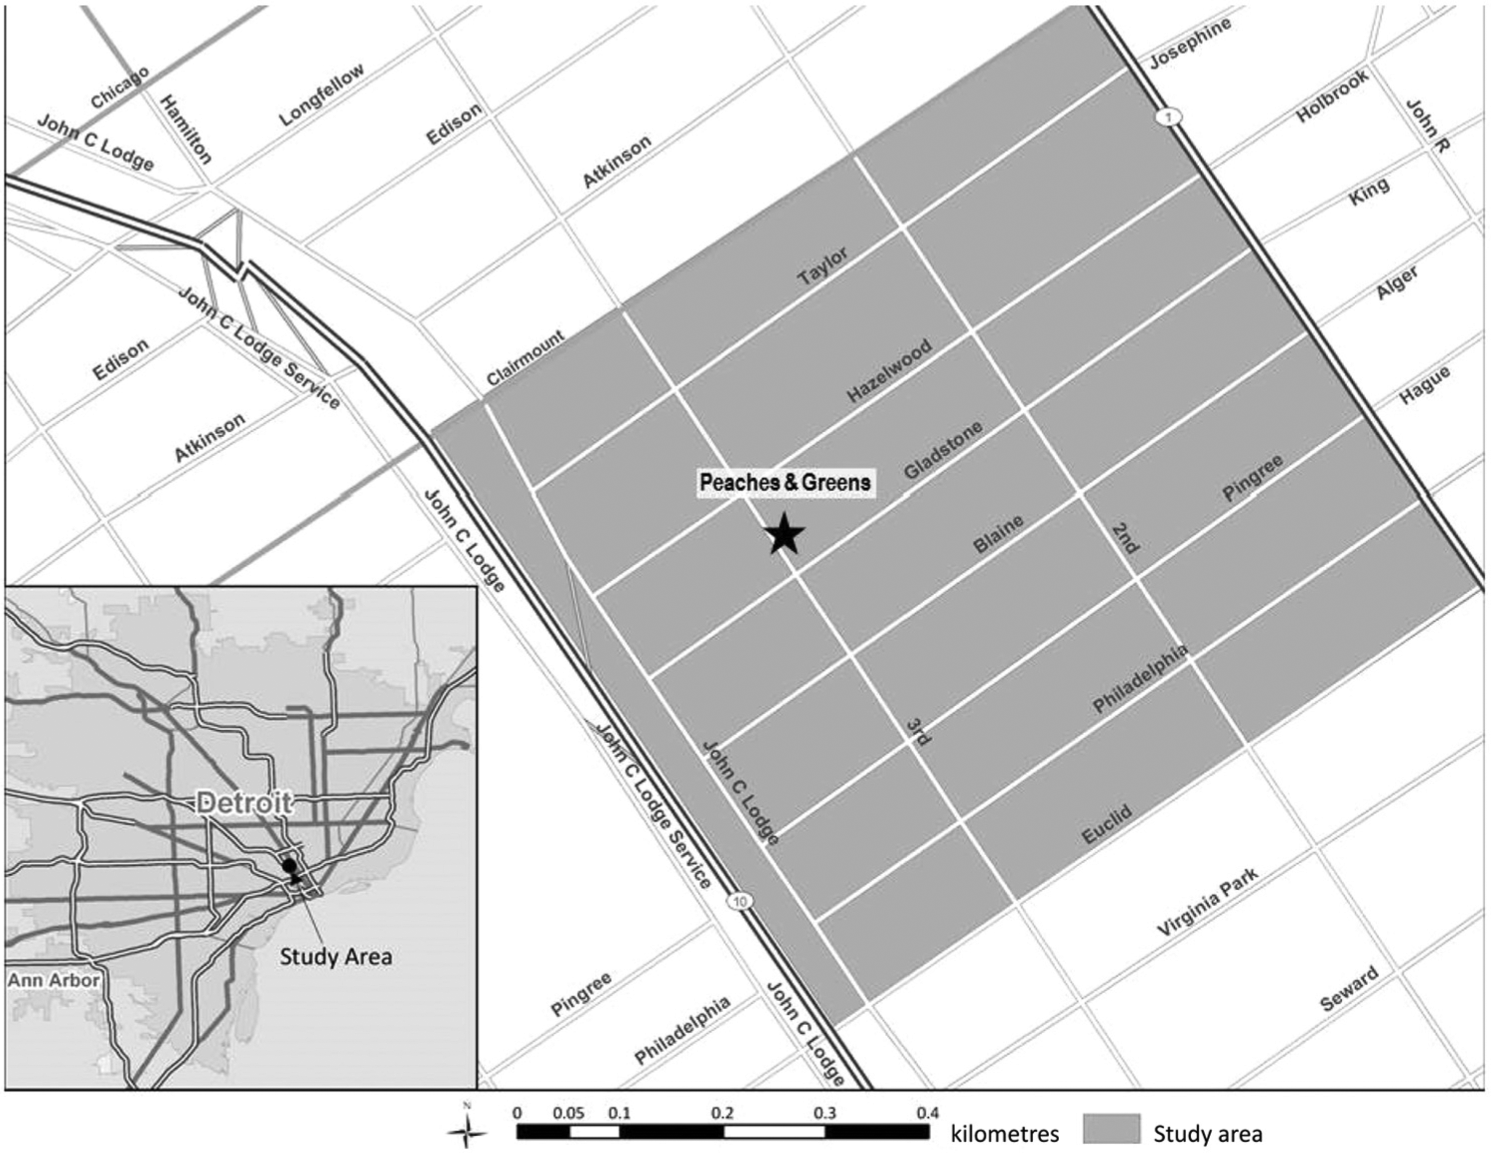
Map of Detroit and the Piety Hill study area.
Data
A natural experiment, consisting of the opening of a non-profit green grocer, P&G, in the former food desert of Piety Hill, provided the opportunity to explore food desert residents’ consumption behaviour. The small FFV retail storefront, which opened on 1 November 2008, was the result of community leadership and financed by Central Detroit Christian, a community based organisation. It provides community residents the opportunity to have a safe, culturally acceptable, nutritionally adequate diet through a sustainable food system that maximises community self-reliance. The goal was to provide families with greater access to quality produce while promoting healthy food choices (Central Detroit Christian, n.d.).
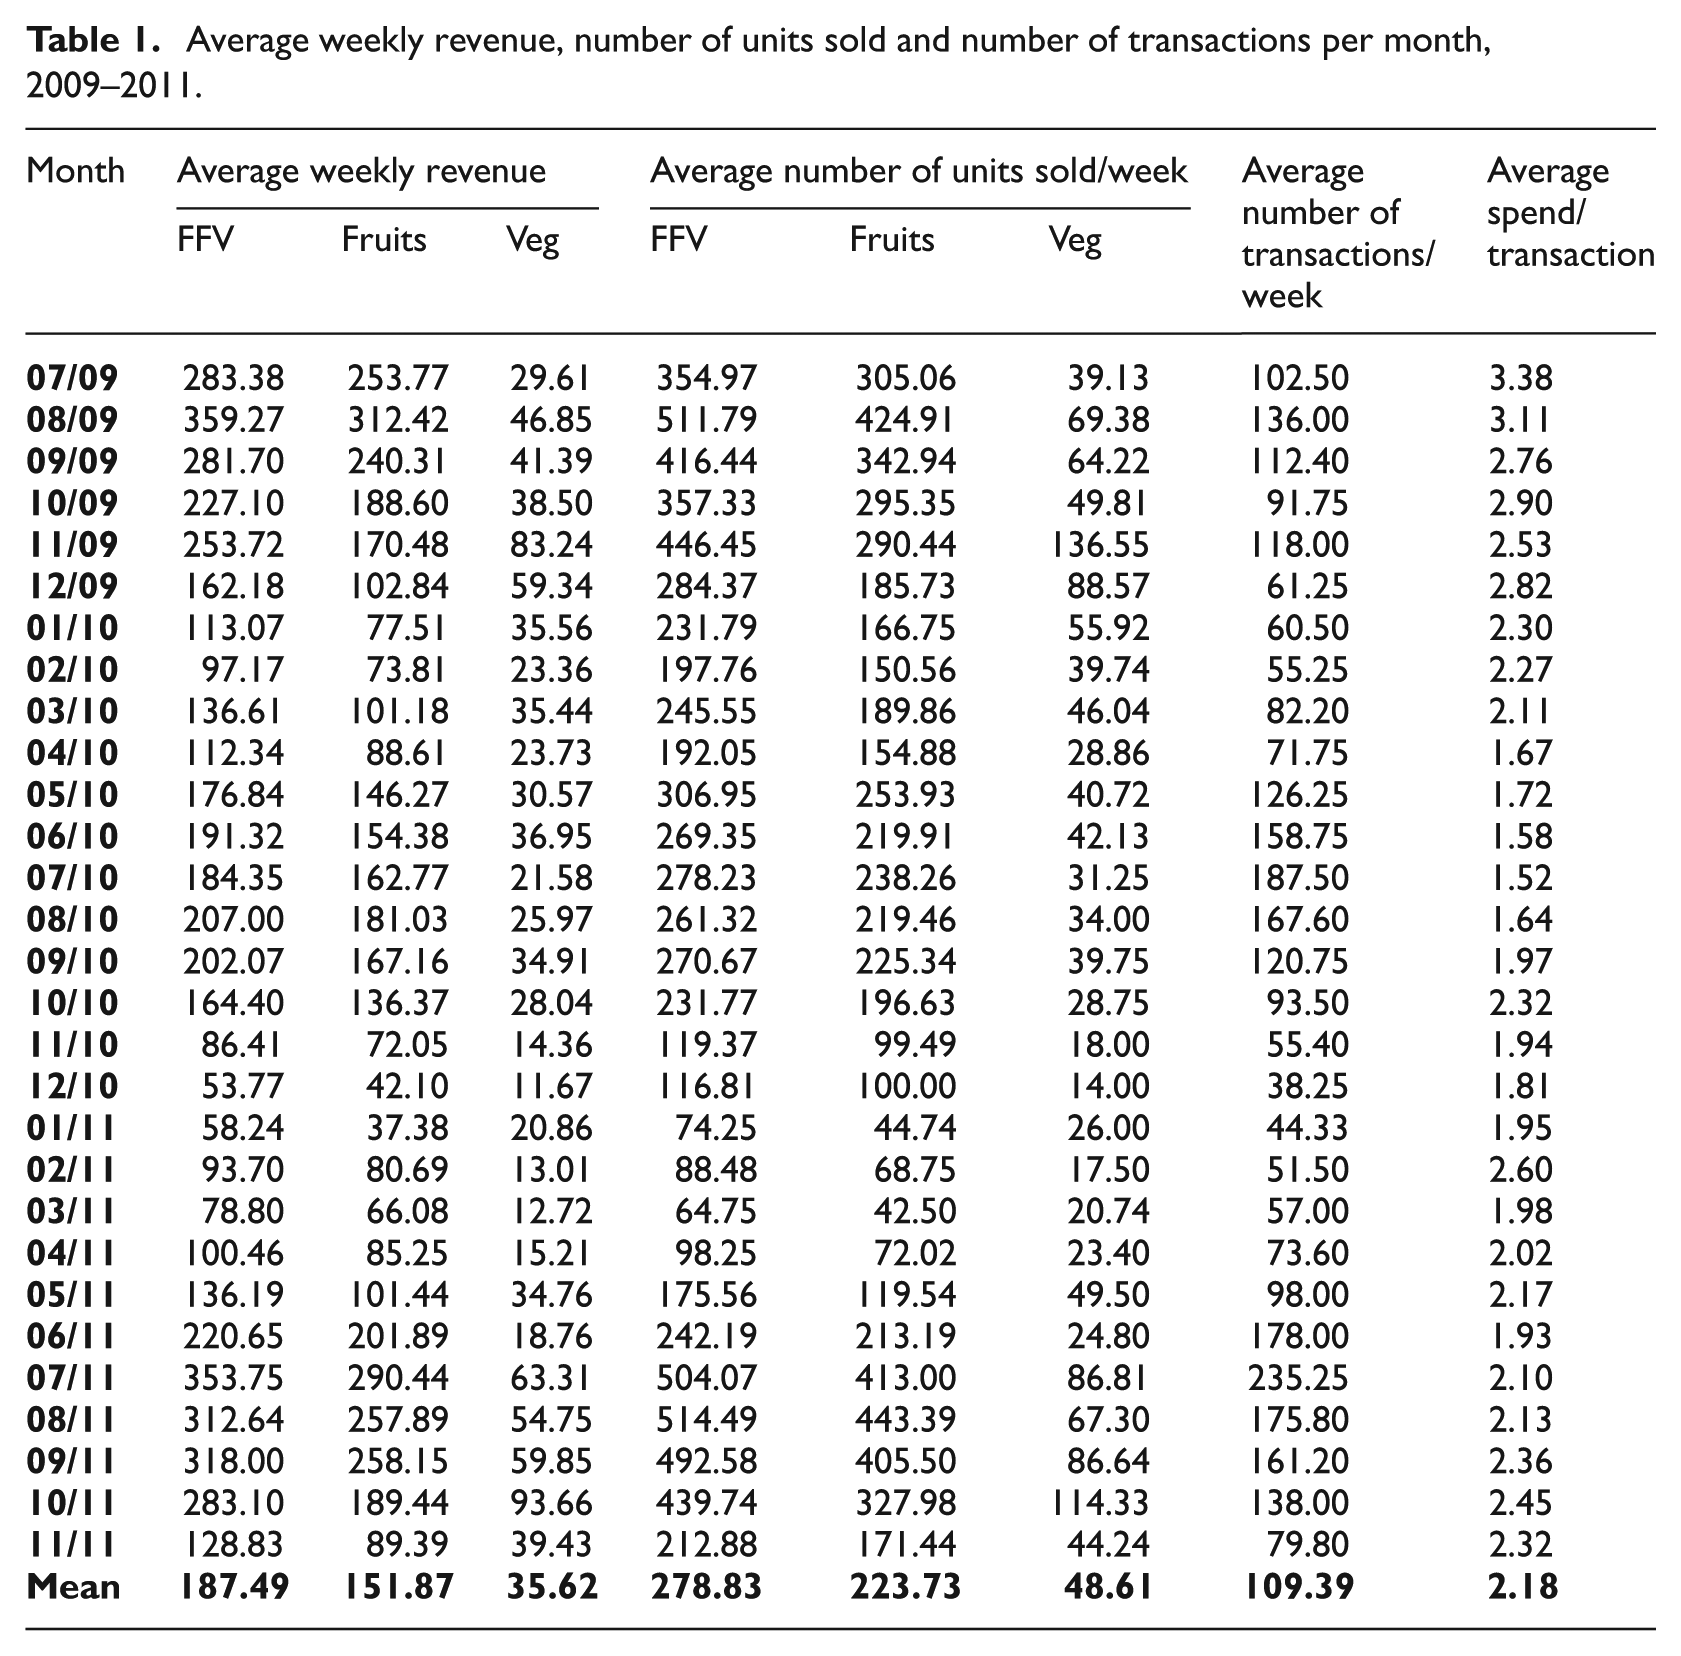
P&G sales receipts were provided from July 2009 to November 2011. The data included quantity, price, date, time, and transaction number for 13 vegetables. 1 During this time period, the store was open 123 calendar weeks, or 570 days, and made a weekly average revenue from FFV of $187. On average, 109 transactions at $2 each occurred each week. Average weekly sales figures of FFV by month are presented in Table 1. These figures suggest that Piety Hill residents are taking advantage of P&G FFV offerings. 2 The table also shows that vegetable sales make up only 19% of total FFV sales. In other words, for every vegetable that is purchased approximately 4.3 fruit are purchased. This is quite different from the shares consumed by the average American: 1.15 lbs of fresh vegetables consumed for every pound of fresh fruit (Cook, 2012), or the 1.64 cups of vegetables for every cup of fruit (NFVA, 2010). Apart from preferences, we hypothesise that relative under-utilisation of fresh vegetables is related to storage and preparation issues facing residents without cooking or refrigeration facilities. In a companion survey, 3 48% of interviewees mentioned their inability to cook or store produce as the major impediment to FFV consumption (Weatherspoon et al., 2014). This seems to be corroborated by the fact that the top selling vegetables (and fruits) are all easy to consume and require no cooking and little or no preparation.
Average weekly revenue, number of units sold and number of transactions per month, 2009–2011.
Weatherspoon et al. (2012) determined that Detroit’s food desert consumers had similar fruit and vegetable purchasing preferences as the average American consumer: seven of the ten nationally most purchased fruits were also top sellers in their sample population. Similarly, tomato, pepper, lettuce, cucumber, carrot, cabbage and corn were among the top 10 in the examined food desert and nationally.
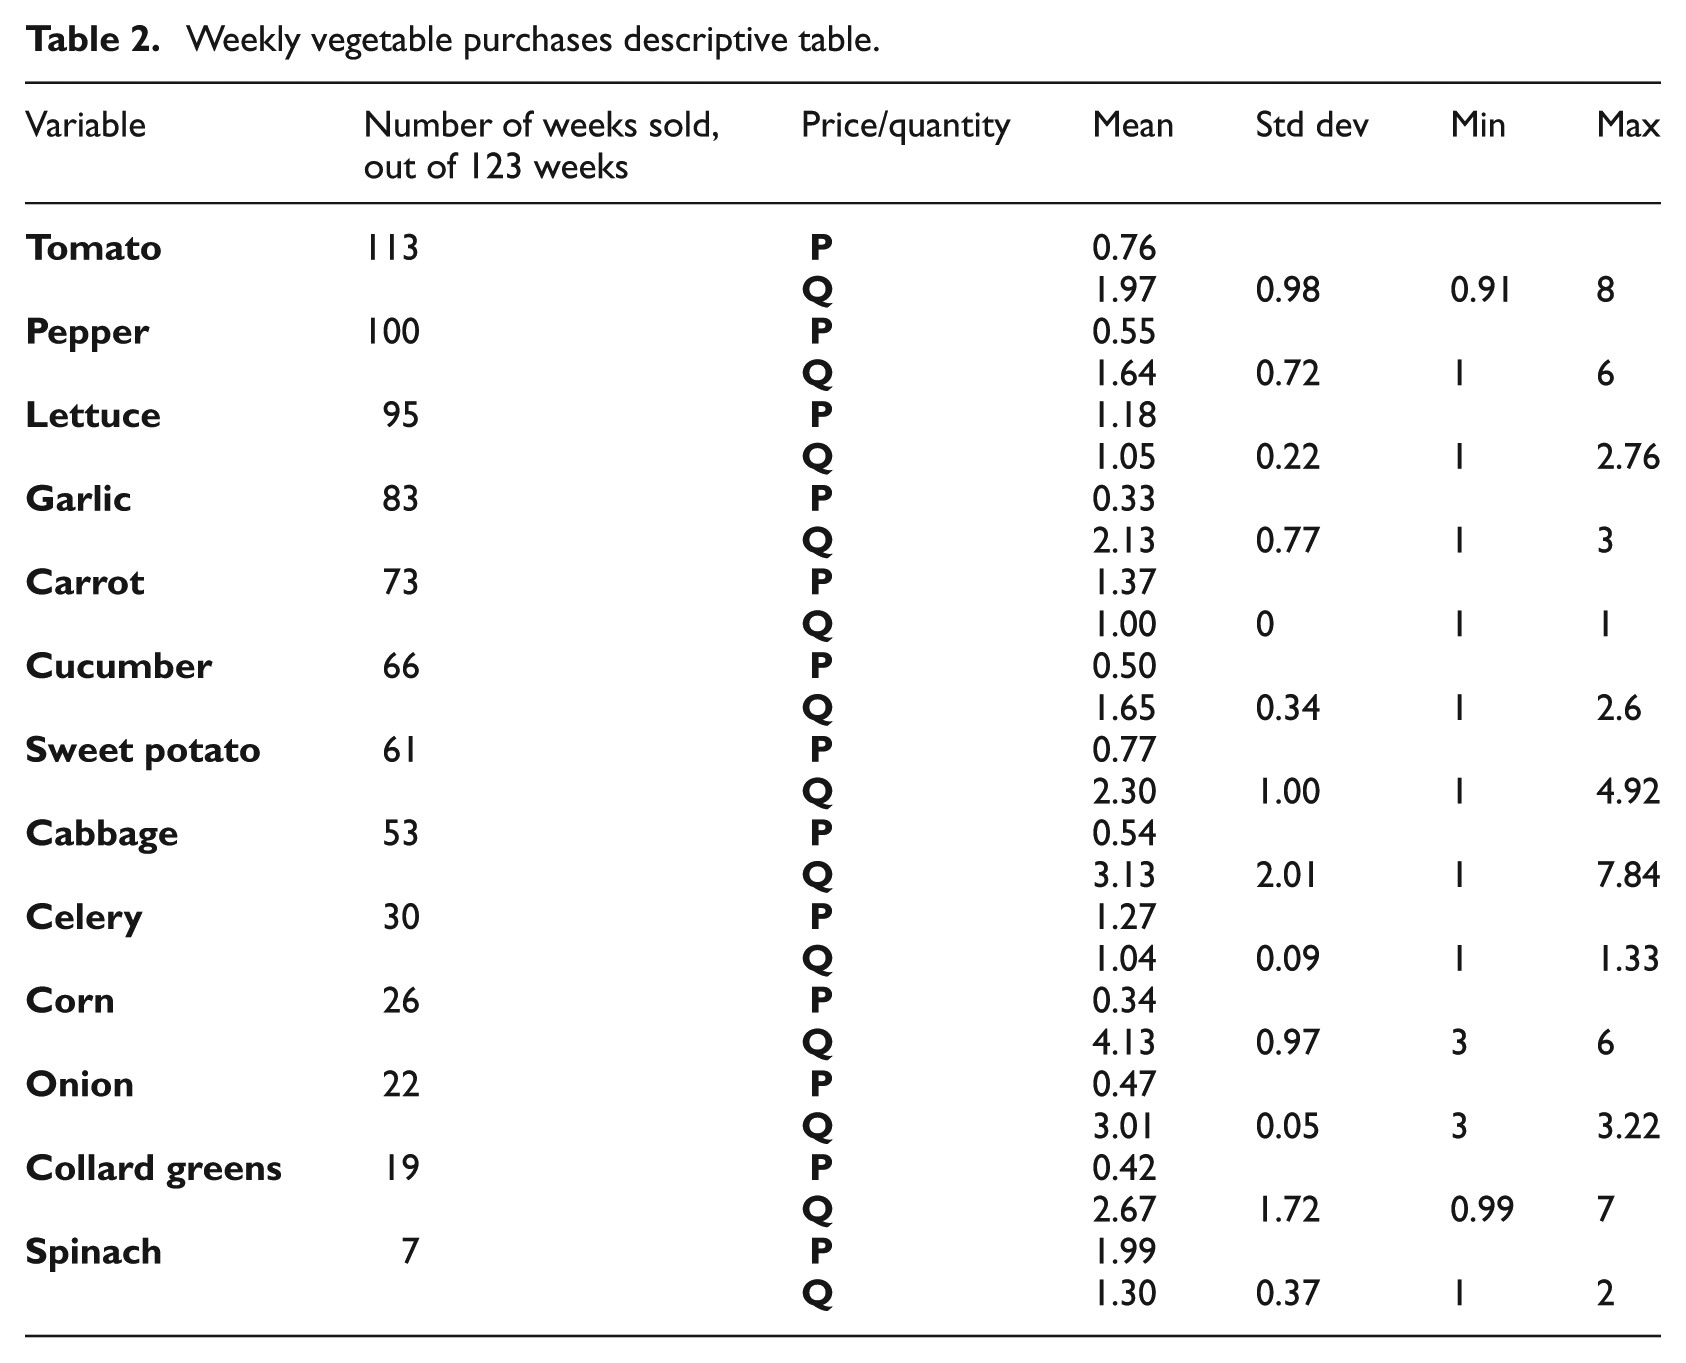
Table 2 provides weekly average quantities sold and average prices for the individual vegetables. The most frequently sold vegetables each week were tomatoes (sold 113 weeks or 92% of the time), peppers (sold 100 weeks or 81% of the time), and lettuce (sold 95 weeks or 77% of the time) at average prices of $0.76 a piece for tomatoes, $0.55 a piece for peppers, and $1.17 per head of lettuce. The average transaction (based on weekly averages) consisted of 1.97 tomatoes, 1.64 peppers and 1.05 heads of lettuce.
Weekly vegetable purchases descriptive table.
During the data collection period, the Fair Food Network (2012) managed a programme, in which P&G participated, called Double-Up Food Bucks (DUFB). To qualify for this programme customers had to be recipients of the Supplemental Nutrition Assistance Program (SNAP). DUFB participants received coupons worth up to $20 that could be redeemed at participating retailers for Michigan produce with a purchase of Michigan produce of the same value. For example, for a $2 purchase the consumer would pay $1 and the coupon would match that $1. This programme essentially doubled the amount of income available for Michigan FFV purchases. The programme ran in June and July 2011. Comparing data from June and July 2010 (no DUFB) with data from June and July 2011 (DUFB was operating) the impact can be clearly seen. Fruit purchases in value terms increased by 67% year-over-year, vegetable purchases increased by 6%, and combined purchases increased by 56% as shown in Figure 2 (including cash and coupon value). In contrast, comparing months when DUFB was not operating (May and August year-over-year comparisons), combined FFV purchases increased only nominally. During the time the programme was in place in 2011, transactions increased by nearly 30%, and the average spend per transaction by 18%, compared to the same weeks in the previous year. This finding reaffirms Gustavsen and Rickertsen’s (2006) conclusion that income support could play an important, but limited, role in increasing the vegetable consumption of low-income consumers. It also echoes Anderson et al. (1998), who found that, during their intervention to increase fruit and vegetable consumption, cost and lack of ease of shopping were an important impediment, and concluded that addressing these issues could be beneficial for future programmes.
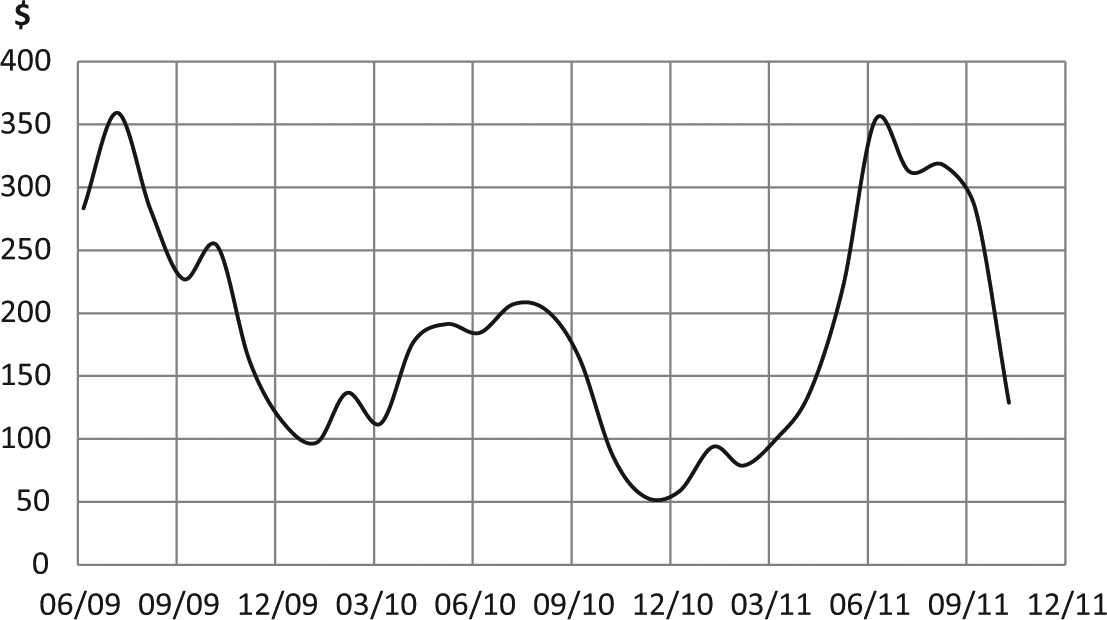
Weekly FFV revenue in US$.
Overall, the sales numbers from P&G show that food desert consumers purchase FFV if offered a quality product at a competitive price. 4 This finding is consistent with the results of Wrigley et al. (2003) who also found increased FFV consumption in a previously underserved neighbourhood in the United Kingdom after the introduction of a new food retailer. Bodor et al. (2007) also suggest that small neighbourhood stores that sell fresh produce can help attenuate the severity of the access problem among local residents in urban food deserts. In their New Orleans study, vegetable consumption increased when small neighbourhood stores offered healthy food options within 100 metres of the household. An additional metre of shelf space was associated with an increase by 0.35 servings of vegetables consumed per day. Rose and Richards (2004) who examined food store access and household fruit and vegetable consumption among individuals receiving food stamps showed an increased consumption of fruits and vegetables among individuals who travelled only one versus five miles to reach a store.
In this study, the outcome of concern is the relatively low rate of vegetable compared to fruit purchases, contrary to the US dietary guidelines, which recommend the opposite. As noted earlier, vegetables are key to a balanced diet, provide certain antioxidants and nutrients and contain less sugar than fruit (Cassady et al., 2007; Drewnowski and Specter, 2004; Kaur and Kapoor, 2001; Scott et al., 1996; Trudeau et al., 1998). Given the strong established negative association between fresh fruit and vegetables and diet-related disease, it is imperative that this shortcoming be addressed from an access as well as demand perspective.
Method of analysis: Rotterdam model
The Rotterdam model has been widely applied to consumer demand studies and was first applied to consumer demand problems in the mid to late 1960s (Barten, 1964, 1968, 1977; Theil, 1965, 1975, 1976). The advantages of the Rotterdam model over other approaches (translog and AIDS models) are: its direct derivation from economic theory, theoretical restrictions are easily imposed, first differencing the variables eliminates unit root and other problems commonly found in time series data, and the model is relatively easy to estimate and interpret.
Following Weatherspoon et al. (2013), this study utilises a system wide Rotterdam approach and is estimated in the absolute price form (Theil, 1980). It relies on multistage budgeting under the assumption of block independence (Theil, 1976, 1980) or weak separability (Barten, 1977). Under block independence it is assumed that consumers allocate income independently among broad groups of goods, which are taken to be additively separable. Accordingly, the consumers’ utility functions are also additive in groups Sg, g = 1, …, n. The demand for good i in group Sg can then be derived conditionally on the demand for the group. In the final stage expenditure on the group is taken to be predetermined and the goods are not assumed to be separable within the group, so that cross-price elasticities are relevant. For example consumers allocate income among food, transportation, education, and so on (stage 1), and within the food group, in turn, among FFV, meat, and other foods (stage 2). In stage 3 the predetermined expenditure on the vegetables group is allocated among individual vegetables, such as lettuce and cucumbers.
The Rotterdam model is usually applied as a differenced system of equations to address non-stationarity. The conditional demand equation for vegetables can be written as follows (time subscripts are suppressed):

where
The theoretical demand restrictions in the Rotterdam model are as follows (Mountain, 1988):

The conditional average expenditure elasticity is calculated as
To operationalise the model, the data were aggregated by calendar week in order to minimise the number of zeroes due to non-expenditures on specific vegetables during a given transaction. The weekly aggregate q, p and Q were divided by the number of transactions for that week so that the estimation was based on the weekly average consumer. This resulted in a dataset with T = 121 weekly observations. The model was then estimated for the three most frequently sold vegetables (tomatoes, peppers and lettuce) in a 4-equation system (the fourth equation being other vegetables). The fourth equation was dropped for estimation purposes to avoid singularity of the error covariance matrix (Barnett, 1979; Barten, 1969). The parameters for the fourth equation were recovered using the theoretical demand restrictions listed above. The actual number of observations for the operationalised model was 62 due to differencing and the absence of purchases of tomatoes, peppers or lettuce in some weeks. The model was estimated in STATA (www.stata.com) with nonlinear seemingly unrelated regression (nlsur), which converges to maximum likelihood under the iterated feasible generalised nonlinear least squares (ifgnls) option (Poi, 2008).
Results
Model performance
The model was estimated for the three most frequently sold vegetables (tomato, pepper and lettuce) and all ‘other vegetables’. A series of tests were run on the data to determine seasonality, randomness of missing weeks, and model fit to data. Seasonality was not found to be significant in any model formulation (monthly and quarterly dummies were tested). Randomness of missing weeks for the time series was tested with logit models of missing-value-indicator variables and time variables following Social Science Computing Cooperative (2013). Pepper was the only variable in the model that showed a slight association in missing values with time – however, there was no seasonal (or any) pattern detected, other than the number of zero sales increasing in August and September of 2011. 6 In 2009, for which data were only available starting in July, there were only two weeks where pepper was not sold at all. ‘This imbalance’ in missing values for pepper between 2009 and 2011 caused the slight positive association with time. However, as stated above, no trend was apparent. Year-over-year comparison of pepper missing values (quarterly, monthly, and weekly) showed no pattern and within-year distribution of pepper non-sales was independent of time. When other explanatory variables (such as vegetable quantities and prices) were included in the logit model, the time variables tested (week, month) were not significant for predicting the likelihood of incurring a pepper (or any) missing value. A likelihood ratio test showed this model performed better than the nested 2-product model at the 1% level, while the parameter estimates and their significance levels were quite close. Hence, the selected model includes pepper.
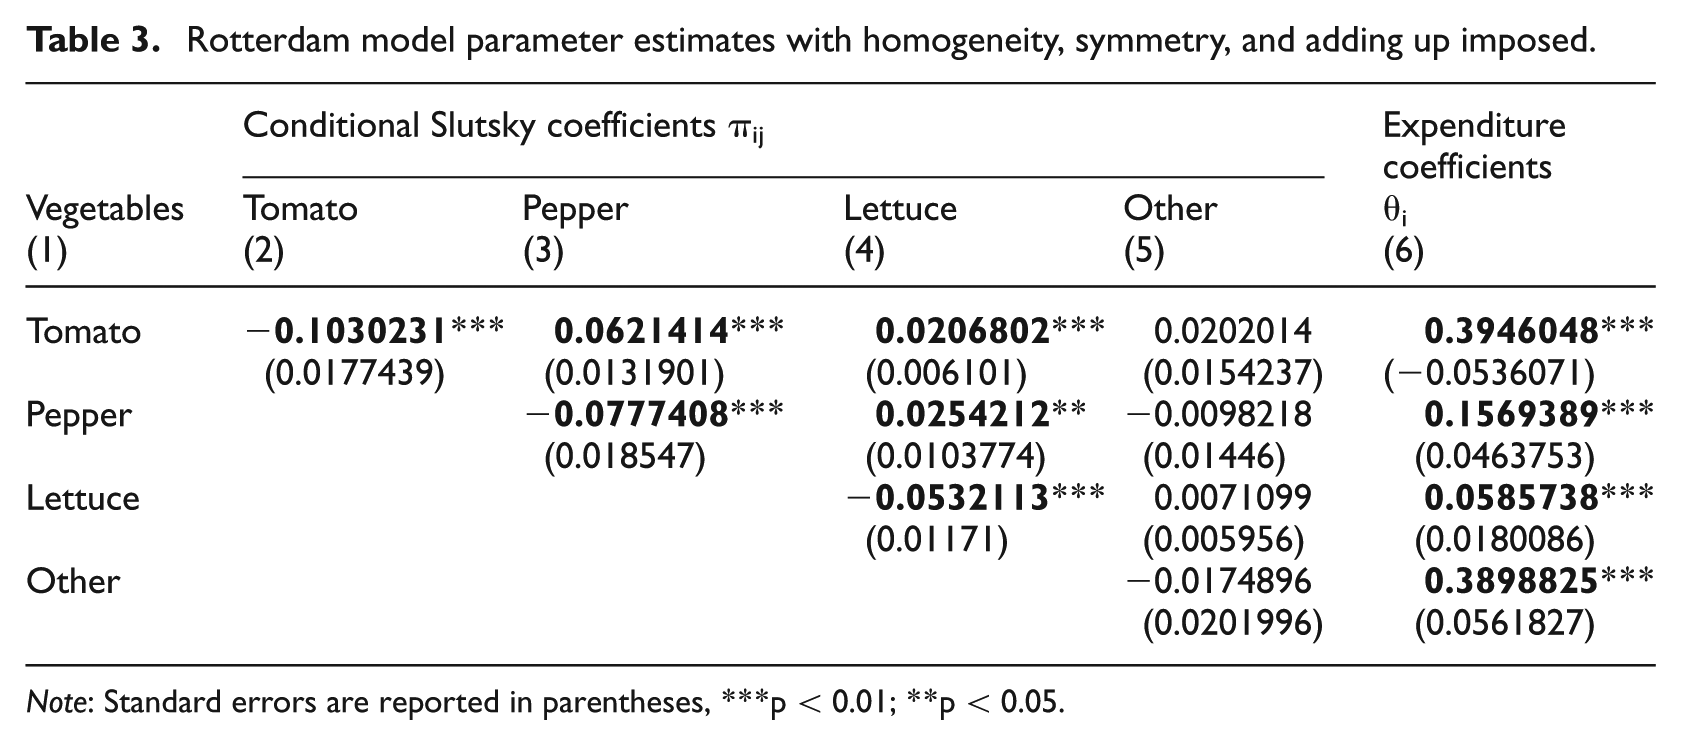
Homogeneity and symmetry conditions for the three vegetable model were tested following Seale et al. (1992); neither homogeneity nor symmetry could be rejected. Therefore, homogeneity and symmetry were imposed in addition to the adding-up condition, leading to 53 degrees of freedom. The log likelihood value of this model was 375.44. A Wald test was performed to test the significance of the model. The joint hypothesis of all parameters being equal to zero could be rejected at the 1% level (chi2(9) = 290.36). The system-wide R2 of 0.65 was calculated following Schmitz and Seale (2002) and Seale et al. (1992). In accord with economic theory, the own price parameters were all negative and significant, with the exception of ‘other vegetables’, and the expenditure parameters were positive and significant. Overall, 10 of the 14 estimated parameters were statistically significant.
Expenditure parameters and elasticities
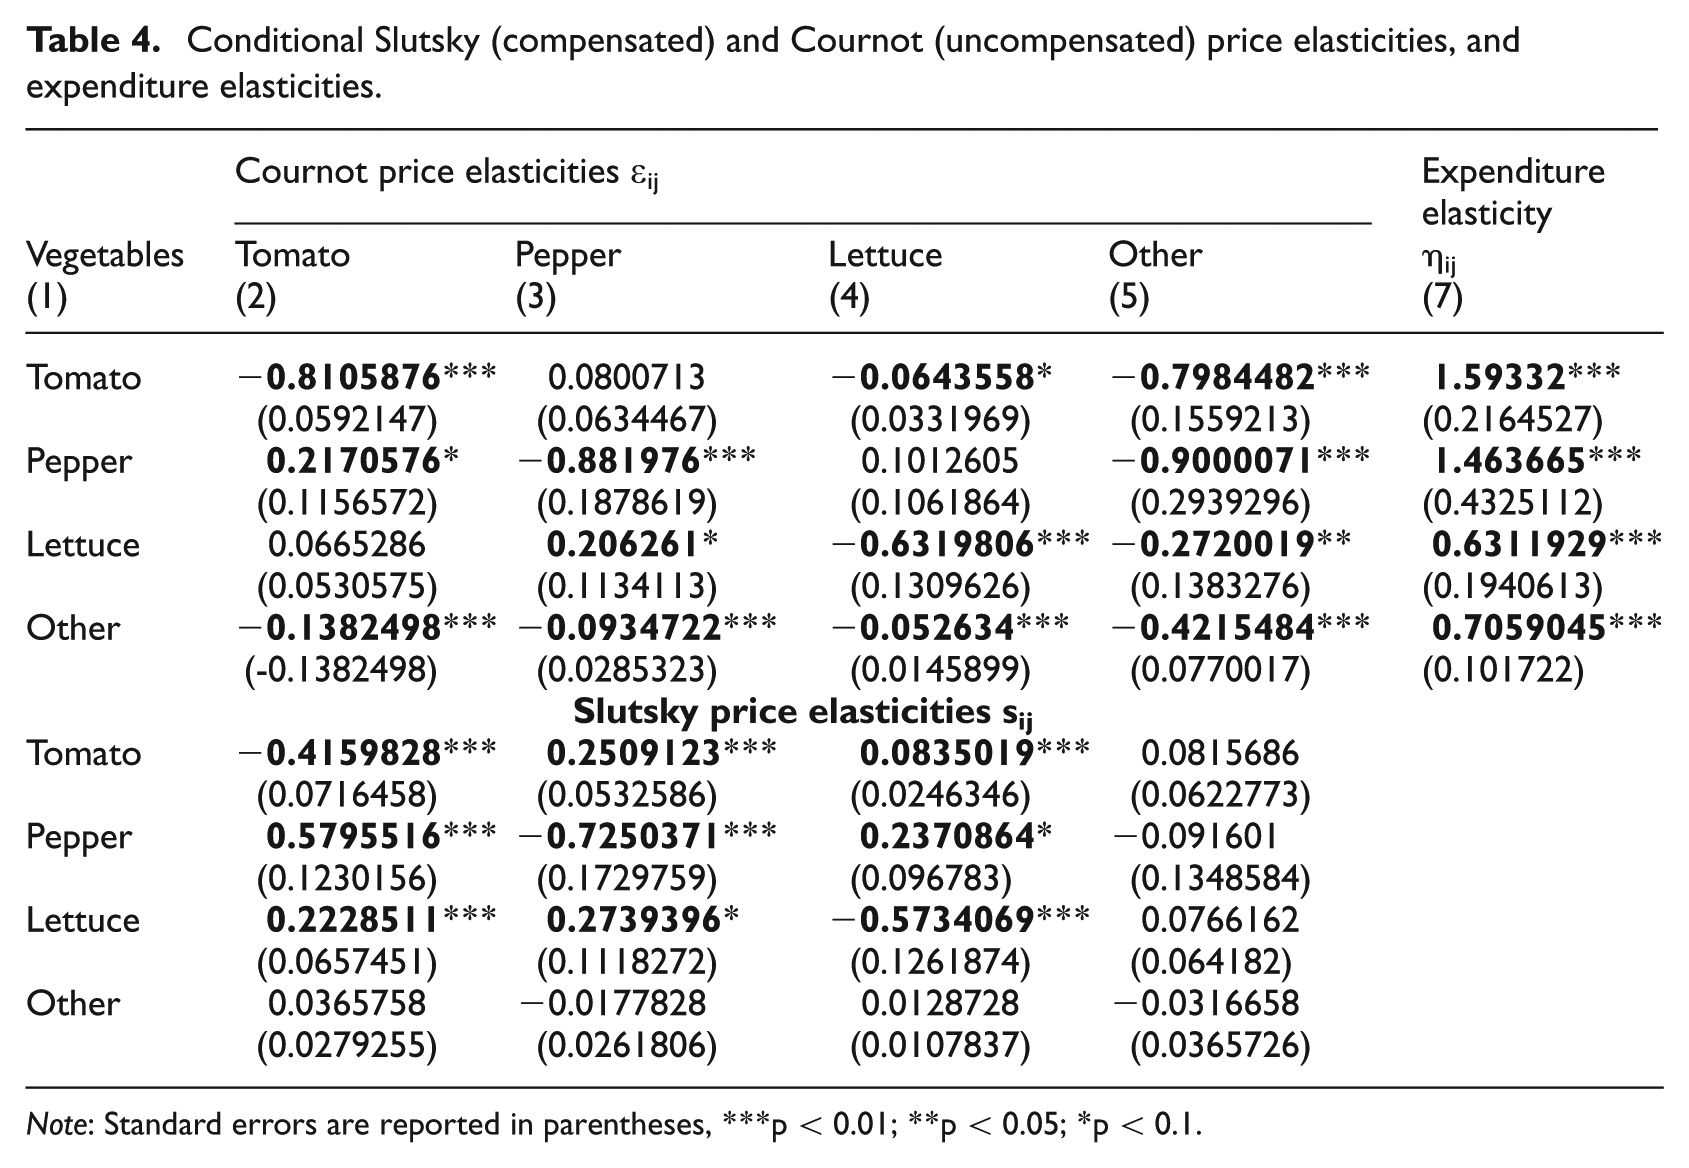
The (conditional) expenditure parameters are reported in column 6 of Table 3. The expenditure parameters (Table 3) and elasticities (Table 4) for lettuce, peppers, tomatoes and ‘other vegetables’ were positive and statistically significant at the 1% level. Tomato and pepper expenditure elasticities were 1.59 and 1.46 respectively, making both luxury goods for this community. This means that as the consumers’ income available for the vegetable category increases by 1%, their purchases of the luxury vegetable will increase by more than 1% (Theil, 1980). Lettuce and ‘other vegetables’ expenditure elasticities put them in the ‘normal good’ category, with expenditure elasticities of 0.63 and 0.71 respectively. The lettuce expenditure elasticity is similar to what You et al. (1996) estimated nationally, however, the Piety Hill elasticities were much higher for tomato and pepper. This means that for tomatoes and peppers the Piety Hill consumers are more income sensitive, that is, an increase in income available for vegetable purchases results in a higher increase in demand by Piety Hill residents for tomatoes and peppers than for the general population.
Rotterdam model parameter estimates with homogeneity, symmetry, and adding up imposed.
Note: Standard errors are reported in parentheses, ***p < 0.01; **p < 0.05.
Conditional Slutsky (compensated) and Cournot (uncompensated) price elasticities, and expenditure elasticities.
Note: Standard errors are reported in parentheses, ***p < 0.01; **p < 0.05; *p < 0.1.
A likely explanation for the high income elasticity of tomato and pepper may centre on the very low income distribution in the locality. At the lowest income levels consumers may be searching for high-caloric food in order to not feel hungry, and seek to purchase low-cost bulk vegetables (Drewnowski, 2009; Drewnowski and Specter, 2004) that can be used in cold and hot preparations. Thus the high income elasticity of fresh peppers and tomatoes at extremely low income elasticities is intuitively plausible.
One implication of this finding is that income support programmes for this population may be important in influencing their vegetable consumption. Programmes such as Double-Up Food Bucks effectively increase income because they act like a buy-one-get-one-free coupon. During the implementation of DUFB vegetable purchases (in value terms) increased by 6%. This shows that income support can play a limited role in increasing the vegetable consumption of low-income consumers. Other constraints on vegetable consumption, such as limited cooking and refrigeration capabilities, need to be addressed at the same time in order for income support programmes to achieve their full effect.
Price parameters and elasticities
The conditional Slutsky price parameters are reported in columns 2–5 of Table 3. All estimated own price parameters were negative, as expected (this means a price increase leads to a decrease in the quantity demanded of that good and vice versa). Tomato, pepper and lettuce own price parameters and elasticities were statistically significant at the 1% level. The own price of all ‘other vegetables’ was not significant.
Two types of elasticities can be calculated from Slutsky parameters: Slutsky and Cournot elasticities. Slutsky (compensated) elasticities represent pure substitution effects while Cournot (uncompensated) elasticities comprise both income and substitution effects (Frisch, 1959). The substitution effect characterises the change in demand for a good whose price has increased (decreased) due to the replacement with another, relatively cheaper (more expensive), substitute good (Hicks, 1939). For example, if the price of wheat bread increases, consumers might buy rye bread instead and thus the demand for wheat bread decreases. The income effect describes the indirect effect of a price change on disposable income of a consumer: if the price of a good increases, the consumer not only has to pay a higher price for that good, but (s)he also effectively has less disposable income available to buy goods (Hicks, 1939). For example, when gas prices increase, consumers who drive a vehicle have less money available to purchase other goods, such as food, clothes and so on whose prices have not changed. Thus their original basket of goods is not attainable anymore and they effectively have less income available. The use of Slutsky and Cournot elasticities allows us to isolate these two effects, as Slutsky elasticities only reflect substitution effects while Cournot elasticities comprise the entire effect, including the indirect income effect, of a price change on demand. The smaller the income effect, the closer the two measures are, and if there is no income effect at all they coincide.
The elasticities are reported in Table 4 and were calculated at the sample mean. Tomato, pepper and lettuce own price Slutsky elasticities were negative and statistically significant at the 1% level. A 1% decrease in own price would lead to 0.42% increase in tomato purchases, a 0.73% increase in pepper purchases and a 0.57% increase in lettuce purchases. All elasticities are in the inelastic range, that is, a 1% price change leads to a less than 1% demand change, meaning the demand response, given the price change, is relatively weak. The Slutsky own price elasticity for all ‘other vegetables’ was very small and not statistically significant, indicating that their own price is not important in the purchasing decision.
Cournot own price elasticities (Table 4) were negative and significant at the 1% level for all vegetables. The Cournot own price elasticity was markedly larger, in absolute terms, than the respective Slutsky elasticity for each vegetable. This indicates a substantial income effect as already discussed in the previous section, and therefore underlines the importance of income in this community. However, all elasticities still remained in the inelastic range indicating a less than proportional demand response. Specifically, if their own price decreased by 1%, tomato consumption would increase by 0.81%, pepper consumption by 0.88%, lettuce consumption by 0.63%, and consumption of all ‘other vegetables’ would increase by 0.42%. These own price responses were in the same order of magnitude as the ones found by You et al. (1996, 1998). However, while they were still in the inelastic range, they were much larger for Detroit food desert consumers than those estimated in the aforementioned study. This means that, with respect to the vegetable group, food desert consumers are more price sensitive than the average American, and the primary reason for this difference is the high income effect.
Slutsky cross-price parameters (Table 3) characterise cross-relationships between goods – that is, how the demand for a good responds to a price change in another good. The tomato–pepper and tomato–lettuce coefficients were positive and significant at the 1% level and the pepper–lettuce coefficient was positive and significant at the 5% level, indicating that these goods are net substitutes. This means that consumers regard these vegetables as alternatives to each other (e.g. tomatoes and pepper), and a price increase in one (e.g. tomatoes), will lead to a demand increase in the other (pepper) (because peppers have become cheaper relative to tomatoes). The Slutsky cross prices elasticities are reported in Table 4.
Nine Cournot cross price elasticities were significant. The tomato–lettuce cross price elasticity was negative and significant at the 10% level, indicating a gross complementary relationship which is just the opposite for what was found for the Slutsky cross-price elasticity. ‘Other vegetables’ were found to be gross complements for tomatoes, peppers and lettuce (all significant at the 5% level). Complements are goods whose demand responses move in the same direction (e.g. a price increase in tomatoes leads to a decrease in purchases of both tomatoes and lettuce). Generally, complements are goods that complement each other and are bought and consumed together. It is, however, possible for goods to be net substitutes and gross complements, as in this case. This is a result of the income effect being larger than the substitution effect. Even if consumers substitute lettuce for tomatoes, an increase in the tomato price has such a large effect on their disposable income (or food budget), that they cannot afford as much lettuce as they did prior to the tomato price increase – the income effect outweighs the substitution effect. The pepper–tomato and lettuce–pepper combinations were both positive and significant at the 10% level, suggesting gross substitutes. This means that the income effect is not large enough to change the Slutsky elasticity relationships.
Conclusions
This paper provides unique evidence on inner-city Detroit residents’ fresh vegetable purchasing behaviour by using retail-level data from a natural experiment in Detroit. While this natural experiment is unique, quantifying its effects through estimated price and income elasticities allows for generalisation to policies and retail strategies that would affect inner-city vegetable prices and the allocation of consumer expenditures.
The findings provide evidence confirming that inner-city consumers respond to vegetable prices and income constraints in much the same way as the average American. This means that their underlying preferences as represented by elasticities of demand are not markedly different from the average American, that is, barring constraints they would purchase in similar patterns as the general population. This evidence corroborates the supply hypothesis – namely that inner-city residents consume low levels of fresh vegetables in part because they do not have access to fresh vegetables.
However, the low levels of income, vegetable purchases, and the significant estimated income and own price elasticities also provide corroboration of a modified demand hypothesis. Namely that due to income and possibly other, non-economic, constraints, including inadequate household storage and preparation capacity, the consumption of vegetables in inner city food desert situations will remain lower than national averages. That is, if total vegetable costs are lowered for these consumers, 7 they will purchase vegetables at an increased but still limited rate. In this sense, food desert residents are different from the average American – because they face a different set of constraints. Thus, the conclusion to be drawn is that two insidious effects are at work – limited access limits fresh vegetable consumption, but even with better access low incomes as well as other issues will further constrain fresh vegetable consumption.
The data show that vegetables are purchased at significantly lower rates than fruit in the study neighbourhood. Analysis regarding fruit previously showed that while the cost of fruit was a major determinant of fruit consumption, there was demand despite the limited access (Weatherspoon et al., 2013). The current paper highlights the added burden of non-economic constraints, such as taste preferences, preparation and storage, for vegetables relative to fruit which is of particular concern because of the importance of adequate consumption of both fruit and vegetables for a healthy diet.
For retailers the large price elasticities for certain vegetables imply that coupons and discounts on individual vegetables could significantly increase their respective purchases. Grocery stores can increase sales of more perishable vegetables or vegetables close to perishing by markedly discounting them. Furthermore, changing prices in either direction can have large effects and should therefore be carefully considered. Price and income incentives need to be carefully designed with cross price relationships in mind in order to benefit from positive demand effects on complements and avoid negative effects on substitutes. By reducing the price of a good, demand will increase for its complements as well. On the other hand, a price increase for a certain item can have a negative impact on sales of a substitute. Given the considerable income effects in this food desert community, reducing the price of a frequently purchased vegetable could increase overall vegetable category purchases. In this specific case, for example, P&G could use tomatoes as a loss leader to increase purchases of not only tomatoes, but also lettuce and all other vegetables (and would have to accept a slight decrease in pepper sales in return).
The large income elasticities imply that vegetable coupons, discounts and customer loyalty programmes that implicitly raise income available for the vegetable category may have a positive impact on vegetable sales revenue. However, other constraints on vegetable consumption, such as limited cooking and refrigeration capabilities, need to be addressed at the same time in order for these retail strategies to achieve their full effect. The co-CEO of Whole Foods has recognised some of these issues within a couple of months of operating in the Midtown area of Detroit: We’re trying to see what works and how we can help. Our (food stamp customers) are much higher here, three to four times higher than the rest of the region. I’m glad about it. It makes me happy that we’re able to stretch a bit. (Gallagher, 2013)
By offering fresh vegetables in a more convenient manner – for example pre-prepared or as snacks – and carrying vegetables that require little preparation, grocery stores can eliminate part of the preparation/cooking issue. A greater selection of vegetables with longer shelf lives could alleviate storage and refrigeration problems. Strategies such as these could address some of the constraints many customers in this area face. As these food desert residents were shown to have similar preferences as the average American, fresh produce may in fact even provide a profit opportunity in this and similar locations.
These results also have major public policy implications for urban food desert areas: the public sector has an important role in addressing the non-economic constraints. Improving access to competitively priced vegetables of good quality may be a partial solution that is not too difficult to accomplish. The opening of P&G in Piety Hill effectively reduced both the local retail price and the overall cost of vegetables, by lowering the transaction costs for residents with previously latent demand. The existing retailer near the neighbourhood also increased its fresh produce selection after the opening and initial success of P&G. Public policy actions including improving public safety, nutrition education, and providing favourable zoning and other retailer incentives can help to increase the number of retailers that offer vegetables, reduce prices, increase vegetable quality, and thereby increase consumption. More research is needed to determine if there are public policy actions, such as including educational programmes on proper methods for freezing vegetables, that can specifically target storage and preparation constraints.
Other policy options that lower vegetable prices are difficult. Option 1, directly subsidising vegetables in inner-city neighbourhoods is problematic both logistically and in a political environment in which food assistance is perhaps the biggest issue in the 2014 Farm Bill debate. In Detroit, 28% of the population receives food assistance in the form of EBT cards (Devries and Linn, 2011). Analysis of the Double Up Food Bucks trial run showed that income support programmes for vegetable purchases can play an important role in increasing the vegetable consumption of low-income consumers, but their impact is heavily limited by the aforementioned non-economic constraints. Option 2, providing tax rebates for new or renovated commercial construction in renaissance zones might help, but Detroit has had a comprehensive programme in place with minimal or no effect on retail food outlets, and Detroit’s current budgetary status and state-appointed special manager (essentially receivership) raise questions about the future of tax abatements. In other major cities, such as New York, tax abatements may be reduced or eliminated depending on proportion of retail in the new construction area (New York City Department of Finance, 2013), limiting their applicability for increasing access to fresh produce. Option 3, improving transportation may also help, although budgetary issues arise as well. Lastly, public–private partnerships are an option, as in the successful Pennsylvania Fresh Food Financing Initiative (FFFI), yet the FFFI included public financing that may not be available in Detroit.
Devising appropriate vegetable retailer strategies and public policies requires further research to understand food desert consumers’ constraints and preferences and how these strategies and policies impact consumer purchasing decisions. It appears that income, storage and preparation issues, and other constraints, are likely playing an important role and need to be addressed. This study implies that access is critical, but that there are additional concerns that inhibit increased purchases of fresh vegetables. Therefore, it is important that policymakers focus their efforts on identifying and targeting obstacles in conjunction with pricing strategies and income support to increase vegetable consumption.
Footnotes
Funding
The authors would like to thank the Morris Chair in State and Local Government Finance and Policy at Michigan State University for funding the data collection and analysis for this study.