
Abstract
We find that per capita municipal spending on public services is strongly and non-linearly correlated to urban population density. Optimal expenditure levels for municipal services are achieved with densities close to 9000 residents per square kilometre. In our study of about 8600 municipalities of Brazil, Chile, Ecuador and Mexico, 85% of all municipalities are below this ideal density level. This result provides strong policy support for densification, particularly in medium-sized cities of developing countries, which are currently absorbing most of the world’s urban population growth.
Introduction
Dense cities are a rational choice for our increasingly urban world, where concerns about environmental sustainability and urban sprawl are paramount (UN-Habitat, 2012). Among their many advantages, dense cities help preserve fertile rural lands (Jenks and Burgess, 2000), decrease overall commuting lengths (Gaigné et al., 2012) and contribute to reduce greenhouse gas emissions (Stone et al., 2007). On top of its environmental benefits, density correlates positively with human capital accumulation (Glaeser, 1999), a higher rate of inventions (Carlino et al., 2007), labour productivity (Ciccone and Hall, 1996), and social inclusiveness (Burton, 2000). On these grounds, and as development policies finally integrate environmental and social goals, urban policies are pushing for densification in both developed and developing countries. Multilateral organisations such as the United Nations (UN-Habitat, 2012), the World Bank (2014a), the OECD (2012) and the Inter-American Development Bank (2013) are calling for denser cities. National development plans, including those of Mexico (2013), Colombia (2011), China (2011) and South Africa (2012), advocate urban densification. Even development plans of arguably already dense cities, such as London (2013), New York (2011) and Monterrey (2011) pursue explicit policies for higher densities.
But sustaining dense populations has its costs. Urban density increases land prices (Glaeser et al., 2001), the wage premium (Wheaton and Lewis, 2001), congestion (Wheaton, 1998) and crime (Glaeser and Sacerdote, 1999). Its impact on public spending in the literature is inconclusive. Some studies show it leads to savings in fire protection, waste collection and education services (Bollinger et al., 2001). But analogous research correlated density to diseconomies of scale for those same services (Abrate et al., 2012). In other studies, high densities have no impact on expenditures on fire protection and solid waste; but reduce expenses on capital facilities, roadways, police and education (Carruthers and Úlfarsson, 2003, 2008). Finally, others propose a U-shaped relationship between density and spending, implying that after an optimal density, expenditures and density would rise (Holcombe and Williams, 2008; Ladd, 1992).
Further, the literature disregards that density is endogenous to spending, assuming that public service spending is a function of density. Yet, it is also plausible that people move to places where public services are available. Latin American urban history provides specific examples for both scenarios: densification has led to investments in public service infrastructure; neighbourhood upgrading programmes in Brazil provide only one of many recent examples (Brakarz et al., 2002). Conversely, investments in public service infrastructure have led to densification, with the canonical example being planned cities such as Brasília. Moreover, coverage of public services could be imperfect, which is often the case in developing countries. For example, about one-third of Latin American urban population suffers some deficit of urban services (Bouillon, 2012); a condition that threatens smaller municipal governments, now responsible for urban services (Campbell, 2012). If history is guidance, the lack of municipal services would not deter population growth, but it would rather foster informal arrangements to provide them.
Indeed, Latin America’s urbanisation is an ideal case for exploring the questions of endogeneity and imperfect coverage of urban services. Between 1960 and 2010, Latin American Countries (LACs) share of urban population rose from about 50% to 80%, making the region more urbanised than Europe and as urbanised as the USA (World Bank, 2014b). Although few cities account for the vast majority of urban population, the number of cities has been increasing. While in 1950 there were 12 cities with more than 500,000 residents, now there are almost 125. As expected, urbanisation also increased the demand for urban services and the number of municipalities responsible for their provision (IADB, 2013). However, LAC municipalities’ fiscal capacity tends to lag behind (Bonet et al., 2013). And yet, urban immigration has not been detracted (Feler and Henderson, 2011). Today, the basic-service provision gap is considerable; more than 13 million urban residents lack access to improved water sources, while almost 64 million lack improved sanitation facilities in their dwellings (World Bank, 2014b). Closing the incremental water deficit demand that arises from urbanisation, formalising households’ water connections, and eliminating deficits by 2030, will cost more than US$100 billion; another US$79 billion are needed just to close the current sanitation deficit (CAF, 2013).
In light of the gravity of these deficits, we wonder how current urban growth patterns would impact on them. Do dense municipalities have better coverage of basic services? How does density impact the per capita expenditure of these services? Our main contribution is to answer these questions by taking into account the issues of imperfect provision of public services and endogeneity, and relying on data sets form understudied developing countries. Hence, we model public service spending as a function of its demand and cost, considering actual coverage levels. We also use climate as an instrumental variable to establish the causal effect of increases of density on municipal spending. We apply our model to a panel of approximately 8600 municipalities in Brazil, Chile, Ecuador and Mexico, for years 2000 and 2010 (for a total of nearly 17,000 observations). We consider three basic services whose provision is organised and fully financed by municipal governments: water, sewerage and waste collection;1,2 unlike other services, such as education and health, whose costs are partly paid by the state and federal governments, the private sector or directly by the householder. In the countries considered for this study, municipalities spend approximately one-seventh of their budget in these services (see Panel C in Table 2). The diversity of these countries provided a good background to test our model. Mexico and Brazil are large federal countries; Chile and Ecuador are small and quite centralised. The urbanisation rates of these countries also differ, ranging from 68% and 78% in Ecuador and Mexico, to 85% and 89% in Brazil and Chile. Approximately 28% of Brazilian urban residents live in informal settlements lacking some basic service; this figure is 21% in Ecuador, 14% in Mexico and 9% in Chile. The median GDP per capita in 2010 was US$8916 in Mexico; US$12,685 in Chile, US$10,978 in Brazil and US$4637 in Ecuador (World Bank, 2014b). Significantly, the combined population of these four amounts for about 60% of LA countries.
Population density and the cost of public services
As municipalities struggle to serve their current population, a critical issue – which we address in this paper – is whether spatial factors pose a fiscal impact on public service delivery. Population density is a common indicator of the spatial distribution of residents (Forsyth, 2003). Its prominence in empirical studies suggests that notwithstanding its shortcomings in depicting urbanisation vis-à-vis more nuanced dimensions such as continuity, nuclearity and centrality, it is still a useful metric of urban form (Angel et al., 2005).
While nuanced spatial dimensions reveal how specific urban policies affect land use patterns and other particular local phenomena in developable and non-developable areas; density is a clearer concept to operationalise and compare, less prone to misinterpretations and, in general, more intuitive (Rapoport, 1977). Also, focusing on density rather than on population size makes sense from a development perspective, as it relates to economic performance (Henderson, 2003). Moreover, in a context of a democratic society, policy tools for managing urban density are easier to implement than those restricting population growth.
One might think that because population density is so consequential for many aspects of urban processes it would mean that it is well understood, particularly when it comes to its effect on local public finance. Not so. The hypotheses that urban economists and planners have proposed for cost structure dynamics are remarkably inconsistent. In all, the impact of population density on government spending patterns, albeit widely studied and documented, is the subject of empirical controversy. 3 The literature on the effects of density is – ironically – notoriously sprawled, with clear discrepancies both in terms of magnitude and sign. Although the notion that there is an adequate density level that makes the provision and delivery of public services economically efficient is consensual, different studies diverge in their recommendations for the most efficient use of economic resources.
Advocates for densification argue that population density decreases the per capita cost of service provision. Sprawl would require infrastructure to be expanded to sparsely populated locations, increasing per capita costs. Coyne (2003) reports that between 1980 and 2000, densification policies in Colorado led to a 27% increase in population density, and a 7% reduction in per capita spending. This coincides with a report for the City of Calgary (IBI, 2009) claiming that a 25% densification would reduce public expenditure on the provision of roads, fire protection and water by 36%, 46% and 54%, respectively. Burchell and Mukherji (2003) find that moving 11% of households from sprawling counties to denser ones decreases the costs of water and sewer infrastructure by 7%, local road costs by 12% and housing costs by 8%. Carruthers and Úlfarsson (2003) show that a 1% rise in the population density of US counties is associated with a 2–4% decrease in the cost of police protection and education, and an overall 3% decrease in the combined cost of 12 urban services. Likewise, Hortas-Rico and Solé-Ollé (2010) find that in Spain a twofold expansion of urbanised land, i.e. sprawl, increases community facilities costs by 11%, local police costs by 9%, housing costs by 8%, culture and sports costs by 15% and general administration costs by 11%.
Conversely, some researchers argue density does not necessarily lead to economies of scale. Pineda (2005) indicates that labour-intensive urban services (e.g. police, fire protection, healthcare) increase their per capita costs with population density. Ladd and Yinger (1989) demonstrate that a higher average density increases the public services costs owing to a ‘harsher environment’. Cameron (1989) finds that higher density implies higher costs for police services. Holcombe and Williams (2008, 2010) show that in municipalities larger than 500,000 residents, higher population density is associated with higher per capita government expenditures, particularly for sewer, police and highway spending. Carruthers and Úlfarsson (2003) show that transportation cost increases with density when roads are excluded.
A third view is that densification has efficiency advantages in the provision of public services, but these dissipate as city size continues to increase. This suggests a U-shaped relationship between urban density and spending, and consequently an optimal density level. Werner Hirsch (1959) performed one of the first empirical analyses in support of this theory based on fire protection data. Ladd’s (1992) seminal piece demonstrates that the operating expenditure function of US counties is approximated by a parabola whose trough is at a population density of 250 residents per square mile. She finds that the average current spending per head in very low- and very high-density counties (i.e. up to 125, and more than 24,000 residents per square mile) is 14% and 43% higher than in counties within the optimal density range. She gets a similar finding for safety spending, with the lowest costs at a density of 250 residents per square mile. Álvarez et al. (2014) show that optimum density levels vary for each service provided, ranging from 2800 residents per square kilometre for paving and lighting, to 3100 residents per square kilometre for water provision, to 4400 residents per square kilometre for sewerage.
In sum, the relationship between density and per capita public spending is significant and yet its dynamics remain ambiguous (Boyko and Cooper, 2011; Ewing, 1994). At best, this empirical inconsistency could be due to different data definitions and units of analysis considered. A far more serious concern is that the regression equation may be one of several structural equations of a simultaneous model, and hence contain current endogenous explanatory variables, which result in lack of identification. Overall, such ambiguity has led to questioning whether any actual relationship between urban form and the cost of services exists at all (Carruthers and Úlfarsson, 2003), especially in the light of recent empirical evidence. What is all too clear from surveying this body of research is that two critical challenges remain. The first one is empirical. Data availability constraints have restricted most empirical work on the density–spending relationship to developed countries, particularly US counties. In addition, it would also appear that high-quality data at large scale are required – regardless of the region of study – given the propensity in the literature to approach density as a categorical condition (Ladd, 1992) or resort to aggregate data that are likely to conceal relevant functional patterns (Büttner et al., 2004). The evident lack of empirical research on the urbanisation patterns in developing countries has often led to ill-fitted policy recommendations (Angel et al., 2005). Models should include specific variables ad hoc for developing countries, such as percentage of poor households and percentage of households without access to basic services, which reflect a distinct urbanisation dynamic (Libertun de Duren, 2011). In effect, how density impacts the per capita cost of public services is yet to be determined where coverage is incomplete.
The second challenge is methodological. We believe that more nuanced approaches to the relationship between urban population density and fiscal outcomes are in order. As argued above, with the exception of Ladd (1992) and Álvarez et al. (2014), we find that the study of nonlinear relationships is absent in the literature, with most studies assuming an overall linear linkage between density and service expenditures. Empirical research on alternative dynamics would constitute a much needed advancement in the field, particularly given the subjacent theoretical body on the cost structure of, and demand for, services provided at local level. Furthermore, while the literature has devoted much attention to the analysis of the fiscal impacts of density (urban and otherwise), it has given rather little consideration to the endogenous determination of costs and the densification process. This is a handicap because density and fiscal outcomes are simultaneously determined, but too little research provides unbiased evidence on the population density dynamics. We address both issues below.
Methodology
We only account for households receiving coverage of urban services at the highest available quality. The assumption is that informal and rural households are more likely to access these services through other delivery modes. Informal urban households often rely on water trucks, open sewerages and public waste containers, while rural ones depend on dug wells, individual septic cameras and waste containers (World Bank, 2014b). In addition, focusing on high-quality coverage improves the comparability of estimates when assessing public spending. Finally, from a normative standpoint, high-quality services are the expectation for urban areas.
We specify municipal public service spending as a function of the costs for water, sanitation and waste collection service provision and household’s demand. 4 We first assume the cost of producing these services (C) depends on an input cost index (w), and on municipal primacy (m), since primate cities act as focal points for the delivery of public services (equation 1). Coverage (c) is a function of the public resources to provide such coverage (e), divided by population density (d), and other cost factors (z); assuming constant returns to scale (equation 2):


We combine the cost function with a demand model maximising the utility of municipal residents. Thus, the demand for coverage increases with the preferences of a resident (v), and it decreases with her share of the marginal cost of providing such coverage (c). A resident’s budgetary constraint (


Maximising the utility function (equation 3) gives us the first-order condition (equation 6) where the tax price (


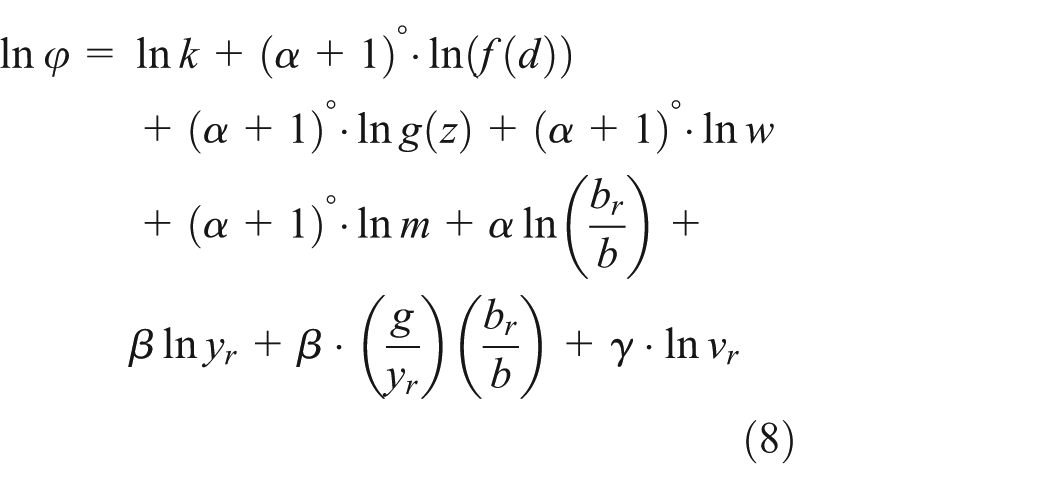
The last equation (8) underscores that in a given municipality, per capita spending in public services depends on the cost of providing such coverage; and on its social, economic and urban characteristics. Besides density of population with coverage (
Equation (8) also reflects that demand for public services determines municipal spending. Hence, it includes income
Prices and geography, among other variables, may impact local spending. Therefore, higher spending may not imply better public services, inasmuch as input prices or municipal characteristics differ. To prevent confounding the influence of these factors with that of density, we include municipal fixed effects. These effects control for the average differences across municipalities in any characteristic influencing municipal spending. Likewise, we include unrestricted time fixed effects to control for time-varying differences in public spending across municipalities. As expected, we also include an error term with typical properties.
Last, we use an exogenous source of variation in population density to sort out the simultaneous determination of density and public spending. In practice, municipalities with better provision of municipal public services may attract new residents and therefore become denser, but it may as well be the case that the municipal governments of denser municipalities may spend more on public services to catch up with their growing population. Following Rosenthal and Strange (2003), Combes et al. (2010) and Glaeser and Gottlieb (2009), we employ climatic variables to instrument for current population density levels. Specifically, we use lagged mean temperatures, precipitation and soil moisture levels as instruments. Our identification strategy relies on the orthogonality of climatic variables to changes in public service expenditures at the municipal level, except insofar as the expenditure changes are due to population density. Although in rural areas climate has a direct effect on income (Guerrero Compeán, 2013), our identification strategy is plausibly appropriate for urban Latin America, since climate is a determinant of settlement patterns, but is not strongly linked to income growth (Miguel et al., 2004).
Data concepts, collection and limitations
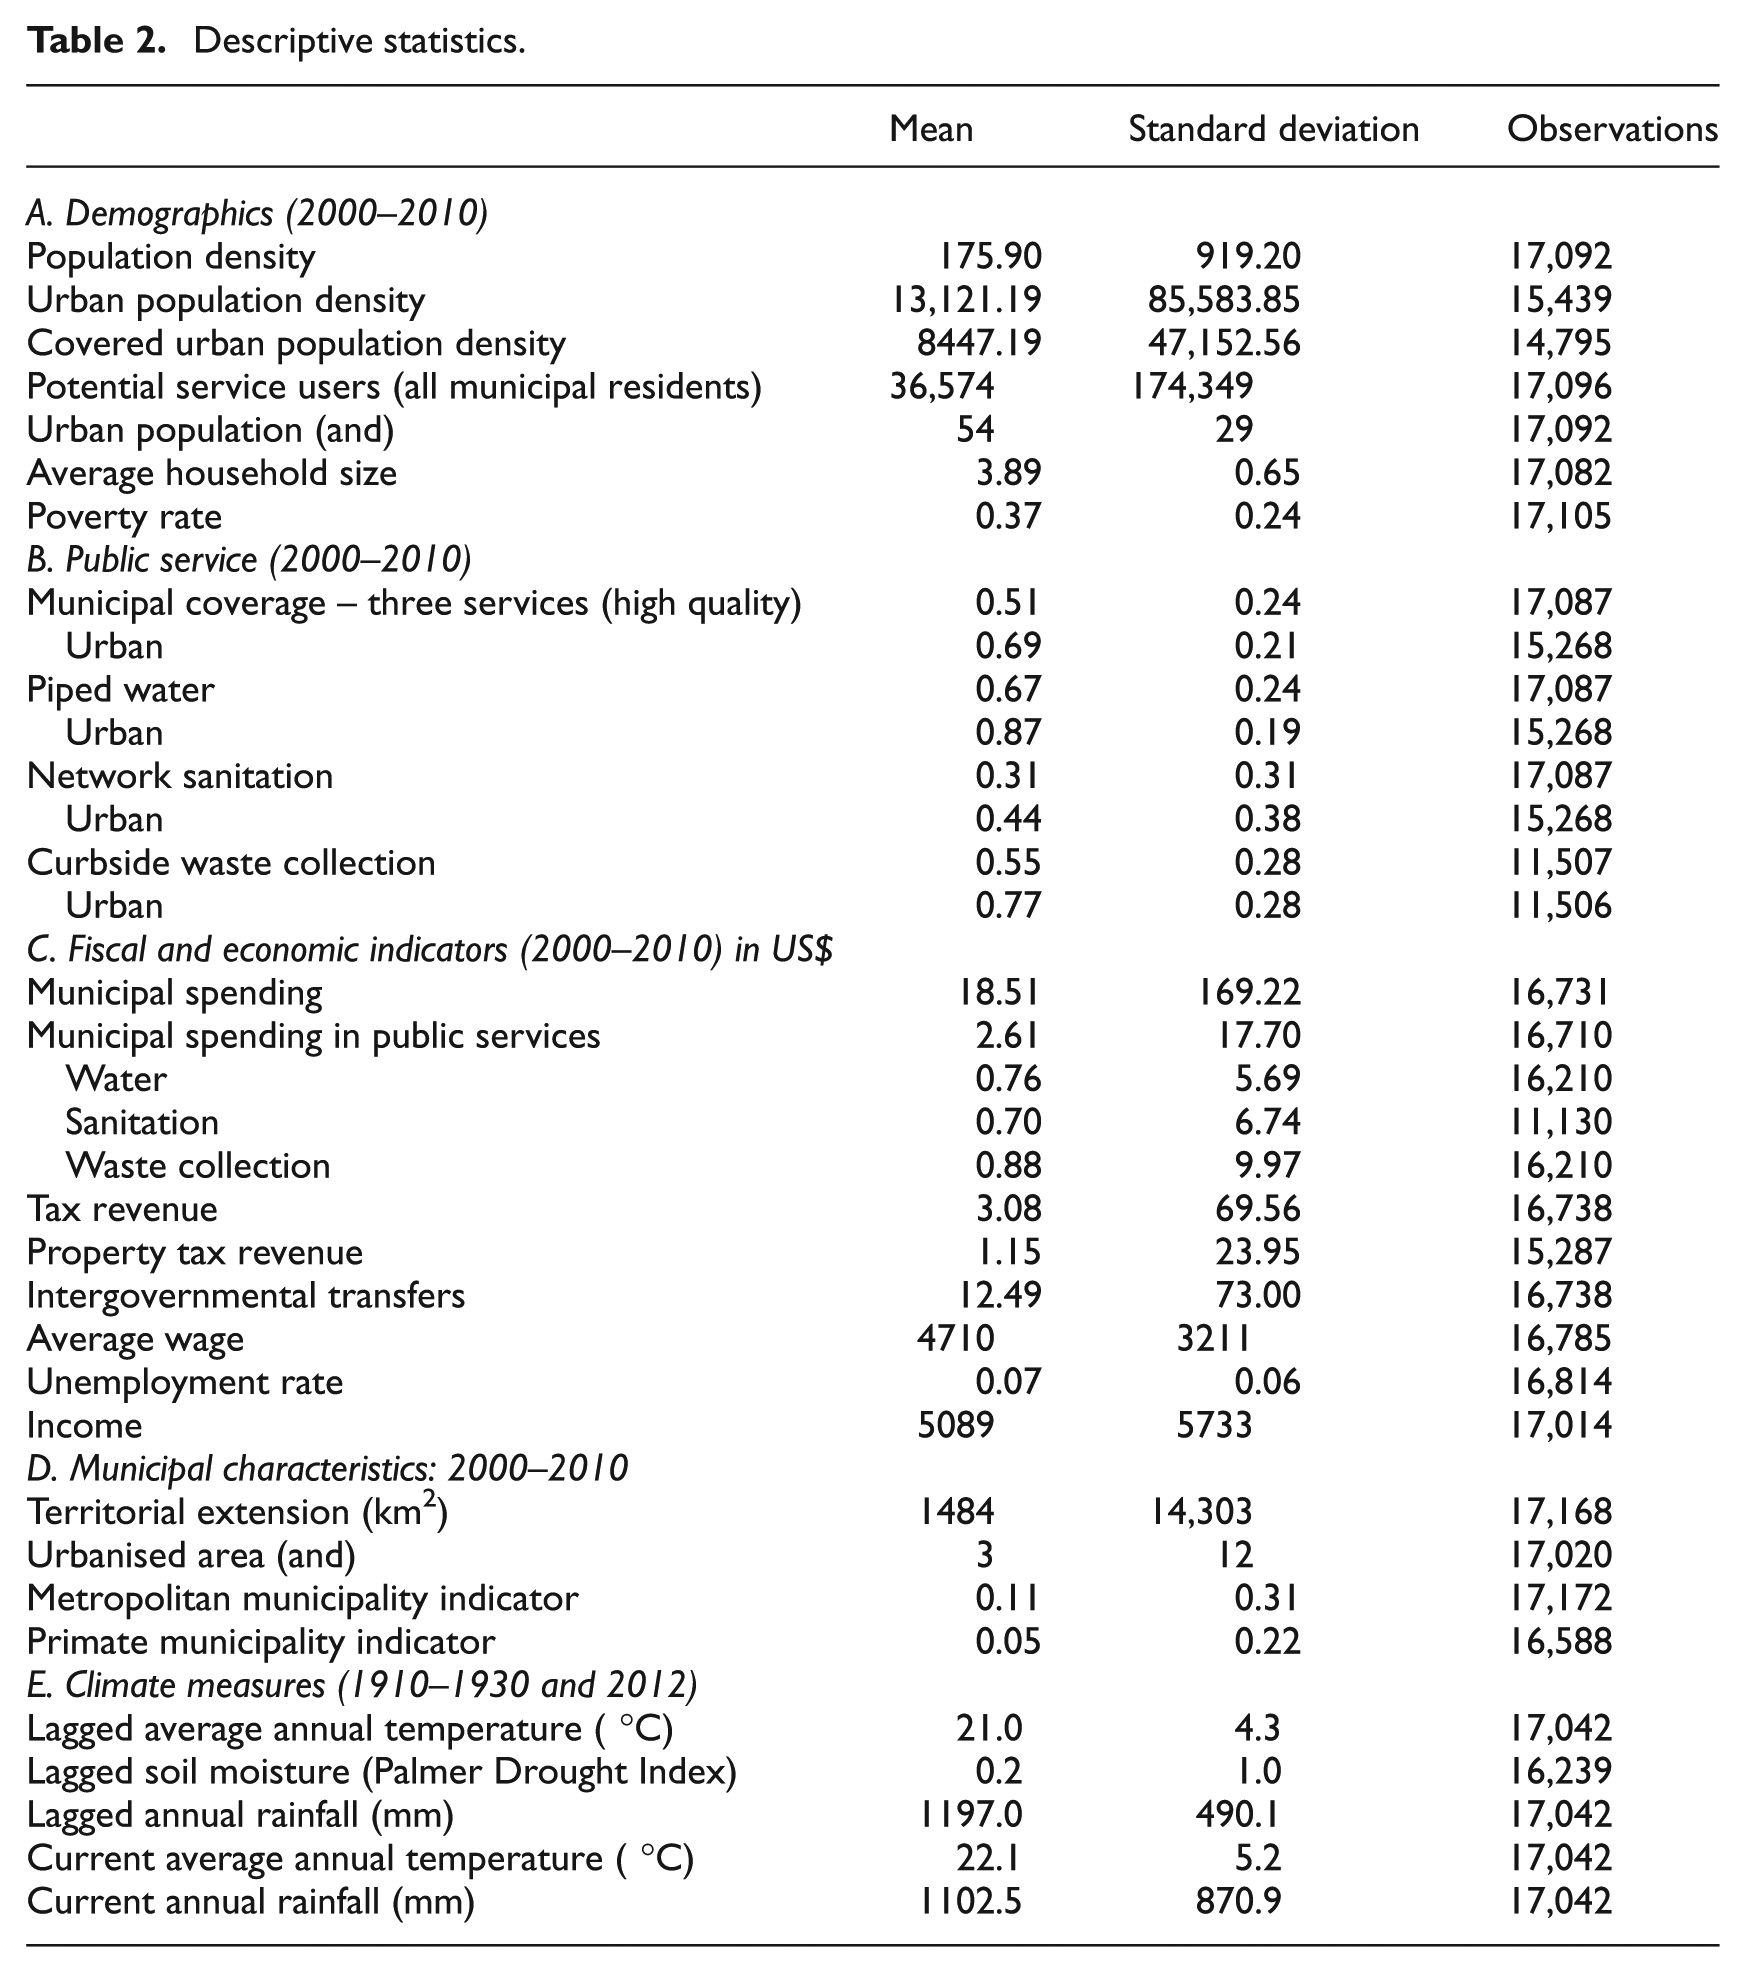
We work with municipal data on demographics, public services, economic and urban data from the national censuses; fiscal data from municipal account databases and climatic indicators from the University of East Anglia (UEA) and the National Oceanic and Atmospheric Administration (NOAA). Although we recognise that national statistics are different by nature, we combine information sources, resolve semantic conflicts and harmonise concepts as much as feasible to produce consistent variables. Table 1 indicates the respective disaggregate data sources employed for each variable. Table 2 presents a summary of descriptive statistics.
Data variables and sources employed, by country.

Descriptive statistics.
Demographic characteristics
We collect number of residents, poor residents, urban residents, 9 and average household size for each municipality, for two census waves, 2000 and 2010. For Mexico, we adjust estimates based on most recent immigration data by the United States Census Bureau.
Access to municipal public services
We construct a high-quality service coverage index based on population census and surveys at the municipal level. A coefficient of zero indicates that no household has access to water distribution, sanitation or waste collection services. Conversely, an index of one (100 on the percentile scale) indicates a municipality with universal coverage of those services. Each of the three services carries equal weight, and in all cases we only consider high-quality coverage levels. Recall that high-quality water coverage is defined as the percentage of households in each municipality with a water service pipe connected with in-house plumbing to one or more taps, high-quality sanitation coverage is the percentage of households with a piped sewer system and high-quality waste collection coverage is the percentage of households provided with curbside collection. 10 We build this index for each municipality for each available census year.
Fiscal and economic characteristics
We utilise municipal revenue and spending data on public services for years 2000 and 2010. We employ data on annual tax revenue, property taxes, intergovernmental transfers and employees’ compensation. 11 In particular, municipal spending comprises employee compensations, administrative costs, urban services, public investments and other public services partially financed by the state and federal governments (i.e. education, health and others), financial investments and public debt. Additionally, we obtain data on the municipal average wage and income (approximated by the per capita gross domestic product). Wages are defined as the remuneration before deductions per employee. Following Borcheding and Deacon (1972), we assume that production functions over municipalities are identical, and in the form of Cobb–Douglas, and exhibit constant returns to scale, so that capital is assumed to be perfectly mobile while labour is not. Hence, the wage rate per unit of labour differs across jurisdictions and as such capture input costs, which affect the cost of producing public services. Income is approximated by calculating the sum of gross value added in the economy (i.e. gross domestic product) and dividing it by the total population. In its logarithmic form, this variable permits the estimation of the income elasticity of demand, which illustrates the responsiveness of the demand for urban public services to a change in the average income, ceteris paribus (Hortas-Rico and Sole-Olle, 2010), For Brazil, Chile and Ecuador, we deflated monetary values by using national implicit price indices. For Mexico, we constructed a 32-state price index based on INEGI’s 46-city national consumer price sample. Final data are expressed in 2010 US dollars (INEGI, 2011). We harmonise the data based on the International Monetary Fund Government Finance Statistics Manual guidelines.
Urban indicators
The municipality is the smallest available geographical unit we can document. While our data do not categorise cities per se, we use Landsat images and GIS data to identify urban areas within a municipality and obtain urban spatial indicators. Furthermore, we create two separate dummy variables indicating whether a municipality is a primate city, and whether it belongs to a metropolitan area. These concepts are defined differently across countries, and we follow each country’s definition (CONAPO, 2010; IBGE, 2008; INE, 2005; SENPLADES, 2009).
Climate indicators
We use monthly average daily temperature and precipitation data generated from the University of East Anglia Climatic Research Unit (CRU) (2014) time-series data sets spanning the period 1910–1930. These are calculated on high-resolution (0.5°× 0.5°) grids. Similarly, we obtain monthly self-calibrated average Palmer Drought Severity 12 Index values (Palmer, 1965), to proxy for soil moisture, from NOAA’s National Center for Atmospheric Research. These are calculated on 2.5° latitude × 2.5° longitude global grid (NOAA, 2014). We construct our municipal data by applying a spherical interpolation routine: we take weighted averages of the 10-year climatology of temperature, rainfall and soil moisture for every gridded point within 150 km of each municipality’s geographic centre, with the inverse squared haversine distance between the grid point and the municipality centroid as the weighting factor.
Results
Density and coverage
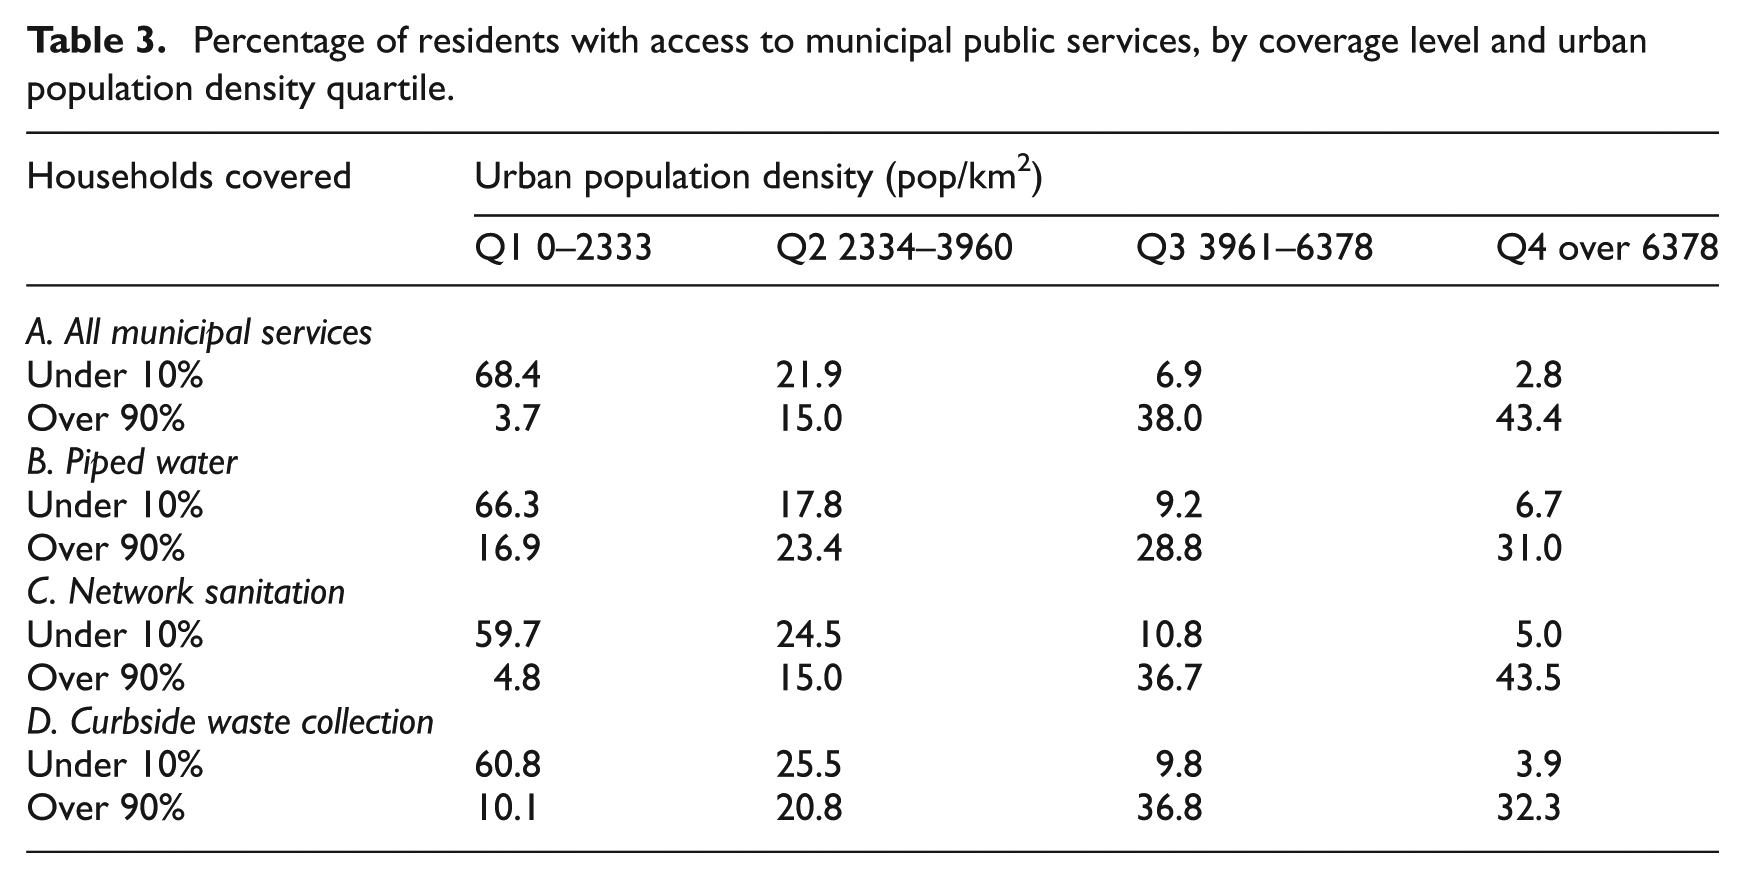
We begin our analysis with a simple question: In which municipalities do households have more access to high-quality water, sanitation and waste collection services? We estimate a nonparametric locally weighted regression (Fan, 1992) with an Epanechnikov kernel to display municipal coverage levels as a function of urban density. We restrict the sample to 90% of the observations. Figure 1 indicates that a larger share of the urban population with access to high-quality services is observed in denser urban areas. More than two-thirds of the municipalities whose coverage level is below 10% are in the first quartile of the urban population density distribution. Conversely, over 43% of the municipalities enjoying coverage levels above 90% are in the top quartile (Table 3).
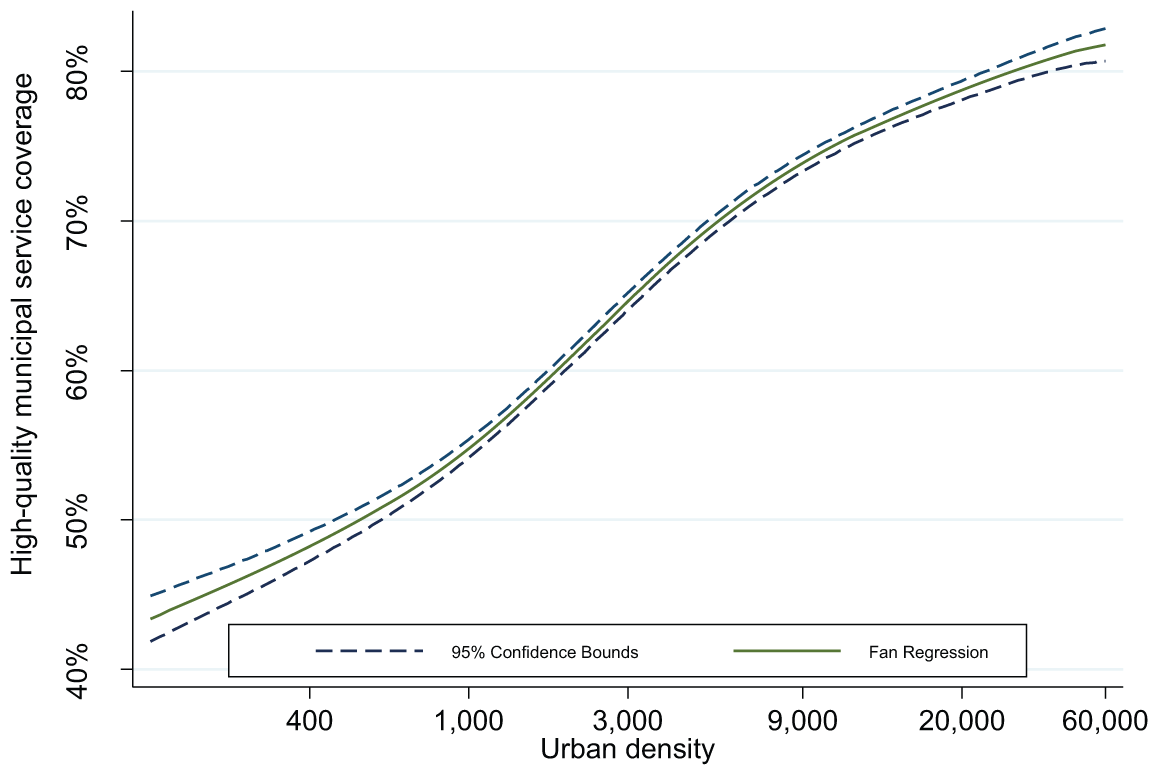
High-quality municipal service coverage on urban density. Nonparametric Fan locally weighted regression, using an Epanechnikov kernel and a bandwidth of 1 with bootstrapped standard errors, conditional on regional fixed effects and country-specific time trends.
Percentage of residents with access to municipal public services, by coverage level and urban population density quartile.
This relation is consistent and holds when disaggregating coverage by type of service (Figure 2), but sanitation coverage is much lower than that of the other two and water coverage is high even for sparsely populated urban areas.
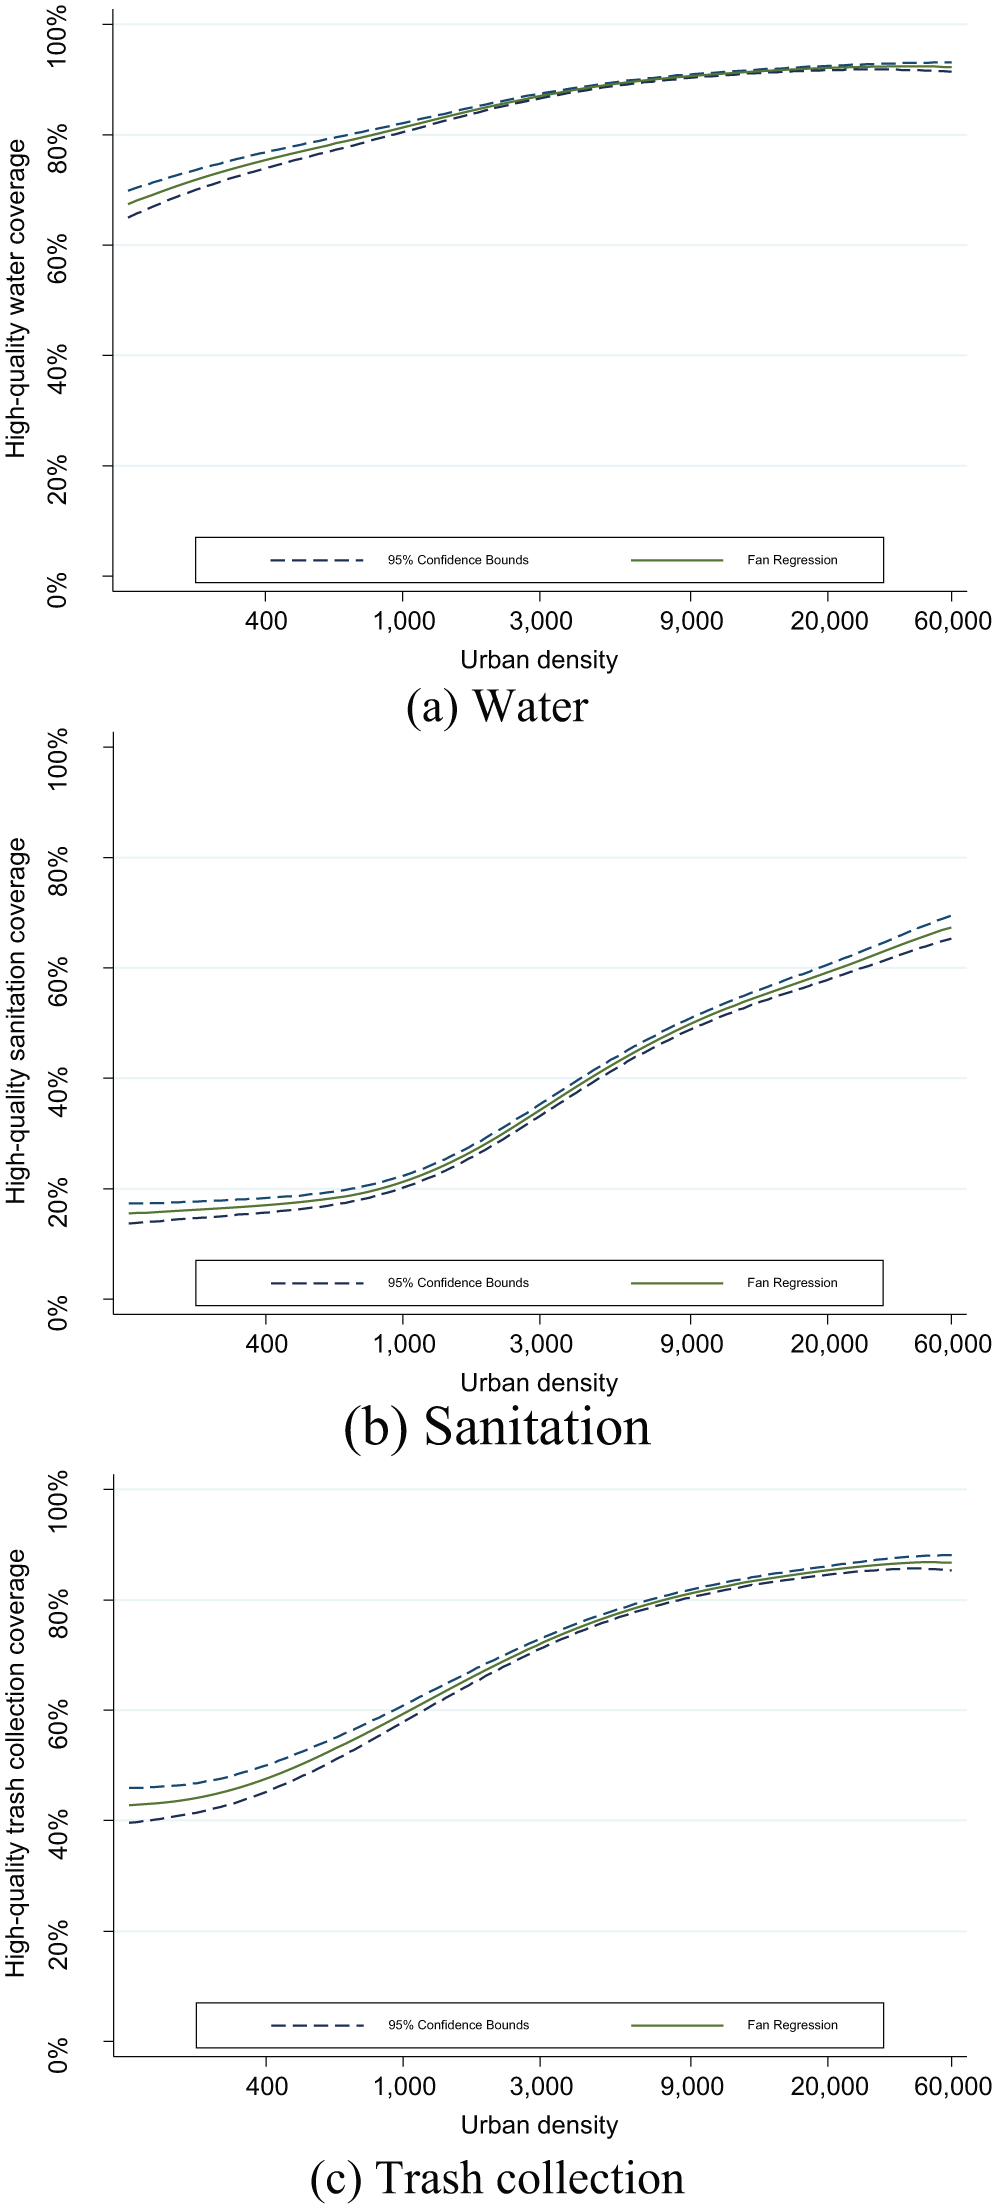
High-quality municipal service coverage on urban density, by type of service. Nonparametric Fan locally weighted regression, using an Epanechnikov kernel and a bandwidth of 1 with bootstrapped standard errors, conditional on regional fixed effects and country-specific time trends.
From these figures alone, it is impossible to determine to which extent urban density affects municipal spending patterns, particularly its magnitude at different parts of the distribution. Figure 3 illustrates a locally weighted regression that shows the relationship between urban density (percentiles) and municipal expenditures in public services per head. It would seem that the relationship is U-shaped, yet the statistical significance of a causal effect of urban density on local spending should be verified, given the endogeneity of density to spending patterns. We turn now to our empirical strategy to address this issue.
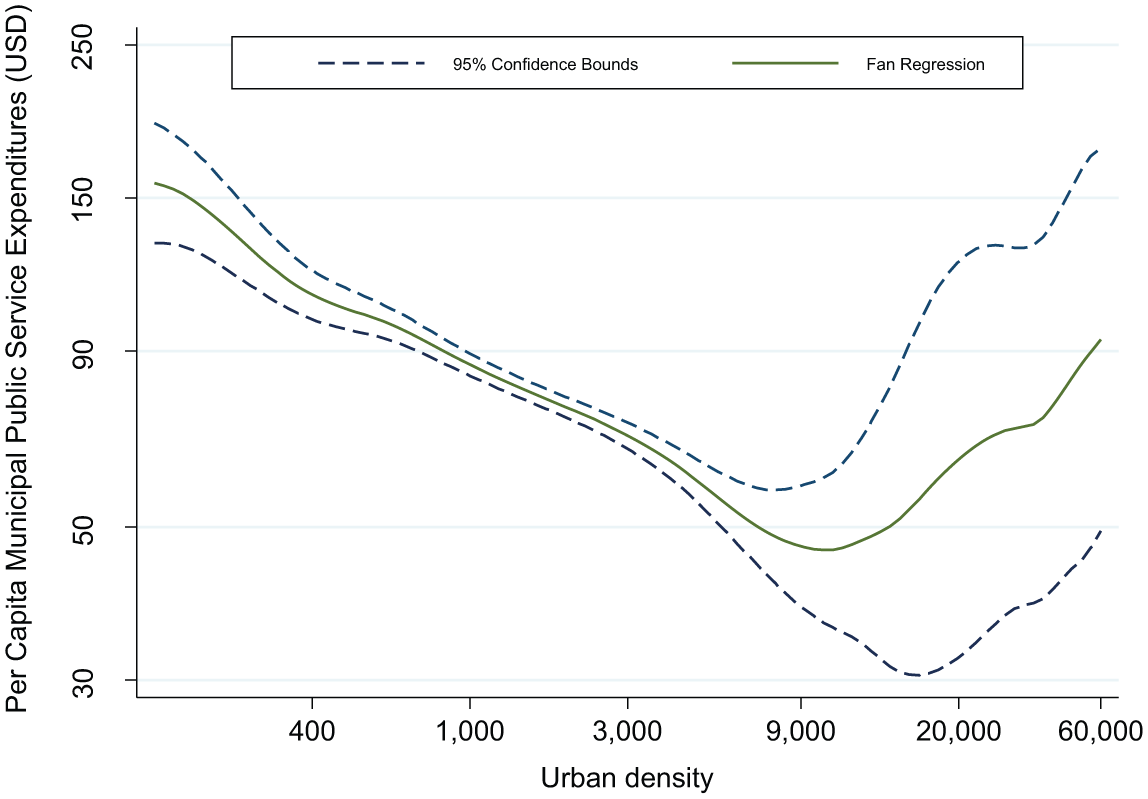
Municipal public service spending per head on urban density. Nonparametric Fan locally weighted regression, using an Epanechnikov kernel and a bandwidth of 1 with bootstrapped standard errors, conditional on regional fixed effects and country-specific time trends.
First-stage relationship and reduced-form results
We now discuss the ability of our instruments to predict current population density. Remember that our instrument set includes lagged municipal temperature, rainfall and soil moisture conditions. The first-stage relationship between our set of instruments and population density is always significant, with the strongest association being observed between soil moisture, temperature and urban density (Table 4). The relationship is also robust and equally significant when we add controls for municipal characteristics and two-way fixed effects, as well as country-specific time trends (Regressions 5–7, Table 4). Notice that the first-stage relationship remains strong and significant when rainfall substitutes soil moisture conditions as part of the instrument set. Although statistical tests show that climate instruments are moderately strong (F-statistics ranging from 9.0 to 18.9), we estimate as an identification check a false experiment specification in which future climatic conditions, which should be orthogonal to current urban density, are used as instruments. We find that coefficient estimates are indeed statistically equal to zero (Regression 8, Table 4).
Climate and population density (first-stage).
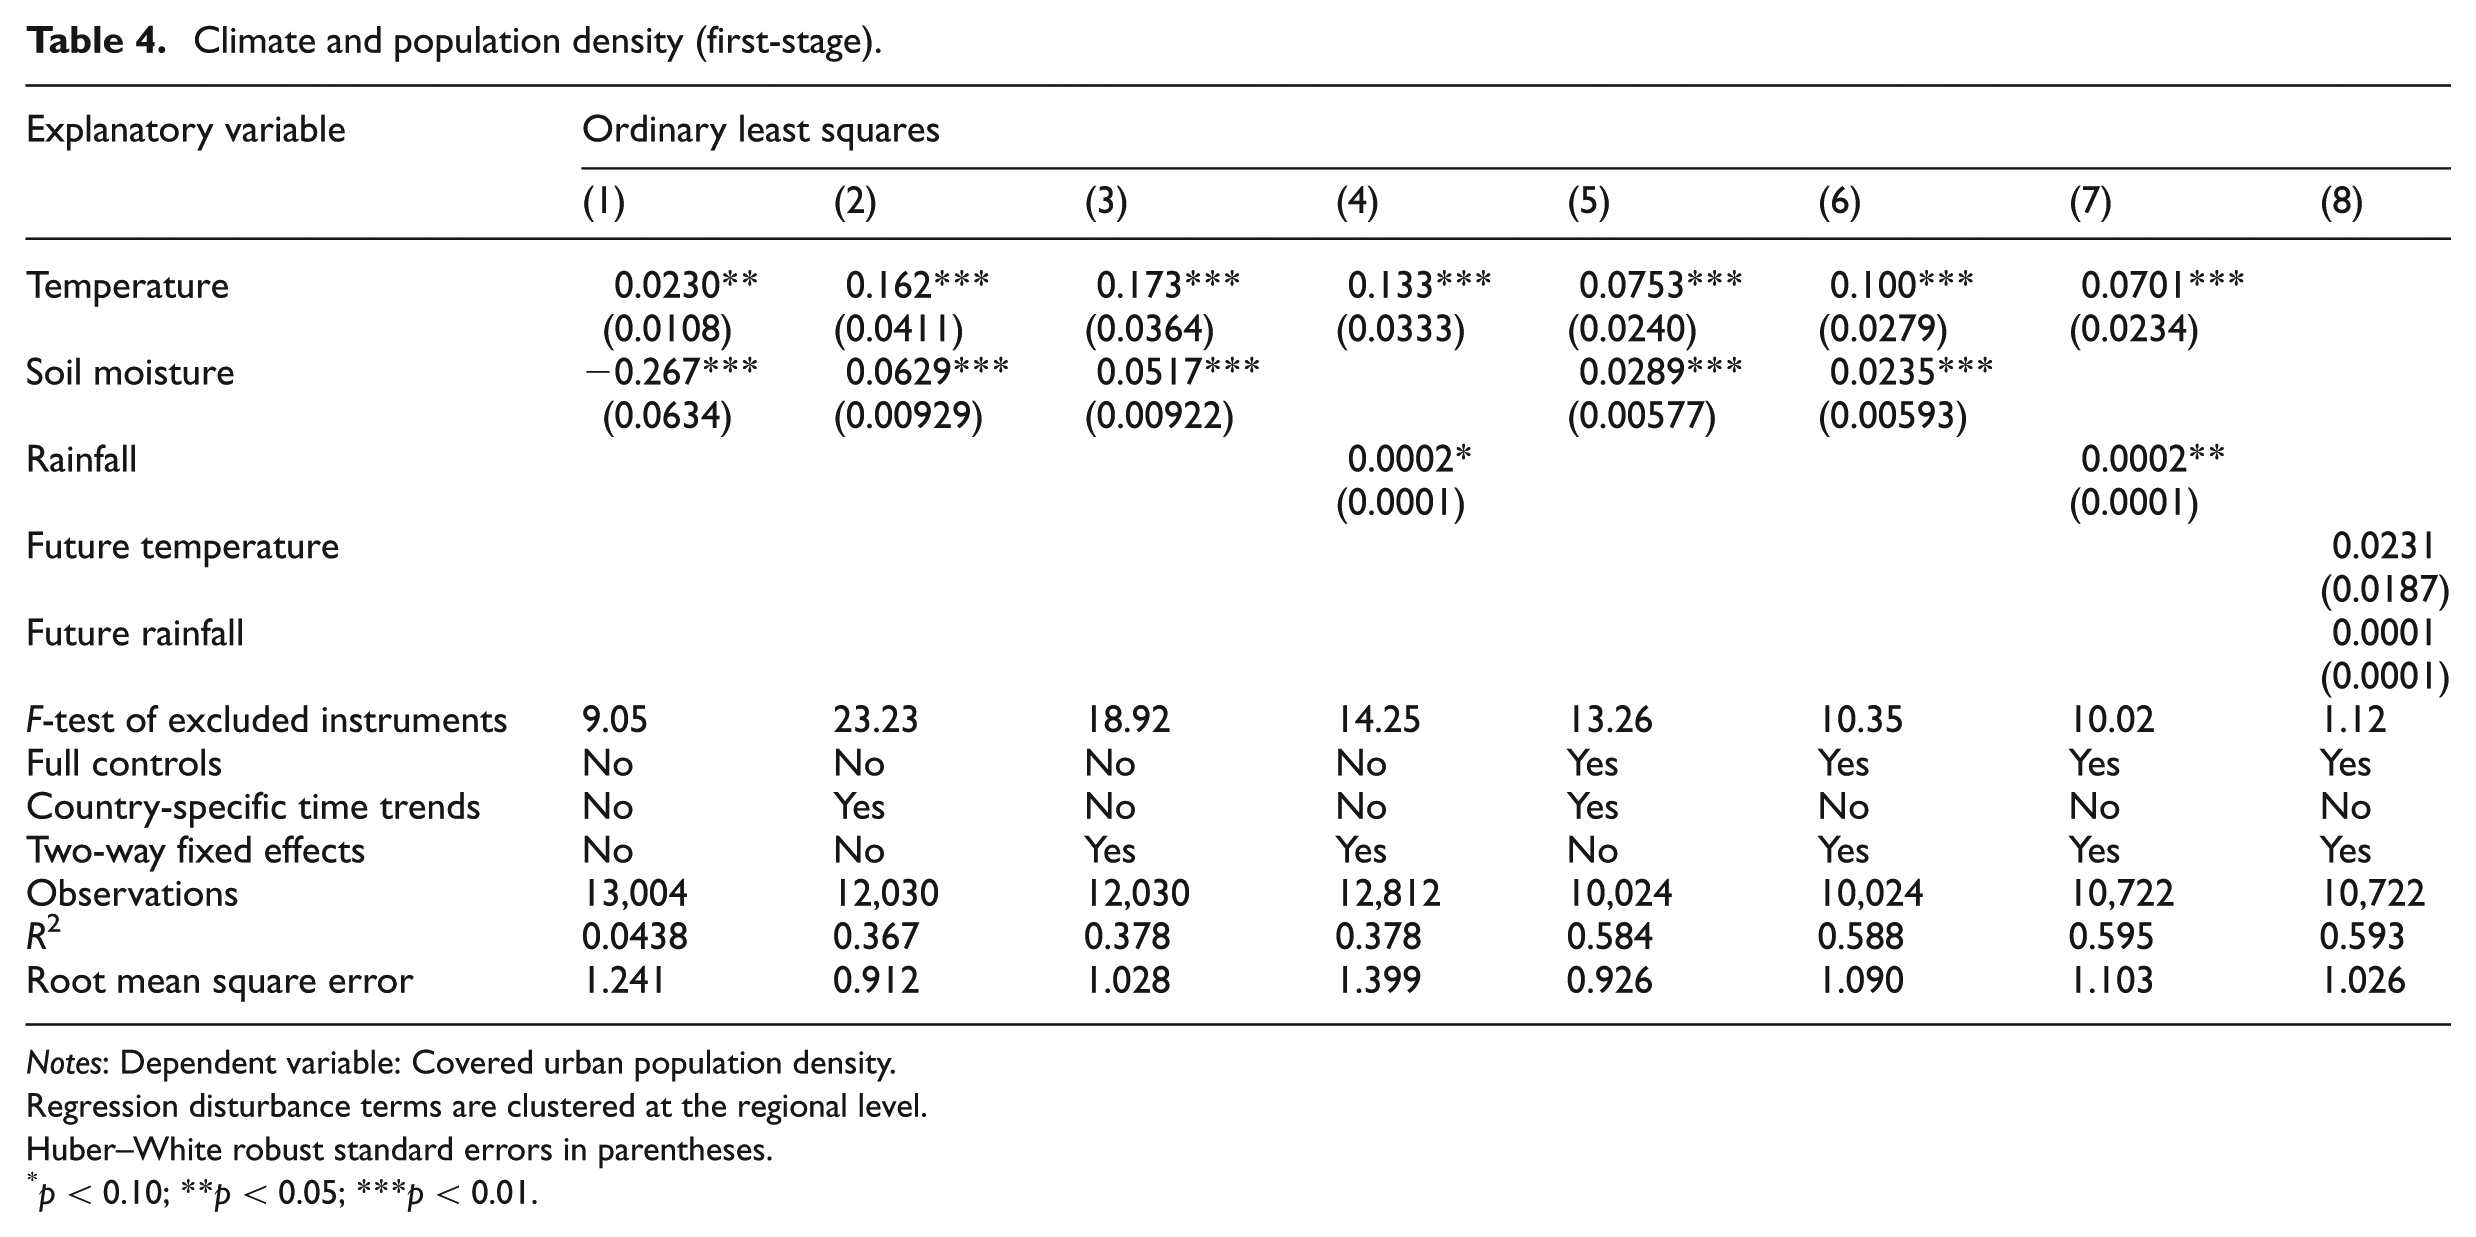
Notes: Dependent variable: Covered urban population density.
Regression disturbance terms are clustered at the regional level.
Huber–White robust standard errors in parentheses.
p < 0.10; **p < 0.05; ***p < 0.01.
Lower lagged temperatures are strongly associated with higher municipal spending in the reduced-form regressions. A 1% increase in lagged temperature is associated with a 10% decrease in per capita municipal spending in public services. Similarly, a 1% increase in lagged soil moisture is associated with a 0.1% increase in municipal spending in public services per head (Regressions 1 and 2, Table 5). These relationships are statistically significant at the 99% confidence. As expected, when only urban municipalities 13 are considered, the point estimates decrease in magnitude, but the relationship remains statistically strong (Regressions 6 and 7, Table 5). Similarly, reduced-form regressions indicate that our instrument sets are also associated with total municipal spending per head, but at lower magnitudes and somewhat lower statistical significance (Regressions 8 and 9, Table 5).
Climate and municipal spending in public services (reduced-form).

Notes: Regression disturbance terms are clustered at the regional level.
Huber–White robust standard errors in parentheses.
p < 0.10; **p < 0.05; ***p < 0.01.
Main empirical results
We perform both ordinary least squares (OLS) and instrumental-variable two-stage least squares (IV-2SLS) estimations. Given our previous theoretical discussion and nonparametric analysis, a nonlinear IV 2SLS with municipal fixed effects, country-specific time trends and controls specification is taken as our benchmark, and we focus on the results of this specification from now on (Table 7, column 10). Our results are similar when time fixed effects are included.
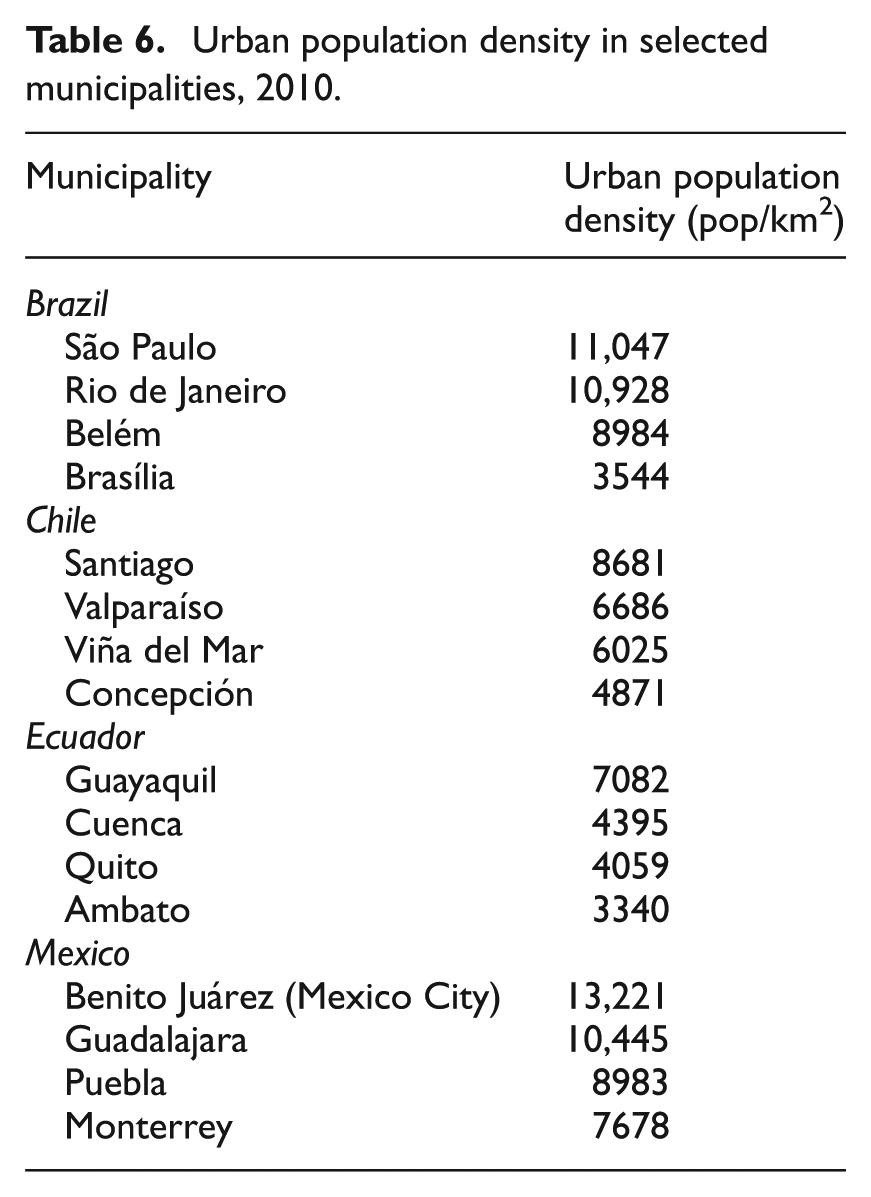
We find that the relationship between urban density and municipal spending in public services per head is strong and U-shaped, suggesting there is an optimal density point (the vertex of the parabola) where economies of scale are exhausted. An increase in urban density leads to lower per capita municipal public service spending in sparse and medium-sized urban areas, but a greater population density increases significantly the costs of providing public services in already dense jurisdictions. We identify an optimum density point at approximately 9000 inhabitants/km2. 14 Belém (Brazil), Santiago (Chile) and Puebla (Mexico), are among those municipalities near the optimal density range (see Table 6).
Urban population density in selected municipalities, 2010.
We find that the average municipality exhibits economies of scale, 15 it has near 8450 residents and spends US$75 per resident in basic municipal service provision. Our benchmark specification shows that a 1% point increase in population density leads to a 0.99% point decline in per capita expenditures in public services. 16 This equals to a decrease in current municipal service spending per resident from US$75 to US$67, given a 10% increase in urban density. In a municipality with lower-than-average densities, say at the first quartile (i.e. 2334 inhabitants per km2), a 1% increase in urban density would decrease per capita spending by almost 1.4%. Conversely, in a very dense municipality, say at the ninth decile (i.e. 9659 inhabitants per km2), a 1% increase in urban density leads to an increase in per capita spending by almost 0.1%. All these associations are significant at the 95% level (see Table 7). 17
Population density and municipal spending in public services.
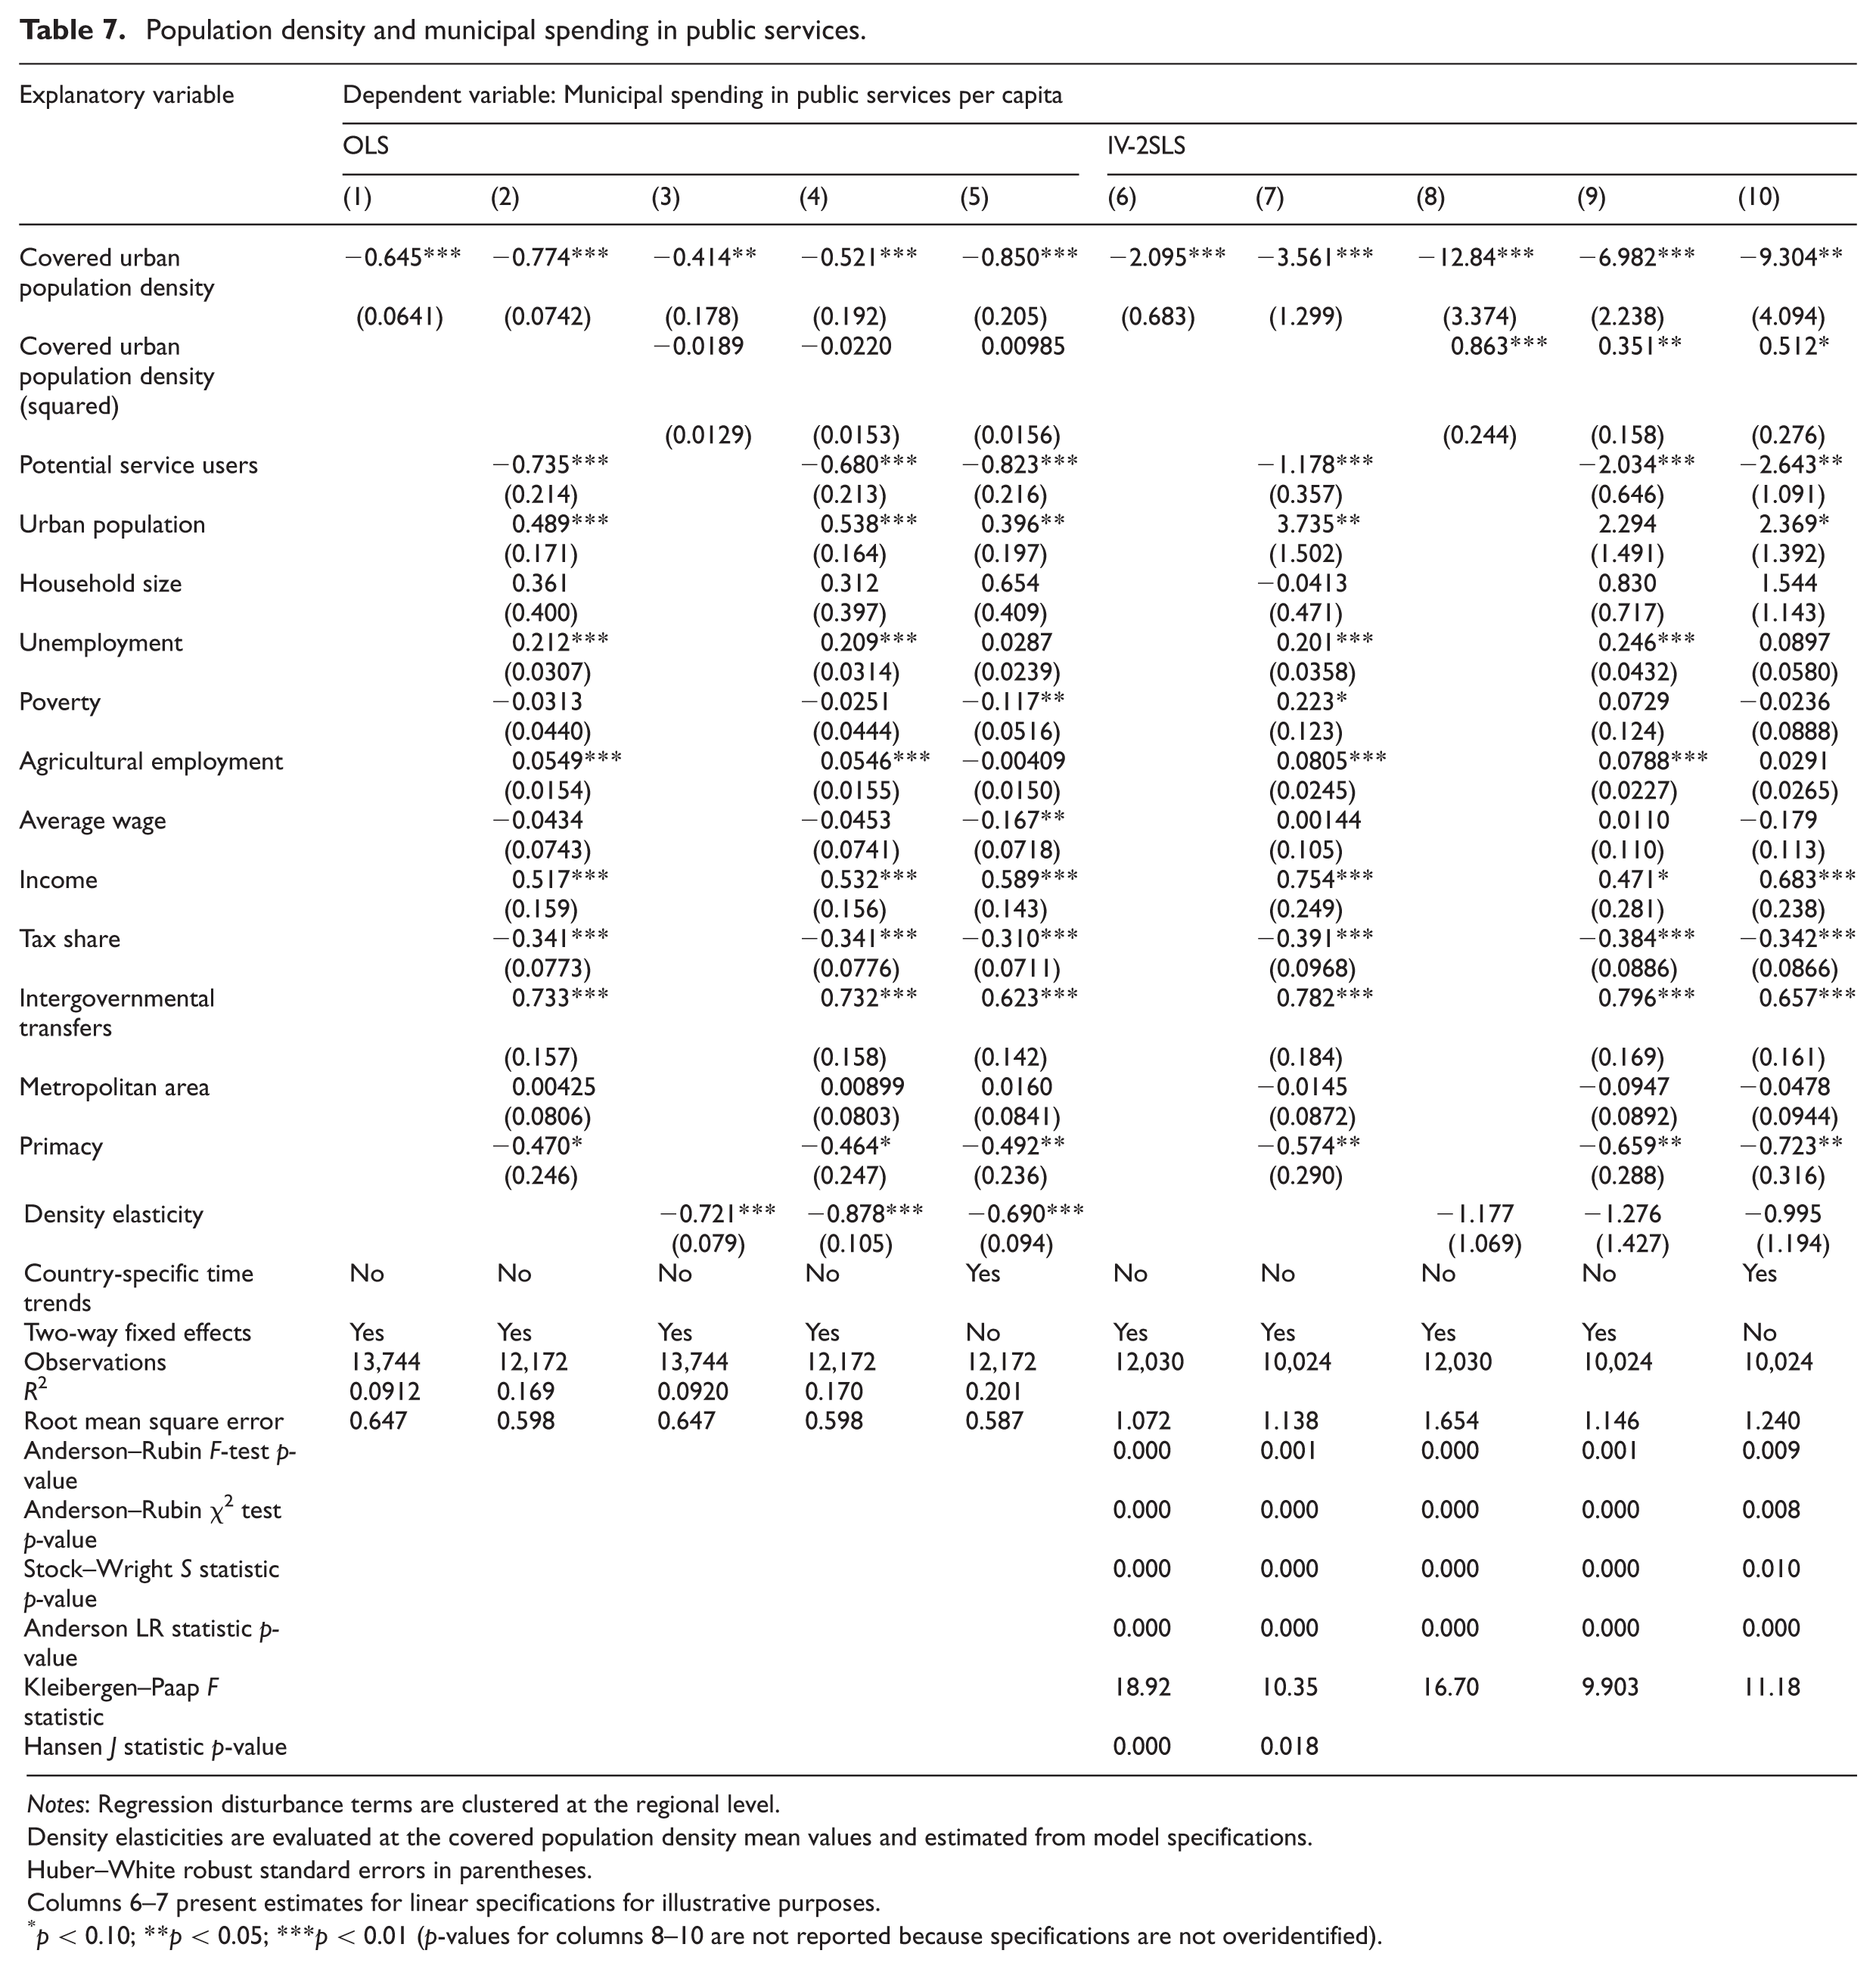
Notes: Regression disturbance terms are clustered at the regional level.
Density elasticities are evaluated at the covered population density mean values and estimated from model specifications.
Huber–White robust standard errors in parentheses.
Columns 6–7 present estimates for linear specifications for illustrative purposes.
p < 0.10; **p < 0.05; ***p < 0.01 (p-values for columns 8–10 are not reported because specifications are not overidentified).
The impact of urban density on municipal public service spending per head is significant in alternative specifications. To further assuage potential violations to the exclusion restriction (i.e. climate should affect municipal spending patterns only through density), we restrict our sample to urban municipalities. In our view, the most serious violation to the exclusion restriction is a potential climate effect on income. However, while there is evidence that climate is robustly related to income in rural areas, it has not been found to exert a clear effect in urban centres (Guerrero Compeán, 2013).
When non-urban municipalities are excluded, the elasticity of population density, based on our preferred benchmark framework, is approximately −1.5 for the average municipality (Regression 2, Table 8). The results remain statistically significant at the 95% level. Again, we find evidence in support of a U-shaped relationship, with low- (high-)density urban municipalities exhibiting economies (diseconomies) of scale. For sparsely populated urban municipalities – at the first decile – 1% point increase in population density leads to a 3.4% point decline in per capita municipal spending in public services. Conversely, for the urban municipality at the ninth decile, a 1% point increase in population density leads to a 0.4% point increase in municipal public service expenditures per head.
Population density and municipal spending (alternative specifications).
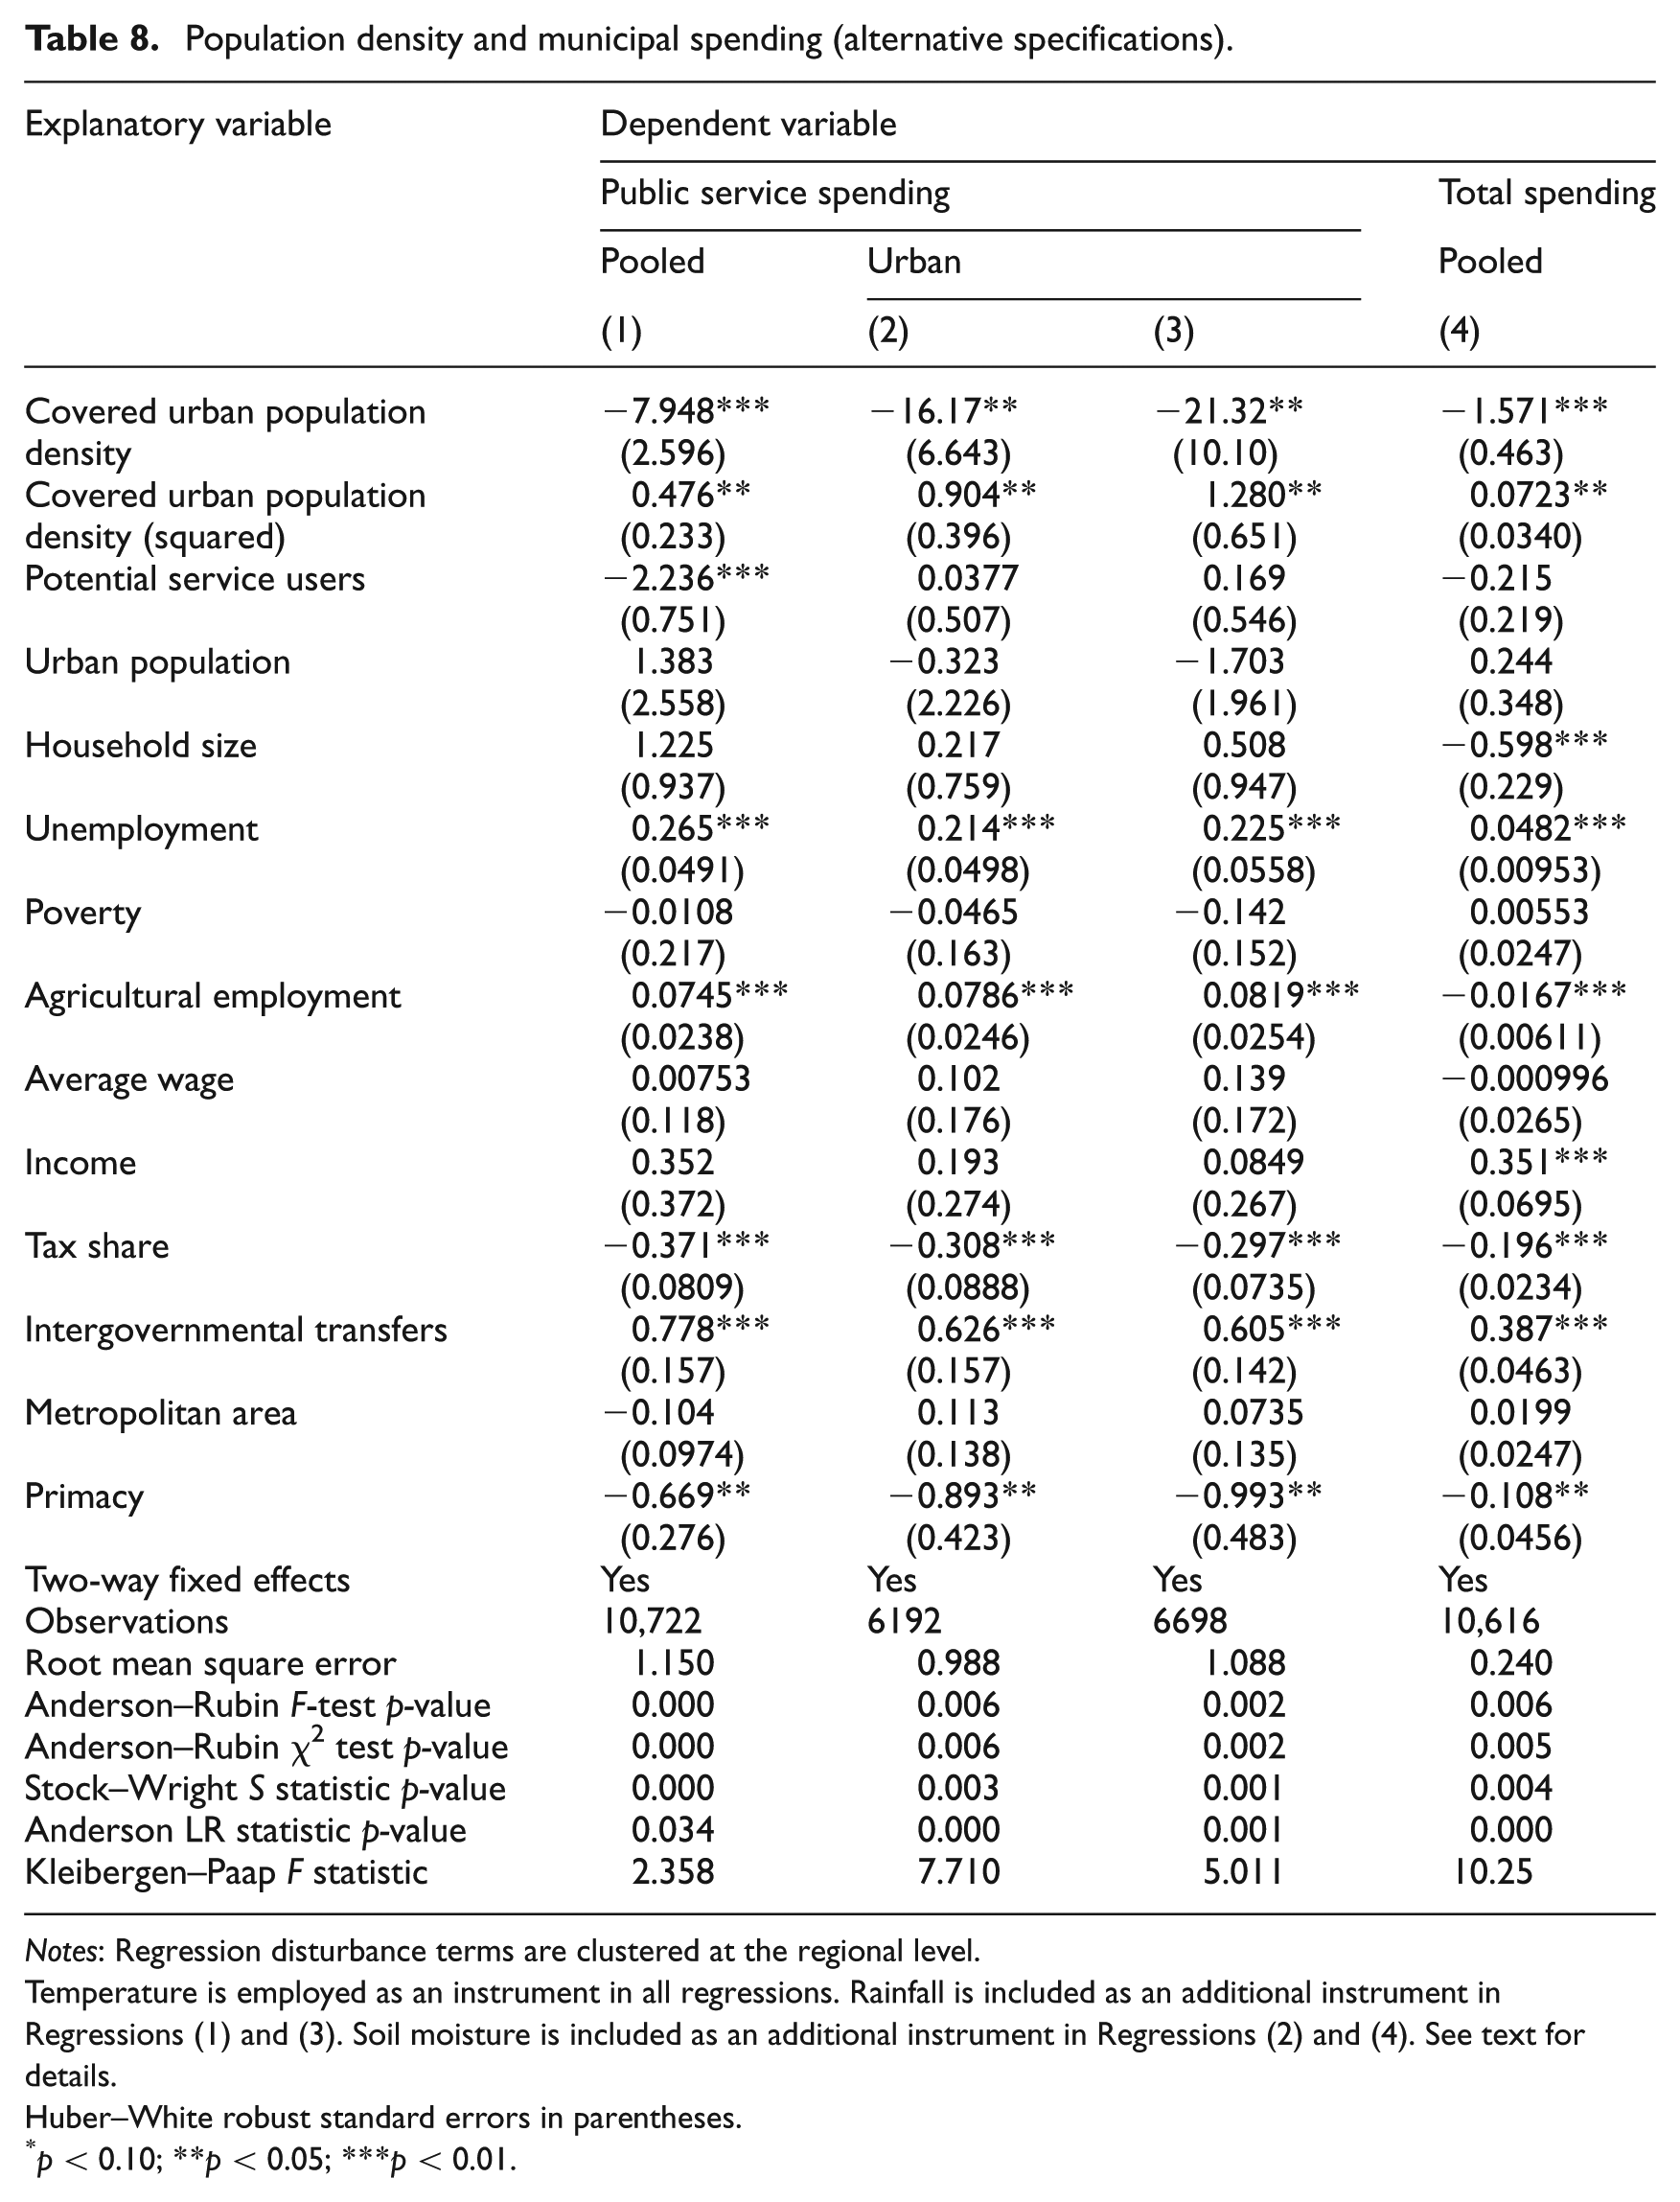
Notes: Regression disturbance terms are clustered at the regional level.
Temperature is employed as an instrument in all regressions. Rainfall is included as an additional instrument in Regressions (1) and (3). Soil moisture is included as an additional instrument in Regressions (2) and (4). See text for details.
Huber–White robust standard errors in parentheses.
p < 0.10; **p < 0.05; ***p < 0.01.
The IV-2SLS fixed-effects results are robust to an alternative dependent variable. When the relationship between urban density and total municipal spending per head – as opposed to per capita spending in public services – is considered, we find that most municipalities exhibit economies of scale, with the trough being at a population density of over 50,000 people per square kilometre (Regression 4, Table 8). 18 Similarly, the choice of instruments does not change the statistical significance of our results. Urban population density does not have a statistically differential impact on public service spending per head (for either the pooled or urban-only specifications) when rainfall is included as an additional instrument (Regressions 1 and 3, Table 8).
Conclusion and policy implications
Current policies promote density on the grounds of its environmental and productivity paybacks. While these are important benefits, we should also acknowledge the cost of density. In this paper we focused on how urban density impacts per capita municipal spending on public services. Because the bulk of policy advice recipients are developing countries, we were particularly interested in highlighting the dynamics of density where public service coverage is not universal.
We find that population density is strongly linked to coverage. More than 90% of the municipalities whose coverage level is below 10% are below the median of the urban population density distribution. Conversely, four out of five municipalities enjoying coverage levels above 90% are above the median. This same pattern holds true when considering only municipalities with a majority of urban residents, and when counting each service on its own.
We find that the relationship between density and per capita spending in services is U-shaped, with an increase in urban density lowering spending in sparse and medium-density municipalities, but higher densities increasing significantly the costs of providing urban public services. In on our empirical study of more than 17,000 municipalities the threshold between these two conditions is approximately 9000 residents per square kilometre. We address the endogeneity of density to public service spending by relying on climate variation as an instrumental variable. We hypothesise that density increases per capita spending in urban services in already dense areas because these places host diverse building typologies and population needs, hence requiring a wider and costlier set of technologies to provide coverage. Land and labour could also factor in the higher cost, as these are usually more expensive in dense places.
As discussed above, we analysed the fiscal impact of density for municipalities providing coverage of urban services at the highest available quality, on both comparability and policy-targeting grounds. Besides density, we suggest including other formal attributes when analysing municipal expenditures. It will also be important to examine the impact of density on the structure of municipal expenditures, distinguishing capital from operational costs. Current data do not allow us to perform these studies. Last, an important contribution will be to study how density impacts on the costs of delivering urban services in informal settlements, given that delivering services ex post is more expensive.
From a policy perspective the association between municipal spending and density is good news. We have better tools to control population density than to limit population sizes. Building codes and performance zoning are useful to regulate densities. Then again, the cost of changing the existing status quo needs to be taken into account when planning for density. While densification should lead to economies of scale in sparsely populated areas, expanding coverage may be harder. Conversely, increasing coverage in a dense area might be easier, even if it is more expensive. This is true inasmuch as local governments fiscally capitalise the benefits of a more comprehensive coverage, and many urban areas are already zoned for higher densities.
The fact that density increases per capita public service spending in highly dense urban areas does not mean it is bad policy. It just underscores that growing cities need growing resources. A finer-grain study of where it makes sense to densify within a single municipality is needed. It may be more effective to promote density in certain neighbourhoods with a given set of spatial features. It may require assembling land in low dense areas – where it should have a lower market price – and then rezone it for higher densities. Tools for promoting density – such as master plans and fiscal incentives – should be reconsidered in light of their impacts in other dimensions, as well as the delay between their legal enactment and actual implementation. It would be more effective to promote density by increasing the quality and access to urban services. In that sense, quantitative references here should be taken as part of a larger picture in the analysis of each city, in which history, culture and geography play a key role. In all cases, governments should take a long, strategic view towards urban growth.
Finally, our study calls for an integral approach to determining ideal densities. We limit our analysis to municipal spending on certain services, but density has other costs and benefits too. Among the first ones, is the evident impact on land values; among the latter ones, is the containment of the urban environmental footprint. The power of density as a planning tool deserves a careful, site specific consideration. Overall, city density is not homogeneous but an abstraction of a variety of urban forms, evermore when similar density levels could be achieved through different configurations and new technologies could alter current public services cost structures. A good policy would preserve urban diversity.
Footnotes
Acknowledgements
We thank Vicente Fretes-Cibils for supporting this research and for his extremely helpful comments. This work has benefited from the excellent research assistance of José Joaquín López. The views expressed herein are those of the authors and not necessarily those of the Inter-American Development Bank.
Funding
We gratefully acknowledge support of the Inter-American Development Bank for this study.