
Abstract
This paper investigates the combined problem of high car dependence and housing affordability, in view of likely continued volatility in oil prices (and hence higher petrol and diesel prices), and rising house prices. Household budgets are likely to be stretched where there are high levels of car dependency and housing unaffordability – with little flexibility for rising costs in either or both of these. A composite car dependence and housing affordability (CDHA) index is developed, using indices of oil vulnerability related to car travel and housing affordability. Greater London is used as the case study, with 2001 and 2011 data analysed at the level of Lower Super Output Areas, and presented using Geographic Information System and R statistical software. The findings reveal that there are high levels of composite car dependence and housing price vulnerability in many suburban areas across Greater London, adding to the previous areas of social deprivation found mainly in East London. The composite CDHA index illustrates where the most vulnerable areas are spatially. Many neighbourhoods may become less attractive for those on median or even relatively high incomes. The areas most affected may become much more expensive to live in, potentially leading to much greater pressure on travel and housing costs as people could be forced to live further from the centre of London, including beyond the Greater London boundary, which has further implications for travel. Failing to consider these emerging affordability issues represents an oversight in terms of transport planning in London.
Introduction
Social deprivation has conventionally been measured in terms of multiple deprivation indices, covering issues such as: income; employment; health deprivation and disability; education skills and training; barriers to housing and services; and crime (DCLG, 2015a). Recent trends in London and other cities have led to concerns over further categories of vulnerability which have a different socio-spatial pattern across the urban area.
The concept of ‘oil vulnerability’ was first identified by Dodson and Sipe (2006, 2007, 2008), and reflects the effects of rising fuel costs on different neighbourhoods. Much of the previous work in this area has focused on Australian cities, such as Brisbane, Sydney, Melbourne and Perth, where high levels of vulnerability were found in the outer suburbs. Runting et al. (2011) and Leung et al. (2015) have modified the indexes used. There has been some research in the UK, e.g. Yorkshire and the Humber (Lovelace and Philips, 2014), which found that the impacts of high oil prices differed significantly between urban and rural areas. Similarly, in suburban USA, it was found that commuters who relied on long-distance car journeys to get to work were unevenly affected by high oil prices (Sexton et al., 2012). The high costs associated with transport, especially car travel, place a heavy burden on low and/or moderate income households (Hills, 2012; Lucas et al., 2016; Mattioli et al., 2016; Stokes and Lucas, 2011; Stokes, 2015).
In addition, in many parts of the UK, housing costs are currently high and housing affordability has been identified as a problematic social issue (Edwards, 2016; Jacobs et al., 2003; Kemeny, 2004). In combination, high car dependence and high housing unaffordability may result in problems for many household budgets in future years. However, there has been very limited recognition or analysis of the joint effects of transport and housing costs, with the exception of a small number of studies (such as Guerra and Kirschen, 2016; Lipman, 2006; Metro Vancouver, 2015). This paper focuses on the interlinked problems of high car dependence (CD) and housing affordability (HA), by developing a composite car dependence and housing affordability (CDHA) index. It is argued that this dual problem is often overlooked in transport planning, yet makes specific neighbourhoods very vulnerable to rising oil prices and rising house prices. Vulnerability to car dependence is viewed as households with high levels of car usage and a high risk of incurring increased fuel costs for their daily car journeys; whilst housing affordability is defined in terms of median house prices relative to median incomes.
The aims of this paper are to:
investigate the change in relative CD and HA between 2001 and 2011 in Greater London, using local geographical areas as a unit of analysis (Lower Super Output Areas 1 );
investigate which parts of Greater London are more vulnerable to the combined CDHA problem;
compare how the CDHA index relates to the conventional multiple deprivation indices (IMD) spatially.
Assessing travel vulnerability in London
London provides a different context to the previous analyses that have been conducted on travel vulnerability, as it is regarded as a progressive city in sustainable transport planning terms, with a compact built form and relatively high levels of investment in public transport (Hickman and Banister, 2014). It has developed and implemented some innovative traffic demand management measures, such as congestion charging. Yet, beyond central London, the suburban areas of the city are perhaps not so different to other more dispersed contexts, with an estimated 48% of all trips by Outer London residents still being made by car (TfL, 2014). Between 2001 and 2011, there have been large changes in travel behaviour, for example with increased journey to work distances by car in Outer London; and housing unaffordability has increased dramatically. In 2015, there were 2.56 million licensed private cars in Greater London. This equates to an average of 0.3 cars per adult. In total, 46% of households do not have a car, 40% have one car and 12% have two cars, with very few households owning three or more cars (TfL, 2015).
The approach to assessing composite car dependence and housing vulnerability used in this paper develops the approach used in Dodson et al. (2015). Dodson and co-authors have developed two approaches for analysing oil vulnerability, and mortgage and oil vulnerability. Initially, they developed the ‘Vulnerability Index for Petrol Expense Rises’ (VIPER) which comprises three key indicator variables: (1) dependence on private cars for travelling to and from work; (2) the proportion of households which own cars; and (3) the socio-economic status of households (Dodson and Sipe, 2005, 2007). This approach was extended as the ‘Vulnerability Assessment for Mortgage, Petrol and Inflation Risks and Expenditure’ (VAMPIRE), which incorporated the combined impacts of petrol price increases and rising mortgage interest rates (Dodson and Sipe, 2006). Both indexes used data from the 2001 Australian Census, while VAMPIRE also includes data from the mortgage exposure index. Lovelace and Philips (2014) follow a similar approach using 2001 UK Census data and the Understanding Society data set (USd), the latter of which is an individual level survey. This required a matching of zonal (Census) and individual level data (USd).
Though it could be argued that high oil prices are not such a current problem, we suggest that much volatility is likely to lie ahead. Overall, oil prices (inflation adjusted price) increased dramatically by 198% from US$30.68 per barrel in 2001 to US$91.37 per barrel in 2011 (InflationData, 2016). Although oil prices are currently running at lower levels (Brent Crude oil 2 was around US$52 per barrel in May 2017), in the long-term they are likely to be volatile and to reach higher levels again since oil is a finite resource. The highest oil price so far has been US$140 per barrel in June 2008. The current fall in oil prices is due to a complex mix of factors, including new findings of unconventional sources, such as shale gas; lower increases in demand from China and the emerging markets; and restriction of supply. Concerns over international security are also rising, with oil price volatility likely if supply is disrupted from the Middle East and other key sources.
There are different approaches to assessing car dependence vulnerability in the UK. According to the 2011 Living Costs and Food Survey (LCF – formerly called the Expenditure and Food Survey), transport costs accounted for an average of £65.70 3 per week (Horsfield, 2012a). Although it would be useful to analyse household expenditure on travel alongside housing costs, we use levels of car dependence from Census data. Census data allows a much finer comparison at the LSOA level relative to LCF data which cannot be used at this spatial scale. There is much scope for further work in developing different travel vulnerability indices beyond this paper and this could include household expenditure on travel.
Many lower income households face more severe housing affordability problems than those on higher incomes (Bogdon and Can, 1997). For example, Linneman and Megbolugbe (1992: 369) found that middle-class households in the USA: ‘either began experiencing difficulty in realising the “American dream” of home-ownership or found themselves spending a disproportionately large share of their incomes on housing’. There are also different approaches to measuring an individual household’s ability to afford housing (Gan and Hill, 2009), including: income affordability; repayment affordability; and purchase affordability. Income affordability involves measuring the ratio of house prices to income and is known as the ‘median multiple’ (Angel, 2000; Cox and Pavletich, 2016; DCLG, 2015b; Mayo and Stephens, 1992). Income affordability is used in this paper as again it is possible to measure it at the LSOA level using Census data. This metric is one of the most widely used approaches for measuring housing affordability, and has been used by DCLG (DCLG, 2015b), the United Nations (UN-Habitat, 2011) and World Bank (World Bank, 1992, 1993), among others.
Housing affordability in Greater London has become a very large problem, with median house prices now running at more than eight times median household incomes (2011, LSOA data). House prices rose by 86% from an average of £183,170 in 2001 to £341,324 in 2011 (Land Registry, 2016). Households in London spent a substantially higher amount on housing, 4 fuel and power at £91.30 per week, compared with the UK national average of £60.30 per week during the period from 2009 to 2011 (Land Registry, 2016). In terms of housing expenditure, overall housing costs ranked highest in London at an average of £193.00 per week, compared with the UK average of just £103.20 per week in 2011 (Horsfield, 2012b).
Equation (1) gives the CDHA index which allows a composite analysis of car dependence and housing affordability vulnerability in Greater London. The CDHA index is constructed by combining indexed car dependence vulnerability scores, calculated by adding motor vehicle ownership, work trips by car, and average journey to work distance by car; plus indexed housing affordability vulnerability scores, which are calculated by dividing median house price by median household income. For each of the individual indicators, an index is calculated, so that an additive equation can be used (see Table 1). For example, motor vehicle ownership (Mvo) is divided into individual level data, an average is calculated for the LSOA, and then this is converted into an index ranging from 1 to 10. This approach is used for all of the metrics. This is also the approach used by Dodson and Sipe (2007, 2008) and Dodson et al. (2015) in their VIPER and VAMPIRE index, but with slightly different metrics based on data availability.

Where: CDHA is car dependence and housing affordability vulnerability; Mvo is motor vehicle ownership (proportion of households with two or more cars) (%); Wt is proportion of work trips (i.e. travel to work) by car (%); Djtw is average journey to work distance by car (km); Hp is median house price (£); and Hi is median household income (£ p.a.).
Vulnerability to car dependence and housing affordability data sources, 2001, 2011.

Note: There were 4835 LSOAs in Greater London in 2011. The 2011 LSOA map is used as a basic boundary map in the analysis. The resolutions of all data sets provided are at LSOA level.
The CDHA index thus gives a spatial representation of two important social phenomena that have impacted on travel behaviour in Greater London. The composite index illustrates the areas with high car dependence and house price affordability problems, which, when combined, give the areas most exposed to higher fuel (oil) costs for travel by private car and house price rises. The data is analysed for 2001 and 2011, at the resolution of LSOAs, which is a finer geographic resolution than the Middle Super Output Areas (MSOAs) used by Lovelace and Philips (2014) and also allows the change over time to be considered. The index differs from the VAMPIRE index (Dodson and Sipe, 2008) by not including household income as a proxy for financial hardship, but rather as a factor in housing affordability. This better represents the problem of house price rises relative to average incomes and also reflects data availability in London. Further work could include social deprivation estimates to capture the vulnerable people in the area; however, this would only be possible for 2011. Comparable deprivation data is not available for 2001. Ideally, household expenditure is used for both housing and transport costs (Buchanan et al., 2005; Nepal et al., 2010; Vidyattama et al., 2013). However, again, this is not available in London at sufficient LSOA definition.
The data sources used are given in Table 1. 2001 and 2011 Census data are used together with data collected from the Land Registry and Greater London Authority (GLA). The ‘remarks’ column explains why the selected indicators may be affected by oil price and housing price rises, i.e. that people will have to spend more on their car usage and housing costs.
To develop the mapping, all the LSOAs are divided into deciles – this also avoids the problem of outliers. Values are assigned from point 1, minimal vulnerability (shaded in dark green), to point 10, extremely high vulnerability (shaded in dark red), based on the original ratios for each variable, shown in Table 2. The decile categories used in 2001 are used again in 2011 to ensure comparability and highlight the change over time. In terms of variable weighting, there is limited discussion in the existing literature over which variables should be allocated more weight. The discussion is inconclusive on giving priority to particular variables – this is likely to vary by individual preference. Therefore, CD and HA have each been weighted at 50% each, following a similar weighting scale used by Dodson and Sipe (2007, 2008), and Dodson et al. (2015). Consequently, the CDHA score ranges from a minimum of 6 points to a maximum of 60 points, and is shaded in dark green to dark red.
Value assignment relative to LSOA decile for CD and HA.

The formula used to calculate composite CDHA (Equation 1) is limited because of the constraints imposed by the data sets obtained for LSOAs in the years 2001 and 2011. For instance, another way of representing the burden of transport and housing costs would be to consider the proportion of household income spent on actual car travel and public transport, and on actual mortgage payments (see Dodson and Sipe, 2006, 2008; Dodson et al., 2015) and indeed on rent – however, this would require additional data sets or surveys which are not currently available at this spatial scale. Different household sizes cannot be used in the index since these were not given in the data collected for LSOAs from the Census, Land Registry and GLA.
Car dependence and housing affordability at the regional level
Car dependence
Figure 1 demonstrates the different levels of vulnerability to car dependence (CD) in Greater London in 2001 and 2011. In 2001, there is a large spatial difference between Central London and Inner and Outer London districts. Central London had the highest concentration of people with a low CD, whilst the highest CD scores were found in Outer London, with areas scoring between 28 and 30 on the index (shown in red on the map). Households located in suburban areas could face very high levels of oil vulnerability, as they are very reliant on private cars for travel. The lowest CD scores were predominantly found in the areas up to an 8 km radius from the City of London, with scores from 3 to 6 (marked in green on the map). Vulnerability is caused by a combination of factors, in particular, high levels of car ownership, a high proportion of travel to work by car, and long average distances to work.

Vulnerability to car dependence (CD) in Greater London in 2001 and 2011.
In 2011, the areas with the lowest dependence on cars were generally clustered in close proximity to Central London, whilst the higher CD index scores were found in the Outer London suburbs. Many outer suburban localities, beyond 10 km from central London, have high levels of CD. Public transport accessibility levels in these outer areas may seem relatively high if analysed through tools such as PTALs, but the services are mainly focused on links into central London. Using public transport to travel around Outer London, in orbital directions, including beyond the Greater London boundary, is much more difficult – and it is these trips that are very car dependent.
The change in the CD indices between 2001 and 2011 reveals a spatial difference between Inner and Outer London. In 2011, levels of CD have decreased in Inner London –Table 3 shows that the ratio of motor vehicle ownership (Mvo) and the proportion of work trips by car (Wt) dropped by 44% and 34%, respectively, from 2001 to 2011, reflecting that people living in central and/or Inner London districts can access jobs, goods and services much more easily by public transport rather than having to rely on cars. Additionally, the congestion charge has operated in Central London since 2003 and has also helped to reduce motorisation to a degree. Although the average journey to work distance had increased by 25% in Inner London from 2001 to 2011, the overall journey distance is still much lower than the figure for Outer London during the same period.
Overall changes in Inner London and Outer London between 2001 and 2011.
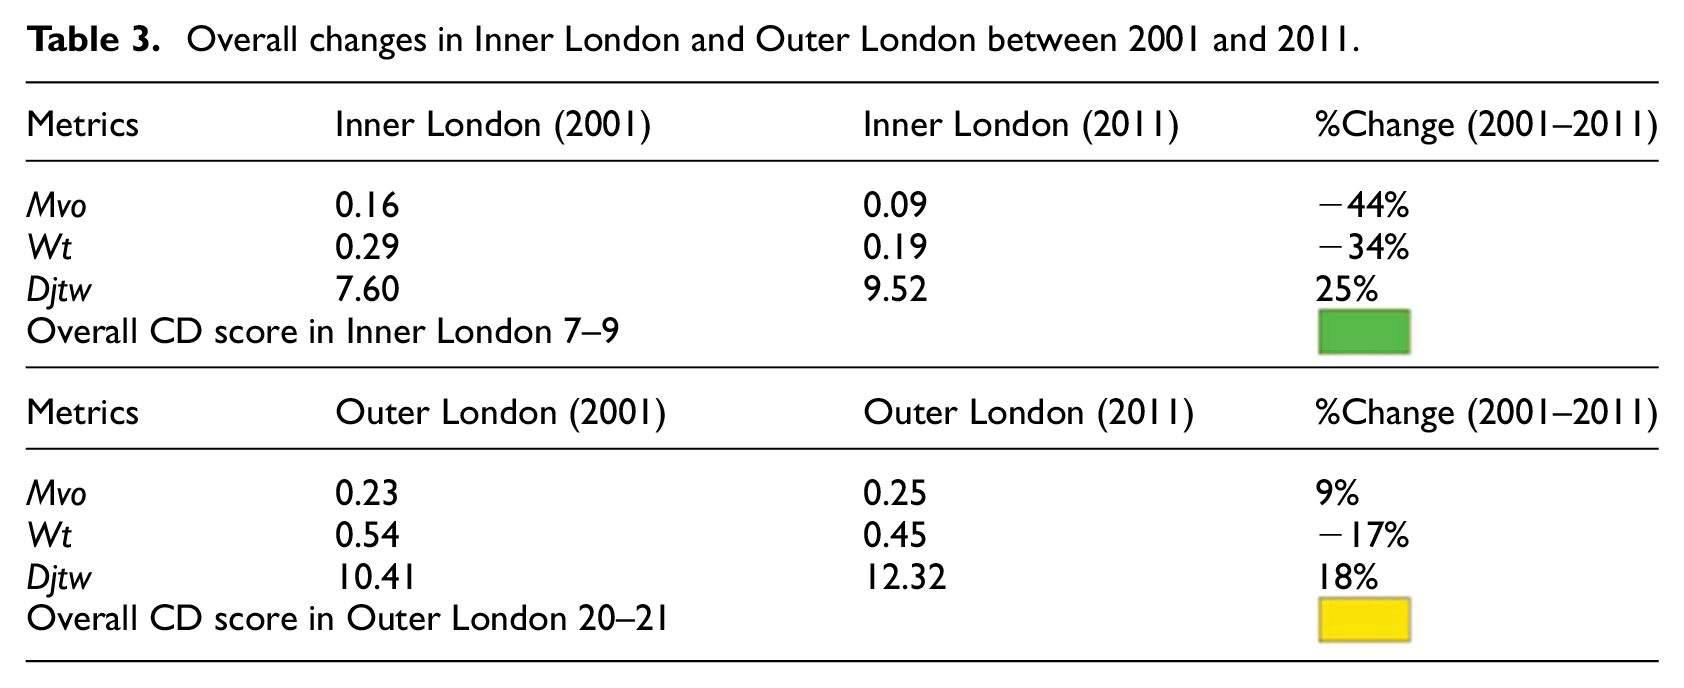
For Outer London, the change in CD between 2001 and 2011 was much more pronounced owing to a 9% increase in motor vehicle ownership and an 18% rise in the average journey to work distance. At the same time, although there was a 17% decrease in the proportion of work trips made by car, the percentage decrease in Outer London from 2001 to 2011 was only half as much as for Inner London.
Housing affordability
Figure 2 shows that different levels of housing affordability (HA) were unevenly distributed throughout the Greater London metropolitan area in 2001, with levels of unaffordability rising to 2011. Ratios are calculated by dividing median house prices by the median earnings of a LSOA. In 2001, areas with the lowest affordability ratio scores, of between 2.5 and 4.1, were mostly located in East London. In contrast, the areas with higher housing affordability scores were concentrated in the inner central and south western parts of Greater London. Some of the areas with high levels of housing unaffordability were concentrated immediately to the west of Central London. The ratio of house prices to earnings should, at most, be equal to or lower than 3.0 – this is the usual mortgage multiplier which means that median incomes would be able to afford median house prices. However, only very few areas are below this affordability threshold. The neighbourhoods with higher ratios can be seen as being very vulnerable to increased house price levels – as even fewer people would be able to afford to live there. We have not considered house rental values, and this would be a useful area for further research, requiring different data sets.

Housing affordability (HA) in Greater London in 2001 and 2011.
In 2011, the areas with high levels of unaffordability were particularly concentrated in the inner central and southwestern parts of London. There were only a few pockets of localities with remaining low affordability ratios in East London, such as Barking and Dagenham. Overall, there were a far greater number of areas with moderate and high affordability scores in 2011 compared with 2001. Median house prices were often between six and ten times greater than median household incomes in 2011. This tends to result in high levels of mortgage debt (Rae, 2014), vulnerability to interest rate changes, in addition to greater exposure to increases in oil prices if households are reliant on using cars for their journeys to work.
Comparing the two Greater London HA maps for 2001 and 2011, it can be seen that over 90% of localities (at the LSOA level) have become much more unaffordable from 2001 to 2011. The median unaffordability ratios for Greater London were 5.7 in 2001 and 7.2 in 2011. While there was a 40% increase in median household income during the decade, median housing prices rose by a dramatic 78% (Table 4). The areas with high levels of unaffordability (shaded red) have spread beyond central and southwestern parts of London to the outer suburbs, because of steep rises in house prices accompanied by comparatively lower increases in salaries and, consequently, household income. Although housing affordability has not traditionally been seen as a ‘transport’ issue, and hence is overlooked by transport planners, it is important to travel behaviours and the equity impacts arising from transport investment and transport systems. If people are being forced to live longer distances from central London, and increasingly so as large parts of Greater London become gentrified and beyond the reach of median incomes (for owner-occupiers and renters), then the impacts on the transport network and travel generally are likely to be very significant – with much longer travel distances being undertaken, impacting on public transport and highway capacity, and sometimes resulting in journeys that are not possible by public transport, walking or cycling.
Overall housing affordability ratio changes in Greater London between 2001 and 2011.

Although there are some pockets of relatively ‘low’ housing unaffordability (shaded light green/yellow), these were still at least two times higher than the ‘reasonable affordability’ ratio, which can be up to three times median incomes. Some of the highest scoring unaffordability areas (shaded dark red) were 10 to 15 times higher than the reasonable affordability ratios in 2001 and 2011.
Composite car dependence and housing affordability
The car dependence and housing affordability indices can be brought together into a single composite index (CDHA). Figures 3 and 4 illustrate this for Greater London, again using 2001 and 2011 data. In 2001, the highest concentration of areas with high CDHA scores was mainly distributed across Outer London. Areas in central London, such as the City of London, Tower Hamlets and Hackney, had comparatively lower levels of car dependence, while the levels of CDHA were lower in central and eastern parts of Greater London, and therefore they were more affordable places in which to live compared with other parts of Greater London. The overall CDHA scores were high across Greater London in 2001, particularly in west London.

Composite car dependence and housing affordability index (CDHA) in Greater London in 2001.

Composite car dependence and housing affordability index (CDHA) in Greater London in 2011.
In 2011, the high levels of CDHA have spread across much of Outer London. There are also a few areas with high CDHA scores among the inner boroughs and central London, which reflects the housing affordability problems in these areas. Nonetheless, most of the central zones showed much lower levels of CDHA compared with the suburban areas of Greater London in 2011. In addition, there is a huge difference, of over six-fold, between the highest and lowest CDHA scores, which inevitably causes social injustice issues. This is most problematic for people on comparatively lower incomes, living in suburban areas, who are very reliant on cars and/or without access to good public transport services, or those living in inaccessible areas without access to a car.
Analysing the change from 2001 to 2011 reveals that, overall, the CDHA scores increased significantly in Greater London from 33/60 (broadly representing moderate vulnerability) in 2001 to 40/60 (high vulnerability) in 2011. Much of Greater London became more vulnerable between 2001 and 2011. The situation in suburban areas, in particular, worsened considerably from 2001 to 2011. In addition, the distribution became wider, resulting in large social inequity issues between different social groups living in different localities within Greater London. Based on these findings, it can be argued that there is a huge discrepancy between affluent and poor households in terms of CDHA. Although oil prices are running at relatively low levels (as at May 2017), if they rise back to US$100 a barrel or more, then the problems of expenditure on car dependence, alongside problems of housing affordability, will become much more severe. Much of London could become vulnerable to these problems. If house prices continue to increase this will also account for a greater share of household incomes.
Car dependence and housing affordability and social disadvantage
In order to test the relationship between CDHA and broader social disadvantage, we compare the CDHA index with multiple deprivation (IMD) scores. The scatterplot matrix shown in Figure 5 illustrates that there are moderate negative correlations between the CDHA and IMD scores in both 2001 and 2011, which were statistically significant, as Pearson’s coefficients of correlation (r) were 0.58 and 0.60, respectively. These results illustrate that the CDHA problem is very different to the conventional social deprivation problem – it is (mostly) the middle class suburbs that suffer from the greatest vulnerability levels to oil and housing price rises. The CDHA areas identified in this paper have not traditionally been recognised as being associated with social disadvantage. In addition, in terms of socio-demographic issues, the results revealed that there was no statistically strong correlation between the changes in population and the other vulnerability metrics (CD, HA and CDHA).

Car dependence and housing affordability (CDHA) and social disadvantage, scatterplot matrix.
To further examine this issue, the Getis-Ord Gi* statistic (Equation 2) is used to produce a spatial statistic test for CDHA and IMD for each LSOA in the dataset. The resultant z-scores and p-values show which LSOAs with either high or low values (indicating vulnerability and deprivation) are clustered together spatially.
Equation (2): The Getis-Ord Gi* statistic:

Where: Xj is attribute value for LSOA j; Wi,j is spatial weight between LSOAs i and j; n is equal to the total number of LSOAs.
Figure 6 provides comparisons of the chloropleth maps of CDHA with IMD, and illustrates the reasons for the negative correlations: car dependence and housing unaffordability were predominantly found in more suburban areas, associated with middle incomes and lower unemployment levels; whereas deprivation occurred primarily in East London, where incomes were low and there was higher unemployment, in both 2001 and 2011.

Car dependence and housing affordability (CDHA) and social disadvantage (IMD) in 2001 and 2011, chloropleth maps.
Conclusions
This paper has examined car dependence and housing affordability vulnerability, developing a composite index (CDHA) to map these issues spatially in Greater London, over the years 2001 to 2011. It has compared the CDHA index with IMDs and investigated the spatial difference between them across London. In terms of the CDHA index, there are potential problems in the Outer London suburbs, caused by high levels of car ownership, a high proportion of travel to work by car, longer average journey distances to work, and limited access to public transport, and high levels of housing unaffordability. If oil prices and/or housing costs rise (including mortgage lending and rental levels, see Rae, 2014), then it can be assumed that large parts of Greater London would become highly vulnerable – limited household budgets may not have sufficient flexibility to allow for additional sums to be paid out for travel and/or housing costs. The so-called ‘just-about-managing-households’ (JAMs) become more problematic. This is a similar finding to the research conducted on Australian cities (Dodson and Sipe, 2007, 2008; Dodson et al., 2015) and American cities (Sexton et al., 2012). Yet the acuteness of the housing affordability problem is perhaps unique to London, and is demonstrated using the composite CDHA index – many areas become problematic and to a large degree. These areas are different to those with conventional social deprivation problems as measured by the IMD, which broadly are located mostly in East London. The implications of these trends are not clear, yet presumably there would be changes in these suburban areas, perhaps including increased demand for public transport, households moving or changing jobs, and potentially higher levels of mortgage (and rental) default. The focus for much transport investment in London is on public transport projects carrying people into the central areas. Though these capacity increases are important, there is a clear opportunity in developing much higher levels of public transport accessibility – in orbital and tangential as well as radial terms – in the outer suburbs. Suburban centres could be much better connected by public transport to their surrounding areas and also to other suburban centres and public transport services could be better integrated (Mees, 2010).
In addition, there is also a problem in some of the higher income suburban and inner urban areas, where the vulnerability is mainly due to very expensive property prices, and high proportions of household income being spent on mortgages, at current low mortgage interest rates. In addition, in some areas property is being purchased as an (international) investment rather than for the purpose of living in (Edwards, 2016; Gallent, 2016). Regulation could be developed to curb the amount of property being purchased for investment purposes and much higher levels of affordable housing need to be delivered. This also means affordable housing at genuinely ‘affordable’ levels – relative to low and median incomes rather than current market prices.
Property prices have risen dramatically in London over the last decade and this has not been tackled at the policy and political level, to any degree. Housing affordability is not traditionally perceived as a ‘transport’ issue – yet it has a huge knock-on impact on travel behaviours, and for car dependence cost vulnerability in future years. A first step in examining these issues is to develop a spatial understanding of the trends and how they have changed over time. Additionally, there needs to be much more investment in public transport, walking and cycling in Outer London, particularly in the less attractive parts of the outer suburbs. The current implementation of the ‘Mini-Holland’ cycle investments in London is perhaps instructive –£30 million is being usefully spent on cycle facilities in areas such as Waltham Forest and Enfield. Yet these are being implemented as pilot schemes and, so far, not across suburban London. There has been no similar investment in high quality public transport in Outer London, such as light rapid transit, which may provide a much more effective tangential service in outer London. The level of funding is very low relative to that spent on highways or public transport services focused on Central London. The proportion of spending on the non-car modes of transport in Outer London needs to be greatly increased.
In terms of analytical approaches, car dependence and housing affordability are important policy metrics that can be used by transport and urban planners. The CDHA index used in this research can make a valuable contribution to strategy making, such as in the forthcoming editions of the Mayor’s Transport Strategy and London Plan. If these types of indicators, and others of a similar nature, are used to help frame and monitor the impacts of policy, then perhaps a suitable policy response can be developed to help reduce levels of car dependence and housing affordability vulnerability. Policy development often reflects the evidence collated, and new problems seem to be emerging in London that need careful consideration. Many population cohorts are increasingly being forced out to the less attractive outer suburbs, where they are disadvantaged by limited access to public transport, and greater reliance on cars, but still experience relatively expensive housing costs. There are complex contributory factors at play here, but perhaps the most important is the housing affordability problem, and this needs to be tackled in a much more serious manner at both the policy and political levels. To move beyond these problems is a difficult task, and it incorporates areas that extend beyond the conventional domain of the transport planner.
Footnotes
Acknowledgements
The authors would like to thank Professor David Banister, Dr Nihan Akyelken, and Dr Tim Schwanen; Dr Tingting Lu, Professor Peter Jones, Professor Michael Edwards, and Dr Thomas Evans; and Dr Andy Ho for their suggestions. Finally, thanks to the editor, Professor Mark Stephens, and the anonymous reviewers for their valuable comments on the initial draft of this paper. Data were kindly provided by Gareth Piggott, Rachel Leeser from GLA; and Andrew Morton and Nigel Henretty from ONS. The responsibility for all analysis, interpretation and conclusions drawn from the data lies entirely with the authors.
Funding
The authors would like to extend their appreciation to the British Council and Newton Fund Institutional Links Programme, Sustainable Cities and Resilient Transport Project (University of Oxford, UCL, Clean Air Asia, and De la Salle University, Manila, 2015–2017) for assisting with funding for the research in this paper.