
Abstract
Along the US border with Mexico there are thousands of communities designated by the federal government as colonias, a name that highlights the large numbers of low-income, Hispanic immigrants that live in these communities. These subdivisions have been studied extensively in recent years, often using insights from the concept of urban informality. This research has highlighted the challenges posed by exploitative land sales practices, poor-quality or non-existent infrastructure and poor-quality housing in these communities. However, similar informal subdivisions exist along the urban fringe elsewhere across the US, though they are not designated as colonias by the federal government and scholars rarely consider their similarities to colonias in the border region. This study uses data on Census Designated Places from the American Community Survey, satellite imagery and county property records to examine the extent and nature of these subdivisions. The results illustrate that informal land development of the sort described here is not restricted only to the border region, to immigrant enclaves or to Hispanic communities. Instead, it is demonstrated that informal subdivisions exist in large numbers across Southern and Western states and, though their numbers are smaller, they are present even in the Midwest and Northeast. Moreover, these subdivisions are home to diverse populations and they provide important benefits such as expanded opportunities of homeownership for minorities and the poor.
Introduction
Over the past few decades, research has documented the challenges posed by extreme poverty, exploitative land sales practices, ailing or lacking infrastructure and poor-quality housing in the colonias along the US border with Mexico (Donelson and Esparza, 2010; Esparza and Donelson, 2008; Ward, 1999). Much of this research has built upon the concept of urban informality, theorising about the factors that contribute to the proliferation of informal conditions or examining their implications in regards to land development, property transfer or housing production (Durst and Wegmann, 2017; Larson, 2002; Sullivan and Olmedo, 2014; Ward, 1999, 2004). Researchers have also examined the similarities between colonias in the US and informal settlements in Latin America. Consider, for example, the lack of water and wastewater in these communities and the need for costly after-the-fact regularisation of infrastructure by state and federal governments; widespread challenges posed by land title irregularities and the need for property title regularisation; and heavy reliance on self-building (Larson, 1996; Ward, 1999; Ward et al., 2011).
These similarities notwithstanding, the association of colonias with the US–Mexico border and with immigrant populations also has important implications. Although many colonias are home to immigrants and large Hispanic populations (Durst and Ward, 2014), not all are (Esparza and Donelson, 2008). This has led some to argue that the term colonia is misleading, prejudiced and detrimental: its use erroneously implies that these communities are located only in the border region and are home to disproportionate shares of Hispanics; associates Spanish-speaking communities with poverty; and complicates community organising and outreach in more heterogeneous communities that do not fit the stereotype of colonias (Mukhija and Monkkonen, 2007). In reality, border colonias are a heterogenous group of communities with distinct needs and distinct development histories (Esparza and Donelson, 2008), and the failure to recognise the diversity among colonias has important implications for policy. Whereas in Texas most colonias developed between the 1960s and 1980s prior to the adoption of subdivision regulations in that state (Ward, 1999), in Arizona, New Mexico, and especially California, many colonias developed a century ago (Esparza and Donelson, 2008; Mukhija and Monkkonen, 2006). Despite the diversity among colonias in the border region, federal designation of colonias – which brings with it eligibility for funding – relies on arbitrary thresholds based on their distance from the border, the population in the surrounding metropolitan area or the year the community was developed. These criteria sometimes mean that communities with the greatest need are ineligible for federal assistance (Durst, 2016; Mukhija and Monkkonen, 2006).
A select number of studies, all produced by scholars of border colonias, have sought to document the existence of non-border colonias and so-called ‘informal homestead subdivisions’ in a limited number of counties outside the border region (Sullivan and Olmedo, 2014; Ward and Peters, 2007; Ward et al., 2015). In large part, however, these recent studies ignore a broader pattern of informal subdivision of land that dates back at least a century. Indeed, as far back as the late 19th and early 20th century, unplanned suburbs characterised by makeshift housing and poor-quality or non-existent infrastructure, and catering to racially and ethnically diverse (though typically moderate- to low-income) populations, were developed all across the country (Elder, 1946; Goff, 2016; Harris, 1994; Krulikowski, 2008; Nicolaides, 2002; Wiese, 2004). In the three decades following the Second World War, millions of lots were subdivided and sold, often without basic on-site infrastructure or services (i.e. sewerage systems, roads or water), in unplanned communities along the urban fringe (Allan, 1976; Stroud and Spikowski, 1999; Wolff, 1973).
This study seeks to document the existence of these ‘informal subdivisions’ far outside the border region. To do so, I rely on the fact that many of these subdivisions contain substantial shares of mobile homes (Durst, 2016; Ward and Peters, 2007). In this study, census data from unincorporated places (Census Designated Places) are used to identify communities in which more than 20% of housing units are mobile homes, after which an analysis of satellite imagery and county property records is conducted in order to identify residential subdivisions whose morphology resembles that of colonias in the border region. Census data are then used to examine selected demographic and socioeconomic characteristics of these communities. The results of this analysis demonstrate that informal land development of the sort described here is not restricted only to the border region or to Hispanic communities. Instead, it is shown that informal subdivisions are in fact widespread across the country and are home to diverse populations that largely mirror the metropolitan and micropolitan areas in which they are located. It is also shown that, despite high rates of poverty, these communities offer important benefits such as expanded opportunities for homeownership for minorities and the poor.
A brief history of unplanned subdivisions on the urban fringe
What distinguishes land development of the sort found in colonias from otherwise stereotypical suburban housing development is the separation of two stages in the development process: the subdivision of land and the development of housing. In most suburban contexts, land development and housing production are often highly complex, closely regulated and carefully coordinated by a variety of stakeholders (planners, code inspectors, lenders, realtors and insurance agencies) to ensure that housing is developed in accordance with existing regulations and in response to existing market demand (Clawson, 1971; Peiser and Hamilton, 2012).
However, along the unincorporated fringe – that is, on unincorporated land outside cities, towns and villages – land development is often separated from housing production. Developers subdivide and sell land with minimal improvements, to buyers who are then tasked with overseeing the contracting, construction or purchasing of housing. A large but somewhat disconnected literature documents the existence and continued proliferation of these types of residential subdivisions across the United States. Much of the earlier literature has referred to them as ‘premature subdivisions’ (Cornick, 1938; Shultz and Groy, 1988), ‘libertarian suburbs’ (Barnett, 1978) or ‘unplanned’ suburbs or subdivisions (Harris, 1999; Wiese, 2004). More recent research has focused on informal colonias along the US–Mexico border (Larson, 1996; Ward, 1999); newer ‘model subdivisions’ developed in Texas after the passage of the Model Subdivision Rules, which required the installation of basic water and wastewater services, but where exploitative land sales practices and self-building continue to be widespread (Durst, 2016; Durst and Ward, 2016; Olmedo and Ward, 2016); illegal lot splitting in ‘wildcat subdivisions’ in states like Arizona (Christensen et al., 2006); or ‘informal homestead subdivisions’ located in other parts of the South and Southwest (Sullivan and Olmedo, 2014; Ward and Peters, 2007).
Because land development, property transactions and housing production in these communities are largely unregulated or fail to comply with existing regulations, researchers have often examined colonias through the lens of urban informality (Larson, 2002; Sullivan and Olmedo, 2014; Ward, 1999, 2004). Prior research has highlighted that informality in US housing markets is highly nuanced and extends beyond issues of non-compliance with existing regulations. For example, informal conditions in colonias and other informal subdivisions are attributable not to issues of non-compliance, but rather to government lack of willingness to enforce or adopt particular regulations (Durst, 2016; Larson, 2002).
In colonias and other informal subdivisions, the lack of community planning and the provision of minimal infrastructure mean these subdivisions often do not adhere to widely accepted standards for residential land development in the US (Larson, 1996; Stroud and Spikowski, 1999). By separating the development of land from the construction of housing, land developers dramatically reduce both the cost and complexity of residential development. This means they can sell lots directly to buyers via seller-financing, which – unlike third-party mortgages, which are strictly regulated and closely monitored – is often weakly regulated, difficult to monitor and highly exploitative (Olmedo and Ward, 2016; Ward et al., 2011, 2015), and often relies on land contracts that offer buyers few legal protections and limited recourse in the event of default, leaving them highly vulnerable to repossession (Way, 2010). Because responsibility for the construction of housing falls to buyers and not the developer, self-building is common in these communities, as is non-compliance with standard building practices or building codes (Durst and Ward, 2016; Ward et al., 2004). All of these factors – the lack of compliance with regulations or standard development practices, the widespread use of weakly regulated seller-financing and informal titling mechanisms and the heavy reliance on self-building – highlight the informal nature of these subdivisions and the challenges they pose to planners and policymakers.
Data and methods
Prior approaches to the study of informal subdivisions
Examining the extent of informal subdivisions across the country is complicated by a number of methodological challenges that arise precisely because of their informal nature. Because houses in these subdivisions are often self-built or are second-hand mobile homes, new housing development is not captured by building permit data collected by the US Census Bureau. This means it is difficult to monitor, or even estimate, the production or placement of dwellings in informal subdivisions. Moreover, unlike with the use of third-party mortgages, which are easily tracked through data compiled by the Consumer Financial Protection Bureau (CFPB), the widespread use of developer-financing in informal subdivisions makes it difficult to track sales of lots or houses (Ward et al., 2015; Way, 2010). Previous researchers (Shultz and Groy, 1988; Stroud and Spikowski, 1999) have used data on interstate land sales to document the extent of such subdivisions across the country, but these data are no longer useful for this purpose: they were previously collected and maintained by the Office of Interstate Land Sales (ILS) Registration at the Department of Housing and Urban Development (HUD); these data are currently collected and managed by the CFPB, and they are no longer maintained in a format that allows for an analysis of the extent of land sales activity. 1
Although informal subdivisions of the sort studied here exist in incorporated places (i.e. cities and towns) as well, the majority are located in unincorporated areas.
2
This study therefore relies on satellite imagery, county property records and 2010–2014 five-year estimates from the American Community Survey (ACS)
3
in order to estimate the prevalence of informal subdivisions in selected Census Designated Places (CDPs) across the country. As defined by the Census Bureau, CDPs:
are the statistical counterparts of incorporated places, and are delineated to provide data for settled concentrations of population that are identifiable by name but are not legally incorporated under the laws of the state in which they are located. The boundaries usually are defined in cooperation with local or tribal officials and generally updated prior to each decennial census. (US Census Bureau, 2012)
Because CDPs provide a wide range of data on unincorporated communities at a refined geographic scale, they provide a much more detailed picture of residential subdivisions in unincorporated areas than do census blocks or census block groups. 4
In order to isolate communities that are likely to contain informal subdivisions, this research capitalises upon the fact that these communities often contain large numbers of mobile homes, since this type of housing is affordable even to very low-income households (Durst, 2016; Ward and Peters, 2007). Moreover, widespread reliance upon mobile homes in informal subdivisions and the unique development process of separating the subdivision of land from the construction of housing means that these communities are fairly easy to identify by satellite imagery available through Google Earth or World Imagery (provided by the Environmental Systems Research Institute (Esri); see, for example, Durst, 2016; Ward and Peters, 2007). Before turning to a discussion of the analysis of satellite imagery, let us begin with a discussion of the unit of analysis: Census Designated Places.
Sampling frame: Census Designated Places (CDPs) with substantial shares of mobile homes
As shown in Table 1, there are 9326 CDPs in the continental US, with nearly 6000 located in the South and West and just over 3300 in the Midwest and Northeast. Only CDPs in which more than 20% of the dwelling units were mobile homes 5 are examined here. The 20% threshold was selected because it narrowed the sampling frame to a manageable number of communities in which, given the high share of mobile homes, informal subdivisions were likely to be present. In total, 1786 CDPs scattered across 471 Core Based Statistical Areas (CBSAs; i.e. in metropolitan or micropolitan areas) in the lower 48 states had shares of mobile homes over 20%. These 1786 CDPs represent the sampling frame of the current study, from which a single CDP meeting the 20% threshold was selected for each of 471 CBSAs. This stratified sampling protocol was adopted to ensure sufficient variation across the country and to prevent the selection of high proportions of CDPs within the border region, where informal colonias have already been studied in detail.
Regional comparison: Number of CDPs and number of mobile homes in the continental US.
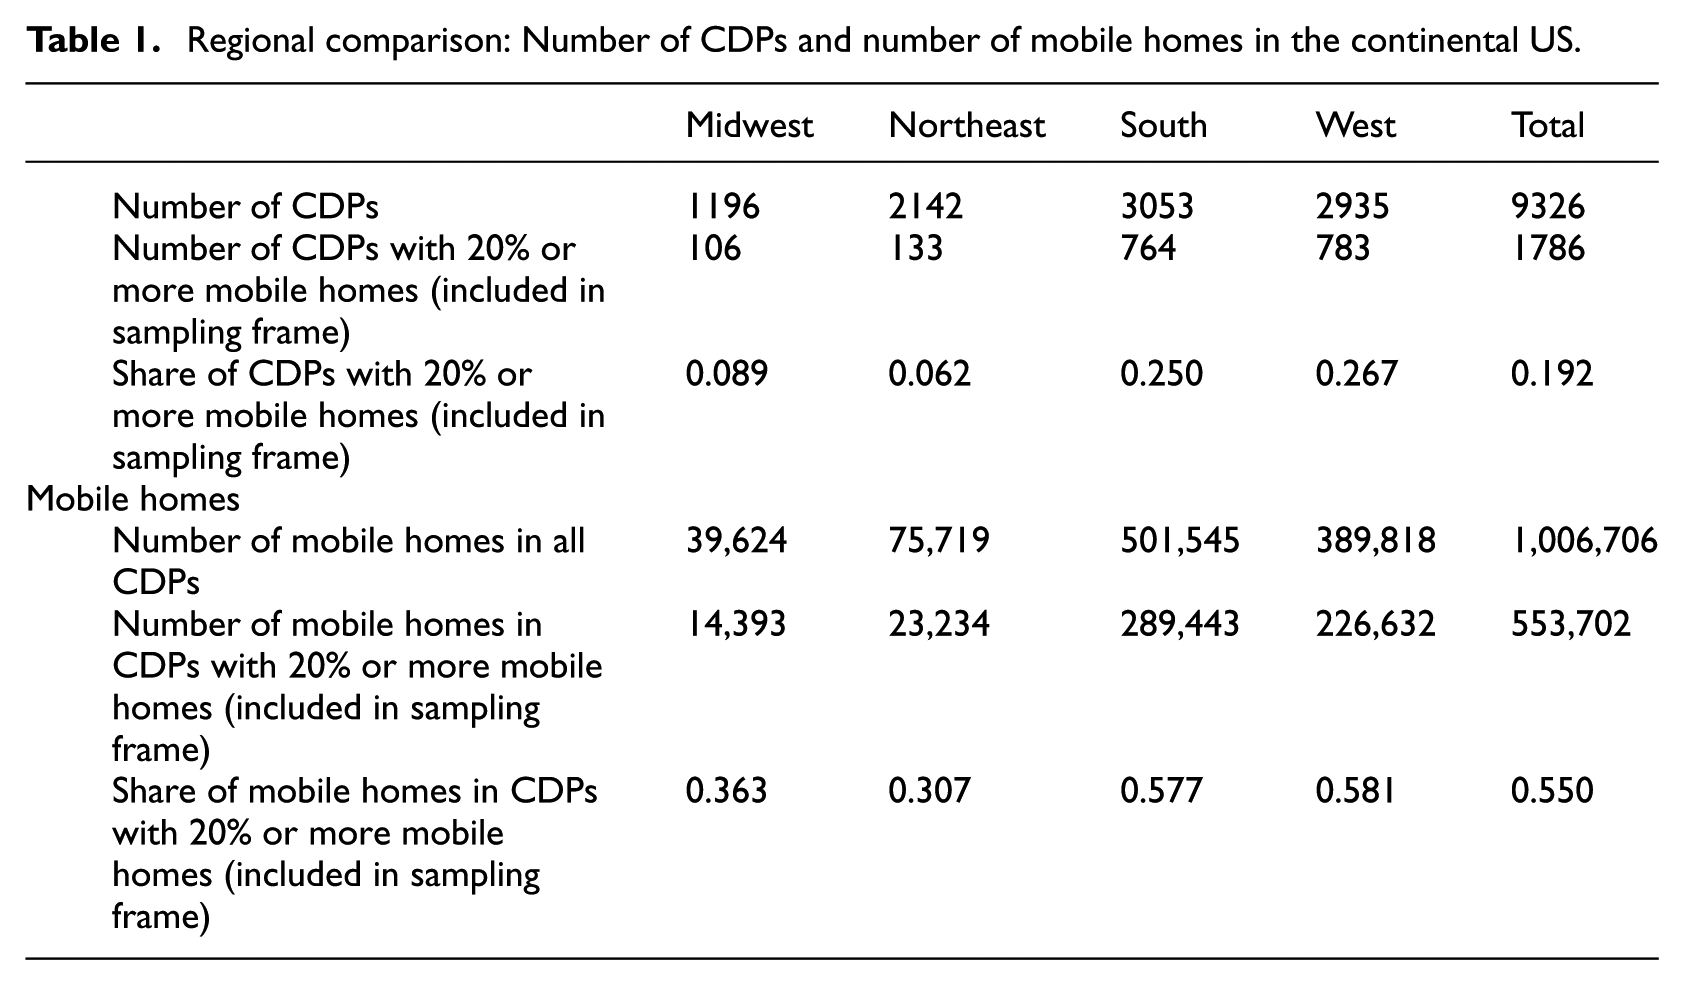
The number of CDPs in the sampling frame varies considerably across the country. As shown in Table 1, in Southern states, 25.0% of CDPs (or 764 in total) meet the 20% threshold, while in Western states this is true for 26.7% of CDPs (783 in total). In the Midwest and Northeast, however, fewer than 10% of CDPs meet the 20% mobile home threshold. As shown in Table 1, there are more than 1 million mobile homes located in CDPs across the continental US. These mobile homes are concentrated primarily in the South (more than 500,000 in total) and West (nearly 400,000), and the sampling frame captures more than half of the mobile homes in these regions: 57.7% and 58.1% of mobile homes located in all CDPs across the South and West, respectively, are within the sampling frame. Comparatively, there are relatively few mobile homes in CDPs in the Midwest (under 40,000) and Northeast (under 80,000), and the sampling frame is markedly less successful at capturing those limited numbers of mobile homes that do exist in CDPs in these regions: only 36.3% and 30.7% of mobile homes located in all CDPs across the Midwest and Northeast, respectively, are within the sampling frame.
Figure 1 shows the location of all CDPs in CBSAs in the continental US. As is clear in Figure 1, CDPs exist in great numbers around many of the largest metropolitan areas in the country, particularly in coastal states and along the US–Mexico border. Figure 1 also distinguishes between those CDPs in which greater than or less than 20% of housing units are mobile homes. A substantial number of the CDPs in the South and West meet the 20% threshold. Indeed, over 700 of these CDPs were located in the four border states of Arizona (n = 198), California (167), New Mexico (184) and Texas (171), where colonias are widespread and have been studied in detail. With the exception of the CDPs located within the Appalachian Mountains, which run along the inland portion of the Eastern seaboard from Northern Alabama through New York, few CDPs within the Midwest and Northeast contain more than 20% mobile homes. This fact notwithstanding, across the continental US there are more than 1000 CDPs meeting the 20% criterion that are located in CBSAs outside border states, including 50 or more in Alabama (n = 56), Florida (120), Louisiana (67), North Carolina (86), Pennsylvania (50) and Washington (78).
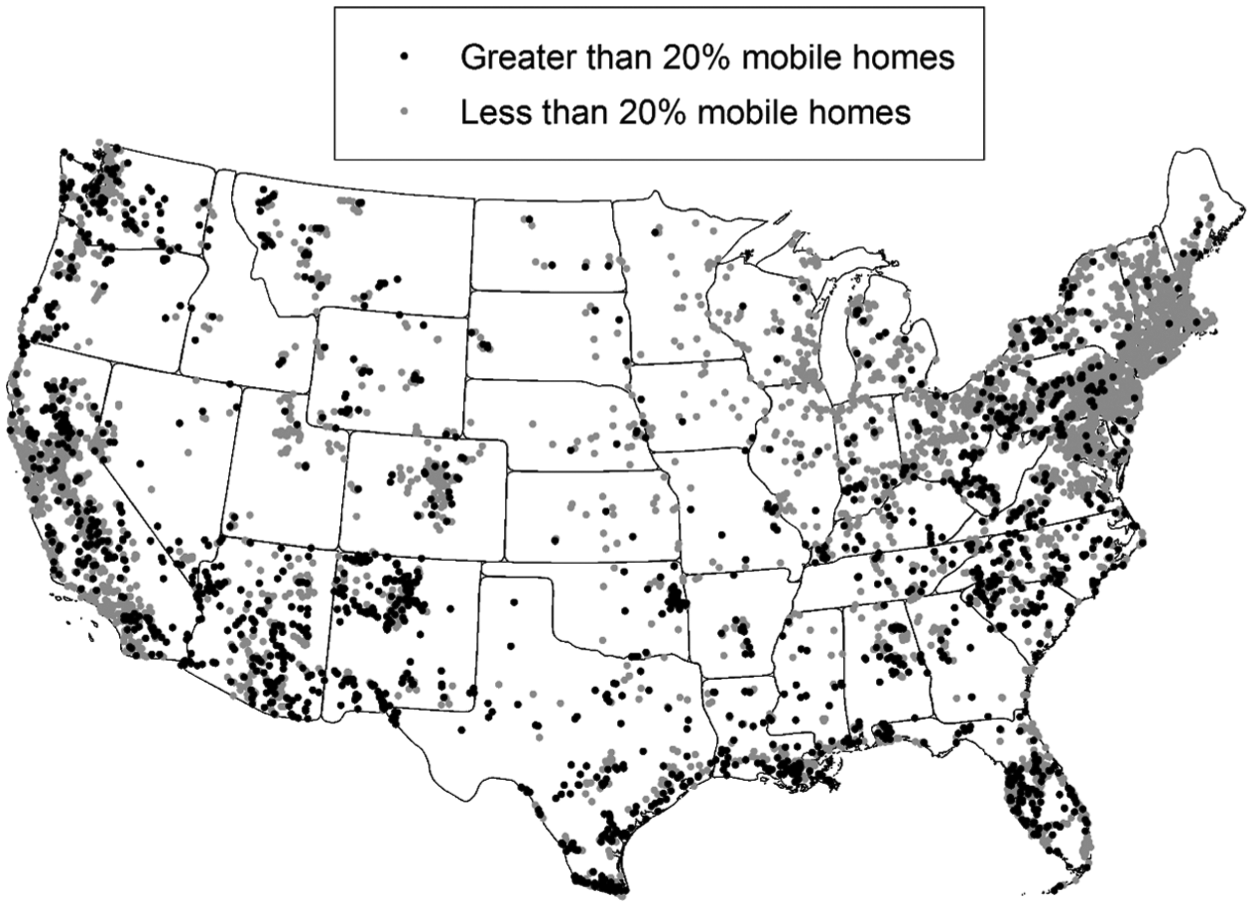
Location of census designated places with varying proportions of mobile homes.
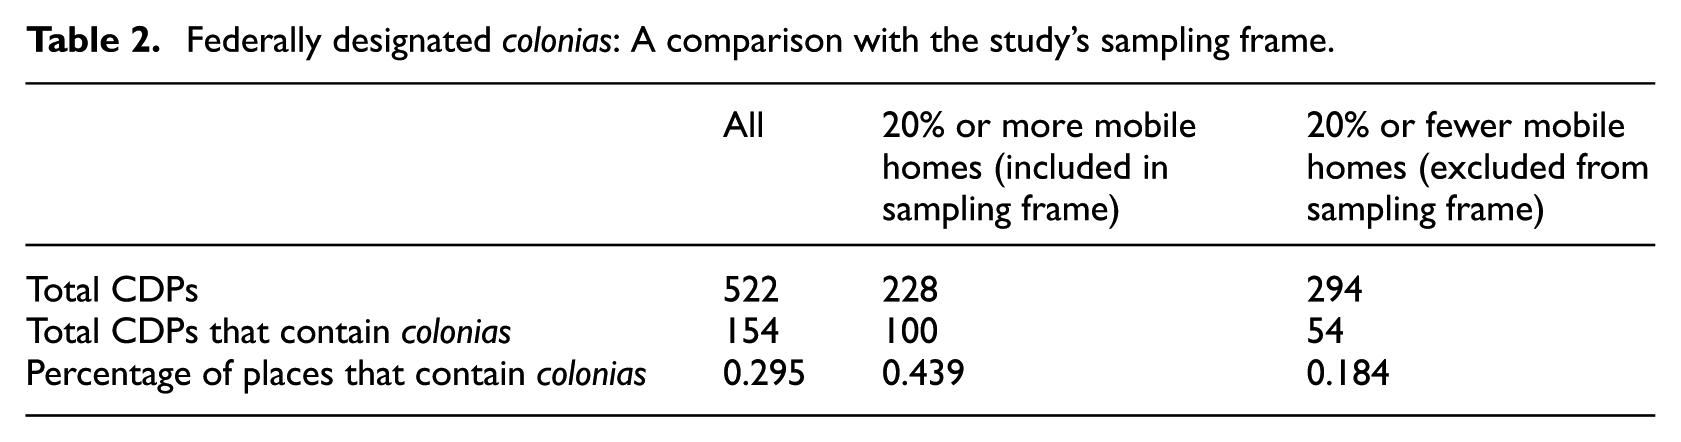
To determine the success of the 20% threshold in identifying colonias, I examined the characteristics of 522 CDPs located in 23 metropolitan or micropolitan areas in Arizona, California, New Mexico and Texas where federally designated colonias are known to exist. 6 As shown in Table 2, of the 228 CDPs that were included in this study’s sampling frame (i.e. had shares of mobile homes over 20%), in total 100 (43.9%) contained a colonia, compared with only 18.4% of the 294 CDPs that were excluded from the sampling frame. Taken together these findings suggest that, at least in the border region, the selection criterion used here is a fairly successful means of identifying potential informal subdivisions such as colonias.
Federally designated colonias: A comparison with the study’s sampling frame.
Demographic and socioeconomic characteristics of the selected communities
To allow the reader to draw comparisons between the sample, the sampling frame and other Census Places, Table 3 provides descriptive and inferential statistics for all Census Places of various types in the continental US. Let us begin first by examining the characteristics of the sampling frame (i.e. CDPs with 20% or more mobile homes) in comparison with all Census Places and all CDPs. As would be expected, CDPs in the sampling frame have markedly higher shares of mobile homes (40.9%) compared with all CDPs (13.8%) and all Census Places (10.8%). CDPs in the sampling frame also have higher poverty rates (21.0%) than do all CDPs (15.2%) or all Census Places (16.3%), but higher homeownership rates among the poor (54.7%, compared with 51.5% and 45.7%, respectively). In terms of the demographic characteristics of the communities in the sampling frame, there is considerable nuance. On average, CDPs in the sampling frame had comparable or lower shares of black residents (5.3%, compared with 5.3% and 7.0% for all CDPs and Census Places, respectively), but higher rates of homeownership among blacks (62.2% vs 57.8% and 49.7%, respectively). Shares of Hispanics were higher in the sampling frame CDPs (20.6%) than in all CDPs (12.7%) and all Census Places (9.5%), as were homeownership rates among Hispanics (66.4% vs 63.7% and 56.9%, respectively). Moreover, although the share of non-citizens (4.8%) in the sampling frame is higher than that in all CDPs (4.0%) and all Census Places (3.1%), the share of residents in the sampling frame who are immigrants (7.1%) is more or less identical to that found in the average CDP (7.2%) and only modestly higher than that found in all Census Places (5.5%).
Descriptive statistics of census places, CDPs, sampling frame and sample.
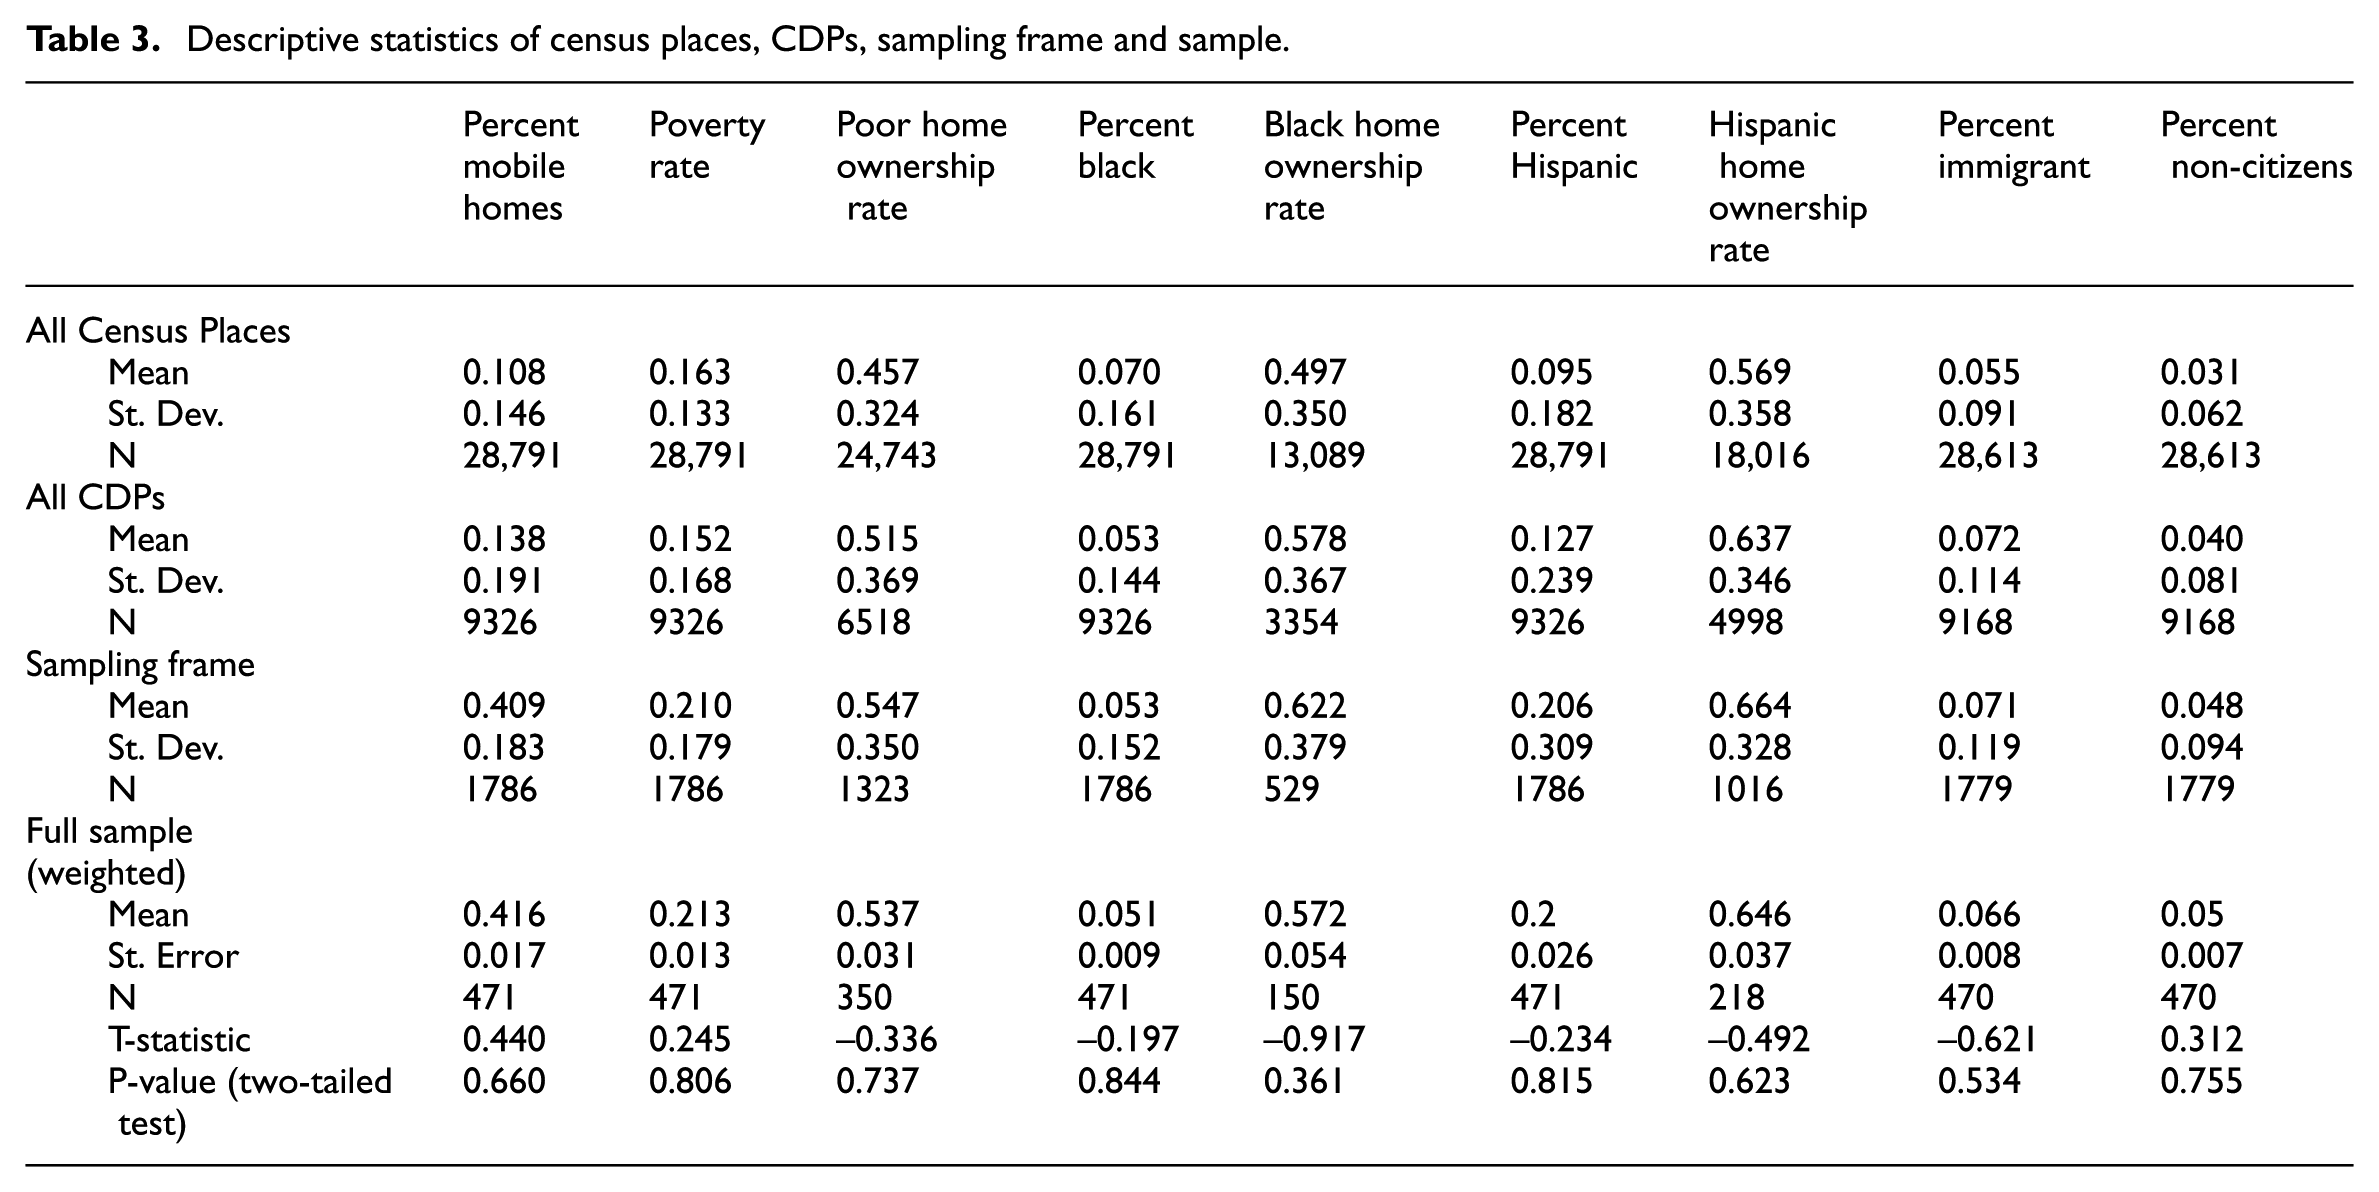
The last section in Table 3 provides inferential statistics for the entire sample of 471 CDPs examined here. Sample means and standard errors are calculated using inverse probability weights equal to one divided by the probability of selection. These weighted estimates allow for comparison between the sample and the sampling frame (i.e. the ‘population’ about which inferences will be made). In addition to reporting the standard error, Table 3 also provides t-statistics and p-values for comparisons between the mean of the sample and the mean of the sampling frame (the ‘population mean’). As indicated by the p-values for each of the variables, none of the sample means differs significantly from that of the sampling frame (in every case, the p-value is substantially greater than 0.1). These results suggest that, on the whole, the weighted sample is largely representative of the 1786 CDPs with 20% or higher shares of mobile homes from which the sample was drawn.
Analysis of satellite imagery
The second stage in the data collection entailed an analysis of satellite imagery of each of the 471 CDPs in the sample. The purpose here was to identify informal subdivisions and to distinguish them from other communities in which mobile homes are common, namely, mobile home parks. In mobile home parks and so-called manufactured home communities, residents live on leased or collectively owned land (Carter et al., 2004; Apgar et al., 2002), while residents in informal subdivisions typically own both the land and the house. Moreover, although many residents in informal subdivisions start off by living in a mobile home, they often transition into self-built housing after a decade or two (Durst, 2016).
Building off a classification system developed elsewhere (Durst, 2016), satellite imagery 7 was examined for every residential area within each of the randomly selected CDPs, one from each of 471 CBSAs. By examining the type of housing in each community, the presence or absence of individual lots (as opposed to parking pads) and the orientation of housing, I created a preliminary classification of mobile-home communities and informal subdivisions. Because smaller subdivisions are difficult to classify – the limited number of housing units makes it challenging to discern issues such as the uniformity of housing placement – residential communities within the selected CDPs were only designated as either mobile home parks or informal subdivisions if they had 20 or more housing units in close proximity and displayed some of the following criteria. CDPs were classified as containing informal subdivisions if they contained varied housing types (both mobile homes and site-built homes); showed clear delineations of lots via fences, walls or landscaping; or had non-uniform (diagonal or varied) orientation of housing units. They were classified as containing mobile home parks if they contained only mobile homes; had no delineation of lots; and had relatively uniform (parallel) orientation of housing units. In some cases, selected CDPs were classified as ‘other’, either because the residential communities contained fewer than 20 housing units or because they did not meet the classification criteria – the latter were typically isolated rural housing units located on large lots, small unincorporated villages or strip development along the side of a road.
Once this classification was completed via an analysis of satellite imagery, county property records were analysed – in most cases rather easily via online interactive parcel maps provided by county offices – in order to confirm whether housing units in the communities identified via satellite imagery were in fact part of a subdivision (i.e. each housing unit was located on an individual parcel) or were part of a larger group of housing units located on a single parcel. Where parcel maps such as these were not available online, a combination of property records, plat maps or parcel shapefiles obtained from relevant county (assessors, appraisers or planning) departments were used. Of the 300 CDPs classified via an analysis of satellite imagery as containing either an informal subdivision, a mobile home park or both, 81% were deemed to have been correctly classified after reviewing county property records. An example is shown in Figure 2, displaying both types of communities in Combee Settlement CDP in Polk County, Florida. At the bottom of the image is a mobile home park, where a dozen or so mobile homes are scattered across a single parcel. At the top of the image is an informal subdivision, with each housing unit located on a single parcel.

Informal subdivision and mobile home park in Combee Settlement CDP, Polk County, Florida.
Results
The prevalence of informal subdivisions
Using this combination of satellite imagery and county property records, I identified informal subdivisions in all four census regions, although their prevalence varies markedly across regions. To illustrate, Table 3 shows estimates of the number and share of CDPs in both types of community. In total, my analysis suggests that of the 1786 CDPs in the sampling frame, approximately 769 (or 43.1%) contain informal subdivisions (see Table 4). The vast majority of the CDPs that contain informal subdivisions are estimated to be located in the South (410 in total) or West (318), where I estimate that these subdivisions exist in 53.5% and 40.5% of CDPs in the sampling frame, respectively. In total, there are relatively few CDPs in the Midwest and Northeast that contain informal subdivisions (19 and 22 total, respectively, representing 18.4% and 16.5% of all CDPs in the sampling frame in these regions).
Classification of subdivisions within selected census designated places by census regions.
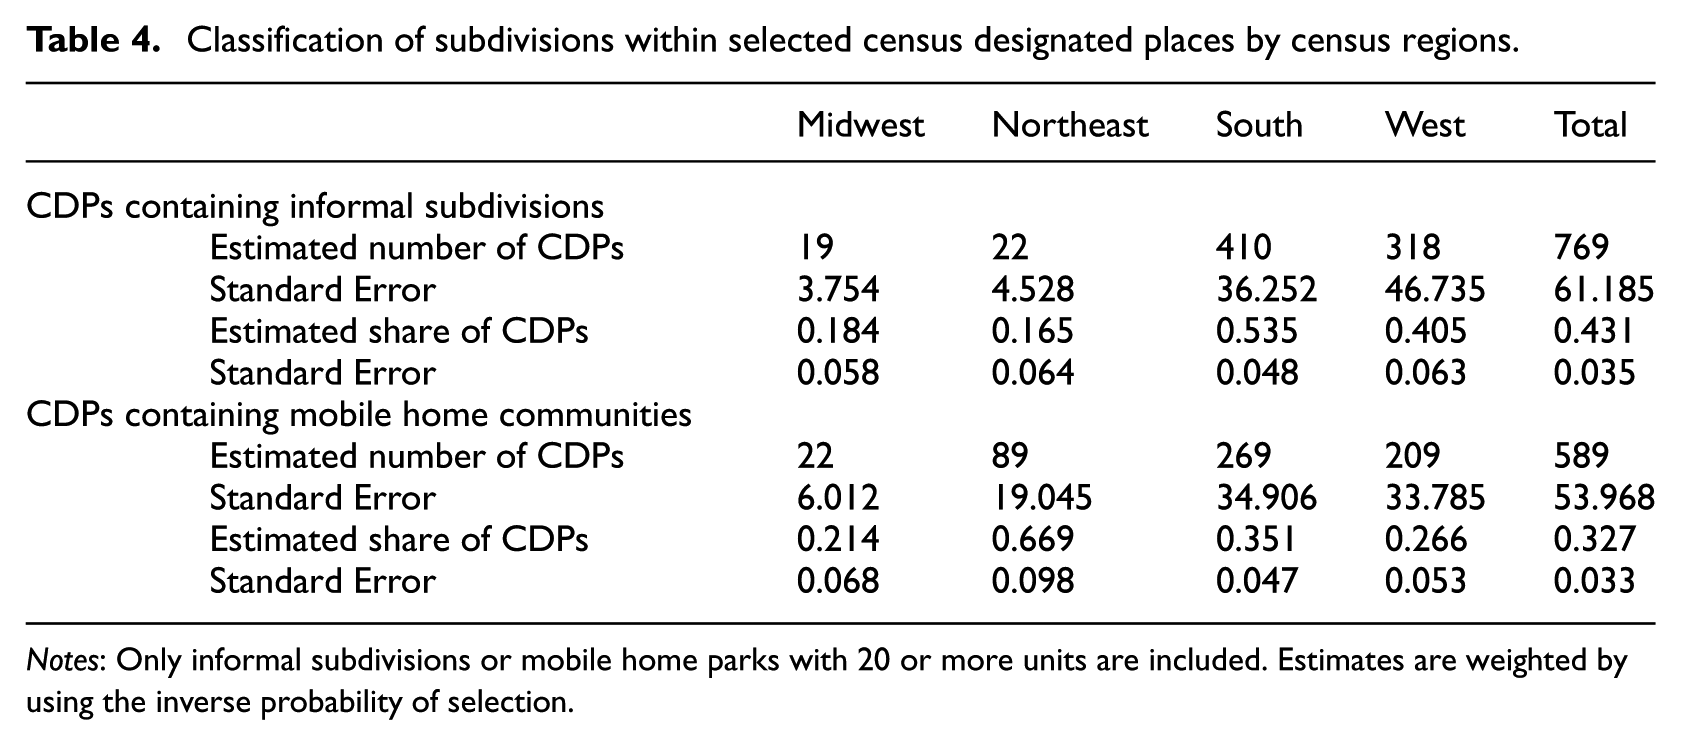
Notes: Only informal subdivisions or mobile home parks with 20 or more units are included. Estimates are weighted by using the inverse probability of selection.
To understand how many households potentially live in informal subdivisions across the sampling frame, I used sampling weights to estimate the number of mobile homes in these same communities. 8 First, recall that across the sampling frame there are 553,702 mobile homes (see Table 1). My analysis using sampling weights suggests that more than 195,674 (35.3%) of these mobile homes are located in informal subdivisions, with 128,352 in Southern states and 62,416 in Western states.
For a number of reasons, these estimates provide a conservative – and perhaps a very conservative – estimate of the actual number of housing units in informal subdivisions. First, the prevalence of mobile homes is an imperfect means of identifying potential informal subdivisions. Although they were widely used in the early years after informal subdivisions were first occupied, once residents have the financial resources to do so they often transition away from mobile units towards self-built or contractor-built dwellings. Elsewhere, for example, I demonstrate in an analysis of parcel data in Cameron County, Texas, that mobile homes make up approximately 45% of housing units in informal subdivisions developed since 2005, but only 25% of housing units in subdivisions developed between 1990 and 1995, and approximately 15% of housing units in federally designated colonias developed prior to 1990 (Durst, 2016). Mobile homes therefore likely represent only a fraction of the dwelling units in new informal subdivisions, and substantially less in older subdivisions.
Second, the half a million mobile homes located in the sampling frame represent only a fraction (8.2%) of the 6 million mobile homes in unincorporated areas in the continental US. 9 How precisely informal subdivisions and mobile home communities are distributed across other unincorporated areas in the country is unclear, and given the design of this study, statistical inferences cannot be made about the extent of these communities nationwide. But the actual number of housing units in informal subdivisions across the unincorporated fringe is undoubtedly substantially higher than the approximately 200,000 estimated above – likely by a factor of 10 or more.
A comparison of federally designated colonias and undesignated informal subdivisions
As the prior analysis has illustrated, informal subdivisions whose morphology closely resembles colonias exist in large numbers outside border counties. I now turn to a comparison of these two types of communities. Unfortunately, many of the physical characteristics upon which colonia designation is determined – such as lack of potable water, adequate sewerage and decent, safe and sanitary housing – are not measured by the American Community Survey and therefore I cannot test whether colonias and informal subdivisions located elsewhere in the country are similar in regards to these conditions.
What can be easily tested, however, are differences between the demographic and socioeconomic characteristics of these communities. To do so, I compared the characteristics of 100 CDPs containing federally designated colonias that fell within the sampling frame (i.e. had 20% or greater shares of mobile homes; see Table 2) with the 189 CDPs containing informal subdivisions identified through the analysis of satellite imagery and property records described above. Once again, sampling weights are used to account for the stratified sampling protocol. 10 Table 5 presents the results of these comparisons. In Panel A, each column represents one of eight socioeconomic and demographic measures. For purposes of comparison, the first two rows provide descriptive statistics for all Census Places in the continental US. The results illustrate that, compared with all Census Places, CDPs containing colonias have high rates of poverty rates (34.9%); high shares of Hispanics (71.4%), immigrants (22.3%) and non-citizens (15.9%); and low shares of blacks (0.5%). For scholars of colonias, this should come as little surprise. Interestingly, however, when compared with all Census Places colonias also have high rates of homeownership among the poor (56.9% vs 45.7%) and among Hispanics (77.7% vs 56.9%). This highlights the fact that, despite the degree of disadvantage experienced by colonia residents, these communities play an important role in expanding homeownership opportunities to residents who are otherwise locked out of the formal housing market.
A comparison of colonias, border- and non-border informal subdivisions: Selected socioeconomic and demographic factors.
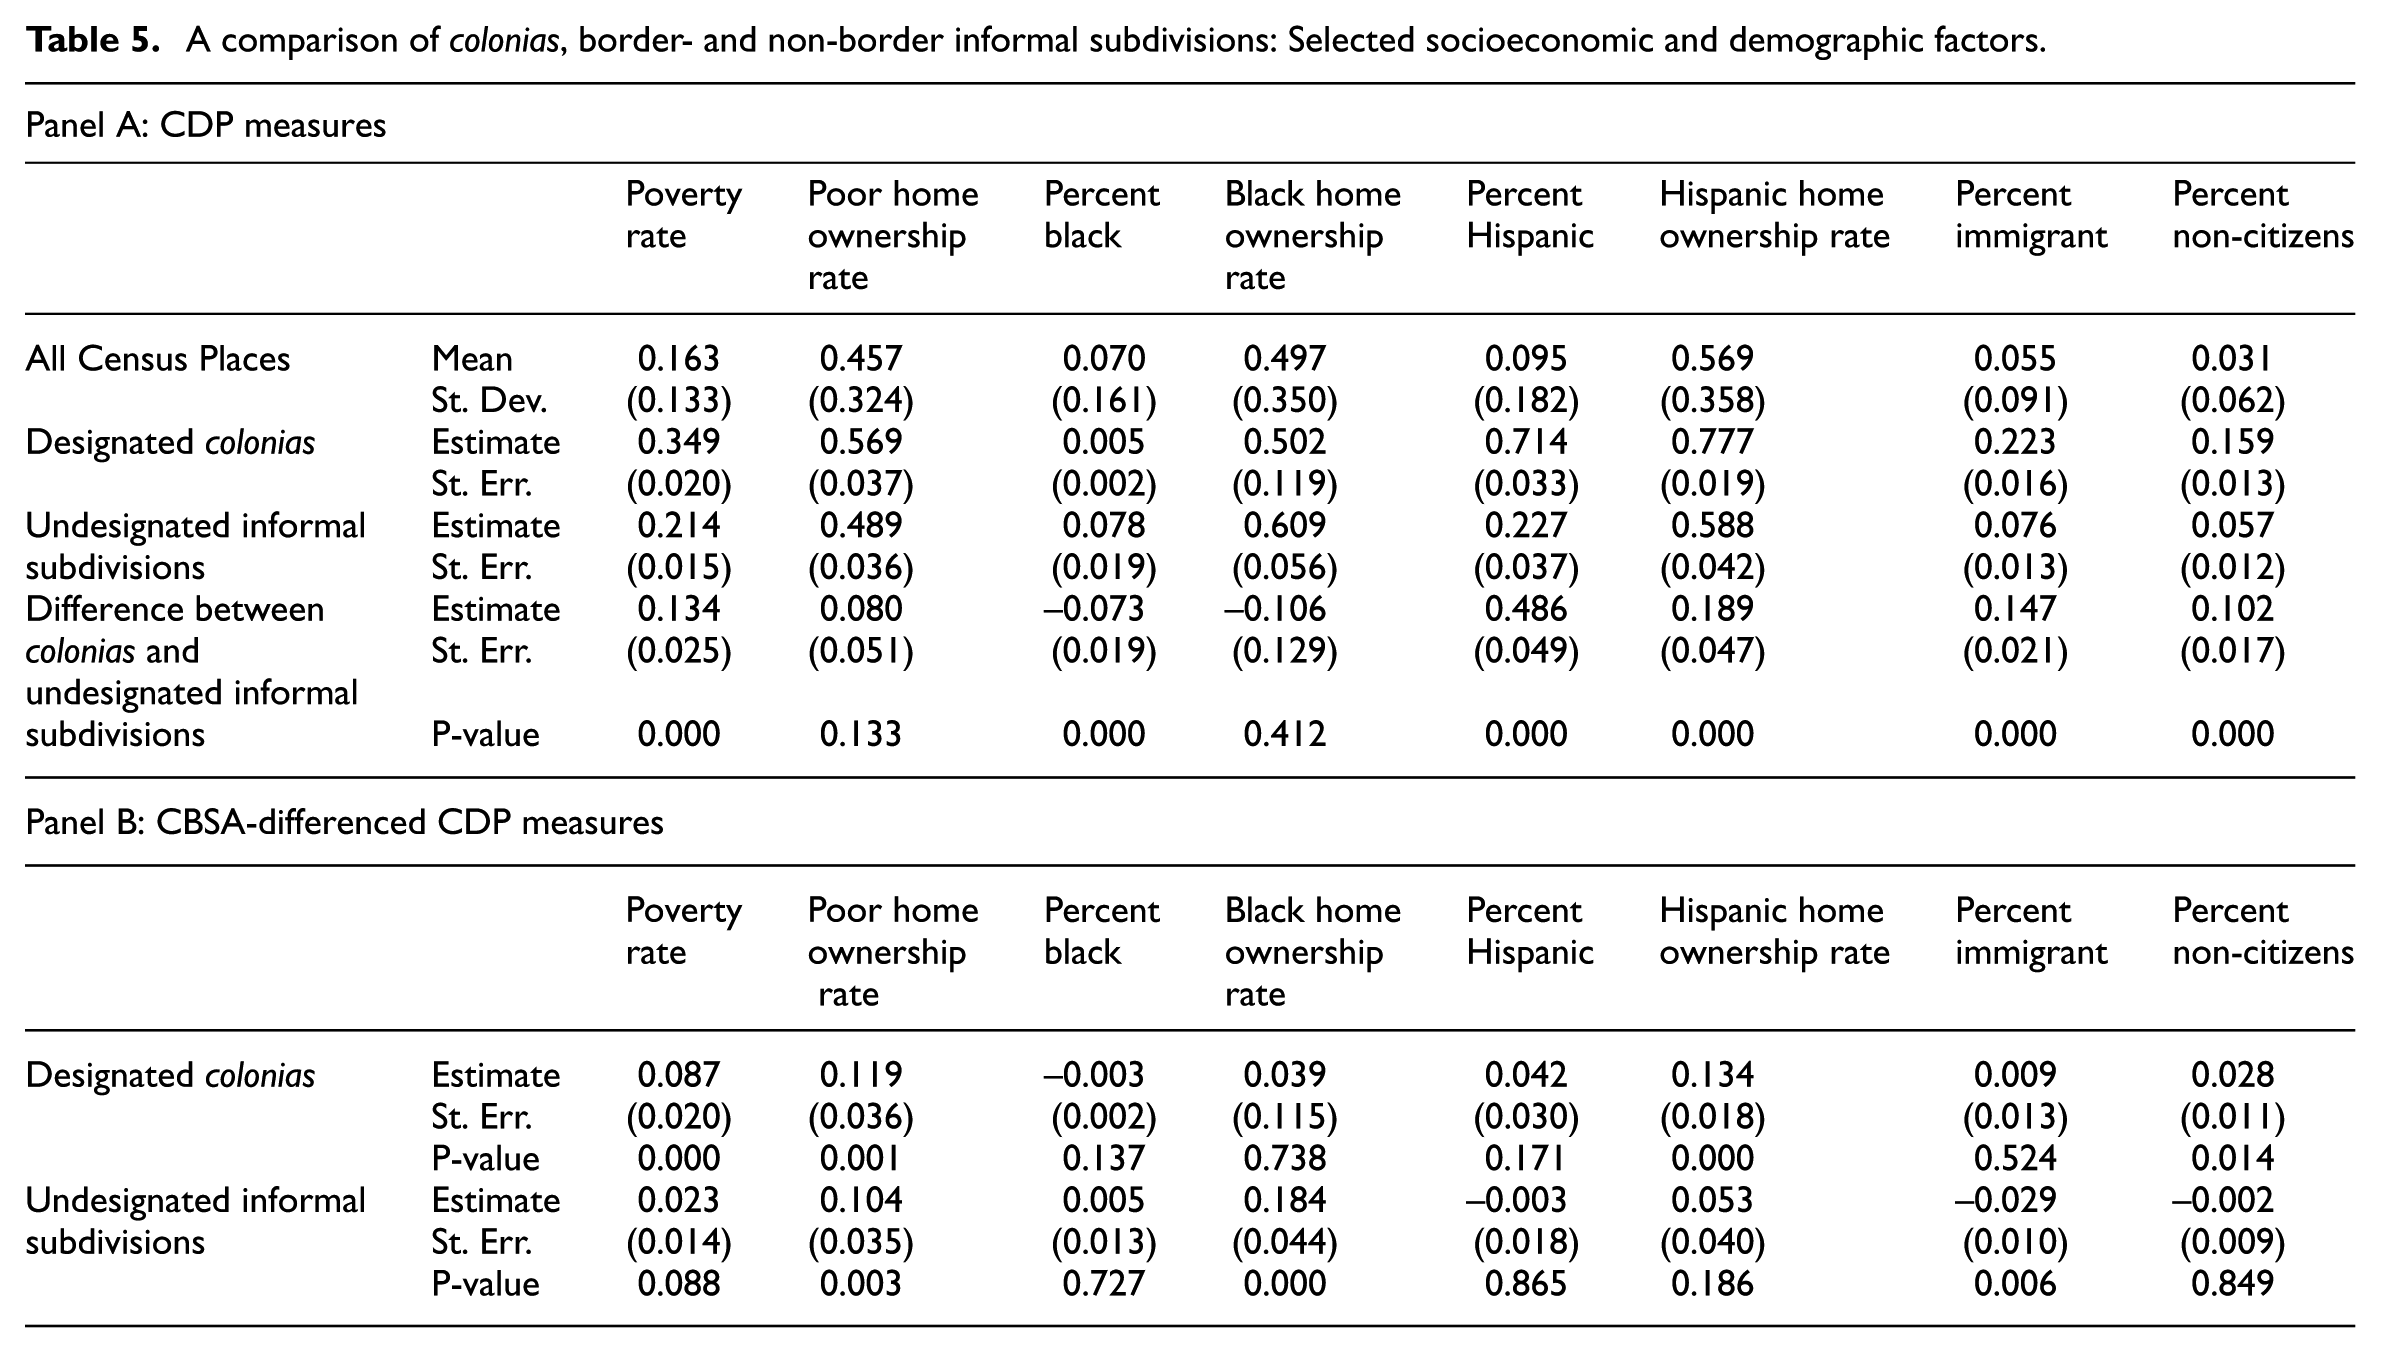
A related question is whether colonias differ markedly from other informal subdivisions located elsewhere in the country. This can be determined by examining the other rows in Panel A. As the results illustrate, the informal subdivisions identified via satellite imagery have poverty rates of 21.4%, 13.4 percentage points lower than in colonias (this difference is significant at the 0.001 level; see Table 5). Similarly, shares of residents in undesignated informal subdivisions who are Hispanic (22.7%), immigrants (7.6%) and non-citizens (5.7%) are also markedly lower than in colonias: differences of 48.6, 14.7 and 10.2 percentage points (p < 0.001). On the other hand, the share of residents in undesignated informal subdivisions who are black (7.8%) is substantially higher than in colonias (difference of 7.3 percentage points; p < 0.001), and homeownership rates among Hispanics in undesignated informal subdivisions (58.8%) is substantially lower than in colonias (difference of 18.9 percentage points; p < 0.001) and on a par with that found in the average Census Place (56.9%). These results suggest that, despite similarities in the physical characteristics of colonias and other informal subdivisions, across the sampling frame for this study there are important distinctions between the socioeconomic and demographic composition of these communities: federally designated colonias in the border region tend to have higher rates of poverty and higher shares of immigrants, non-citizens, Hispanics and Hispanic homeowners, and lower shares of blacks than other informal subdivisions located elsewhere in the nation.
It would be easy enough to end the discussion here and to conclude that the disproportionate share of Hispanics, immigrants, non-citizens and the poor in border colonias substantiates both the federal government’s geographic criteria for designating colonias along the US–Mexico border as well as its use of the Spanish word colonia to refer to these communities. However, one reason for caution in drawing this conclusion prematurely is simply that the federal government’s geographic criteria requiring proximity to the US–Mexico border – where poverty rates and shares of Hispanics, immigrants and non-citizens are likely to be substantially higher than elsewhere in the country – all but ensure that federally designated colonias will have higher shares of these groups than will undesignated informal subdivisions located elsewhere across the country.
To examine this issue, Panel B in Table 5 replicates the analysis in Panel A but uses CBSA-differenced measures of socioeconomic and demographic characteristics for the CDPs studied – that is, the demographic or socioeconomic characteristic for each CBSA (i.e. metropolitan or micropolitan area) is subtracted from that of each CDP. Thus, the estimates presented in Panel B can be interpreted as the average difference between each CDP studied and the CBSA in which it is located. Looking at the first section in Panel B, we see that federally designated colonias have poverty rates and homeownership rates among the poor that are 8.7 and 11.9 percentage points higher, respectively, than in the broader CBSAs in which they are located. The p-values associated with these estimates (see Panel B in Table 5) test whether they are significantly different from zero; that is, whether they are significantly different from poverty and homeownership rates in each CBSA. As shown, both estimates are statistically significant at the 0.001 level. Similarly, shares of non-citizens are 2.8 percentage points higher in colonias than in their respective CBSAs (p < 0.05). Notably, however, in regards to the share of Hispanics, the share of blacks and the share of immigrants, there is no apparent difference between colonias and the broader CBSAs in which they are found, but colonias do, however, have homeownership rates among Hispanics that are 13.4 percentage points higher (p < 0.001) than those found in the CBSAs in which they are located.
One can draw similar conclusions about undesignated informal subdivisions by examining CBSA-differenced measures of the socioeconomic and demographic makeup, shown in the bottom section of Panel B in Table 5. As the results illustrate, poverty rates in these informal subdivisions are marginally higher than in the broader CBSA (2.3 percentage points; p = 0.088), while shares of immigrants are somewhat lower in informal subdivisions than elsewhere in the CBSA (–2.9 percentage points; p = 0.01; see bottom section of Panel B in Table 5). No difference is found for the share of the population that is black, Hispanic or non-citizen, but, notably, homeownership rates among poor households and blacks are markedly higher in these CDPs than elsewhere in the CBSA (10.4 and 18.4 percentage points higher, respectively; p > 0.01 and p < 0.001).
Discussion and conclusion
Research on informal subdivisions of the sort examined here has largely been siloed. Scholars of colonias in the border region have tended to look towards other border states – or to Mexico – for purposes of comparison (Donelson and Esparza, 2010; Esparza and Donelson, 2008; Mukhija and Monkkonen, 2006; Ward, 1999), while research on premature subdivisions in non-border states (Shultz and Groy, 1988; Stroud and Sanford, 2006; Stroud and Spikowski, 1999) has largely overlooked examples of informal land development in the border region.
As others have argued (Mukhija and Monkkonen, 2007), the use of the term colonias to refer to these communities in the border region carries with it important implications. While it is true that many informal subdivisions located in border states are referred to locally as such, and although many of these are home to large numbers of Hispanics, it is not the case that these subdivisions are restricted only to that part of the country. Analysis of Census Designated Places provides an initial, albeit admittedly conservative, picture of the extent of informal subdivisions across the country. Although these subdivisions are heavily concentrated in the four states bordering Mexico, they also exist in large numbers in many other states. Moreover, my analysis suggests that the fact that colonias in the border region are disproportionately home to large populations of Hispanics appears to be primarily a function of geography: because federal colonias policy restricts the colonias designation to communities within 150 miles of the border, and because these areas have higher shares of Hispanics, officially designated colonias are treated as a phenomenon characteristic of this demographic group. These results suggest that this is largely a misplaced association.
Rather than using the term colonias, which brings with it connotations of Hispanic immigrants in border states, this study argues that the concept of informal subdivisions is more apt. The latter has the benefit of being racially and ethnically neutral and geographically non-specific. The phrase ‘informal subdivision’ is also preferable, I believe, to that of ‘premature subdivision’ because it affords greater analytical and conceptual clarity. Although the phrase ‘premature subdivision’ has been used widely in the literature from non-border states dating back at least to the 1930s (Cornick, 1938; Elliott, 2010; Shultz and Groy, 1988), and appropriately highlights the fact that land development in these subdivisions occurs prior to demand for housing, the concept of informality carries more analytical purchase. In particular, it focuses attention on the regulatory environment in which land and housing is developed and managed, broadening the scope beyond issues of land development towards elements such as property transfer and housing production that also shape the characteristics of informal subdivisions and the challenges they pose to planners and policymakers. In the informal subdivisions studied here, property transfer and housing production are key elements that contribute to their affordability, but also to the accompanying risks of purchasing land in these subdivisions. Use of the concept of urban informality in this context sheds light on the regulatory environment in which such practices occur and the parties that benefit from or are disadvantaged by them.
Moving forward, I suggest that scholars of colonias branch out from their traditional focus on the border region and look towards other parts of the country for insights regarding both the challenges facing colonias over the coming decades and potential solutions to these challenges. A new research agenda that takes a national perspective could make a number of important contributions. First, subsequent research could rely on alternative sampling approaches or the analysis of satellite imagery using machine learning techniques to provide a more accurate picture of the number and location of informal subdivisions across the country. Second, research is needed that examines variation in state policies targeting these communities in order to evaluate best practices for promoting both health and safety while also recognising the substantial benefits, such as expanded opportunities for homeownership, that informal subdivisions offer to poor and minority households. Third, and on a related note, scholars and policymakers could look towards older informal settlements in states outside the border region in order to understand the long-term challenges that these communities pose and to identify potential policy solutions. Fourth, qualitative research, including comparative case studies of informal subdivisions in different parts of the country, is needed to understand the cultural and social characteristics of these communities and to gauge residents’ opinions about the challenges they face.
Lastly, local, state and federal policymakers should recognise the striking similarities between colonias and other informal subdivisions located elsewhere in the country and revise federal statutes so that they more broadly define and target funding towards informal subdivisions located outside the border region. For example, under guidance from the Department of Housing and Urban Development as part of the Cranston-Gonzalez National Affordable Housing Act of 1990, from 1991 to 2012, Arizona, New Mexico and Texas typically set aside 10% of their annual Community Development Block Grant (CDBG) allocation for improvements to housing and infrastructure in designated colonias, while California typically set aside between 2 and 5% of these funds. In total, approximately US$266 million were allocated to such improvements over that time period. 11 My analysis suggests that a substantial number of informal subdivisions that could benefit from such funding are located outside the border region, thus necessitating both an expansion of the states that use the CDBG set-aside and an increase in the total funding allocated for physical improvements in these neighbourhoods. However, without a revision to the definition of eligible communities and the adoption of more neutral terminology with which to refer to these communities, such efforts will likely be plagued by the persistent – and largely misplaced – association of these informal subdivisions with the border region.
Supplemental Material
cus-591-17-07-File006 – Supplemental material for Informal and ubiquitous: Colonias, premature subdivisions and other unplanned suburbs on America’s urban fringe
Supplemental material, cus-591-17-07-File006 for Informal and ubiquitous: Colonias, premature subdivisions and other unplanned suburbs on America’s urban fringe by Noah J Durst in Urban Studies
Footnotes
Declaration of conflicting interests
The author(s) declared no potential conflicts of interest with respect to the research, authorship, and/or publication of this article.
Funding
The author(s) received no financial support for the research, authorship, and/or publication of this article.
Notes
References
Supplementary Material
Please find the following supplemental material available below.
For Open Access articles published under a Creative Commons License, all supplemental material carries the same license as the article it is associated with.
For non-Open Access articles published, all supplemental material carries a non-exclusive license, and permission requests for re-use of supplemental material or any part of supplemental material shall be sent directly to the copyright owner as specified in the copyright notice associated with the article.