
Abstract
The importance of innovation for economic performance and competitiveness, whatever the level of analysis adopted, is uncontroversial. Yet little is known about the relationship between innovation and (subjective) wellbeing. This paper empirically studies this issue in a spatial perspective by arguing that the expected positive link between innovation and wellbeing can be even more complex than might be thought, and by testing the expectation that this relationship varies according to the different types of innovation and spatial setting considered. The analysis takes advantage of regionalised data sets at the EU level on wellbeing derived from various waves of Eurobarometer surveys in the period 2007–2011, and on regionalised patents and trademarks, thus merging individual and regional data. The results indicate that different types of innovation have different impacts on wellbeing across space. Technology-intensive innovation, such as patents, yields its benefits only in the most urbanised regions, while the impact of less technology-intensive innovation, such as trademarks, is undifferentiated across space. Spatial spillover effects also play an important role for individual wellbeing, regardless of the type of innovation and the degree of urbanisation of a region. Some reflections on regional innovation policies are finally proposed and discussed with reference to the current debate on place-based regional policies.
Introduction
In the past 30 years or so of theoretical and empirical research, broad consensus has emerged that innovation is the key to competitiveness, whatever the level of analysis adopted (from individuals to firms, from cities to regions, from countries to continents), and the time span considered (Fagerberg et al., 2013). In short, there does not seem to be any alternative to an innovation-led economic prosperity (Phelps, 2015).
Strikingly, however, little is known about the relationship between innovation and (subjective) wellbeing. As reported by Dolan and Metcalfe (2012) and Binder (2013), rare exceptions in this respect, the literature has rarely made the link between the two, despite the rather straightforward observation that innovation should improve people’s lives (Phelps, 2015).
This paper aims to fill this gap by empirically studying the nexus between innovation and individual (subjective) wellbeing.
In particular, the paper takes a spatial perspective to examine which types of innovative activities, i.e. more technology-intensive (patents) contrasted with less technology-intensive ones (trademarks) 1 impact most on wellbeing, in which types of region (i.e. highly urbanised regions contrasted to medium and low urbanised ones) and through what spatial channels (i.e. through geographical spillover effects).
By means of a spatial approach, in fact, it is possible to highlight the direct effect of innovation on individuals’ subjective wellbeing and the effect exerted through innovation spillovers that can be captured in regional variables. 2
As an additional contribution to the existing literature, the empirical analysis combines different data sources and takes advantage of recent advances in the release of regionalised data sets at the EU level on wellbeing derived from various Eurobarometer surveys in the period 2007–2011, and on regionalised patents and trademarks retrieved from EUROSTAT.
The main conclusion reached by this paper is that the expected positive link between innovation and wellbeing can be even more complex than might be thought at first glance, and has been previously detected at the individual level (Dolan and Metcalfe, 2012). This complexity concerns both the type of innovation and the spatial setting considered. In particular, technology-intensive innovation (i.e. patents) seems more relevant for individual wellbeing in more urbanised areas, while the impact of less technology-intensive innovation (i.e. trademarks) is undifferentiated across space. Spatial spillover effects also play an important role for individual wellbeing, regardless of the type of innovation and the degree of urbanisation of a region.
The nexus between innovation and wellbeing across space
As stated in the previous section, with some isolated exceptions, the literature has rarely considered the link between innovation and wellbeing. When a link has been established, it has been a positive association between the two (Binder, 2013; Dolan and Metcalfe, 2012; Phelps, 2015). 3
However, none of these studies has examined the nexus between innovation and wellbeing in a spatial perspective. In a spatial perspective, in fact, additional sources of complexity can arise, making this association far less straightforward than might be expected. These concern the nature of innovation processes themselves, the type of innovation, as well as the spatial setting considered.
In fact, innovation shows persistent variations across space, and it may take different forms in different places (Carlino and Kerr, 2015). First, several studies have highlighted the extremely unbalanced and uneven nature of the geography of invention and innovation (Audretsch and Feldman, 1996), where cities play a primary role in the development of new ideas and the introduction of innovations into the market (Carlino et al., 2007; Glaeser and Gottlieb, 2009). Cities are the incubators of innovation (Vernon, 1960) because of the enhanced operation of agglomeration economies and localised knowledge spillovers in urban settings. Several mechanisms concur in producing this outcome. Highly innovative places tend to attract creative and more educated individuals. Moreover, the concentration of intellectual skills in cities sustains higher level of creativity and innovation in a virtuous and self-reinforcing cycle (Carlino et al., 2007). Diversity effects can promote experimentation and innovation (Audretsch and Feldman, 1996; Duranton and Puga, 2001). Additionally, knowledge circulates rapidly in cities, generating pervasive localised knowledge spillovers and collective learning processes (Breschi and Lenzi, 2016). Furthermore, cities are the central nodes for the diffusion of innovation across space as innovation filters down the urban hierarchy from more central cities to more peripheral locations (Duranton and Puga, 2001; Vernon, 1960).
Second, there is abundant evidence of the differentiated nature and type of innovation processes across space (Saxenian, 1994), suggesting that innovation follows differentiated spatial patterns (Rodríguez-Pose and Crescenzi, 2008a). For example, the geographies of invention and technology-intensive activities (in the form of patents and R&D) and innovation (in the form of product and process innovation) do not perfectly overlap, with the former exhibiting far more concentrated patterns than the latter, at least in the European context (Capello and Lenzi, 2014). 4 Moreover, according to the life cycle perspective, research activities and product innovations tend to be concentrated in higher-rank cities or more agglomerated settings, while process innovations and less technology-intensive activities tend to be more distributed in space (Audretsch and Feldman, 1999; Duranton and Puga, 2001).
Third, not only are the geographies of invention and innovation highly selective in space, but also the effects and the benefits deriving from invention and innovation are differently distributed and reaped across space, depending on the absorptive capacity of regions and the type of innovative activities (Capello and Lenzi, 2014; Charlot et al., 2014). The economic benefits stemming from inventions tend to be concentrated in more advanced and knowledge-intensive areas (Charlot et al., 2014), while the economic benefits of innovation tend to be relatively more pervasive in space and reach also less advanced and less knowledge-intensive areas (Capello and Lenzi, 2014). Likewise, some authors point to an increasing concentration of the rewards stemming from innovation in spite of an increasing cumulative and collective nature of the innovation process itself (Lazonick and Mazzucato, 2013) and there is some evidence, on the EU and the USA, about innovation leading to inequality, especially in terms of wages and earnings (Breau et al., 2014; Florida and Mellander, 2016; Lee and Rodríguez-Pose, 2013, 2016).
Lastly, in a spatial perspective, spillover effects have a prominent role. Innovation in particular is subject to important spatial spillover effects, largely documented in the literature (Comin et al., 2012; Jaffe et al., 1993; Rodríguez-Pose and Crescenzi, 2008a). Geographical distance plays a prominent role in shaping the diffusion of innovation across space and over time; yet the effect of geography is predominant in the early stages of diffusion while it tends to smooth over time until it vanishes entirely (Comin et al., 2012).
Importantly, not only does innovation manifest itself with wide differences across space, but variations of wellbeing are large and persistent over time and across space, making the geography of wellbeing highly heterogeneous (Glaeser et al., 2016; OECD, 2014; Okulicz-Kozaryn, 2012; Oswald and Wu, 2010, 2011). In current years, research on the spatial dimension of wellbeing is gaining momentum (Morrison, 2011), largely influenced and framed by the works of Easterlin (1995). Recast in a spatial setting, the core of Easterlin’s intuition suggests a better quality of life in less dense settings than in crowded environments (i.e. cities) in spite of lower (worse) job opportunities and income conditions. However, urbanisation can affect individual wellbeing in several ways, both positively and negatively, with ambiguous net effect depending on individual preferences and assessment of the city advantages and costs (Winters and Li, 2017). Not surprisingly, the empirical evidence is not so clear-cut. Several studies indicate lower levels of satisfaction in densely populated areas with respect to rural ones, at least in highly developed environments such as the EU (Okulicz-Kozaryn, 2012; Rodríguez-Pose and von Berlepsch, 2014; Sørensen, 2014) and the USA (Okulicz-Kozaryn, 2015; Winters and Li, 2017). Some studies, however, report no significant relationship between urbanisation and wellbeing (Rodríguez-Pose and Maslauskaite, 2011) and others claim that the relationship between urban size and wellbeing crucially depends on the stage of development of countries (Easterlin et al., 2011; Shucksmith et al., 2009). Finally, some studies argue that the negative effect of urbanisation on individual self-reported wellbeing characterises especially very large cities (above 500,000 inhabitants) and the pure and simplistic dualism between the city and the countryside overlooks the fact that a city’s positive externalities may expand well beyond the urban boundaries, depending on the rank of the city itself and on the proximity of recipient areas to the originating city (Camagni et al., 2015; Lenzi and Perucca, 2018).
By extending these arguments, it is reasonable to deduce that the innovation/wellbeing nexus at the regional level is complex and highly heterogeneous, i.e. the impact of innovation on wellbeing can vary according to the type of innovation and the spatial setting considered.
In particular, there are concomitant reasons why one may expect the impact of inventive and technology-intensive activities (e.g. R&D, patents) on wellbeing to be significant primarily in highly urbanised areas. First, inventive and technology-intensive innovative activities (e.g. R&D, patents and product innovation) are disproportionately concentrated in higher-rank cities or more agglomerated settings characterised by a more sophisticated demand, a greater intensity of research activities and where more radical (product) innovations tend to be incubated (Audretsch and Feldman, 1999; Duranton and Puga, 2001; Jaffe et al., 1993; Rodríguez-Pose and Crescenzi, 2008a). Second, these types of innovative activities give rise to (positive) economic effects highly concentrated in space in more technology- and knowledge-intensive areas (Capello and Lenzi, 2014; Charlot et al., 2014). Third, the co-location in cities and agglomerated settings of inventive activities, technologies and creative individuals facilitates the recombination of knowledge and innovation, their hybridisation and, ultimately, their diffusion and deployment, supporting superior innovative and technology intensity (Frenken and Boschma, 2007). On the other hand, less technology-intensive innovations (e.g. trademarks) are more pervasive in space (Duranton and Puga, 2001) and their positive effects tend to reach also less advanced and knowledge-intensive areas (Capello and Lenzi, 2014); therefore, one may expect them to exhibit significant positive effects on wellbeing in all types of settings. Finally, one may expect innovation spillover effects to be important in all spatial contexts, even if for different reasons. In less densely populated areas, which are generally less innovative (regardless of the type of innovation considered; Capello and Lenzi, 2014), spillover effects may supplement a relatively weaker indigenous innovative capacity; on the other hand, more agglomerated settings, which are generally more innovative, have the necessary indigenous absorptive capacity to take advantage of the innovations developed elsewhere.
The next sections of the paper test these expectations empirically.
The empirical approach
The conceptual and empirical framework applied in this paper to analyse the nexus between innovation, urbanisation and wellbeing follows the general approach adopted by most of the studies on life satisfaction: subjective wellbeing is assumed to depend on a set of individual characteristics and other variables characterising the context in which the respondent is living. 5 Therefore, the relationship between innovation and individual wellbeing can be summarised and formalised as follows:

where i stands for the individual, r for the region and t for time. In equation (1), then, individual subjective wellbeing depends on a range of factors, at the individual and at the regional level. In particular, the focus is on the impact of innovation and urbanisation (and their interplay) on individual wellbeing, while controlling for concomitant factors at the individual and the regional level that may concur to affect individual subjective wellbeing.
Data on individual wellbeing are extracted from Eurobarometer surveys, which present the advantage of linking each individual with the NUTS2 region of residence, and thus to associate each respondent to variables measured both at the individual and the regional level. 6 Details on the construction of the dependent variable are provided in section ‘Wellbeing’.
As discussed in the previous section, different types of innovative activities are considered (i.e. technology-intensive as patents and less technology-intensive as trademarks). Details on the measurement of the innovation variables and their spatial heterogeneity are provided in section ‘Innovation’. In order to isolate the effect of each innovation variable better, and because of a relatively high degree of correlation among them, they were introduced separately in the regressions. Additionally, the possibility of delayed effects of innovation across space and over time (Comin et al., 2012) was taken into consideration by lagging innovation variables over time and across space.
As far as the temporal lag is concerned, innovation indicators were introduced by lagging them up to five years. 7 This approach is especially relevant when considering patents, which by definition protect inventions (i.e. new ideas) and can be more distant (in time) from market applications than trademarks, which instead represent products on the market.
The spatial spillovers of innovation, on the other hand, were computed as the sum of the innovation variables in proximate regions discounted by interregional distance. 8 The role of geographical distance in shaping innovation diffusion patterns has been convincingly shown in the literature (Comin et al., 2012).
Equation (1) controls for other factors: in the first place, a set X of individual characteristics of the respondents. These features include age, gender, education, occupation, marital status and number of children, as described in Table A1 in the Appendix. 9 Two other individual controls warrant particular attention. First, many works have discussed the impact of income on life satisfaction (Easterlin, 1995). Since data on a sensitive issue such as personal income are not always provided by Eurobarometer surveys, we used apartment ownership to capture this aspect, similar to other studies (Herbst and Lucio, 2016). Second, we recognise that the effect of innovation on subjective wellbeing might be influenced by personal interests not captured by the individual controls listed above. In order to capture the individual propensity/openness to innovation, which might influence individual wellbeing directly (Dolan and Metcalfe, 2012) or indirectly, by increasing the propensity to appreciate novelties and new products, we included a variable taking value 1 if the individual reported, in the survey studies, that EU policies should focus on research and innovation and 0 otherwise.
The degree of urbanisation in the region r was captured by a dummy variable (U in equation (1)) that was coded as 1 in highly urbanised regions and 0 otherwise. Section ‘Degree of urbanisation’ provides fuller details on the measurement of the urbanisation variable. The overall level of regional wealth (Ir in equation (1)) was measured in terms of per capita GDP in the respondent’s NUTS2 region of residence and its quadratic term. The inclusion of this regional control is justified by the fact that innovation could be associated with higher levels of wealth. Therefore, omitting the latter aspect might lead to a biased estimate of the relationship between innovation and wellbeing. Finally, all models included country (Ci) and year (τt) fixed effects (i.e. dummy variables) aimed at controlling for cultural, social, economic and institutional conditions (e.g. apartment ownership propensity), expected to be homogeneous within the same country (Frey and Stutzer, 2010). The set of year dummies, on the other hand, aims to control for their evolution over time and the specificities of the period considered (2007–2011).
Empirically, equation (1) takes therefore the following form:
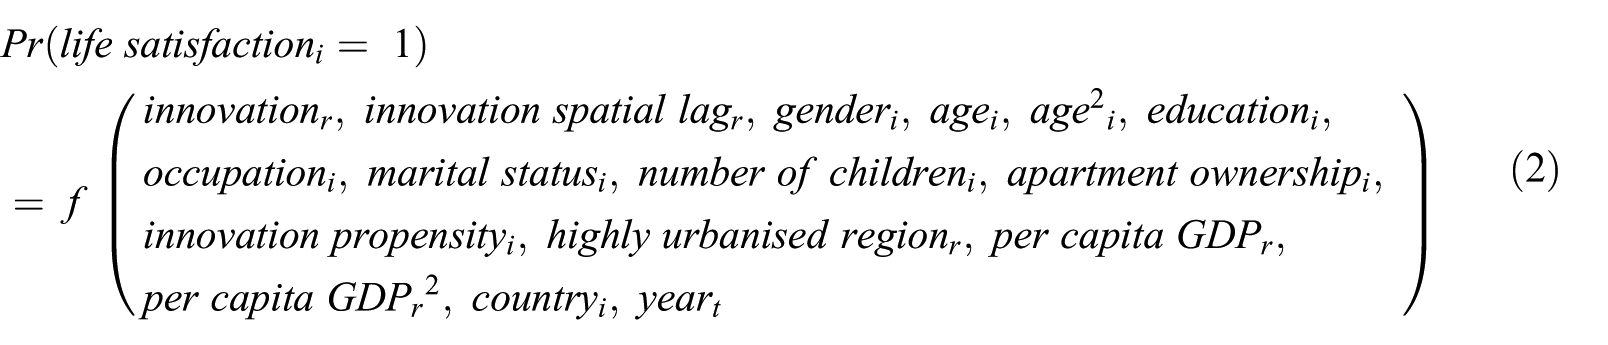
In order to unravel the differentiated impact of innovation across space (i.e. in highly urbanised regions contrasted with less urbanised regions), the innovation variables and their respective spatial and temporal lags were interacted with the dummy variable flagging highly urbanised regions. In particular, the sign and significance of the coefficient of the interaction terms (of the innovation variable as well as of its spatial and/or temporal lags) has to be interpreted as the impact of innovation (patents or trademarks) in highly urbanised regions. The sign and significance of the coefficient of the simple terms, i.e. the non-interacted ones (of the innovation variable as well as of its spatial and/or temporal lags) has to be interpreted as the impact of innovation (patents or trademarks) across all the other NUTS2 regions considered (i.e. non-urbanised regions). Importantly, a positive and significant coefficient of the interaction term implies that the impact of innovation (and/or of its spatial and temporal lags) is greater in highly urbanised regions with respect to the other NUTS2 regions considered; the opposite holds if the coefficient is negative and significant. On the other hand, when the coefficient of the interaction term is not significant, the impact of innovation (and/or of its spatial and temporal lags) in highly urbanised regions is not different from that occurring in all the other regions. 10
The enlarged estimated equation therefore is the following:

The estimation method of wellbeing equations has been a matter of intense debate between proponents of linear models and proponents of categorical models. The dispute has been almost definitively settled by Ferrer-i-Carbonell and Frijters (2004), who claim that these methods provide coherent results. Our principal results are based on OLS estimates (section ‘Results’) and errors are clustered at the regional (NUTS2) level as recommended by Helliwell (2003) when merging variables at the individual and at a more aggregate level of analysis.
The specific measurement of our chief variables, i.e. wellbeing, innovation and urbanisation is discussed in the next section. The list of all variables and their description is presented in the Appendix, Table A1.
Measuring wellbeing, innovation and urbanisation
Wellbeing
Since the works by Easterlin in the 1980s and 1990s, a considerable body of literature has been devoted to the measurement of individual subjective wellbeing. Today, wellbeing indicators are fully accepted in the scientific debate and used for policy purposes (OECD, 2014; Stiglitz et al., 2009). In the past, indicators of life satisfaction, happiness and subjective wellbeing were frequently used as synonymous and used interchangeably in the literature. Yet, as recently argued by many scholars (see among others Caporale et al., 2009; Deaton, 2008), wellbeing can be considered a general concept, while life satisfaction and happiness should be considered as conceptually distinct because they do not necessarily align. In fact, wellbeing comprises both a cognitive component and an affective one. The cognitive component concerns people’s overall assessment of their life satisfaction, while the affective component concerns experienced emotions. In particular, the cognitive dimension involves a judgement on the relevance of different types of resources/goods/services for life satisfaction in general (Gamble and Gärling, 2012). Since this paper assesses the link between innovation and subjective wellbeing, the cognitive dimension of wellbeing seems of most relevance; hence wellbeing is measured by relying on life satisfaction questions as extracted from Eurobarometer surveys.
Eurobarometer studies have been run since 1973 on behalf of the European Commission in order to monitor the evolution of public opinion in Member States on a wide variety of issues such as citizens’ degree of life satisfaction. In particular, we focused on various waves carried out between 2007 and 2011 which, when pooled, enabled the creation of a rich data set (including about 160,000 observations) on individual wellbeing. 11 Respondents reported their satisfaction with life according to a qualitative four-point scale: from ‘Very unsatisfied’, to ‘Rather unsatisfied’, from ‘Rather satisfied’, to ‘Very satisfied’. In particular, we dichotomised the dependent variable so that it took value 0 for very and rather unsatisfied individuals and value 1 for very and rather satisfied individuals. This approach is consistent with that in the existing literature (Boyd-Swan and Herbst, 2012).
Innovation
The measurement of innovation has always been a much debated topic (Hong et al., 2012). Since the seminal definition by Schumpeter (1934), innovation has been classified in four main categories: product innovation, process innovation, organisational innovation, and the creation of a new market. The traditional measures of innovation, however, have been mostly on the input side of the innovation process, such as R&D expenditures, scientific publications or patents and the related citations (Hall et al., 2005; Jaffe et al., 1993). In particular, the mostly frequently used indicators are the share of R&D expenditures on GDP and patent counts (Stoneman, 2010). The geographies of R&D and patents are extremely selective and uneven in space (Rodríguez-Pose and Crescenzi, 2008a) and show a disproportionate concentration in urban settings (Carlino and Kerr, 2015; Carlino et al., 2007).
More recently, however, some authors have expressed increasing dissatisfaction with the use of such measures of innovation. In fact, these indicators are liable to criticism and have drawbacks. In particular, by following the Schumpeterian distinction between invention and innovation, these indicators are more suited to capturing the knowledge creation stage (i.e. the invention stage) rather than the commercialisation one (i.e. bringing new ideas to the market, the innovation stage proper), implicitly hiding the assumption that innovation may derive primarily if not exclusively from research and technological activities.
Even if the contribution of research and technological activities to the development and commercialisation of innovation cannot be neglected, this approach is particularly controversial from a spatial viewpoint for two main reasons, as convincingly argued by Capello and Lenzi (2014). First, R&D and patents are indicators of innovation efforts stemming from formal knowledge creation activities (Griliches, 1990) and disregard innovative activities in the form of marketing and organisational innovations, as well as product and process innovation obtained without research and patenting activities. Second, innovation processes increasingly rely upon a mix of differentiated and spatially dispersed knowledge sources that tend to vary with specific characteristics of innovative agents, among which the local sectoral specialisation and size of firms. Since the studies by Jaffe (1989) and Jaffe et al. (1993), the literature has increasingly documented the paramount importance of knowledge spillovers selectively diffusing across geographical (Jaffe et al., 1993) and cognitive spaces (Breschi and Lissoni, 2009). Therefore, relying exclusively on R&D and/or patents to account for the innovative potential in regions may be partial, if not misleading (Stoneman, 2010).
In order to overcome these difficulties, in this paper we complement standard per capita patent (fractional) count measured at the regional level (NUTS2) with recently released data on per capita trademarks at the regional level (NUTS2), retrieved from EUROSTAT. The use of trademarks as a measure of innovation has been recently proposed by Stoneman (2010). The key difference between patents, on the one hand, and trademarks on the other, resides in their respective research and technological content. Patents are issued once the inventive step, the novelty and usefulness of the invention are proved. They tend to be concentrated in manufacturing, in specific sectors and technologies and to favour large corporations. Differently, trademarks are issued to protect the distinctiveness of the good and/or service covered by these rights. They are extensively used in both manufacturing and services, in both traditional and more creative/high-tech sectors, 12 by both large and small–medium enterprises and take into consideration innovations that derive from research and technology-intensive activities and innovations that are simply the outcome of product differentiation strategies. In particular, given the high variability over time of patents and trademarks, especially at the regional level, we computed their cumulative number on a 3-year time window 13 in per capita terms (i.e. per 1000 inhabitants) so as to discount also for size effects.
In order to offer some insights on the similarities and differences in patenting and trademarking propensity across European regions, Figures 1(a) to 1(c) present the cumulative count per 1000 inhabitants of regional patents (Figure 1(a)), trademarks (Figure 1(b)) and their ratio (Figure 1(c)) in the period 2009–2011. The geography of patents shows a largely concentrated pattern with the usual North–South and East–West divides that characterise several economic indicators (Rodríguez-Pose and Crescenzi, 2008a). On the other hand, the geography of trademarks presents more attenuated divides, while maintaining some concentration in more urbanised or capital regions (despite more limited than in the case of patents). Data indicate that on average regional per capita trademarks are greater than regional per capita patents. However, the ratio between the two (Figure 1(c)) reveals that there are regions in which the two go in tandem, while in others (especially, the Southern and Eastern belts) the propensity to trademark is far greater than the propensity to patent. This observation supports the choice of complementing different indicators in order to provide a fuller description of innovation processes especially in less technology-intensive areas.
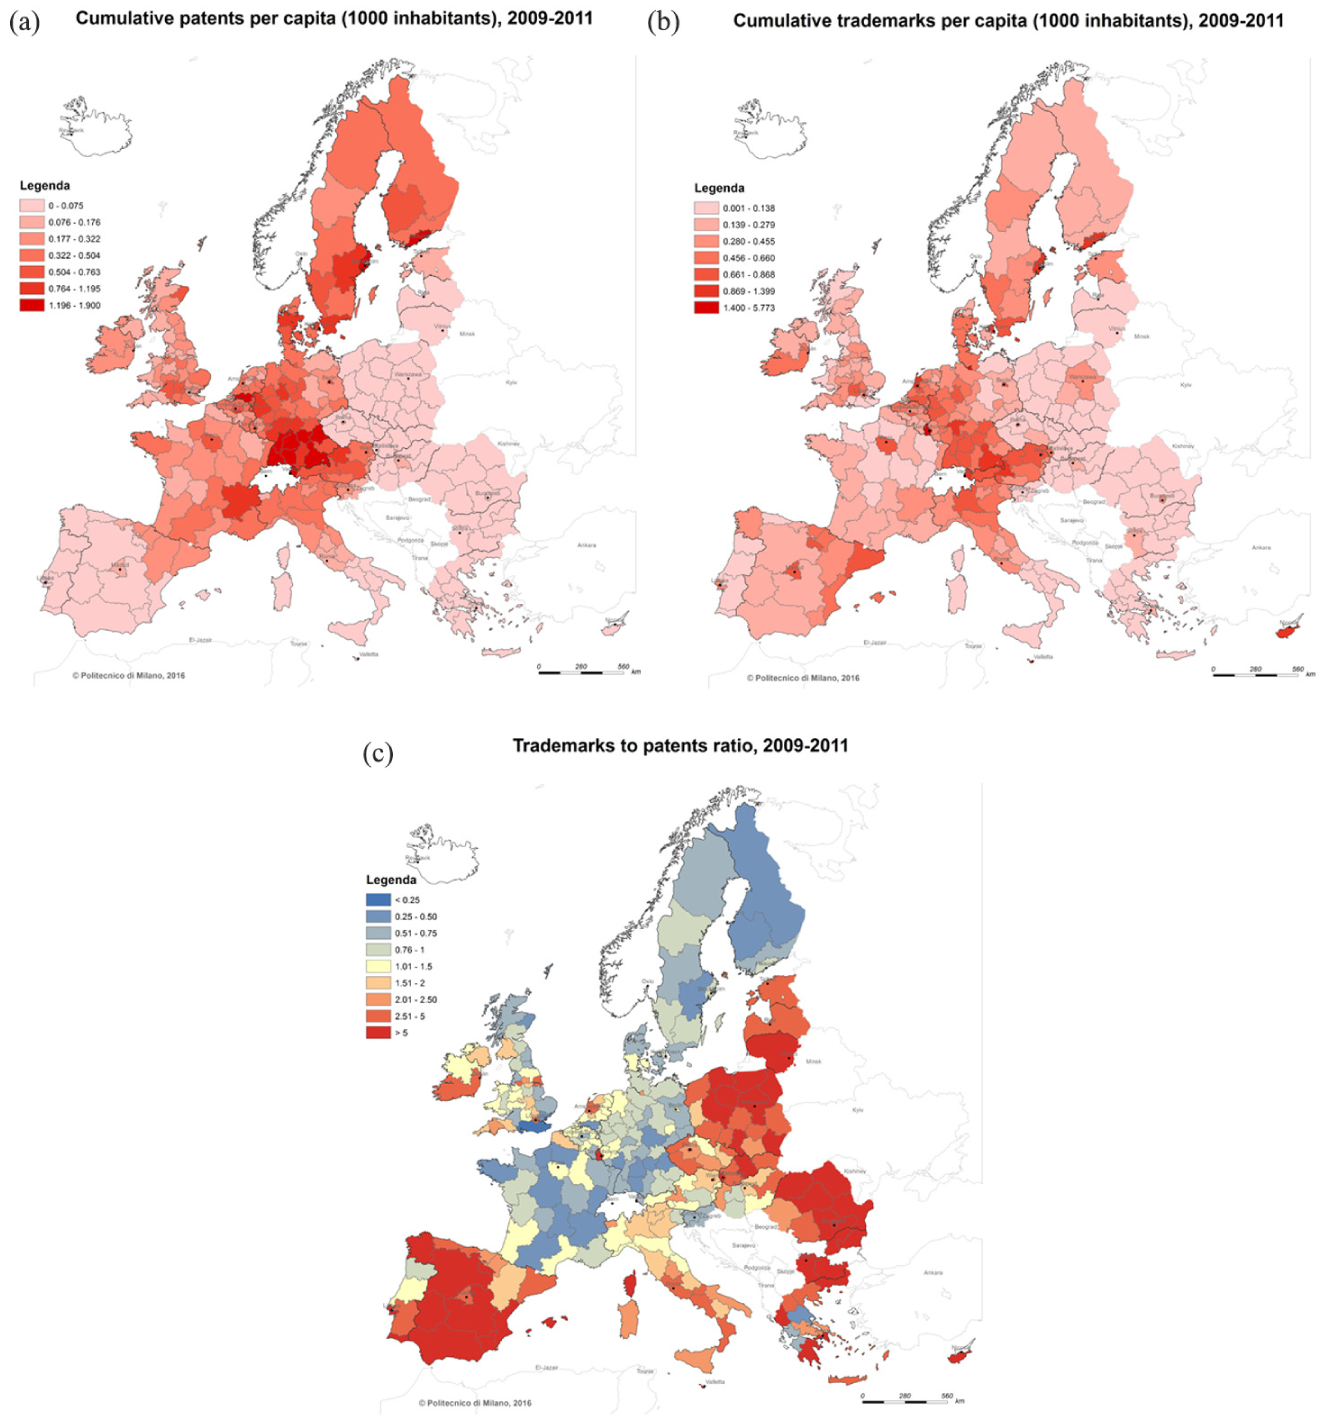
Innovation (patents and trademarks) in EU regions. (a) Cumulative patents per 1000 inhabitants, 2009–2011. (b) Cumulative trademarks per 1000 inhabitants, 2009–2011. (c) Trademarks to patents ratio, 2009–2011.
Degree of urbanisation
Similar to the measurement of innovation, also measuring the degree of urbanisation in regions is a controversial task, conceptually and practically. There are multiple approaches available in the literature and there is no commonly accepted definition/strategy to identify highly urbanised regions.
In this paper, we divided EU NUTS2 regions into two mutually exclusive groups according to their urban structure, i.e. the degree of urbanisation, and defined as highly urbanised those regions hosting either the capital city or a city of at least 1 million inhabitants.
This definition enables consideration to be made of two sources of agglomeration economies simultaneously. First, it emphasises the size of the urban system in a region (which is needed to capture the intensity of urbanisation effects). However, it also acknowledges that EU countries are extremely heterogeneous in terms of population, and, consequently, the size of their respective national urban system (what is a big city in one country may actually be a small–medium city in another one). By considering as highly urbanised regions also those hosting the capital city, we are also able to capture those urbanisation effects that may arise because of the functions performed by a city (i.e. the rank of the city), regardless of its size. Generally, capital cities perform higher-rank functions with respect to other cities, thus generating enhanced urbanisation effects. 14
In conclusion, highly urbanised NUTS2 regions include capital regions and the following NUTS2 regions: Catalunya (the main city is Barcelona), Lombardia (Milan), Provence-Alpes-Côte d’Azur (Marseille), Nord-pas-de-Calais (Lille), Rhône-Alpes (Lyon), Śląskie (Katowice).
We acknowledge that alternative indicators and thresholds to identify highly urbanised regions, also in the European context, can be found in the literature. A very common alternative applied in the literature is population density (e.g. Lee and Rodríguez-Pose, 2013); a highly desirable property of the population density indicator is that it is a continuous indicator. However, population density presents also drawbacks. The most relevant one, specifically in the EU context, is that it highly depends on the surface area, and EU NUTS2 regions vary considerably in this respect; consequently, we may end up with regions with very large cities or capitals but with low population density or the other way round, dense regions with small cities. For example, according to EUROSTAT data, 15 population density in Ceuta and Melilla (respectively, 4242.2 and 6061.1 inhabitants per km2) is more than ten times greater than in Lombardia (434.5 inhabitants per km2) and in the capital region of Helsinki (179.1 inhabitants per km2). Therefore, we preferred to follow most of the literature on urbanisation and wellbeing using categorical variables to identify denser populated settings (Easterlin et al., 2011; Okulicz-Kozaryn, 2012, 2015; Rodríguez-Pose and Maslauskaite, 2011; Rodríguez-Pose and von Berlepsch, 2014; Shucksmith et al., 2009; Sørensen, 2014). In particular, the use of a binary instead of a categorical variable ease the interpretation of interaction effects, which are central in our conceptual framework. Finally, the specific threshold adopted in this paper is consistent with the categorisation used by Winters and Li (2017), albeit for the USA and with the threshold used by OECD and EUROSTAT to identify extra-large cities in Europe. Being applied to administrative regions and not to functional ones, this categorisation is not able to capture urbanisation effects stemming from the geographical proximity of several NUTS2, each with a medium-size city (e.g. the Ruhr region in Germany), which could be captured at higher administrative spatial scale of analysis (e.g. NUTS1). At the same time, in most of the EU countries (with some exception as Germany), NUTS1 regions represent too large geographical units to capture urbanisation effects. 16 By balancing out the advantages and disadvantages of the possible alternative indicators, we are reasonably confident that the proposed definition of highly urbanised areas sufficiently serves the purpose of the present study.
Results
The presentation of the results starts with the analysis conducted by using innovation variables measured at the regional level and their respective spatial lags (Table 1), as reported in equation (2). In order to examine the possible differences among regions according to their degree of urbanisation, we repeated the analysis by interacting the innovation variables and their respective spatial lags with the dummy variable flagging highly urbanised regions (equation (3)). The results are reported below in Tables 2 and 3. Because of space constraints, the tables report only the coefficients of the innovation variables, measured at different time lags with respect to the dependent variable. The output of the regressions presenting all individual- and regional-level control variables as well as innovation variables and their spatial and temporal lags is available in the Appendix (Tables A2 to A6).
The impact of regional innovation (including its spatial lag) on wellbeing.
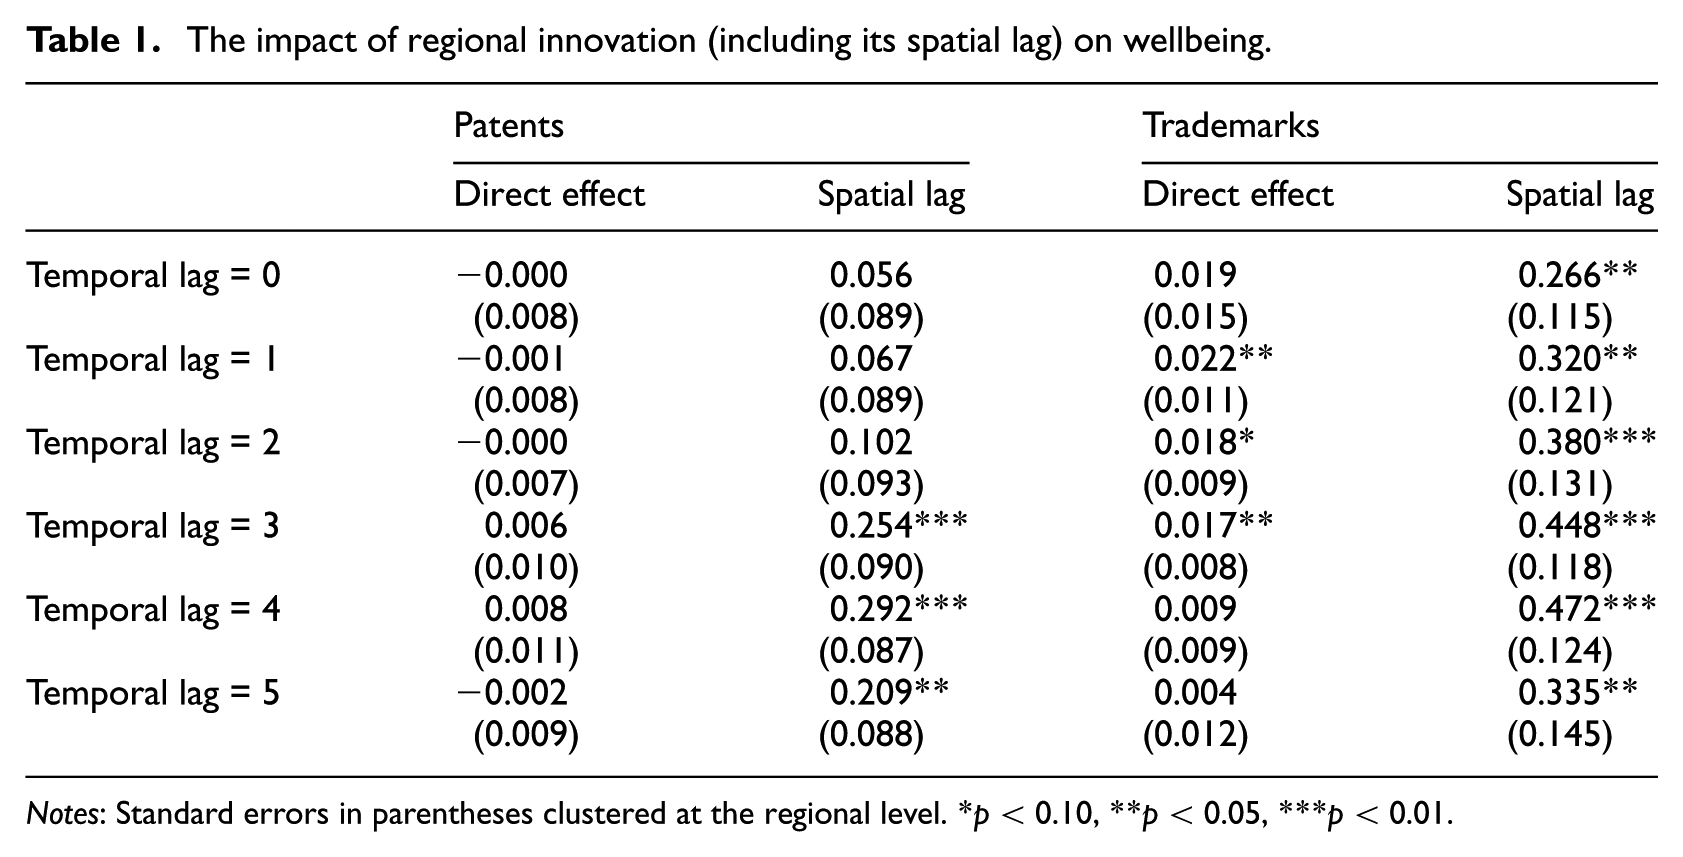
Notes: Standard errors in parentheses clustered at the regional level. *p < 0.10, **p < 0.05, ***p < 0.01.
The impact of patents and their spatial lag on wellbeing across space.

Notes: Standard errors in parentheses clustered at the regional level. *p < 0.10, **p < 0.05, ***p < 0.01.
The impact of trademarks and their spatial lag on wellbeing across space.
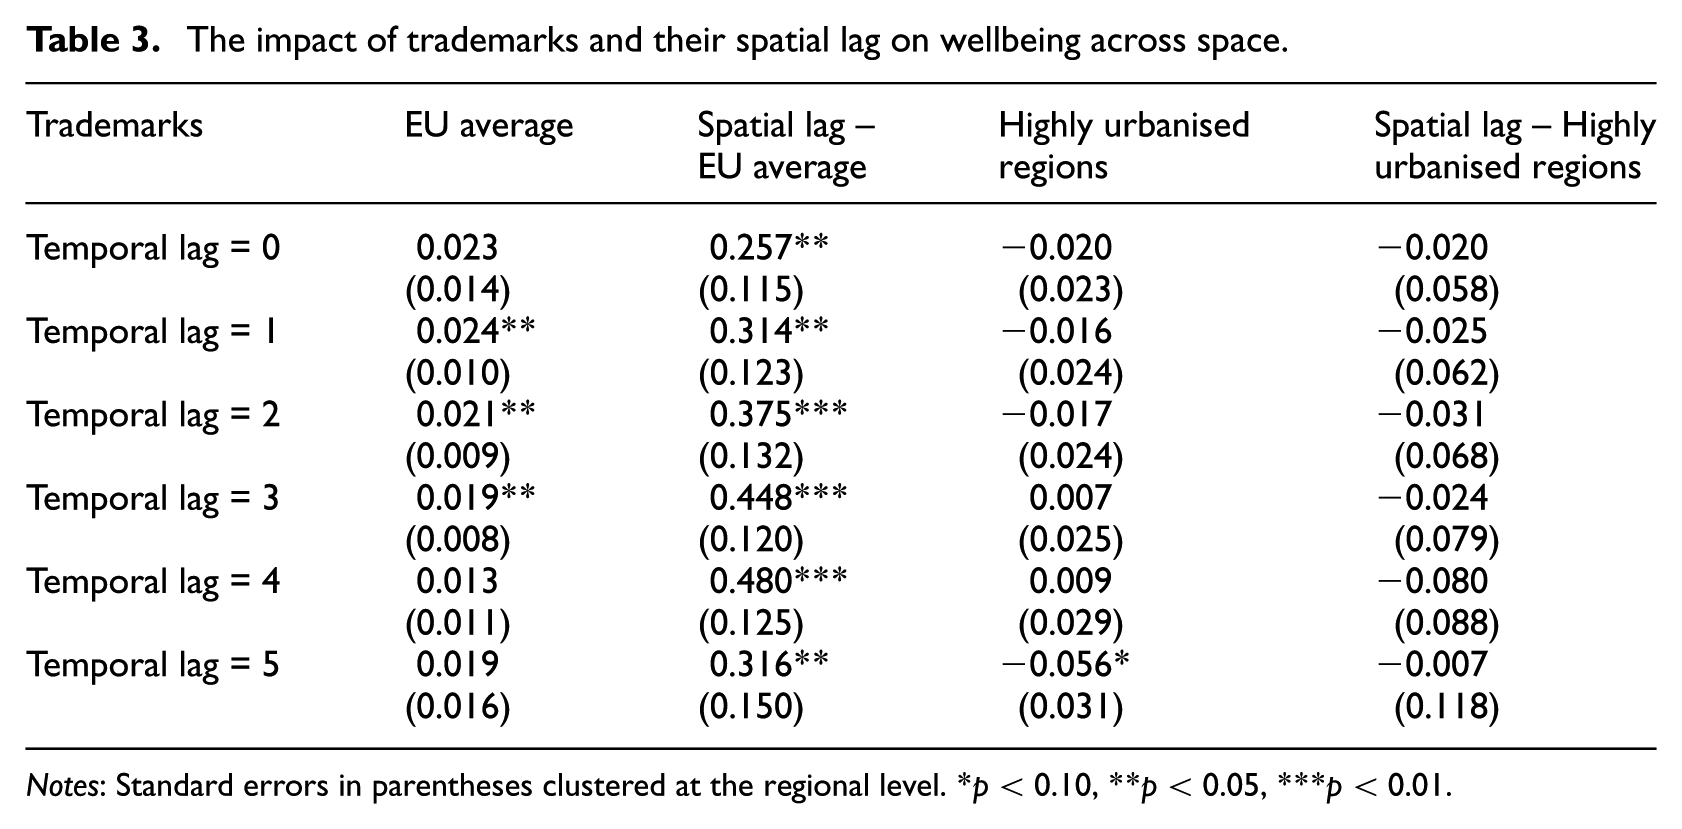
Notes: Standard errors in parentheses clustered at the regional level. *p < 0.10, **p < 0.05, ***p < 0.01.
In detail, as far as patents are concerned, the main message from Table 1 is that patents apparently affect wellbeing only through spatial spillover effects delayed in time (from the third lag onward). Only the coefficients of patents spatial lags (from the third lag onward) are significant (Table 1, column 2), whereas the direct effects of patents are never significant. Delayed effects of spatial spillover are plausible because innovation diffuses slowly across space (Comin et al., 2012) and patents represent innovations that are more distant from direct market introduction.
This result seems to contradict the expectation that innovation and wellbeing are positively linked.
However, when distinguishing between highly urbanised regions and less urbanised ones (Table 2), it appears that there are significant direct effects of patents on wellbeing only in highly urbanised regions and starting from the second temporal lag; in fact, the coefficient of patents in urbanised regions is significant starting from the third temporal lag (Table 2, column 3), while the coefficient of patents in all the other regions is negative and generally not significant (with the only exception of the second lag, with p = 0.075). This delayed effect is plausible because patents represent innovations more distant from direct market introduction (see Note 7). Moreover, a further delayed effect of spatial spillover is plausible because innovation diffuses slowly across space (Comin et al., 2012); in fact, the coefficient of spillover is positive and significant from the third lag (Table 2, column 2). Additionally, spillover effects in highly urbanised regions are less important than in the other EU regions; in fact, the coefficients of spillovers in urbanised regions show a negative sign and are significant for the fourth and fifth lags (Table 2, column 4).
As far as trademarks are concerned, the main message from Table 1 is that trademarks affect wellbeing directly and through spatial spillovers. The coefficient of trademarks is significant up to the third lag (Table 1, column 3) 17 and the coefficient of their spillovers is significant for all lags (Table 1, column 4). Delayed and more durable effects of spatial spillovers (with respect to the direct effect of trademarks) are plausible because innovation diffuses slowly across space (Comin et al., 2012).
Importantly, when distinguishing between highly urbanised regions and less urbanised ones, these positive effects take place in all types of regions; in fact, trademarks show a positive and significant coefficient in all EU regions and not significantly different in urbanised ones (Table 3, columns 1 and 3, respectively). 18 Similarly, the effect of spillovers takes place in all types of regions; spillovers have a positive and significant coefficient in all EU regions and not significantly different in urbanised regions (Table 3, columns 2 and 4, respectively).
In short, in terms of patents (Table 2), the direct impact is positive and significant (as well as partly delayed in time) only in highly urbanised regions. On the other hand, the indirect spatially lagged effect (delayed also in time) is more significant in less urbanised regions, while it plays a reduced role in highly urbanised ones, signalling the existence of asymmetries in externalities stemming from this type of innovation, going from more urbanised areas to less urbanised ones but not the other way round.
In terms of trademarks (Table 3), our results lead to different conclusions. The direct impact of regional trademarks is positive and significant, even if it seems to vanish once the time lag increases and is above three years. Importantly, the direct impact of trademarks is positive and significant without any premium for highly urbanised regions. In this case as well, the indirect spatially lagged indirect effect plays a role, which is positive and comparable across different types of regions.
Two main conclusions can be drawn from these results. First, different types of innovation have different types of impact across space. Technology-intensive innovation as patents has a positive impact only in highly urbanised regions, where demand is more sophisticated and organisations devoted to the creation of new knowledge are generally located (Duranton and Puga, 2001). Instead, the impact of trademarks, which represent also innovations, on average, less technology- and research-intensive, is pervasive and evenly distributed across space. Second, our results confirm the relevance of spillover effects, especially in less urbanised regions.
An important and possibly substantial concern regards the risk that the observed positive association between innovation and individual wellbeing is affected by the omission of variables, in particular, unobservable individual characteristics explaining both individual creativity and regional innovation, and life satisfaction, as remarked by Dolan and Metcalfe (2012).
While this cannot be excluded on purely theoretical grounds, our empirical framework differs from the one presented by Dolan and Metcalfe (2012) in which both innovation and wellbeing are measured at the individual level. In the present context, instead, we measure innovation at the regional level. Unless one assumes that one single individual is responsible for the entire innovative capacity of the region in which s/he resides, the concern about reverse causality expressed by Dolan and Metcalfe (2012) is certainly weakened. 19 Nonetheless, in order to address this issue, we adopted a two-step strategy. First, we lagged the innovation variables with respect to the dependent one. As the results reported above show, our conclusions seem rather robust to this control. Second, we excluded from the analysis innovation-prone individuals (those for whom the innovation propensity variable takes value 1 and those individuals that by occupation are more likely to develop innovations in their professional activity and, thus, to contribute more to the regional innovation intensity). The Eurobarometer survey, in fact, provides details about the type of occupation of the respondent. In particular, we excluded professionals, self-employed, owner/partner of a company, general and middle managers, skilled manual workers, flagged as individuals employed in creative occupations and retained only farmers, fishermen, employed unskilled manual workers. Based on this subsample, Tables 4 and 5 report the same set of estimates of Tables 2 and 3 for patents and trademarks, separately. Our results are confirmed and, on balance, we can reasonably conclude that they are sufficiently robust.
The impact of patents and their spatial lag on wellbeing across space – innovation-prone individuals and/or in creative occupations excluded.
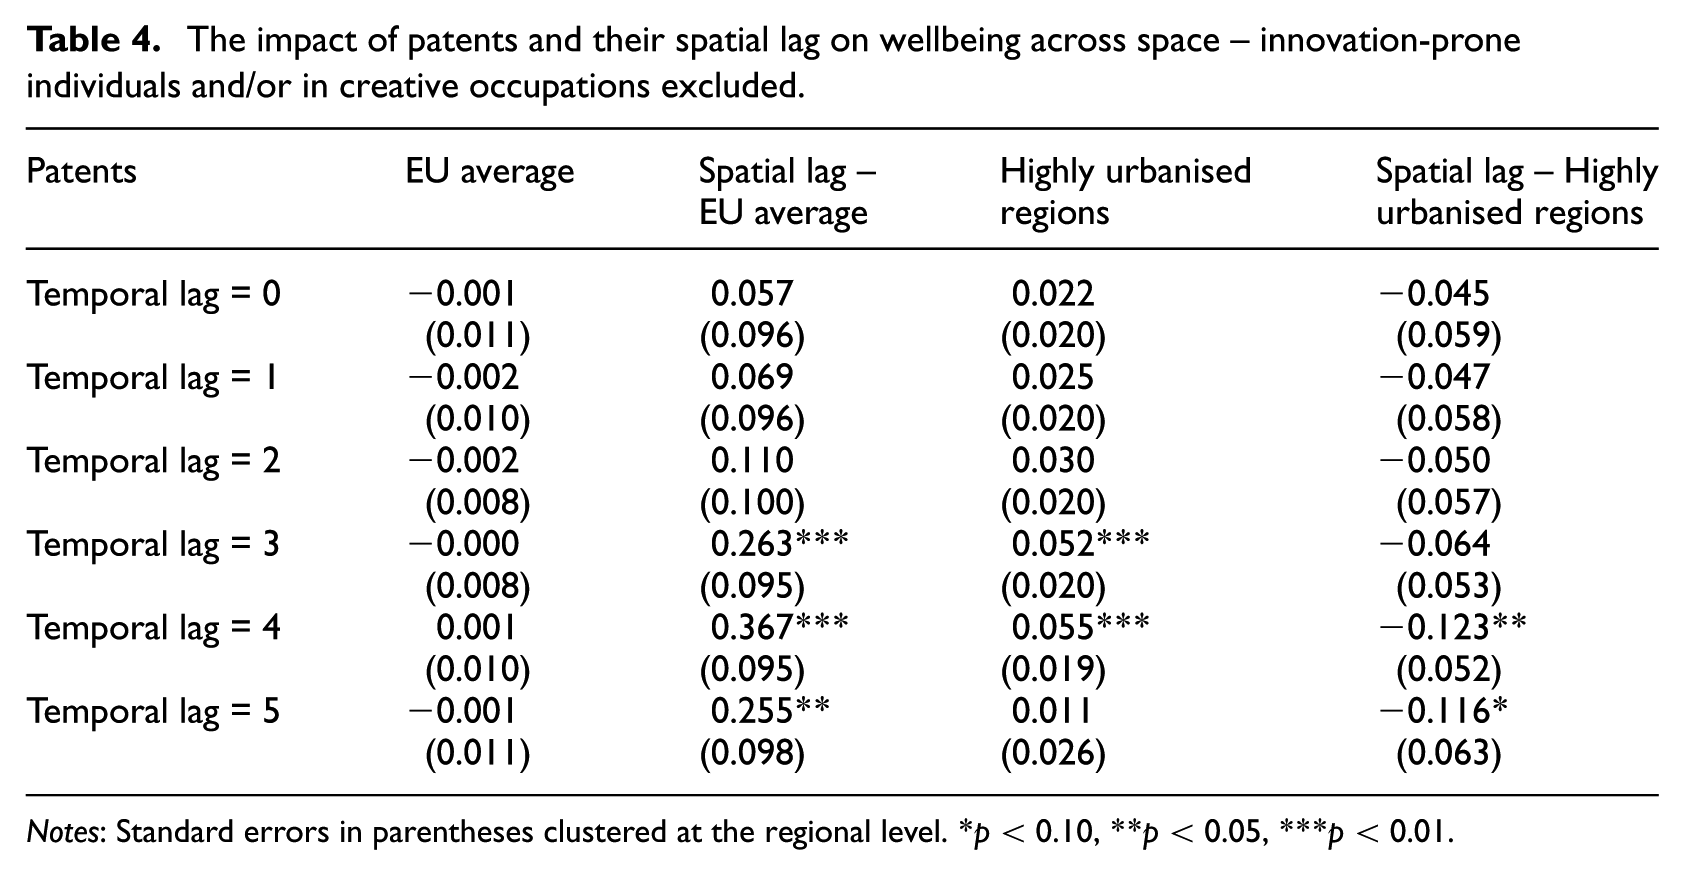
Notes: Standard errors in parentheses clustered at the regional level. *p < 0.10, **p < 0.05, ***p < 0.01.
The impact of trademarks and their spatial lag on wellbeing across space – innovation-prone individuals and/or in creative occupations excluded.
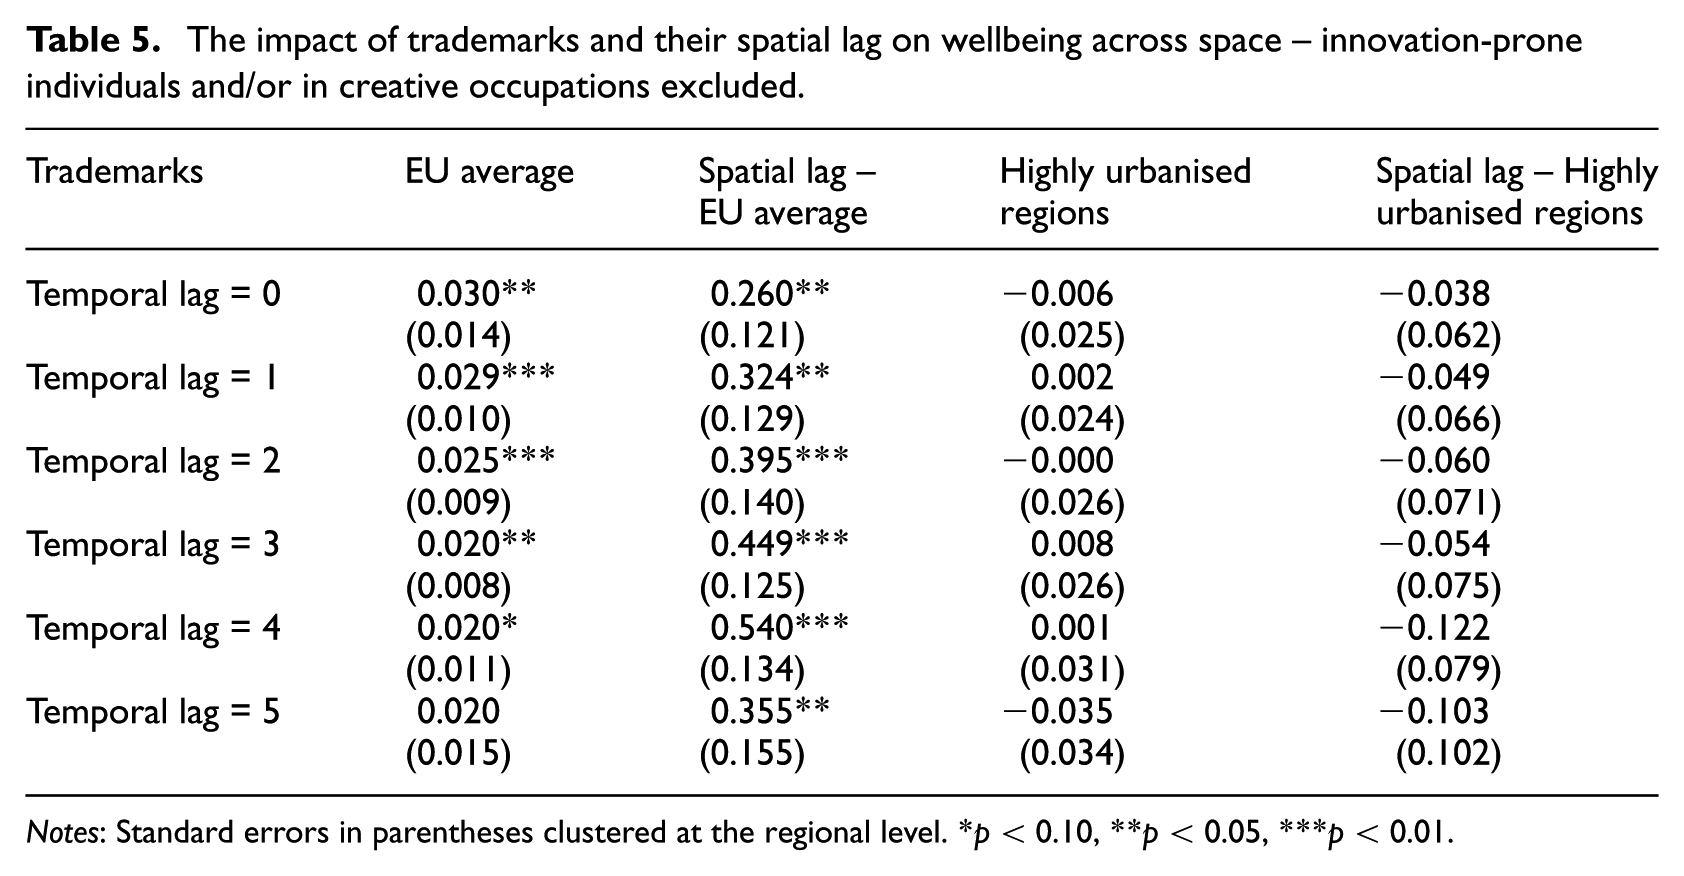
Notes: Standard errors in parentheses clustered at the regional level. *p < 0.10, **p < 0.05, ***p < 0.01.
Conclusions and policy implications
The paper has explored the relationship between innovation and individual wellbeing by considering different types of innovation measures characterised by different levels of technological intensity (i.e. patents and trademarks), and different spatial settings.
The results indicate that when focusing on the regional level of analysis, different types of innovation may play a different role in different spatial contexts: more technology-intensive innovations impact on wellbeing only in highly urbanised areas, whereas less technology-intensive innovations are associated with greater individual wellbeing in all settings.
The interpretation of these results is linked to the different natures of the two types of innovation. In order to make technology-intensive innovation impact on wellbeing, there is need for a more sophisticated demand, more open to radical innovations, and, possibly, a certain scale to conduct research activities efficiently. These conditions primarily obtain in more urbanised areas. Differently, less technology-intensive innovations (being to a great extent closer to the commercialisation stage) are, on average, more easy to be appreciated by market demand, less radical, and, possibly, do not require a substantial scale for their creation.
These findings do not simply add to the rich literature on the factors associated with individual wellbeing by expanding the scant empirical evidence on the link between innovation and wellbeing. More importantly, the paper offers some indications for the conceptualisation and measurement of innovation across space. Regions in which research and technology-intensive activities are poor, are generally characterised as innovation-weak areas. Yet, there can be alternative measures to grasp the innovation potential in these types of area. The measurement of less formalised/technology-intensive innovation (such as that captured through trademarks) can be a promising way to account for innovative capabilities in settings with a lower endowment of knowledge and technology.
This conclusion also has some policy implications, applicable especially to the European context and of relevance especially at the regional level. In fact, to the extent that wellbeing at the regional level is considered a proxy for the quality of life of people residing in an area, imbalances in wellbeing among people and places can also be interpreted in terms of inclusiveness (or, in the EU jargon, ‘cohesion’). In particular, the results of the paper enhance understanding of the extent to which competitiveness-led growth strategies centred on innovation promotion and implemented by firms as well as cities, regions and countries, are (or are not) matched by a wide distribution and sharing (across the society at large) of the fruits, rewards and opportunities stemming from innovation. In the former case, competitiveness (i.e. smart growth) strategies would have potentially important and positive implications also for inclusiveness understood as an improvement of people’s quality of life and wellbeing. In the latter case, if innovation benefits actually accrue only to specific places, the pursuit of the competitiveness goal would come at the expense of other social objectives (Fagerberg et al., 2013). This perspective is especially important from a spatial viewpoint. The trade-off between competitiveness versus inclusiveness strategies and policies (even if with changing vocabulary over time) has always been at the core of regional science investigations (Barca et al., 2012). Despite increasing globalisation trends and some anecdotal evidence on the word’s economic ‘flatness’, in fact, the academic debate has firmly supported the view of an increasing importance of space in the current economic landscape (Rodríguez-Pose and Crescenzi, 2008b). Indeed, spatial imbalances have not reduced and, consequently, have become central in the policy debate, especially in advanced economies (Barca et al., 2012; McCann, 2008).
In this regard, the results of the paper seem to indicate that the type of innovation targeted by innovation-centred competitiveness strategies may play an important role when policies are conceived, designed and implemented at the regional level; in fact, different types of innovation will deliver different effects on people’s wellbeing across space. Indeed, the paper shows that density/scale effects generally associated with more research and technology-intensive innovative activities (Charlot et al., 2014) cannot or hardly arise in regions characterised by a relatively low endowment of formal knowledge and technology. Targeting these types of innovation (technology- and research-intensive activities and outputs, such as patents) as the chief drivers of competitiveness and smart strategies (i.e. regional innovation policies), while correct at the national level, may be misleading as a generalised regional policy goal. In fact, these policies are likely to generate unbalanced effects across space and to provide the expected positive returns on wellbeing only in some areas. In this case, the achievement of the competitiveness goal may come at the cost of the achievement of the inclusiveness goal (i.e. harmonisation of wellbeing across people and space). These conclusions are indeed consistent with some recent papers highlighting the disconnection between the increasing cumulative and collective nature of the innovation process, on the one hand, and the increasing concentration of the rewards stemming from innovation, on the other (Lazonick and Mazzucato, 2013). In fact, there is some evidence that a small body of innovators are able to reap the gains from innovation relative to others, making innovation leading to inequality (especially in terms of wages and earnings) rather than to generalised wellbeing (Breau et al., 2014; Florida and Mellander, 2016; Lee and Rodríguez-Pose, 2013, 2016).
On the other hand, there are opportunities to make the best of the local innovative potential also in areas otherwise dismissed as non-innovative; in particular, less formalised innovation can be a channel through which to introduce novelties on the market that, in the end, may improve people’s wellbeing. Targeting these types of innovation as the chief drivers of competitiveness and smart strategies is likely to create more balanced effects across space and, possibly, to achieve a match between the competitiveness and inclusiveness goals, as recommended in the current European regional policy debate (Barca et al., 2012). The interplay between innovation, wellbeing and inequality represent an interesting and promising research avenue on which the present paper has provided preliminary evidence. We hope to extend our future studies in this direction.
Footnotes
Appendix
The impact of trademarks and their spatial and temporal lags on wellbeing across space: full specification.

|
|
||||||
|---|---|---|---|---|---|---|
|
|
0 | 1 | 2 | 3 | 4 | 5 |
| Age | −0.012*** | −0.012*** | −0.012*** | −0.012*** | −0.013*** | −0.013*** |
| (0.001) | (0.001) | (0.001) | (0.001) | (0.001) | (0.001) | |
| Age2 | 0.000*** | 0.000*** | 0.000*** | 0.000*** | 0.000*** | 0.000*** |
| (0.000) | (0.000) | (0.000) | (0.000) | (0.000) | (0.000) | |
| Woman | 0.011*** | 0.011*** | 0.011*** | 0.011*** | 0.013*** | 0.016*** |
| (0.003) | (0.003) | (0.003) | (0.003) | (0.003) | (0.004) | |
| Employed | 0.103*** | 0.103*** | 0.103*** | 0.103*** | 0.112*** | 0.120*** |
| (0.005) | (0.005) | (0.005) | (0.005) | (0.006) | (0.007) | |
| Self-employed | 0.107*** | 0.107*** | 0.107*** | 0.107*** | 0.115*** | 0.124*** |
| (0.016) | (0.016) | (0.016) | (0.016) | (0.016) | (0.015) | |
| Student | 0.107*** | 0.107*** | 0.107*** | 0.107*** | 0.113*** | 0.128*** |
| (0.009) | (0.009) | (0.009) | (0.009) | (0.010) | (0.013) | |
| Medium degree of education | 0.010 | 0.010 | 0.010 | 0.010 | 0.010 | 0.009 |
| (0.008) | (0.008) | (0.008) | (0.008) | (0.008) | (0.010) | |
| High degree of education | 0.076*** | 0.076*** | 0.076*** | 0.076*** | 0.078*** | 0.081*** |
| (0.009) | (0.009) | (0.009) | (0.009) | (0.010) | (0.011) | |
| Married | 0.058*** | 0.058*** | 0.058*** | 0.058*** | 0.057*** | 0.057*** |
| (0.004) | (0.004) | (0.004) | (0.004) | (0.005) | (0.006) | |
| Divorced | −0.069*** | −0.069*** | −0.068*** | −0.068*** | −0.069*** | −0.070*** |
| (0.006) | (0.006) | (0.006) | (0.006) | (0.007) | (0.008) | |
| Widow | −0.046*** | −0.046*** | −0.045*** | −0.045*** | −0.039*** | −0.028*** |
| (0.006) | (0.006) | (0.006) | (0.006) | (0.007) | (0.008) | |
| Number of children in the household (< 10 years old) | −0.001 | −0.001 | −0.001 | −0.001 | 0.000 | 0.000 |
| (0.002) | (0.002) | (0.002) | (0.002) | (0.002) | (0.003) | |
| Apartment ownership | 0.057*** | 0.057*** | 0.057*** | 0.057*** | 0.062*** | 0.064*** |
| (0.005) | (0.005) | (0.005) | (0.005) | (0.006) | (0.006) | |
| Innovation propensity | 0.020*** | 0.020*** | 0.020*** | 0.020*** | 0.018*** | 0.017*** |
| (0.004) | (0.004) | (0.004) | (0.004) | (0.004) | (0.006) | |
| Per capita GDP | 0.002 | 0.002 | 0.002 | 0.003* | 0.003* | 0.004** |
| (0.001) | (0.001) | (0.001) | (0.001) | (0.002) | (0.002) | |
| Per capita GDP2 | −0.000** | −0.000** | −0.000* | −0.000** | −0.000** | −0.000** |
| (0.000) | (0.000) | (0.000) | (0.000) | (0.000) | (0.000) | |
| Highly urbanised regions | 0.010 | 0.010 | 0.011 | 0.007 | 0.019 | 0.014 |
| (0.016) | (0.015) | (0.015) | (0.013) | (0.014) | (0.015) | |
| Innovation (trademarks) | 0.023 | 0.024** | 0.021** | 0.019** | 0.013 | 0.019 |
| (0.014) | (0.010) | (0.009) | (0.008) | (0.011) | (0.016) | |
| Innovation (trademarks) spatial lag | 0.257** | 0.314** | 0.375*** | 0.448*** | 0.480*** | 0.316** |
| (0.115) | (0.123) | (0.132) | (0.120) | (0.125) | (0.150) | |
| Innovation (trademarks) × Highly urbanised regions | −0.020 | −0.016 | −0.017 | −0.007 | −0.009 | −0.056* |
| (0.024) | (0.024) | (0.024) | (0.025) | (0.029) | (0.031) | |
| Innovation (trademarks) spatial lag × Highly urbanised regions | −0.020 | −0.025 | −0.031 | −0.024 | −0.080 | −0.007 |
| (0.058) | (0.062) | (0.068) | (0.079) | (0.088) | (0.118) | |
| Constant | 1.027*** | 0.670*** | 0.670*** | 0.668*** | 1.037*** | 0.600*** |
| (0.044) | (0.029) | (0.029) | (0.029) | (0.063) | (0.033) | |
| Country and year dummies | YES | YES | YES | YES | YES | YES |
| R 2 | 0.19 | 0.19 | 0.19 | 0.19 | 0.20 | 0.21 |
Notes: Standard errors in parentheses clustered at the regional level. *p < 0.10, **p < 0.05, ***p < 0.01. Reference categories: male; unemployed; single. Number of observations: 163,198.
Declaration of conflicting interests
The author(s) declared no potential conflicts of interest with respect to the research, authorship, and/or publication of this article.
Funding
The author(s) received no financial support for the research, authorship, and/or publication of this article.