




Abstract
Urban growth is typically considered a process of expansion. As population grows and transport costs decrease urban density gradients are expected to gradually flatten. This is a basic feature of cities, explained by urban economic models and empirically supported by a plethora of studies about urban density development from all over the world. However, additional forces, such as changes in demographic composition and locational preferences of the urban population acting at local levels, may counteract the flattening tendency of urban gradients. In this paper, we suggest a methodology to test the impact of local density changes on urban gradients, looking at spatio-temporal developments in terms of housing and population. Using highly detailed data on individual housing units and inhabitants in major Dutch cities, we first assess and compare urban density gradients during the period 2000–2017. In all the analysed Dutch cities, both dwelling and population density gradients are becoming steeper over time, contradicting standard predictions from urban economic literature and empirical reports worldwide. The observed trend of steepening urban gradients is partly explained by the presence of historical monuments and urban amenities.
Introduction
A key characteristic of urban structure is that cities have the highest densities in their centre, and these densities decrease with increasing distance from the centre. This notion is thoroughly embedded in classic economic literature (Alonso, 1964). Using a number of strong assumptions, the monocentric model predicts that population, built structure densities, as well as land and housing prices decay exponentially when measured as a function of radial distance from the city centre (Brueckner, 1987). A gradual lowering of transportation costs is expected to expand the city boundary and lower population densities at the centre (Mieszkowski and Mills, 1993; Wheaton, 1974). A flatter urban population density gradient will be observed as lower densities in the centre are complemented by increasing densities at the urban edge where urban dwellers can now afford to live (Bertaud, 2015). Developments at this edge differ in terms of development speed, density and fragmentation patterns but the basic urban structure remains: an historic and still-dominant urban centre, surrounded by an expanding urban area (Anas et al., 1998).
Changes in urban densities are also driven by demographic forces. This refers to population growth in general, but also to changes in household composition. In the last decades, the size of the average household is decreasing steadily all over the world (Liu et al., 2003) and particularly in Europe (Kabisch and Haase, 2011). One of the consequences of this trend is an increase in the land demand for housing, on top of the demand induced by population growth (Liu et al., 2003). Smaller households are one of the reasons why, even in places where population numbers are in decline, urban areas are still expanding (Haase et al., 2013).
The third force influencing urban densities dynamics is related to changes in locational dwelling preferences. Suburbanisation was a dominant process in the developed world for most of the 20th century. Recently, however, evidence has been found for a counter trend (Bromley et al., 2005; Tallon, 2013) termed reurbanisation (e.g. Kroll and Kabisch, 2012; van den Berg et al., 1982). This increase in population in the urban core is assumed to be housing-led (by construction of new dwellings, e.g. following urban planning initiatives) as well as population-led and driven by new dwellers (e.g. international workers, young adults) moving to urban centres (Rérat, 2019). Urban amenities seem to attract a new young urban population, seeking to be close to leisure and cultural facilities accessible by public transport (Thomas et al., 2015). In addition, different age groups tend to have different attitudes towards the urban centre, which seems to fuel spatial sorting processes among them (Thomas et al., 2015). This growing importance of urban amenities has received substantial attention in recent urban economic thinking, regarding the factors that make some cities more attractive than others (Glaeser and Gottlieb, 2006; Storper and Scott, 2009).
The interaction between these forces in a context of regional population growth can lead to different dynamic patterns of urban density gradients as shown in Figure 1. The standard prediction of the monocentric model is densification at the city edge (Figure 1b). However, specific conditions such as changes in demographic composition and locational preferences may also lead to urban densification and a steepening density gradient (Figure 1c). These stylised extremes are also present in the heterogeneity of actual urban development (Kroll and Kabisch, 2012).

Stylised patterns of urban density gradient dynamics with population growth. The initial situation (t0) shows lower densities with increasing distance from the centre (a). In t1 the gradient may flatten when development concentrates at the edges (b) or they may steepen when the centre receives most development (c).
The static features predicted by the monocentric model were observed even before its development through the seminal work of Clark (1951) on urban population density profiles, and confirmed repeatedly later (Alperovich, 1983; Bertaud and Malpezzi, 1999; De Borger, 1979; Harrison and Kain, 1974; Mills, 1970; Mills and Tan, 1980). Population density functions estimated for multicentric metropolitan areas demonstrate that the peak in the population density gradient is still observed in the main city centre (McDonald, 1989; Zheng, 1991).
Several empirical studies analyse the temporal dynamics of urban densities. Many of them focus on city average urban densities and show consistent declines in density over time (Angel et al., 2011; Salvati, 2013; Siedentop and Fina, 2012). These aggregate analyses of density change are not very informative about the spatial dynamics within cities and do not explicitly discuss changes in density gradients, let alone the dynamics of local densities. Research on urban density gradient dynamics is scarcer. Some examples relate to local-level analyses of land-cover change and thus ignore densities in housing units or population (Catalán et al., 2008), while others study gradients at a single point in time (Woo and Guldmann, 2011). There are only a few papers that analyse urban density gradient dynamics over time (Bunting et al., 2002, Filion et al., 2010; Kroll and Kabisch, 2012; Sridhar, 2007; Wang and Zhou, 1999). However, these papers use relatively coarse census tracks as units of observation, only describe changes in population density or only focus on single metropolitan areas or small samples of cities, instead of analysing differences between cities. So, while literature about aggregate urban densities and their economic drivers is abundant, local residential dynamics within existing urban areas have received far less attention. Only one previously cited paper about urban gradients offered a comparable methodology to test the impact of local density changes on urban gradients, simultaneously in terms of housing and population over time, in the sense depicted by Figure 1 (Kroll and Kabisch, 2012). However, none of them explicitly address the geographically localised economic drivers able to boost these local density changes.
This paper seeks to fill this void by analysing recent urban dynamics in the Netherlands using a time series spatially explicit analysis approach based on detailed residential units and residents’ data that allows us to analyse dwelling and population development dynamics within urban areas. The first objective is to test whether density gradients – reflecting structural dynamics in local urban development – are flattening over time, or whether a reverse trend can be observed. As a second objective, we aim to uncover the degree to which the presence of cultural heritage and related amenities may be a driving factor in this process. Historic built heritage is an important urban asset which is expected to increase the attractivity of city centres (Noonan, 2003; Ruijgrok, 2006). An historic and well-preserved city centre is supposed to constitute a valuable urban amenity (Lazrak et al., 2014).
The Netherlands makes an interesting case study as it is characterised by a large number of historic cities that offer many amenities to urban dwellers. Moreover, it is blessed with a relatively long time series of very detailed spatial data that allow for the reconstruction of changes in density gradients over more than a decade.
Using a sample of the larger historical Dutch cities, our first aim is to explore the validity of the decreasing urban density model as a framework for analysing the changes of urban structures over time. Subsequently, we quantify Dutch dwelling and population dynamics in terms of density gradients in the period 2000–2017. Finally, we assess the influence of cultural heritage and the presence of urban amenities on the observed dwelling density changes.
This paper is structured as follows: the next section describes the case study, data and methods used in the research. The third section presents the empirical results obtained in the analysis. The final section summarises and concludes with respect to the research questions.
Data and methods
Case study area
We use data for the 15 largest historic cities in the Netherlands in the year 2017 (CBS, 2018). These cities have more than 150,000 inhabitants and are historic in the sense that they were founded centuries ago and have a long history of urban development. In addition, they have been clearly separated entities for a long time, before the accelerated post-war urban development of the 20th century (Figure 2). Two cities trace their origin to the Roman era (Utrecht and Nijmegen). Others were already (regionally) important in the 15th century (Breda, Amersfoort, Arnhem and Groningen), or grew rapidly in the 16th and 17th centuries (Amsterdam, Rotterdam, Haarlem, The Hague and Zaanstad) or in the 19th and early 20th centuries following their industrialisation (Enschede, Tilburg, Apeldoorn and Eindhoven). Since we focus on historic cities, the new town of Almere that was appointed in the 1960s and 1970s to accommodate part of the post-war population growth was excluded from the analysis.
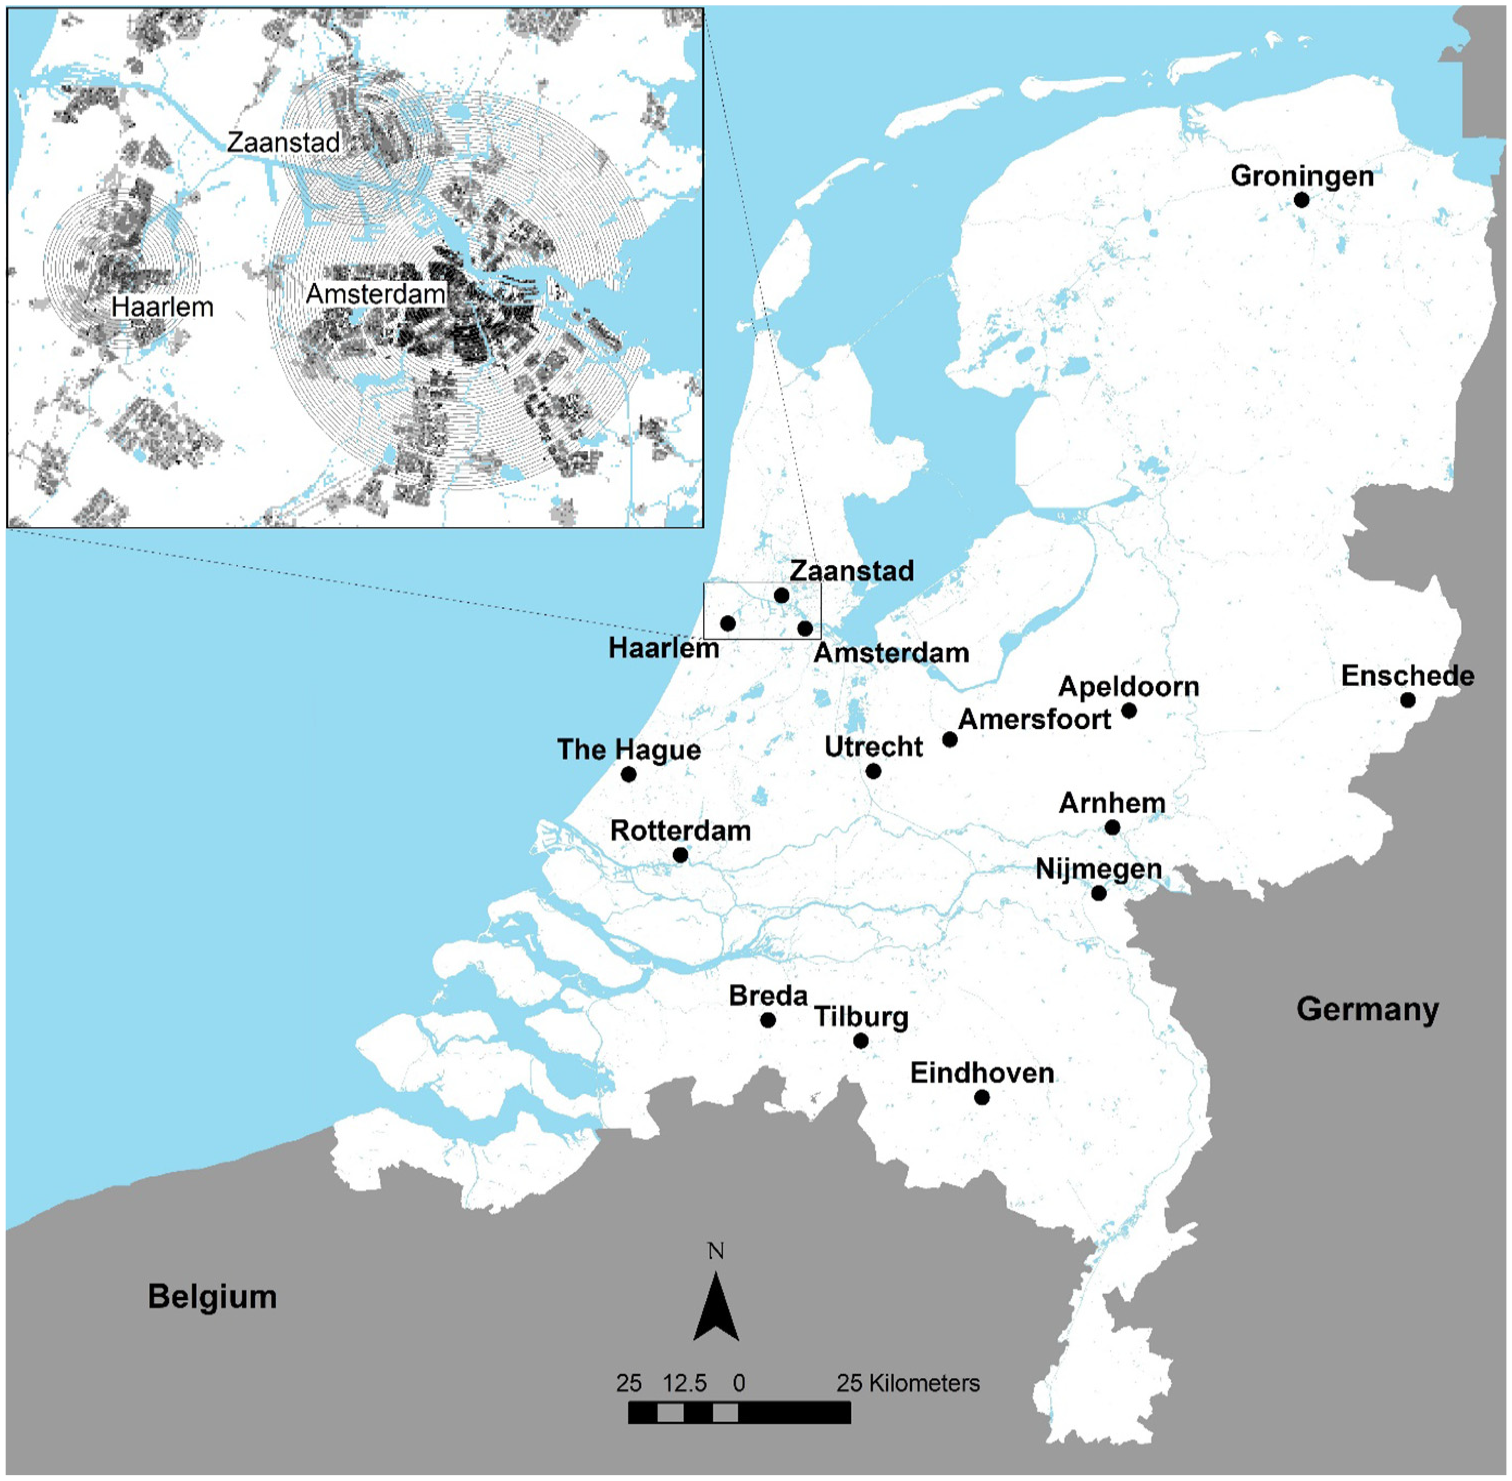
Location of the 15 largest Dutch historical cities and detail of concentric rings around Amsterdam and its neighbouring cities (shades of grey represent residential density).
Residential development is a relatively constant process in the Netherlands, with a yearly increase in housing stock of around 1% per year over the past 25 years (Broitman and Koomen, 2015a). Approximately 50% of the new urban housing units built during the period 2000–2010 were located within what were urban areas in 2000, increasing overall dwelling density. The remaining share was located in new urban extensions designated during the period 2000–2010 at some distance from city centres (Broitman and Koomen, 2015b). So, two urban development processes act simultaneously: densification and expansion. Both are influenced by the Dutch spatial planning tradition. Restrictions on greenfield development favour densification, while the designation of large-scale urban development plans allows for urban extensions (Koomen et al., 2008; Zonneveld and Evers, 2014). This research assesses the relative importance of these two processes by analysing whether density gradients steepen (reflecting an increased importance of the city centres) or flatten.
Data
The main data source for this research is a highly detailed data set provided by the Dutch Central Bureau of Statistics (CBS, 2017) that covers the full country in square cells of 100 m ×100 m describing, among others, the number of housing units and the number of inhabitants located in each cell for all years between 2000 and 2017. The housing units refer to individual, independent dwellings occupied by single or multi-person households. In the case of multifamily housing (e.g. apartment blocks), all individual housing units are counted. Differences in the size of the units are not accounted for. Values are rounded to the nearest multiple of five and can be zero when less than five housing units or inhabitants are present. This restriction is not an issue since we focus on urban areas where both the dwelling and the population density per hectare are much higher. The rounding may imply that very small changes may remain unnoticed but has the advantage that the impact of small measurement inconsistencies or errors is limited.
An additional data source used in this research is the digital database of national monuments and listed buildings (Rijksdienst voor het Cultureel Erfgoed (RCE), 2017). Each entry in this database is of national importance and has protected status. The database contains x, y coordinates and attribute information such as year of construction, type of structure, name and description. In order to make the monuments data set consistent with the population and dwelling data, we aggregated the monument locations for the 100-m cells counting the number of individual objects. A similar procedure was performed with a geocoded database with the locations of urban amenities such as restaurants, shops and leisure facilities for the year 2006.
Data about urban land prices in Euro per square metre were also included in this study. These data are derived from an extensive set of real estate transactions that was provided by the Dutch Association of Real Estate Brokers (NVM), for the period 1985–2011. The raw data set was brought to real (2011) prices by using the price deflator of Statistics Netherlands (CPI, Consumer Price Index). Following the procedure described in De Groot et al. (2010), house prices for the years 2000 and 2011 were obtained. 1 Each square cell is given the land value in euro/m2 of the postcode area to which it belongs.
All spatial variables are converted into 100 m × 100 m grid cells covering the whole country that exactly match the size and location of the CBS data representing the number of housing units and inhabitants.
Analysis
Following the extensive literature on the importance of amenities and cultural heritage in attracting new residents to the city, we specifically assess their importance in explaining part of the observed intensification. The centre of the city is defined as the historic foundation point of the city, or – in case this was unknown – the location of the city hall (Bertaud and Malpezzi, 1999; Lemoy and Caruso, 2018). Afterwards, we defined successive concentric rings at regular intervals of 200 m around the historical city centre. For Amsterdam, the largest city in our sample, a maximum distance of 10 km was defined because this is large enough to encompass its contiguous urban areas. For the remaining (smaller) cities, we build on the recently developed homothetic urban scale concept (Lemoy and Caruso, 2018) to define appropriately sized distance ranges. Based on the population of Amsterdam, we used the surface scaling law for the radial function to calculate the maximum radius for each city, shown in Table 1.
Dwelling exponential density gradient in the main Dutch cities in 2000, 2017 and differences between 2000 and 2017 as function of distance from the centre. The estimated exponential function is Dwelling Density

Notes: *Indicates a two-tailed 0.1 significance level; **indicates a two-tailed 0.05 significance level; ***indicates a two-tailed 0.01 significance level.
Following Lemoy and Caruso (2018) we rescale the maximal distances from the city centres using the expression
For all 200-m-wide rings in the sampled cities, the average dwelling, population, monument and amenities density are defined as ring-based aggregation of housing units (inhabitants, etc.), divided by the ring total area. The average dwelling and population for each ring was calculated once for 2000 and once for 2017. Land values for each ring were calculated averaging the land value attached to every cell that belongs to the ring. This procedure was performed for both 2000 and 2011. The spatial analysis was carried out in a standard desktop GIS environment (ArcMap 10.x).
Empirical results
Density gradient assessment
The first step in the analysis is to test whether our hypothesis that dwelling densities decrease with increasing distance from the centre correctly describes the functional structure of the 15 largest Dutch cities. Following Clark (1951) we regressed dwelling density (number of housing units per hectare), and population density (inhabitants per hectare) on distance from the centre in hundreds of metres (d), using an exponential function of type
As expected, the tested regressions show a negative slope: a decrease in density from the city centre outwards. The estimated parameters are significant and the explanatory power of the models is high. This does not imply that these cities are strictly monocentric, as is visually evident in Figure 2 for the case of Amsterdam. But the results confirm that for all the 15 cities sampled, including the largest Dutch cities, the highest densities are located near their centre, and these decrease with increasing distance from it, as their dwelling and population density gradients testify.
Density gradient dynamics
Using the approach described in the previous section, dwelling and population exponential density gradients for the initial year of the studied period (2000) were calculated and compared with the 2017 results. Figure 3 shows the differences observed in all the samples between 2000 and 2017 and illustrates the urban dynamics of the cities at a more aggregate level. Dwelling densities increased almost everywhere during the analysed period (Figure 3, upper-left), while population densities increased in the majority of the samples (Figure 3, upper-centre). As dwelling density grew faster than population density, the resulting household sizes (population divided by the number of housing units in each ring) are smaller (Figure 3, upper-right). These dynamics are noticeable in particular near the city centres, where dwelling density increases more than population density.
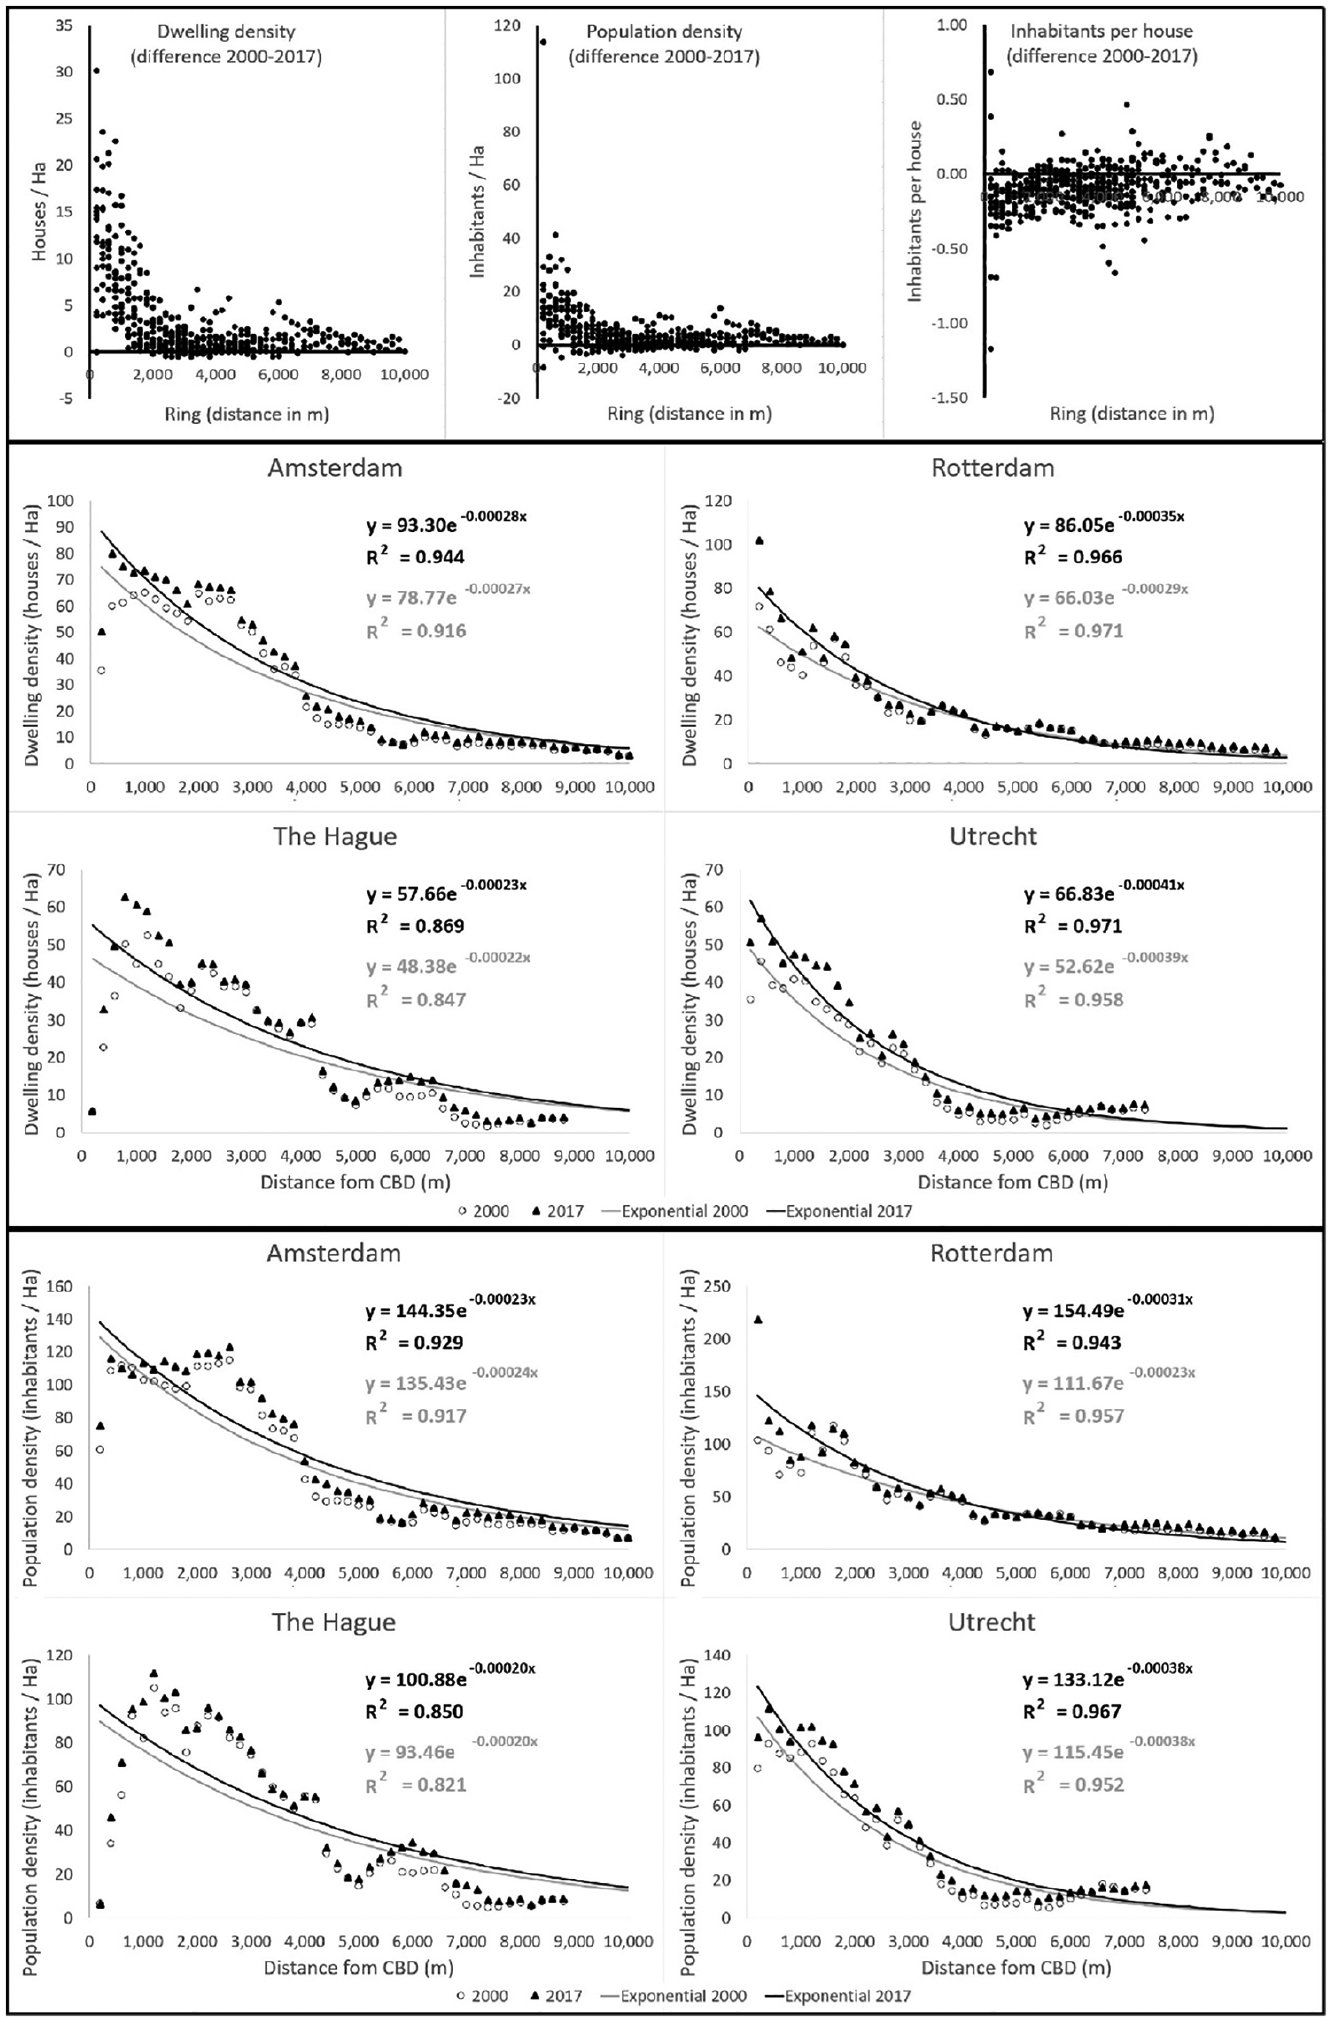
Differences for the whole ring sample between 2000 and 2017 in terms of residential density, population density and household size (upper-left, centre and right, respectively), exponential residential density gradients for selected cities (centre) and exponential population density gradients for selected cities (bottom). Since the gradients are negative, they increase when their absolute value is larger. For example, the exponent of the dwelling density gradient in Amsterdam in 2000 was −0.00027. In 2017 it was −0.00028.
Contrary to our initial expectations, dwelling density gradients clearly increase over time in the central cores of the four major Dutch cities. To systematically analyse the changes in dwelling and population density gradients between 2000 and 2017, we estimate the influence of the distance from the centre on both density changes in the period 2000–2017 again fitting exponential functions, as summarised in Table 1.
A larger exponent (in absolute value) in dwelling or population exponential density function implies that the gradient for that city has steepened during the studied period. Therefore, according to the results shown in Table 1 (column 11), in all historical Dutch city centres the dwelling density exponent is steeper in 2017 than it was in 2000, and this exponent increase is statistically significant. Regarding population density exponent, in 14 out of 15 cities it is significantly steeper in 2017 compared with 2000. In The Hague the population exponent also increased during the studied period, but the coefficient is not significant (Appendix A). The main conclusion of the analysis is that the densification rate of the city centres is higher than the densification of their outskirts. It seems that, to a certain extent, centripetal locational preference changes are superseding the centrifugal forces, following the scenario (c) sketched in Figure 1.
Cultural heritage, urban amenities and densification
To better understand why density gradients are steepening, we set up a regression analysis that studied the importance of several spatial factors that are generally considered to attract residential development. In this statistical analysis, we focus on the increase in housing units as that provides a more unequivocal representation of the densification process than the change in population (inhabitants/ha) density, which is also dependent on socio-demographic trends resulting in changing household size. Unlike the previous analysis, we combine the ring data of all the cities as the number of observations (individual rings) is too low to allow multivariate regression at the individual city level. Therefore, we analyse the average change in housing unit density for our complete sample of 15 largest historical Dutch cities as a function of distance from the centre and a number of additional spatially explicit driving factors. Since the main urban railway stations in Dutch cities are usually located near the city’s centre, the presence of public transport infrastructures is implicitly included in the distance from the centre (explicit introduction of the distance to main railway stations is not possible because of collinearity).
A generally acknowledged factor for attracting urban development is the presence of historical and cultural heritage sites. Well-managed historical assets in urban areas can contribute to urban growth and community sustainability goals (Widener, 2015). Historical and cultural heritage values in urban areas can have a positive influence on the valuation of houses located nearby (Lazrak et al., 2014) and are documented to attract certain types of households, in particular high-income groups (van Duijn and Rouwendal, 2013). The preservation of historic buildings is advocated as a potential driver for urban regeneration (Ryberg-Webster and Kinahan, 2014), while conservation of built heritage and urban development can coexist and support each other (Amit-Cohen, 2005; Short, 2007).
The location of urban amenities is another important factor in urban development (Hoehn et al., 2006; Wang and Wu, 2011; Nilsson, 2014). Monument and amenity densities per ring are, however, highly and positively correlated in our case (Pearson correlation coefficient = 0.699, p < 0.01). This correlation is not surprising for the lively, historic cities of the Netherlands and we explore this duality using two different statistical models.
In addition, we add several control variables to the analysis. From the classic urban economic literature, we know that land prices have a strong relationship with density gradients. We assume high land prices provide an incentive for urban densification in the long run, although many factors (availability of transformable space, legal and planning restrictions, etc.) may delay, limit or even prevent such developments. We use the land values in the period 2000–2011 to test how they have influenced urban densification. In order to capture employment availability considerations, we assigned to each ring the average distance to reach 100,000 jobs.
Planning and regulatory constraints also influence the degree of urban densification (Broitman and Koomen, 2015b). In order to account for this type of influence we calculate the quantity of non-urban land without specific restrictions on urban development in each ring. Each plot of agricultural land in 2000 which is not defined as part of a nature reserve or buffer zone is defined as potentially available for residential development. This aspect is included in the analysis as the share of available land as part of the total surface area of each ring.
Furthermore, we defined several variables related to population density and age structure for 2000, 2017 and the difference between both years. For example, the average number of inhabitants per dwelling unit, the percentage of different age groups within the population, etc. However, these variables did not yield significant results in our analysis and are not included in the statistical models.
Table 2 shows the descriptive statistics of all variables included in the statistical models.
Descriptive statistics of the variables used in the statistical analysis (N = 466).

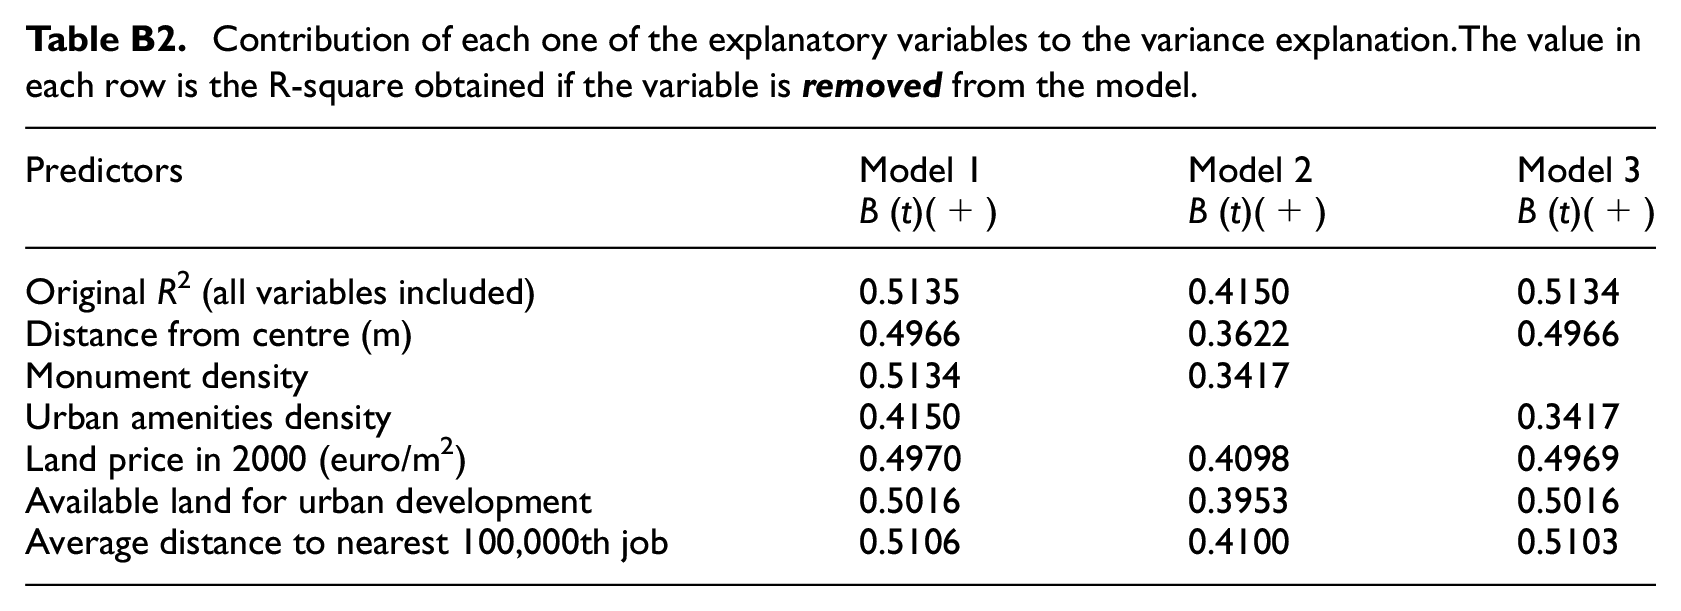
In the three estimated models, reported in Table 3, the dwelling density change per ring in all cities is the dependent variable. The monument and urban amenity density are used together in Model 1, while Model 2 uses only monument density and Model 3 only urban amenities density.
Estimation results for the models explaining dwelling density change in all 15 cities.
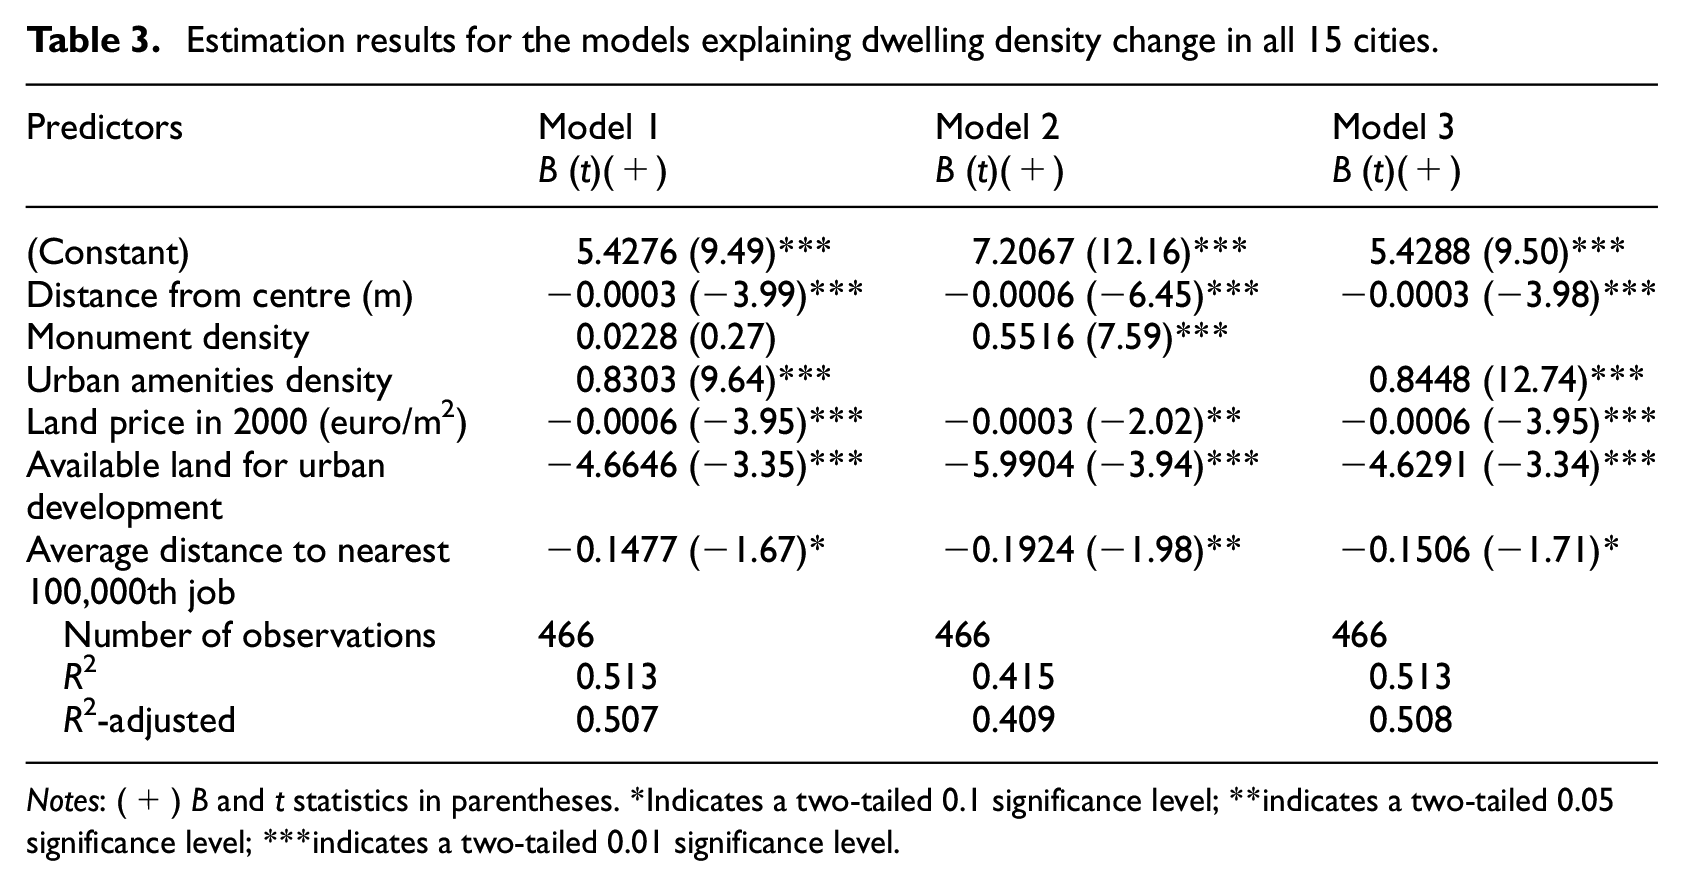
Notes: (+) B and t statistics in parentheses. *Indicates a two-tailed 0.1 significance level; **indicates a two-tailed 0.05 significance level; ***indicates a two-tailed 0.01 significance level.
The explanatory power of Models 1 and 3 is quite similar (R2 around 0.513), better than that of Model 2 (R2 around 0.415). The distance from the centre is a significant and negatively correlated variable as expected, confirming that considering all cities, the dwelling density gradient is steeper in 2017 than in 2000. Because of the previously reported correlation between monuments and urban amenities density, the model that includes both variables seems unreliable: monument density is not significant and has an unexpected sign. Taken separately (in Models 2 and 3), the impact of both variables on dwelling density is positive and highly significant (p < 0.01) but is stronger for urban amenities as reflected in the larger coefficient and slightly higher R2. Although urban amenities are clearly associated with the presence of a historic centre that may attract residents and visitors, the results suggest that amenities have a more direct impact on densification than monuments. The other explanatory variables are significant and their impact on dwelling density changes during the studied period are stable in all three models. Higher land prices in 2000 are associated with a significant, lower than average increase in dwelling density in all models. The regression results suggest that the most attractive locations (for which residents are willing to pay higher prices) are already dense, and therefore it is more difficult for the supply to respond to an increase in housing demand.
Available land for development is negatively and significantly associated with dwelling densification in all models (so linked to relatively low values for densification). We interpret this as a sign that land available for urban development is usually filled with relatively low densities. Finally, urbanites value accessibility to jobs since this parameter is negatively and significantly associated with densification: larger distances imply lower densities.
In order to test the robustness of the results, we performed several sensitivity analyses (Appendix B). We also tested the impact of the size of the rings and selected time periods, using a ring width of 400 m (instead of 200 m) and splitting the studied period into two intermediate ones (2000–2012 and 2012–2017). All the sensitivity analyses confirmed the general trend of steepening urban gradients.
Conclusions and discussion
Results
In this paper we analyse urban density development in the 15 largest historical cities in the Netherlands between 2000 and 2017 in order to test how density gradients are developing and which factors contribute to these developments. Unlike what is generally reported about world cities, the density in most Dutch cities, particularly in their centres, is increasing. In contrast with the observed (and expected) density gradients elsewhere, density gradients in most Dutch cities are becoming steeper, instead of flatter. In addition, household size in the studied cities is decreasing, indicative of the general trend of smaller households and possibly also the attractiveness of urban cores for smaller households.
A typical feature of historic cities is that the historical centre is typically a large square surrounded by many public or commercial buildings. In such places, the number of housing units located within the first several hundreds of metres around the centre is usually low, causing a central density crater (Newling, 1969). Despite this phenomenon, the density gradients are still negative and significant as shown in Table 1.
Reurbanisation and the revival of urban centres
In recent years, evidence of the renewed attraction of urban centres, at least for certain population groups, was reported (Thomas et al., 2015; Wolff et al., 2018) along with trends of urban regeneration coinciding with ongoing suburbanisation processes (Tallon, 2013; Tallon and Bromley, 2004). Cultural heritage and urban amenities are described as important driving factors for this revival of urban centres (Glaeser and Gottlieb, 2006; Storper and Scott, 2009) as they especially attract young professionals typically without children (Thomas et al., 2015). Our spatial analysis results show that the historical and amenity-rich city centres in the Netherlands are indeed focal points of dwelling intensification. This provides local, empirical evidence for the growing urban economic literature on the importance of urban amenities.
The observed developments in the Netherlands are in line with inner-city developments recently observed in some other European cities (Haase et al., 2013; Rérat, 2012), and with the importance of urban cultural amenities in modern cities (Clark et al., 2002; Backman and Nilsson, 2018). Interestingly, we find evidence for densification of the urban core in all large historic cities in the Netherlands, suggesting more uniform developments (leading to increasing urban density gradients) in that country than demonstrated for the four German cities analysed by Kroll and Kabisch (2012). This research thus lends credence to the hypothesis for the return of cities put forward by Rérat (2019) and makes a start on studying the geography of reurbanisation advocated in his research agenda. It provides a more detailed, spatial perspective on the local drivers for densification than current research that typically analyses growth at the city level (e.g. Turok and Mykhnenko, 2007), indicating that in the Dutch case the amenity-rich centres of cities grow faster than their outskirts. The simultaneous increase in dwelling density and decrease in the number of inhabitants per household we find is in line with the hypothesis that predominantly young professionals without children are returning to Dutch city centres (Folmer, 2014). The importance of high-income individuals and relatively young couples without children who are willing to pay a premium for small but well-located apartments in city centres is evidenced in recent housing market research (Bartholomae et al., 2016; Kodrzycki and Muñoz, 2015) and residential preferences studies (Ogden and Hall, 2000; Thomas et al., 2015). Recent research about the economic development of historical cities emphasises the synergy between the quality of historical heritage and the development of urban amenities nearby (Lanzara and Minerva, 2018; Wang et al., 2019). Some of the studied cities also receive large numbers of tourists through home-sharing initiatives such as Airbnb that are thought to displace residents as they limit the supply of affordable housing (Ferreri and Sanyal, 2018). While this may have been an important effect in some cities’ centres in most recent years (most notably Amsterdam), this is unlikely to have been influential in most cities and during the complete study period.
Relevance for urban planning
Our findings also bear relevance for urban planning. High density urban patterns have several advantages related to, for example, more effective land use (Dieleman and Wegener, 2004) and transport sustainability (Kenworthy and Laube, 1996), giving rise to compact city planning initiatives around the globe (Rode, 2018). The Dutch planning system is often described as being relatively strict and successful in steering urban development (Alterman, 1997; Faludi and Van Der Valk, 1994; Koomen and Dekkers, 2013; Koomen et al., 2008). Further enhancing the attraction of urban centres may help create denser and thus more compact cities, partially reducing the need for exurban development. However, since urban densification processes coexist with urban expansion (Broitman and Koomen, 2015b), only a certain degree of compact urban development can be achieved. This is not necessarily a problem, since different types of people may prefer different urban qualities. Increasing urban centre densities can create a larger diversity in available urban environments, that can fit the tastes, preferences and willingness to pay of different population groups (Bayer and McMillan, 2012).
In addition, the centres of the larger Dutch cities attract an increasingly international crowd of expat workers and tourists. Especially the impact of the latter on the residential market is a topic of heated debate in Dutch cities such as Amsterdam, but also in many other popular tourist destinations in Europe and beyond (Pinkster and Boterman, 2017). The rise of short-term rent for the tourist sector may be an incentive to subdivide existing apartments, further increasing the dwelling density in the area (Guttentag, 2015; Oskam and Boswijk, 2016). Regardless of the specific identity of the population flowing to city centres, the existence of historical monuments and cultural heritage sites seems a more powerful magnet than ever to attract (temporary) residents to the centres of Dutch cities.
Concluding remarks
The methodology described in this paper bridges different scale levels in urban analysis. The effects of micro-level local generators of attraction, such as monuments, historic sites and amenities, are measured through local density changes. These local changes, in turn, are aggregated in concentric rings, creating a meso-level of density dynamics dependent on the distance to the city centre. Finally, we assess the effects of the meso-level densities on a major macro-level feature of the city, as its urban density gradients. As such, the methodology can potentially be used for assessments of the long-term impacts of changes in location preferences or local development plans, on the wider urban structure. This methodology strongly benefited from the increased availability of detailed geographical data, both about physical structures and human behaviour in the urban arena. As this availability is likely to increase further in the future, we foresee many more applications of such multiscale-level analysis to unravel the drivers of urban dynamics.
Footnotes
Appendix A: Exponential population densities
Population exponential density gradient in the main Dutch cities in 2000, 2017 and differences between 2000 and 2017 as function of distance from the centre. The estimated exponential function is Population_Density
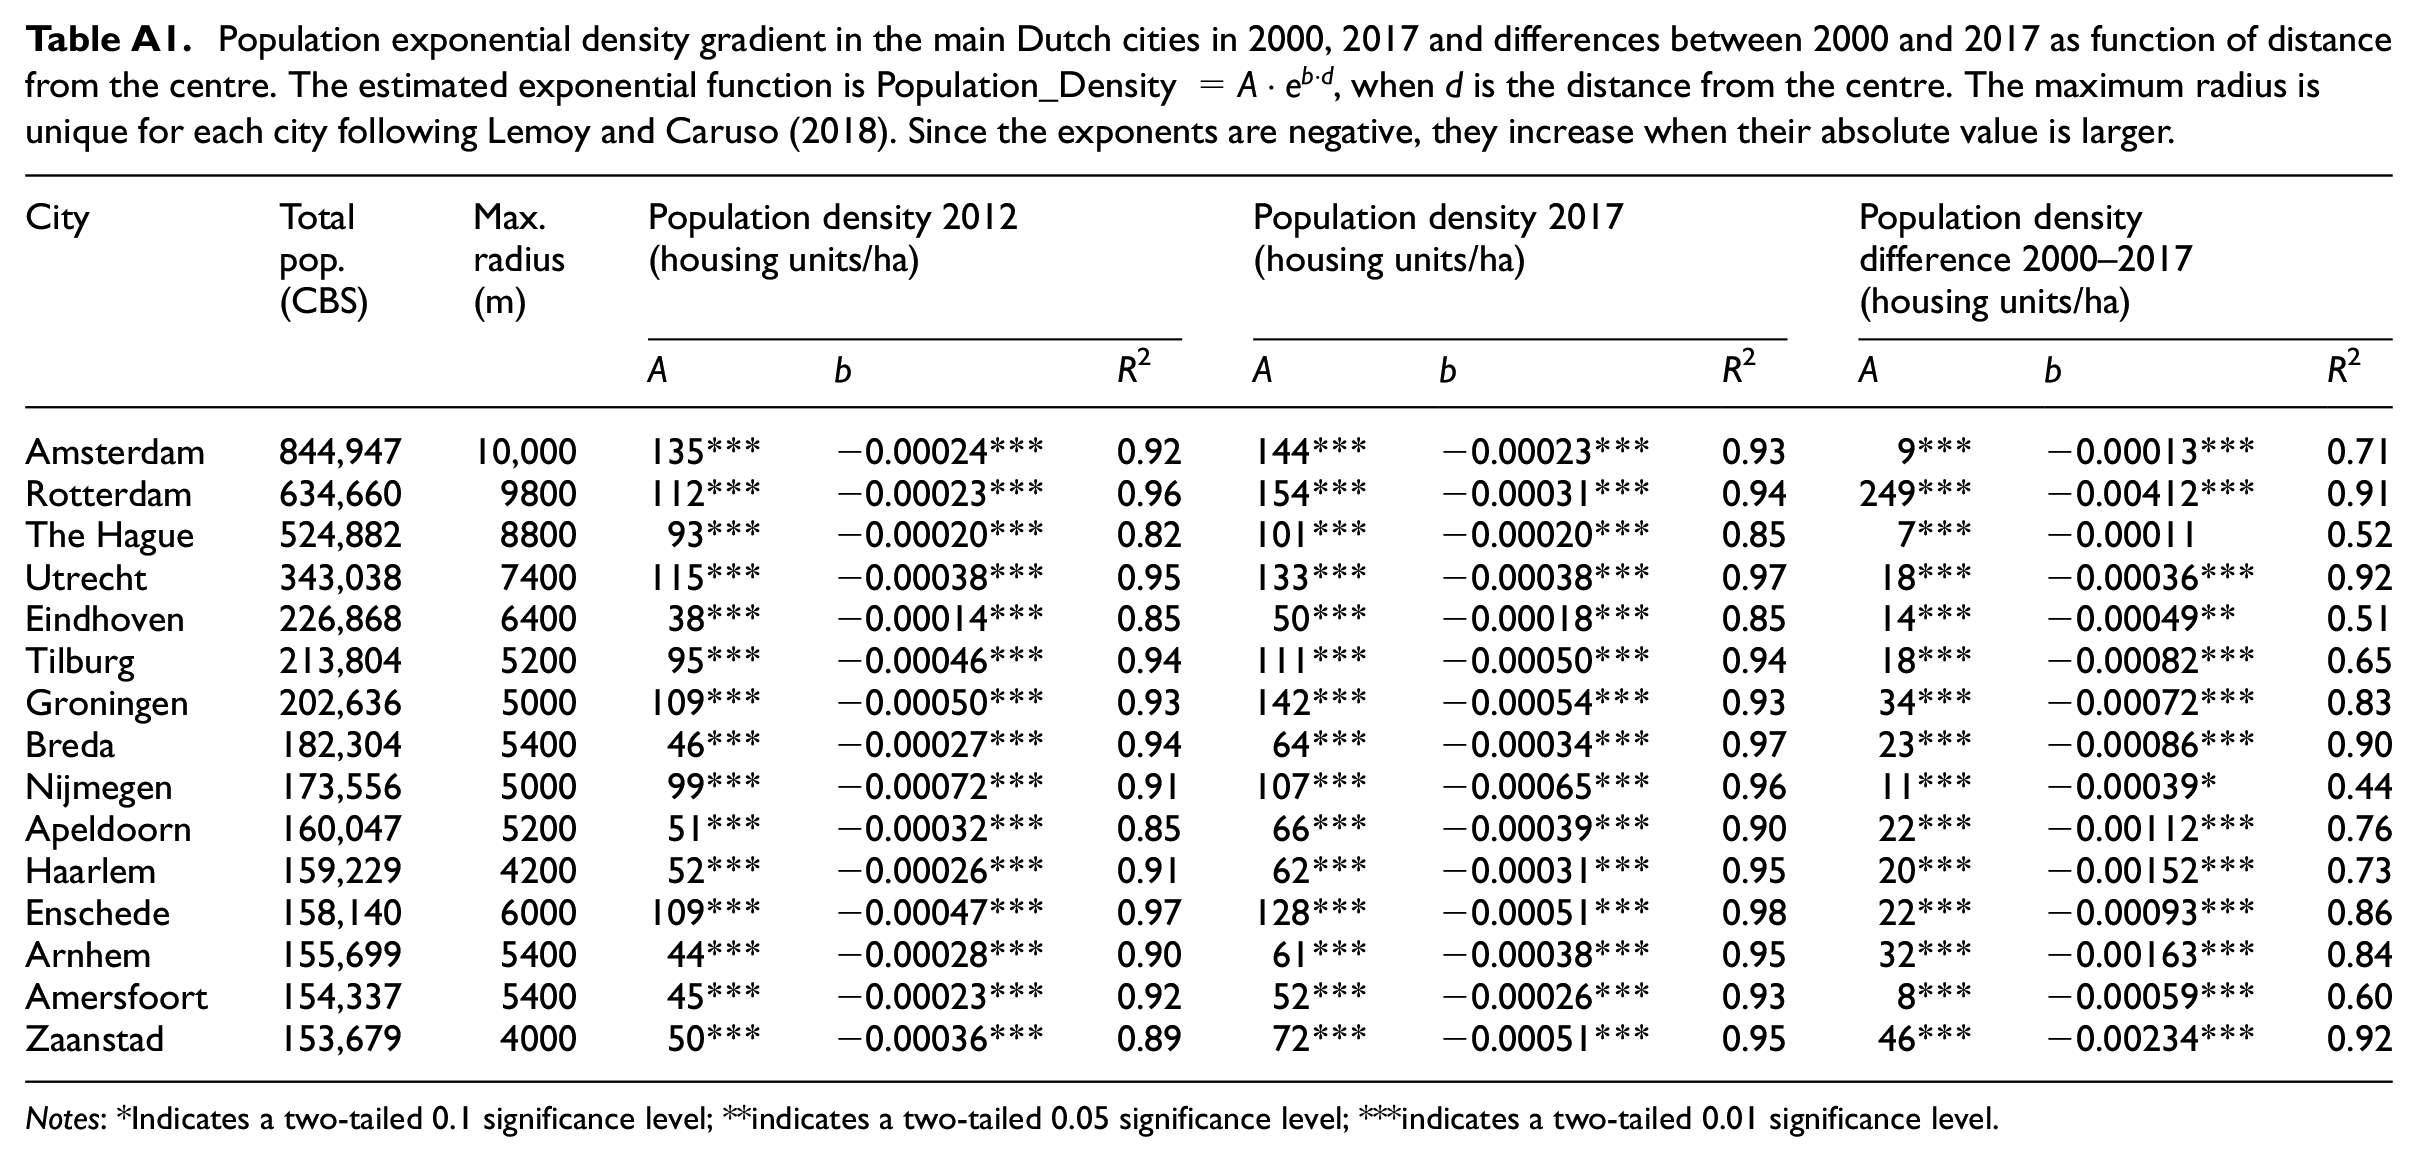
| City | Total pop. (CBS) | Max. radius (m) | Population density 2012 |
Population density 2017 |
Population density difference 2000–2017 (housing units/ha) | ||||||
|---|---|---|---|---|---|---|---|---|---|---|---|
| A | b | R 2 | A | b | R 2 | A | b | R 2 | |||
| Amsterdam | 844,947 | 10,000 | 135*** | −0.00024*** | 0.92 | 144*** | −0.00023*** | 0.93 | 9*** | −0.00013*** | 0.71 |
| Rotterdam | 634,660 | 9800 | 112*** | −0.00023*** | 0.96 | 154*** | −0.00031*** | 0.94 | 249*** | −0.00412*** | 0.91 |
| The Hague | 524,882 | 8800 | 93*** | −0.00020*** | 0.82 | 101*** | −0.00020*** | 0.85 | 7*** | −0.00011 | 0.52 |
| Utrecht | 343,038 | 7400 | 115*** | −0.00038*** | 0.95 | 133*** | −0.00038*** | 0.97 | 18*** | −0.00036*** | 0.92 |
| Eindhoven | 226,868 | 6400 | 38*** | −0.00014*** | 0.85 | 50*** | −0.00018*** | 0.85 | 14*** | −0.00049** | 0.51 |
| Tilburg | 213,804 | 5200 | 95*** | −0.00046*** | 0.94 | 111*** | −0.00050*** | 0.94 | 18*** | −0.00082*** | 0.65 |
| Groningen | 202,636 | 5000 | 109*** | −0.00050*** | 0.93 | 142*** | −0.00054*** | 0.93 | 34*** | −0.00072*** | 0.83 |
| Breda | 182,304 | 5400 | 46*** | −0.00027*** | 0.94 | 64*** | −0.00034*** | 0.97 | 23*** | −0.00086*** | 0.90 |
| Nijmegen | 173,556 | 5000 | 99*** | −0.00072*** | 0.91 | 107*** | −0.00065*** | 0.96 | 11*** | −0.00039* | 0.44 |
| Apeldoorn | 160,047 | 5200 | 51*** | −0.00032*** | 0.85 | 66*** | −0.00039*** | 0.90 | 22*** | −0.00112*** | 0.76 |
| Haarlem | 159,229 | 4200 | 52*** | −0.00026*** | 0.91 | 62*** | −0.00031*** | 0.95 | 20*** | −0.00152*** | 0.73 |
| Enschede | 158,140 | 6000 | 109*** | −0.00047*** | 0.97 | 128*** | −0.00051*** | 0.98 | 22*** | −0.00093*** | 0.86 |
| Arnhem | 155,699 | 5400 | 44*** | −0.00028*** | 0.90 | 61*** | −0.00038*** | 0.95 | 32*** | −0.00163*** | 0.84 |
| Amersfoort | 154,337 | 5400 | 45*** | −0.00023*** | 0.92 | 52*** | −0.00026*** | 0.93 | 8*** | −0.00059*** | 0.60 |
| Zaanstad | 153,679 | 4000 | 50*** | −0.00036*** | 0.89 | 72*** | −0.00051*** | 0.95 | 46*** | −0.00234*** | 0.92 |
Notes: *Indicates a two-tailed 0.1 significance level; **indicates a two-tailed 0.05 significance level; ***indicates a two-tailed 0.01 significance level.
Appendix B: Additional regression results
Contribution of each one of the explanatory variables to the variance explanation.The value in each row is the R-square obtained if the variable is
| Predictors | Model 1 |
Model 2 |
Model 3 |
|---|---|---|---|
| Original R2 (all variables included) | 0.5135 | 0.4150 | 0.5134 |
| Distance from centre (m) | 0.4966 | 0.3622 | 0.4966 |
| Monument density | 0.5134 | 0.3417 | |
| Urban amenities density | 0.4150 | 0.3417 | |
| Land price in 2000 (euro/m2) | 0.4970 | 0.4098 | 0.4969 |
| Available land for urban development | 0.5016 | 0.3953 | 0.5016 |
| Average distance to nearest 100,000th job | 0.5106 | 0.4100 | 0.5103 |
Funding
The author(s) received no financial support for the research, authorship, and/or publication of this article.
