
Abstract
The Home Owners’ Loan Corporation (HOLC), established in the US during the Great Depression to provide relief to a failing housing market, had a lasting effect through institutionalising the segregationist practice of denying mortgages to communities of colour. Over subsequent decades, ‘redlining’ funnelled billions of US dollars away from minority neighbourhoods and shaped segregation patterns – constituting perhaps the most influential example of institutional intervention in the hierarchy of places. This history of racialised exclusion via the process of ‘spatial marking’ is reflected in contemporary housing inequality, which remains one of the most severe sites of racial stratification. This article combines newly-digitised archival data with data describing recent mortgage outcomes to investigate the role of institutional classification of place in the persistence of housing finance inequality. I show that borrowers in the 21st century were at a severe disadvantage when pursuing mortgages in neighbourhoods redlined by HOLC appraisers in the early 20th century. Such applicants were more likely to be denied loans and to receive subprime loans net of measures of selection and ecological disadvantage. This article shows that the geographical patterns of exclusion and exploitation are remarkably stable, and highlights the role of persistent institutional marginalisation in replicating racial and spatial inequalities.
Racial segregation remains a stubbornly persistent aspect of American social geography (Logan and Stults, 2011) and a continuing driver of stratification (Sharkey and Faber, 2014). Because the uneven patterns we observe across neighbourhoods and metropolitan areas are the aggregates of individual decisions informed by racialised understandings of places (Ellen, 2000; Krysan and Crowder, 2017; Quillian, 2002), the ways in which individuals draw distinctions between places based on social phenomena are central to the persistence of spatial inequality. Institutions play parallel – and often complementary – roles in shaping the hierarchy of places through allocating resources in response to individuals’ preferences as well as through practices of classification of places (Logan and Molotch, 1987). The explicit ‘spatial marking’ of racialised places by institutional actors may have substantial consequences if empowered by public policy and when conforming to commonly held racist ideas (Hirsch, 1983; Kendi, 2016; Sugrue, 1996). Therefore, exploring what happens to places when they are marked is crucial for understanding the durability of segregation.
In the United States, there has perhaps never been a greater effort to systematically delineate places than the Home Owners’ Loan Corporation (HOLC). The HOLC was established in 1933 to stabilise a failing housing market (Nelson et al., 2017). The programme provided funds to reduce foreclosures, and institutionalised the practice of denying mortgages to people and communities of colour through ‘Residential Security Maps’, which labelled black and immigrant neighbourhoods as undesirable and outlined them in red (Jackson, 1985; Rothstein, 2017).
The adoption of ‘redlining’ by private lenders as well as subsequent federal programmes funnelled billions of US dollars of mortgage credit away from black neighbourhoods and helped shape segregation patterns and homeownership inequality (Aaronson et al., 2017; Collins and Margo, 2011; Jackson, 1985; Massey and Denton, 1993; Rothstein, 2017). While the HOLC did not invent racism in real estate, its segregationist design serves as an example of how the institutionalisation of social categories can create ‘durable inequality’ (Tilly, 1998). Home equity is the largest asset held by most Americans (Taylor et al., 2011), and disparities in access to mortgage credit remain a driving force in the racial wealth gap (Faber and Ellen, 2016; Flippen, 2004; Krivo and Kaufman, 2004) as well as a contributor to segregation (Bond and Williams, 2007).
This article connects the historical practice of redlining to contemporary housing finance, which remains characterised by racial inequalities (Faber, 2013, 2018; Hanson et al., 2016; Munnell et al., 1996; Rugh et al., 2015). I assess whether and how the geography of historical disenfranchisement is reflected in contemporary lending patterns. I combine newly-digitised archival data cataloguing HOLC neighbourhood grades with Home Mortgage Disclosure Act (HMDA) data describing recent lending practices to show that areas redlined by the HOLC in the 1930s had significantly higher subprime lending rates at the peak of the housing boom than areas identified as ‘desirable’. It was also significantly more difficult to secure loans in redlined neighbourhoods well into the housing market’s recovery (i.e. in 2015 and 2016), and those loans tended to be more expensive.
Although perhaps not surprising, it is important to document the rigidity of the economic organisation of neighbourhoods over time because it carries implications for our understanding of how spatial stratification manifests as racial inequality. These results support claims that past settlement patterns and the ways such patterns were evaluated by institutions matter today (Krivo and Kaufman, 2004; Logan, 2016; Williams et al., 2005). Some of the relationship between HOLC grades and contemporary outcomes is due to socioeconomic disadvantage that characterises redlined neighbourhoods today as well as racialised selection into neighbourhoods. However, it is difficult to understate the culpability of the HOLC in shaping today’s segregation patterns through the practice of spatial marking (Aaronson et al., 2017). Furthermore, to the extent that contemporary neighbourhood characteristics ‘explain’ disparities across HOLC grades, this is the same logic that justified a practice we now consider to have been racist and have since made illegal. Together, these patterns focus our attention on the power of institutions to make place by marking place.
Background
Institutions and spatial marking
Social meanings ascribed to places are facilitated through distinctions made between places (Logan and Molotch, 1987). Such demarcations can be driven by geographical phenomena (e.g. rivers), the built environment (e.g. highways), political lines (e.g. state borders) and social phenomena (e.g. racial makeup). Scholars have devoted considerable attention to the latter – repeatedly demonstrating the ways in which understandings of place are driven by race and income.
Urban sociologists have long argued that communities of colour carry stigma (Anderson, 1992; Besbris et al., 2015; Jones and Jackson, 2012; Logan and Molotch, 1987; Wacquant, 2008). A rich literature has explored the ways in which neighbourhood racial makeup shapes residential decisions, from preferences for neighbourhoods with a higher proportion of whites in surveys (Bader and Krysan, 2015; Krysan and Crowder, 2017) to observed mobility patterns away from black neighbourhoods (Crowder et al., 2012; Sampson and Sharkey, 2008; South and Crowder, 1998). In aggregate, individual-level actions informed by racialised understandings of different places manifest as residential segregation (Ellen, 2000; Krysan and Crowder, 2017; Quillian, 2002), thereby reinforcing inequalities between places (Massey and Denton, 1993).
Institutional interventions to disrupt or concretise the hierarchy of places may carry consequences for perceptions of places. On the individual level, the mark of an institution, whether positive (Torche, 2011) or negative (Pager, 2008), has been shown to affect life outcomes. An equivalent ‘spatial marking’ may similarly accentuate privilege if positive or exacerbate disadvantage if negative. The delineation of racialised places by institutions may have a reciprocal/reinforcing relationship with racial animus through legitimising racist ideas (Hirsch, 1983; Kendi, 2016; Lipsitz, 2011). Furthermore, this practice could be considered a form of the more general process of creating categories in order to facilitate the durability of inequality through exploitation and/or opportunity hoarding (Tilly, 1998).
This article seeks to advance the sociology of place through an assessment of how policy marks the status of places. Specifically, what happens to a place when it is classified by policy? How does spatial marking distinguish a place over time and – in the negative case – make it a target for exclusion and exploitation? Answers to these questions will provide insight into why scholars still observe persistent patterns of spatial inequality (Krysan and Crowder, 2017; Logan and Stults, 201l; Sharkey, 2013).
Researchers have explored examples of institutional demarcations of place through zoning (Hirt, 2015), school districts (Bischoff, 2008; Burdick-Will, 2018) and infrastructure (Ananat, 2011). Segregation scholars have argued that perhaps no interventions in the hierarchy of place have been more impactful on America’s racial geography than the segregationist housing policies of the New Deal: the Federal Housing Administration (FHA), the GI Bill and – originally – the HOLC (Hirsch, 1983; Jackson, 1985; Kendi, 2016; Massey and Denton, 1993; Sugrue, 1996).
The Home Owners’ Loan Corporation
The HOLC was established to stem the tide of foreclosures during the Great Depression by providing funds for refinancing mortgages at risk of foreclosure and granting loans to those who lost homes to foreclosure to regain their homes (Massey and Denton, 1993; Nelson et al., 2017; Thurston, 2018). In the HOLC’s first two years, it granted over US$3 billion of loans on over 1 million mortgages (Jackson, 1985).
The HOLC had two dramatic and lasting impacts. First, the programme institutionalised the long-term mortgage with uniform payments (Jackson, 1985; Massey and Denton, 1993). In doing so, it created the reliance on credit to finance homeownership and replaced ‘the crazy quilt structure of mortgage financing left over from the 1920s’ (Fishman, 1987: 175). The HOLC was one of several federal policies responsible for creating the modern homeownership society (Collins and Margo, 2011; Crossney and Bartelt, 2005).
The second lasting impact of the HOLC was on segregation. HOLC appraisers divided cities into neighbourhoods and assessed the risk of lending in neighbourhoods based on sociodemographic characteristics of residents as well as housing stock (Crossney and Bartelt, 2005; Jackson, 1985; Rothstein, 2017). The resulting ‘Residential Security Maps’ graded neighbourhoods from ‘A’ (i.e. most desirable) to ‘D’ (i.e. least desirable). Areas classified as ‘A’ were characterised by new housing stock, an exclusively white population and demand that was presumed to be stable in the future. ‘B’ areas were assessed as desirable, though past their peak, while ‘C’ and ‘D’ neighbourhoods were considered to be declining and post-decline, respectively. Race and ethnicity may have been the most influential characteristics in determining a neighbourhood’s grade. In St. Louis, for example, not a single black household resided in an ‘A’ neighbourhood. Grades were colour-coded, with ‘A’ in green, ‘B’ in blue, ‘C’ in yellow and ‘D’ in red – this last category is the origin of the term ‘redlining’. Appraisers were gravely concerned with where black households lived because these households were considered a disamenity and a signal of a neighbourhood’s decline (Jackson, 1985; Rothstein, 2017). Analysis by Hillier (2005) showed that the presence of African Americans in a neighbourhood was a powerful driver of undesirable grades net of other neighbourhood characteristics.
As mentioned, the HOLC did not create racism in real estate – but it did apply racist practices on an unprecedented scale. These practices adopted the commonly held belief at the time that the socioeconomic characteristics of a neighbourhood were more important than the built environment in determining lender risk (Jackson, 1985; Sugrue, 1996). This legitimation of conflating mortgage default risk with racial isolation via the practice of marking neighbourhoods had dramatic consequences. Redlining evolved through its application by private banks and federal programmes, channelling funds away from black and racially-mixed areas and towards white areas (Jackson, 1985; Massey and Denton, 1993). Together, the HOLC, the FHA and the Veteran’s Administration (VA) were in large part responsible for post-war suburbanisation (Collins and Margo, 2011; Fishman, 1987; Jackson, 1985), which concentrated wealth in white suburbs, and the ‘spiral of decline’ (Massey and Denton, 1993: 55) experienced by cities. These policies created a permanence of segregation patterns, constituting a powerful example of the role of categorisation in the durability of inequality (Massey, 2007; Tilly, 1998).
Mechanisms connecting past and present
The subprime boom was a dramatic manifestation of the racialised nature of housing finance in America. People (Faber, 2013; Gramlich, 2007) and places (Hwang et al., 2015) of colour were more likely to take on often-predatory subprime debt in the market’s rise. This ‘reverse redlining’ was possible because earlier practices not only concentrated racialised poverty, but limited information about lending available to minority communities and helped funnel minorities towards less favourable lenders and loan terms (Crump et al., 2008; Hernandez, 2012; Rugh and Massey, 2010; Turner and Skidmore, 1999; Yinger, 1995). One lesson to be learned from the subprime boom is that place is a salient unit of analysis for institutional actors (e.g. mortgage lenders) and that spatially-determinant institutional practices can have dramatic, negative effects on racially isolated communities. Williams and colleagues (2005: 182) argue that ‘the old inequality [in mortgage lending] helped make the new inequality [in mortgage lending] possible’ by creating and concentrating racialised poverty – ensuring that the effects of the previous generation’s discrimination carries forward in time (Pager and Shepherd, 2008), and illustrating how the ‘hierarchy of places’ is facilitated by institutional actors (Logan, 1978).
Three related mechanisms may explain the extent to which the demarcation of places by segregationist policies during the 1930s predicts contemporary lending inequalities. The first is differential selection into neighbourhoods delineated by HOLC appraisers as desirable or undesirable. Scholars have repeatedly shown the ways in which race and income shape mobility decisions, which – in aggregate – tend to sort households into racially- and economically-similar neighbourhoods (Charles, 2006; Quillian, 2012; Sampson and Sharkey, 2008; South and Crowder, 1998). Research has also documented intergenerational ties to place as a factor in the reproduction of spatial inequality (Sharkey, 2008, 2013).
Relatedly, work exploring the causes and consequences of the housing boom and bust has illuminated the intersecting roles of individual and community characteristics in shaping subprime lending (Been et al., 2008; Hwang et al., 2015), foreclosures (Chan et al., 2013; Rugh, 2015; Rugh et al., 2015) and the lasting impact of market tumult (Faber, 2018). This more recent scholarship is consistent with earlier analyses of mortgage lending by Holloway (1998), which showed that the racialised nature of lending was multi-levelled (i.e. analyses of individual-level mortgage exclusion are contingent on parallel, geographically-organised exclusion). Therefore, we may observe that individuals with stronger financial histories choose neighbourhoods previously assessed as A under the HOLC, while poorer individuals with low credit scores apply for loans in D neighbourhoods. If this is the case, we may expect that loan applications in D areas will be more likely to be denied, and that they will be of lower quality (e.g. subprime) when approved.
The second pathway is the concentration of disadvantage and racial isolation that not only characterised redlined neighbourhoods during HOLC implementation, but carried forward in time. The path dependency of place means that existing settlement patterns present an obstacle to change because of a legacy of disadvantage (Logan, 2016) and the combined impact of that disadvantage on the reputations that neighbourhoods carry (Anderson, 1999; Besbris et al., 2015; Jones and Jackson, 2012). The HOLC’s conflation of race and creditworthiness laid the foundation for contemporary patterns of segregation (Aaronson et al., 2017; Collins and Margo, 2011; Hirsch, 1983; Jackson, 1985; Massey and Denton, 1993; Sugrue, 1996).
A wealth of research has documented the powerful role of neighbourhood characteristics in shaping housing finance outcomes during and since the subprime boom. Loan application denial and subprime origination were more prevalent in places characterised by racial isolation (Faber, 2018; Gramlich, 2007; Hwang et al., 2015; Hyra et al., 2013). Foreclosures were also more common in segregated areas (Chan et al., 2013; Hall et al., 2015; Rugh and Massey, 2010). Consequently, lenders may hesitate to grant mortgages in areas that suffer from both historical exclusion and contemporary disenfranchisement due to the presumed (or assessed) financial risk of the people living in those neighbourhoods and/or the weakness of the local housing market. When loans are approved, they may be of higher cost to balance this perceived risk. The patterns of continued classification of neighbourhoods as worthy or unworthy by lenders are, therefore, reinforced by patterns of selection.
The third mechanism is discrimination. The practices responsible for racial inequality in the housing market have shifted from the now-illegal explicit exclusion to more subtle forms of implicit exclusion and exploitation (Massey, 2005; Squires, 2004). Still, scholars have repeatedly shown discrimination to be prevalent in housing and credit markets (Bertrand and Duflo, 2017; Pager and Shepherd, 2008; Squires, 2003). Bias may exacerbate disparities across HOLC-graded areas caused by differential selection. For example, if blacks are more likely to seek mortgages in D neighbourhoods and if they experience discrimination in the mortgage approval process (Massey et al., 2016), we may observe worse aggregate outcomes in neighbourhoods evaluated as D. Lacking the data necessary to easily identify explicit discrimination based on place (i.e. ‘process-based redlining’), some scholars have chosen to investigate redlining from an aggregate perspective. ‘Outcome-based redlining’ exists when minority neighbourhoods experience worse outcomes than comparable white neighbourhoods (Dymski, 2012; Ross and Yinger, 2002; Turner and Skidmore, 1999; Yinger, 1995). Under this framework, disparate impact is a form of discrimination regardless of intention (Pager and Shepherd, 2008).
Data and methods
The Mapping Inequality group (Nelson et al., 2017) digitised the HOLC Residential Security Maps and created shape file data describing neighbourhood boundaries and ratings. The dataset includes grades granted by HOLC appraisers. I use Mapping Inequality data dated 7 July 2017. Appendix Table 1 in the supplemental material shows the number of HMDA sample observations by state. The sample is dispersed across the US, with greater concentration in the Rustbelt and Northeast. Representativeness of the sample is discussed in further detail below. I spatially join the HOLC layer with census tract centroids and only analyse tracts in counties with at least one tract with a centroid that overlaps with HOLC-graded neighbourhoods. HOLC appraisers provided grades for areas other than industrial or commercial areas, undeveloped areas, farmland or places ‘sparsely built up’. Tracts that were within counties assessed by the HOLC and were in one of these land-use categories at the time of appraisal and are included in the sample as ‘Not graded’.
Although HOLC boundaries do not perfectly align with contemporary census tracts, I am restricted by the fact that other datasets are organised by tracts. Because some tracts overlap with multiple HOLC areas, the assignment of a HOLC grade to a tract based on its centroid may introduce noise into my analyses. In supplemental analyses, I merge census blocks to HOLC boundaries and create several tract-level aggregate measures based on block-level data. Appendix Table A2 in the supplemental material presents results from models in which these measures are substituted for the tract-level dummy variable approach. These results support the main findings of this article, though I proceed with the tract-level dummy variable approach because it is easier to interpret.
The Home Mortgage Disclosure Act (HMDA) was enacted in 1975 to shed light on a mortgage industry reticent in revealing information about its lending criteria. Due to the efforts of fair-lending advocates, the HMDA now provides annual data on each mortgage application received by lenders, including whether it was approved, the tract of the unit and other characteristics. I use the 2006 HMDA dataset to analyse mortgage market dynamics during the housing boom, and I combine the 2015 and 2016 datasets to explore lending approximately a decade later. Combining the two more recent years improves the precision of the statistical estimates through a larger sample comparable in size to the peak year of the housing boom. I focus on these two points in time to explore differences between the dynamics during times of crisis – in terms of vulnerability to exploitation (i.e. exclusion and subprime lending in 2006) – and those during a period of post-recession stability (i.e. 2015–2016).
I use HMDA data to calculate four outcomes: denial for both 2006 and 2015–2016 (i.e. a dummy variable coded one if denied), 2006 subprime origination conditional on approval (i.e. a dummy variable coded one if an approved mortgage qualified as subprime, zero if prime and missing if the application was denied), and high-cost origination conditional on approval in 2015–2016 (i.e. a dummy variable coded one if an approved mortgage was high cost, zero if not and missing if the application was denied). In 2006, lenders were required to report whether the loan had an interest rate three or more points above the federal Treasury rate. Following previous research (Been et al., 2008; Faber, 2013), I use this variable to identify subprime loans. Since 2009, lenders have been required to report whether the difference between the estimated annual percentage rate and the average prime offer for the date the rate was set is greater than 1.5. While this rule change makes comparisons across time in the prevalence of subprime lending difficult, the subprime lending that typified the boom has largely disappeared since the collapse of the market (Bhutta et al., 2015). Specifically, loans identified as high cost after the 2009 rule change tend to have lower interest rates than those identified as high cost in earlier years (Bhutta et al., 2015). Still, research has shown that these ‘high-cost’ loans are a site of racial and spatial inequalities (Faber, 2018), so I draw upon this HMDA variable to explore variation across HOLC grades in the likelihood that approved loans are high cost a decade after the peak of the housing boom.
Because the HMDA includes information about potential borrowers as well as the tract 1 in which the housing unit is located, it can be used to explore the role of neighbourhood selection in shaping application outcomes. I create dummy variables for race (i.e. non-Latino black, Latino, non-Latino Asian), female applicants, the presence of a co-applicant, refinance loans and conventional loans. I calculate the natural log of the applicant’s income and the size of the requested loan. The limitations of the HMDA are well documented. For example, it does not include information on down-payment size or loan-to-value ratio, both of which shape loan outcomes (Dymsky, 2006; Turner and Skidmore, 1999). Still, it remains the most comprehensive publicly available resource for studying lending.
Following sampling procedures used in prior work (Been et al., 2008; Faber, 2013; Pettit and Droesch, 2008), I restrict my analyses to owner occupied, first lien and between one and four family units, and I exclude home improvement loans. My analytic sample includes applications with full covariate data within tracts with centroids within counties evaluated by the HOLC. Of the 4,276,262 applications that were in counties with HOLC data in 2006 and 2015–2016, 623,852 (14.6%) are missing at least one variable within the HMDA dataset or are identified as ‘other race’. An additional 302,022 (7.1%) are missing ecological covariate data. My final analytical sample contains 1,614,103 mortgage applications in 2006 and 1,736,285 in 2015–2016.
Table 1 displays descriptive statistics for the HMDA sample. Most mortgage applications were for units in C neighbourhoods, while a small minority of applications were in A neighbourhoods. The percentage of applications for the ‘desirable’ areas (i.e. A or B) was higher in 2015–2016 than in 2006, which is consistent with the fact that the applicant pool had a higher proportion of whites and was more affluent in the latter period. The neighbourhoods in which applicants were seeking loans also had fewer minority residents in 2015–2016 than in 2006. I explore this in more detail below.
HMDA descriptive statistics for the analytical sample.
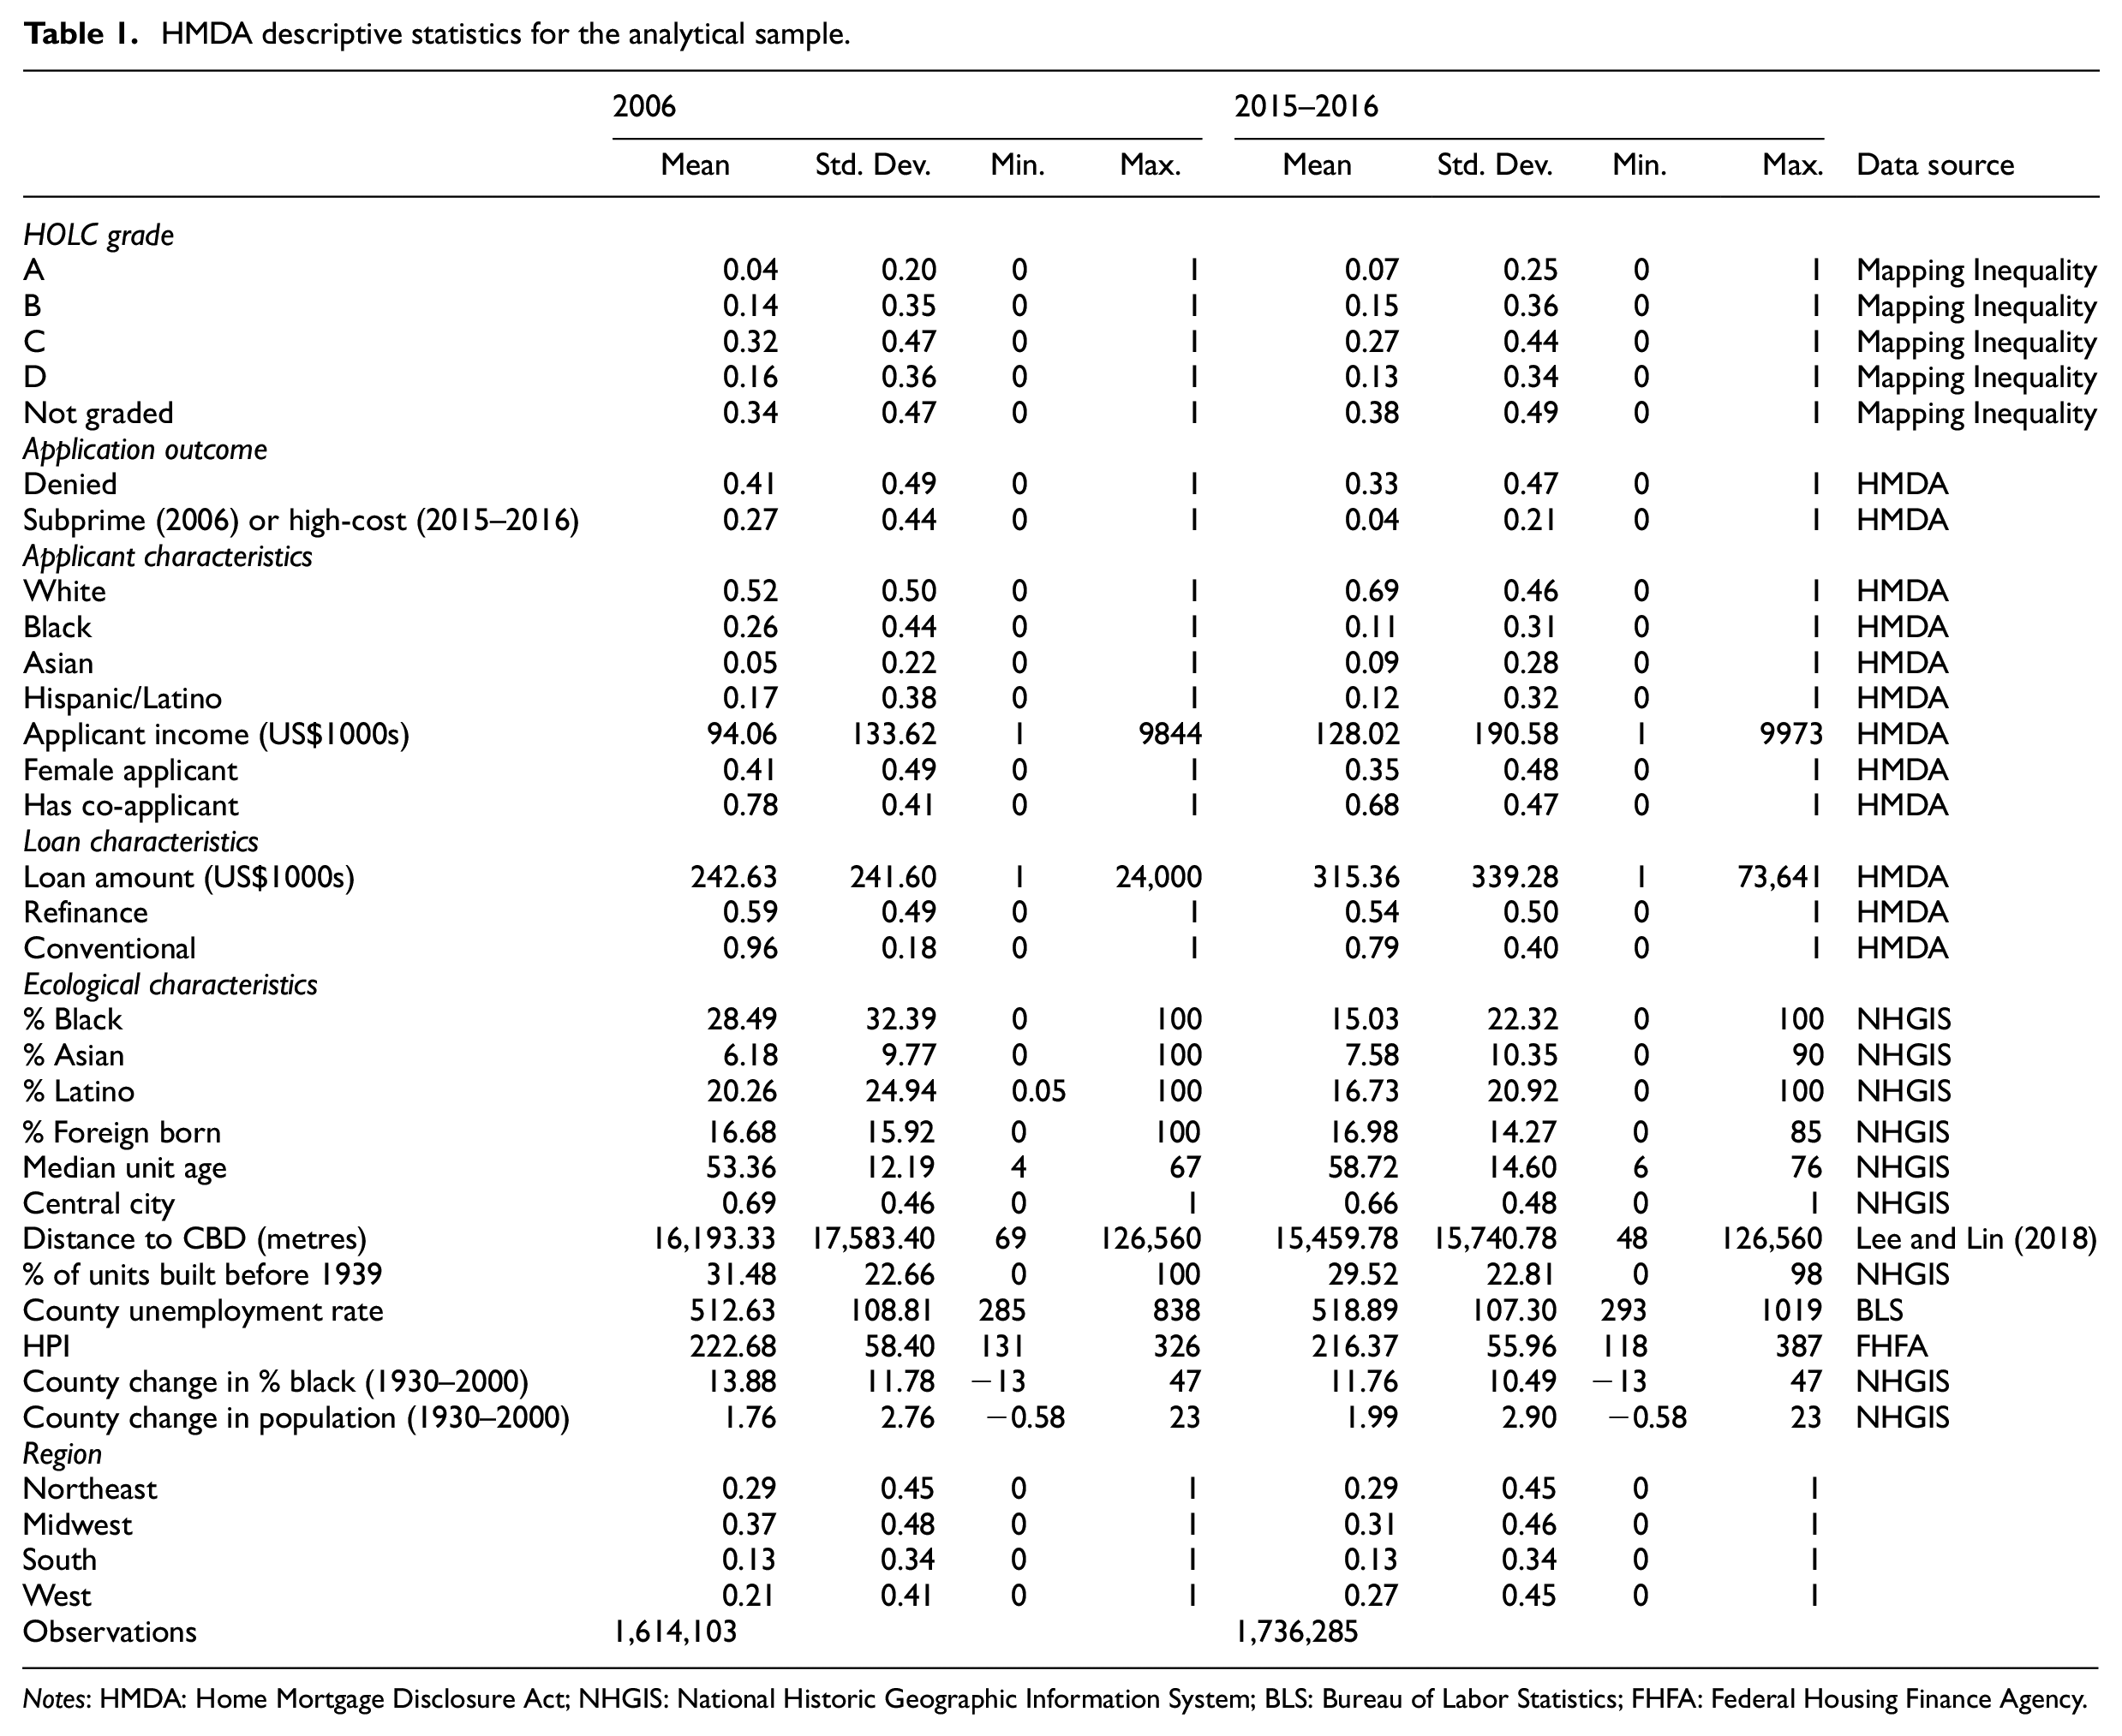
Notes: HMDA: Home Mortgage Disclosure Act; NHGIS: National Historic Geographic Information System; BLS: Bureau of Labor Statistics; FHFA: Federal Housing Finance Agency.
I pair the data above with covariates to explore the extent to which correlations between these phenomena may be driven by continued inequalities between places and individuals. I calculate tract-level percentage black, Asian and Latino 2 using American Community Survey (ACS) 5-year sample data for 2005–2009 and 2011–2015 from the National Historic Geographic Information System (NHGIS) (Minnesota Population Center, 2011). I also use the NHGIS to identify two measures of housing quality: the median age of housing units, and the percentage of units built before 1939. These covariates reflect the fact that the HOLC was considerably occupied with the demographic characteristics of the neighbourhoods they were grading as well as with the strength of the local housing market (Jackson, 1985) – as are contemporary mortgage lenders (Chan et al., 2013; Faber, 2018; Hwang, 2015). Because the HOLC appraisers also favoured suburban neighbourhoods (Jackson, 1985), I use a logged measure of distance to the metropolitan area’s central business district from Lee and Lin (2018). Finally, I incorporate the county-level unemployment rate from the Bureau of Labor Statistics and the metropolitan statistical area-level housing price index from the Federal Housing Finance Agency for 2006 and 2015. I leverage county-level change in percentage black as well as percentage change in total population between 1930 and 2000 from the NHGIS as an estimate of demographic change.
Using logistic regression, I estimate each outcome as a function of HOLC grade, applicant characteristics, loan characteristics and ecological characteristics. Covariates are measured contemporaneously (e.g. I use 2006 measures of unemployment and HPI when estimating the 2006 subprime lending rate). The 2006 models are estimated using 2005–2009 ACS data, while the 2015–2016 models include 2011–2015 ACS data. I include dummy variables for census region and whether the tract was within a central city. Models using the 2015–2016 combined HMDA datasets include an additional dummy variable for year.
Results
Figure 1 displays my central findings: housing finance outcomes are dramatically different between neighbourhoods classified by HOLC as ‘desirable’ and those with lower grades. Beginning with lending during the housing boom (Panels A and B), mortgage applications were more likely to be rejected and approved loans were more likely to be high cost in D neighbourhoods than in A. Approximately a decade later, disparities in mortgage denial persisted (Panels C and D). Much of the overall decline in high-cost lending between the two time periods is due to the collapse of subprime lenders, the overall tightening of the mortgage credit market and differences in the measurement of high-cost lending following 2009 reporting rule changes. The important comparison to make is not across time periods in the rates of high-cost lending, but within time periods and across HOLC grades.
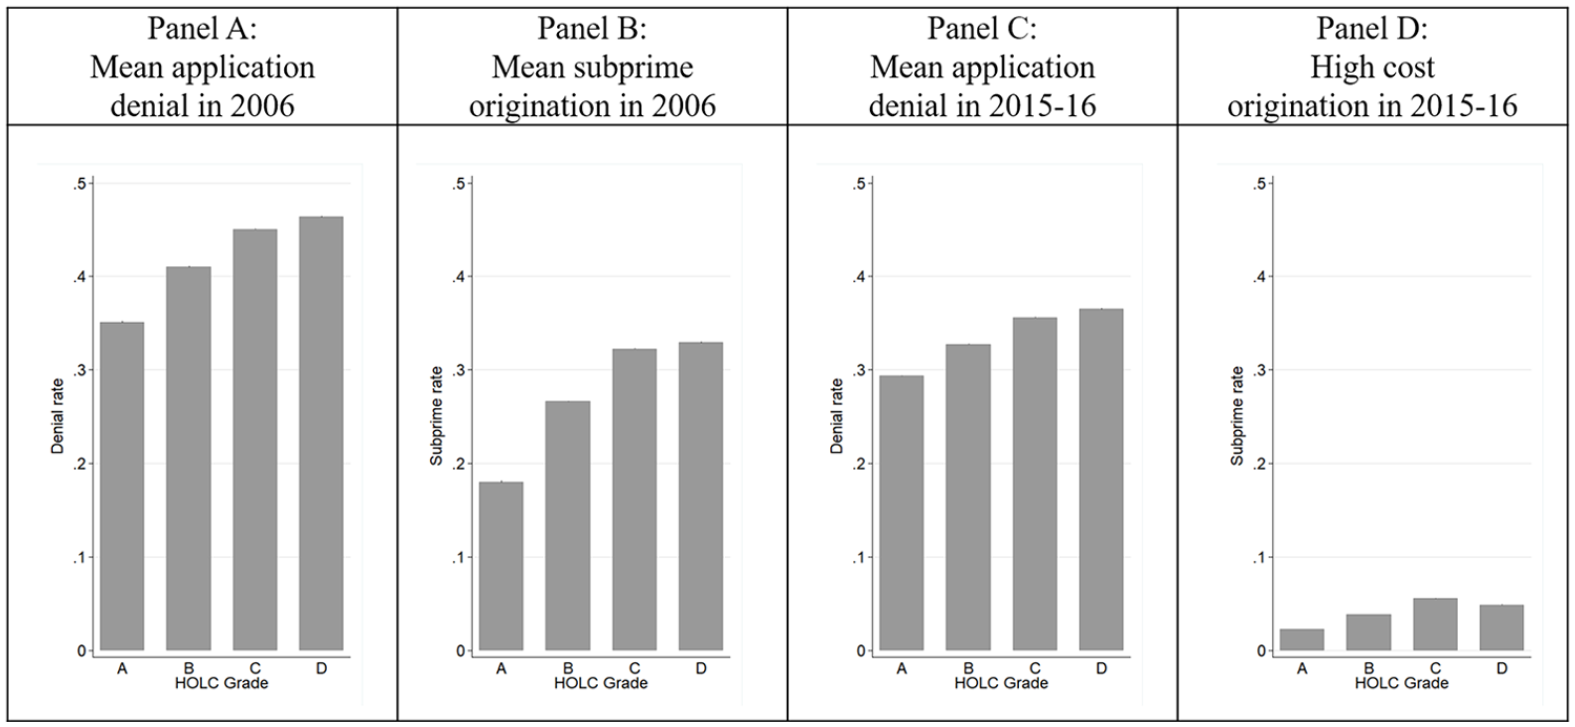
Average mortgage application outcomes by HOLC grade.
Figure 2 displays the rates at which individuals of each racial/ethnic group applied for mortgages in each HOLC grade in 2006. 3 Approximately one in 10 whites were seeking loans in the highest rated areas, compared with one in 20 blacks and Asians and one in 50 Latinos. These results suggest that racialised processes of selection may shape housing finance outcomes across HOLC areas. Table 2 shows selected characteristics for all tracts in my analytical sample, for tracts in each HOLC grade, for those in the United States as a whole and for all central city tracts in the United States. Sociodemographic differences across grades were statistically significant and are consistent with research on the long-term impact of the HOLC on neighbourhood disadvantage (Aaronson et al., 2017).
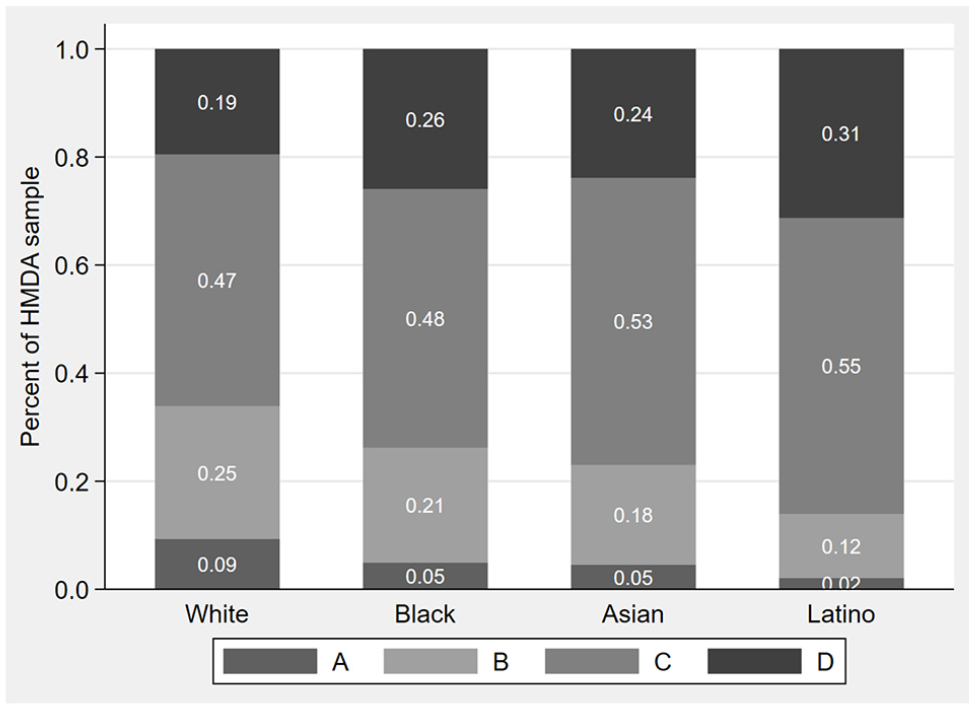
HOLC tract selection by race of mortgage applicants in 2006.
Tract-level, racial and socioeconomic characteristics for the analytical sample (by HOLC grade) and for the country as a whole.
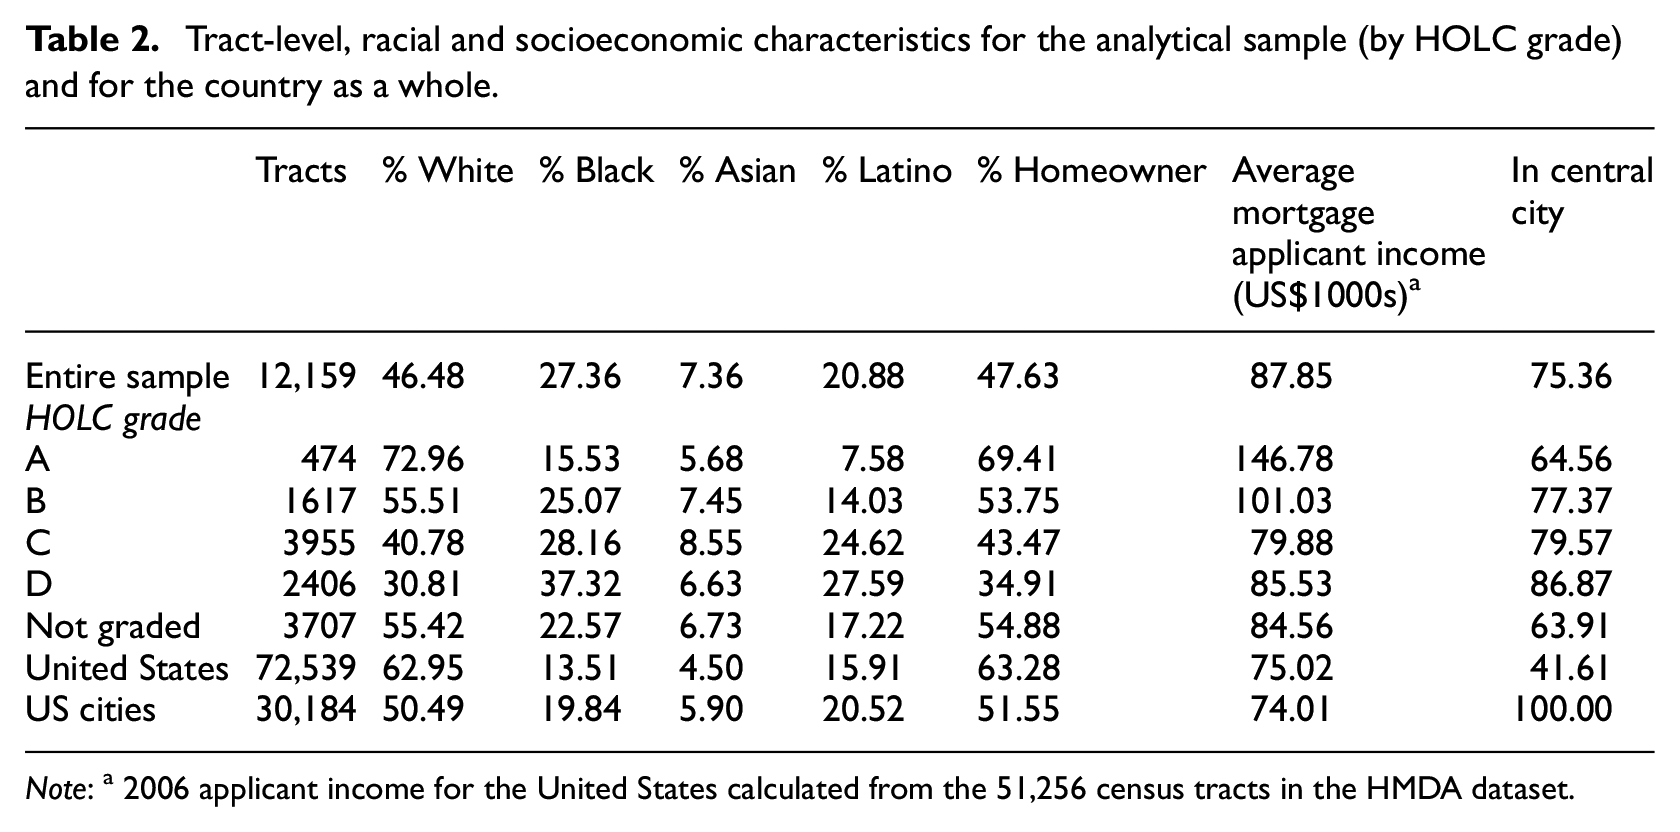
Note: a 2006 applicant income for the United States calculated from the 51,256 census tracts in the HMDA dataset.
These patterns are a reminder of the racialised processes that facilitate segregation (Krysan and Crowder, 2017). Places that were white and affluent in the 1930s (and were rewarded for being so with desirable HOLC ratings) are still so today. Conversely, neighbourhoods with black and poor populations in the early 20th century (and that were punished for being so with C and D ratings) are still predominantly so today. Thus, these inequalities provide context for interpreting the across-HOLC differences explored throughout the remainder of this article.
Table 3 displays selected results 4 from logistic regression estimates of mortgage application outcomes. Results are presented as exponentiated coefficients. The first column, which predicts denial in 2006 based on HOLC grades and regions, shows that the likelihood an applicant was denied increased from tracts graded A to those graded D. Column 2 shows that much of the variation across HOLC grades may be due to differential selection. The magnitude of the odds ratios for the HOLC dummies fell yet retained significance, with denial 36% more likely in D tracts than A tracts. The predictive strength of HOLC grades weakened further once ecological characteristics were added to the model to account for the role of contemporary spatial inequality in shaping mortgage outcomes (Column 3). The attenuation of the relationship between HOLC grades and contemporary outcomes upon adding neighbourhood characteristics provides support for another mechanism connecting past to present: the uneven distribution of neighbourhood advantage and disadvantage. The fourth to sixth columns show stronger relationships between HOLC grades and subprime origination at the peak of the housing boom. As with denial, borrower selection and ecological characteristics accounted for a large portion of this relationship, though the disparities between A and D areas remained significant and substantively meaningful upon addition of controls.
Selected results from logistic regression estimates of mortgage application outcomes.
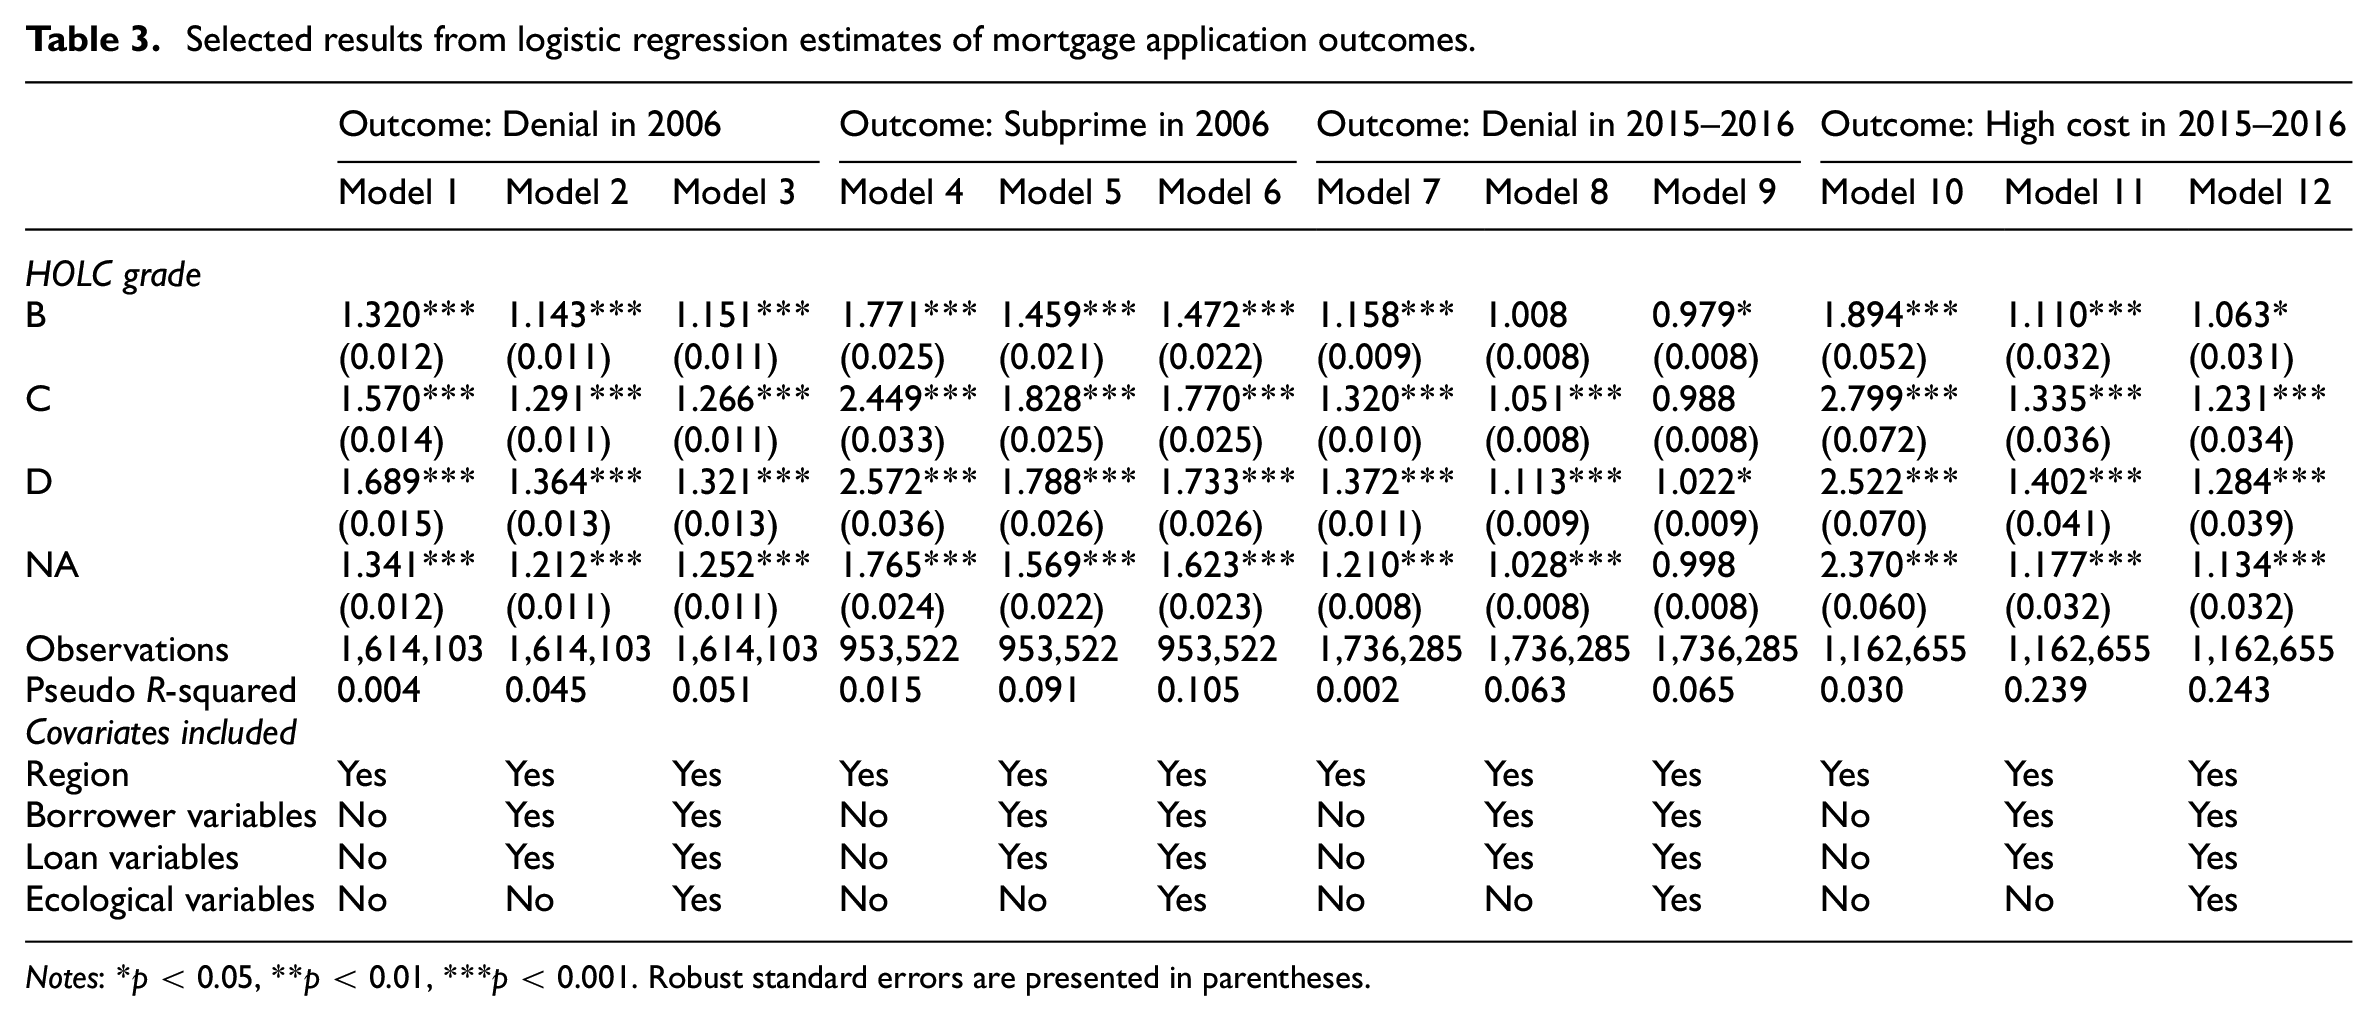
Notes: *p < 0.05, **p < 0.01, ***p < 0.001. Robust standard errors are presented in parentheses.
The gradient across HOLC grades was weaker in the post-recession market, likely due to the fact that mortgage applicants were much more affluent in 2015–2016 (Table 1). On average, areas marred by HOLC appraisers remained at a disadvantage in 2015 and 2016. Mortgage applicant selection into neighbourhoods explained most, but not all, of the differences between the highest and lowest rated areas. Once ecological characteristics were added to the model of loan denial, only the coefficient for D neighbourhoods retained statistical significance. Disparities in high-cost lending, however, were more robust to the inclusion of covariates. All coefficients for HOLC grades were significant in the fully controlled model. These model results help us understand why high-cost lending was most common in C neighbourhoods rather than D, which were the most disadvantaged on all other lending measures. Although, on average, high-cost lending rates were highest in C neighbourhoods, the addition of controls – and measures of borrower selection in particular – inverted the C–D difference. Estimates from models in which D is set as the reference category (available upon request) show that the difference between C and D areas is statistically significant. Although Pseudo R-Squared is an imperfect measure of model fit, it is notable that models estimating subprime and high-cost lending odds appear to have more explanatory power than models of denial. This suggests, perhaps, that historical redlining is a better predictor of contemporary reverse redlining than contemporary redlining.
Discussion
Borrowers in the early 21st century were at a severe disadvantage when pursuing mortgages in neighbourhoods that had been marked as ‘undesirable’ by the HOLC in the first half of the 20th century. This constitutes evidence that those places redlined in the past have faced outcome-based redlining as well as reverse redlining in more recent years. Positively marked areas (i.e. A tracts) were additionally advantaged over areas ignored by the HOLC (i.e. ungraded tracts), suggesting that institutional influence can be positive as well as negative. These findings are particularly interesting when considering the immense social, economic and geographic changes that cities and their surrounding metropolitan areas have undergone in the decades since the HOLC.
Although data limitations preclude me from making strict causal claims about the relationship between HOLC appraisals and contemporary outcomes, the results provide insight into potential mechanisms connecting past to present. First, neighbourhood selection by race and income emerged as a driver of disparities across HOLC designations. Whites were approximately twice as likely as non-whites to apply for mortgages in A areas. Applicant incomes were also significantly higher in A areas. However, it is crucial to understand selection patterns as stratifying processes themselves, rather than solely as statistical nuisance – especially considering the segregated structure in which mobility decisions are made (Krysan and Farley, 2002; Logan, 2016; Sampson and Sharkey, 2008). Redlining created financial incentives to ‘select’ into certain areas, which may have led to an accumulation of investment in those areas over time. To the extent that lenders still carry favourable views of A neighbourhoods, the impact of segregated selection may carry forward as a cumulative disadvantage in the accrual of wealth among people of colour (Krysan and Crowder, 2017; Rugh et al., 2015) and a manifestation of the ways in which geographically organised institutional practices create racialised poverty in a capitalist system (Slater, 2013).
A second potential mechanism is the effect that the HOLC may have had on locking in spatial inequality that existed at the time of implementation. Unfortunately, neighbourhood-level characteristics are not publicly available for the period before HOLC implementation. However, the concentration of socioeconomic disadvantage in C and D neighbourhoods today, which others have directly connected to the HOLC (Aaronson et al., 2017), explains some of the relationships between contemporary outcomes and the HOLC’s legacy. More broadly, we must contextualise these results within the history of housing exclusion. Attributing inequalities in lending activity to the uneven distribution of people of colour is precisely what HOLC appraisers were doing – a practice scholars have since determined to have been racist. Furthermore, contemporary racial inequalities are a consequence of historical policies, including the HOLC, and part of a long trajectory of disenfranchisement (Massey and Denton, 1993; Rothstein, 2017). Fixating on racial and spatial disparities in assets, for example, as justification for unequal outcomes is the equivalent of telling black and Latino borrowers ‘We can’t give you a loan today because we’ve discriminated against members of your race so effectively in the past that you have not been able to accumulate any equity from housing to pass down through the generations’ (Lipsitz, 1998: 14).
Still, I show that disparities across HOLC grades persisted even after controlling for observable measures of selection and ecological characteristics, which raises the question of discrimination. Unfortunately, my data are insufficient to identify specific instances of discrimination. However, given the evidence of bias by multiple actors in the housing market – including predatory and exclusionary lending (Hanson et al., 2016; Massey et al., 2016; Munnell et al., 1996) – it is difficult to dismiss discrimination as a contributor to these results. In this case, it is unlikely that today’s lenders explicitly consider HOLC grades of prior eras, but the institutionalisation of racialised boundaries may have become so deeply embedded in narratives of neighbourhood hierarchies that they may implicitly shape lending patterns generations later. Perhaps more important is the argument that disparate impact, regardless of intent, is a form of discrimination (Pager and Shepherd, 2008).
Ultimately, adjudicating the relative importance of selection, path dependency and discrimination may be impossible not only due to data limitations, but because of the theoretical difficulty of disentangling each from the others. Segregation shapes selection (Krysan and Farley, 2002; Logan, 2016; Sampson and Sharkey, 2008) and discrimination (Besbris et al., 2015; Doleac and Stein, 2013). Discrimination, in turn, affects selection (Besbris and Faber, 2017) and segregation (Yinger, 1995). Therefore, precisely how HOLC designations may have influenced mortgage outcomes decades later is likely better conceptualised as operating through all three mutually reinforcing mechanisms.
This article’s analytical sample is not meant to be representative of the whole of the United States. However, the unique characteristics of the analytical sample, which may have been directly caused by the HOLC (Aaronson et al., 2017), do not detract from the findings. Despite its limitations, this article has important implications. These findings suggest a role played by institutions in shaping inequality through racialised classification systems (Massey, 2007; Tilly, 1998). Private financial institutions, in partnership with the federal government, placed neighbourhoods on different trajectories almost a century ago (Jackson, 1985). Lines drawn by HOLC appraisers segregated wealth from poverty for generations (Aaronson et al., 2017; Hirsch, 1983; Massey and Denton, 1993; Sugrue, 1996). The communities that were explicitly discriminated against for having black residents in the 1930s are still disproportionately home to minority residents.
The HOLC’s power was in the institutionalisation of place-based racism, which set into motion other historical processes beyond its direct descendants (i.e. the FHA and the GI Bill). Urban renewal, the construction of segregated public housing and the practices of private lenders followed the logic of HOLC’s redlining (Connolly, 2014; Jackson, 1985; Rothstein, 2017). Dramatically uneven urban and suburban development via mortgage lending remains an important driver of socio-spatial inequality, as do perceptions of residents of both advantaged and disadvantaged metropolitan areas (Smith et al., 2001). While breaking a cycle of disadvantage that has lasted close to a century is difficult, building an understanding of the potential role of spatial marking on the temporal rigidity of the economic organisation of neighbourhoods is a crucial research task. This article shows that the geographic patterns of exclusion and exploitation are remarkably stable. Given the path dependency that explains much of the uneven development that has characterised metropolitan areas, a key challenge is how to intervene in ways that will alter such longstanding patterns.
Supplemental Material
USJ947341_Supplemental_material – Supplemental material for Contemporary echoes of segregationist policy: Spatial marking and the persistence of inequality
Supplemental material, USJ947341_Supplemental_material for Contemporary echoes of segregationist policy: Spatial marking and the persistence of inequality by Jacob Faber in Urban Studies
Footnotes
Declaration of conflicting interests
The author declared no potential conflicts of interest with respect to the research, authorship, and/or publication of this article.
Funding
The author received no financial support for the research, authorship, and/or publication of this article.
Supplemental material
Supplemental material for this article is available online.
Notes
References
Supplementary Material
Please find the following supplemental material available below.
For Open Access articles published under a Creative Commons License, all supplemental material carries the same license as the article it is associated with.
For non-Open Access articles published, all supplemental material carries a non-exclusive license, and permission requests for re-use of supplemental material or any part of supplemental material shall be sent directly to the copyright owner as specified in the copyright notice associated with the article.