
Abstract
Prior studies suggest that middle-income Americans are more likely to move to predominately white, low-income neighbourhoods than predominately black or Latino neighbourhoods. Given that black and Latino neighbourhoods are, on average, lower income and higher in poverty than low-income, white neighbourhoods, it may be that gentrification in these neighbourhoods is a different kind of change than that occurring in predominately white neighbourhoods. Using Census data from 1970 to 2010 for 275 Metropolitan Statistical Areas, I find that racial composition influences not only whether gentrification occurs, but how it occurs and whether it influences racial demographics. Majority white gentrifying tracts were more likely to experience an increase in higher-income residents and white residents, while majority non-white gentrifying tracts experienced an increase in higher-educated but not higher-income residents, and an increase in white residents and decrease in black and Latino residents. Racial composition thus contributed to the kind of gentrification that a tract experienced and the extent to which gentrification produced racial change. These findings suggest that race affects not only where gentrification occurs, as previously established, but also the kind of class and racial changes a neighbourhood experiences. Ultimately, this article suggests that gentrification neither unfolds in one way nor affects all neighbourhoods the same way.
Gentrification studies have documented changes in housing, infrastructure and residents that result in low-income neighbourhoods becoming middle class, including a number of subtypes. State-led gentrification is driven by government investment (Hyra, 2008), studentification by college students (Smith, 2005) and super-gentrification by upper-class in-movers to middle-class neighbourhoods (Lees, 2010). Yet, quantitative studies of gentrification, a term I use broadly to include any increase in the class standing of neighbourhood residents, 1 only measure changes in the socioeconomic status of neighbourhood residents and increases in property values, without considering subtypes. These methodological differences in (1) how the process of gentrification is identified and (2) whether subtypes are measured likely contribute to the seemingly contradictory results between qualitative and quantitative studies of gentrification and race (Brown-Saracino, 2017). Quantitative studies have found that gentrification is most likely to occur in majority white neighbourhoods (Galster et al., 2003; Hwang, 2015; Hwang and Sampson, 2014; Owens, 2012; Owens and Candipan, 2018; Timberlake and Johns-Wolfe, 2016), but qualitative studies suggest that middle-class people are moving into low-income, majority non-white neighbourhoods (Anderson and Sternberg, 2012; Berrey, 2005; Betancur, 2002; Boyd, 2008; Dávila, 2004; Freeman and Cai, 2015; Hwang, 2015; Moore, 2009; Pattillo, 2008; Perez, 2004; Powell and Spencer, 2002; Taylor, 2002; Wilson and Taub, 2011).
I argue that operationalising gentrification as only one change masks the variation that gentrifying neighbourhoods experience based on racial composition. This argument builds on the history of race and place in the US. Black neighbourhoods historically experienced less investment than white neighbourhoods, and thus came to have higher rates of poverty and vacancies (Hirsch, 1993; Sugrue, 1996), more dilapidated and lower-performing schools (Bierbaum, 2018; Noguera, 2003) and fewer commercial strips (Darden, 2010; Helling and Sawicki, 2003). This long-term trend of disinvestment in black neighbourhoods means they could experience a different kind of gentrification from white neighbourhoods. In this article, I answer the following questions: What kind of non-white neighbourhoods experience higher-class in-movers? What kind of socioeconomic changes do these neighbourhoods experience? And how do these changes affect subsequent neighbourhood racial composition?
Using Census data from 1970 to 2010 for 275 Metropolitan Statistical Areas (MSAs), I show that racial composition influences not only whether gentrification occurs, but how gentrification unfolds. Gentrifying tracts were increasingly diverse between 1970 and 2010, changing from overwhelmingly majority white to over one-third majority non-white. These predominately black and Latino gentrifying tracts were high-poverty, high-vacancy neighbourhoods in comparison to the predominately middle-class white gentrifying tracts. These differences in neighbourhood characteristics by race led to different kinds of gentrification. Majority black and Latino gentrifying tracts were more likely to experience ‘marginal gentrification’, or gentrification by in-movers with higher educational attainment but similar incomes to low-income residents (Rose, 1984). In contrast, majority white tracts were more likely to experience gentrification characterised by higher-educated and higher-income residents to (1) low-income tracts through ‘income gentrification’ or (2) ‘super-gentrification’ in middle-income tracts (Centner, 2008; Lees, 2010).
These racial variations in the demographic changes associated with gentrification also had implications for racial change. Gentrifying tracts generally experienced an increase in white and Asian residents and a decrease in black and Latino residents. While these racial changes were less likely in tracts that experienced marginal gentrification, majority black tracts that experienced marginal gentrification had the highest odds of racial change. Because majority black tracts were more likely to experience racial change, these findings suggest that majority black neighbourhoods may be more vulnerable to racial change when exposed to any type of gentrification than other neighbourhoods.
The findings suggest that racial composition contributes not just to whether gentrification occurs in a neighbourhood, but also to subsequent class and racial changes. While the quantitative literature has presumed that socioeconomic change occurs similarly across all gentrifying neighbourhoods, this study shows that change varies depending on racial demographics. These results highlight the need to theorise beyond gentrification as a process of class change to a process by which neighbourhoods’ racial and class characteristics are viewed, interpreted and responded to by multiple actors who influence whether or not gentrification occurs, how it manifests and subsequent change in residential composition.
Race and gentrification in the prior literature
Globally, race and class are highly correlated due to the legacies of slavery, colonisation and modern forms of structural and institutional racism (Christopher, 2001; Du Bois, 1899; Musterd, 2005). While scholars have predominately defined the term gentrification as a process of class change, race and class are inherently interconnected, as seen in patterns of segregation. Given their spatial relationship, race and class are likely to influence where and when gentrification occurs. In fact, studies suggest that race influences gentrification in three ways: where it occurs, how it occurs and whether it changes the racial composition of gentrifying neighbourhoods.
Race and where gentrification occurs
Quantitative studies suggest that race influences where gentrification occurs. Low-income black neighbourhoods have been the least likely to gentrify (Freeman and Cai, 2015; Galster et al., 2003; Hwang, 2015; Hwang and Sampson, 2014; Owens, 2012; Owens and Candipan, 2018; Timberlake and Johns-Wolfe, 2016). In fact, broader studies of neighbourhood change find that low-income black neighbourhoods are more likely to stay stagnant or decline than experience increases in the class standing of neighbourhood residents (Landis, 2015; Owens, 2012; Sampson, 2012).
In comparison, Latino neighbourhoods are just as likely, and sometimes more likely, to gentrify as white neighbourhoods (Ellen and O’Regan, 2008; Owens and Candipan, 2018; Timberlake and Johns-Wolfe, 2016). Finally, white neighbourhoods are the most likely to gentrify (Galster et al., 2003; Hwang, 2015; Hwang and Sampson, 2014; Owens, 2012; Owens and Candipan, 2018; Timberlake and Johns-Wolfe, 2016). Thus, the initial racial composition of a neighbourhood influences where gentrification occurs.
Race and how gentrification occurs
While the definition of gentrification focuses on the outcome of a higher-income neighbourhood, qualitative studies suggest that there are several types of gentrification, which might vary by racial composition. Many studies of gentrification in the 1960s to 1980s focused on the process of marginal gentrification during which higher-educated, predominately white in-movers bought homes in predominately black and Latino, low-income neighbourhoods (Kasinitz, 1988; Lees et al., 2008; Smith, 1996). Studies of gentrification in the 1990s introduced the subtype of state-led gentrification, documenting how federally and state-funded projects like HOPE VI created large-scale gentrification in many low-income black and Latino neighbourhoods (Bridge et al., 2012; Goetz, 2011; Hyra, 2008). Finally, studies of more recent gentrification have captured ‘black gentrification’ with black middle-class gentrifiers (Pattillo, 2008; Taylor, 2002), ‘super-gentrification’ with upper-income gentrifiers (Centner, 2008; Lees, 2010) and ‘tourism gentrification’ with gentrification driven by tourist businesses (Gotham, 2005).
Not all of these studies directly discuss race, but many of these subtypes suggest an association with specific racial demographics. For instance, most upper-class Americans are white or Asian (Reeves and Joo, 2017), thus super-gentrification is most likely to involve white and Asian gentrifiers. Similarly, programmes like HOPE VI targeted public housing, which was disproportionately constructed in black neighbourhoods (Freeman, 2019). What we know less about are the types of gentrification that are most prevalent in white neighbourhoods, as qualitative studies have predominately focused on black and Latino neighbourhoods in the US (Brown-Saracino, 2017; Fallon, 2016).
Gentrification and racial change
Regardless of how gentrification unfolds, prior studies suggest that it is generally associated with racial change. In the US, this is driven by higher-income people being disproportionately white (Reeves and Joo, 2017). Both qualitative and quantitative studies find that gentrification is generally associated with an increase in white residents (Freeman, 2006; Owens and Candipan, 2018; Smith, 1996; Timberlake and Johns-Wolfe, 2016). In fact, Freeman and Cai (2015) find an overall increase in white Americans living in predominately black neighbourhoods over time.
In sum, the prior literature on race and gentrification suggests three potential responses to my research questions. First, gentrification will be more likely in majority white tracts. Second, majority white tracts will experience a different kind of gentrification from that of majority black and Latino tracts. Third, gentrification will increase the number of white residents.
Measures and methods
To measure gentrification, I use US Census data for 1970, 1980, 1990, 2000 and 2010 from the Neighbourhood Change Database (NCDB). The NCDB provides Census data with normalised tract boundaries across all five years to 2010 tract definitions, which allows for comparisons of the same geographic areas over time. The five time periods of data include 57,518 city tracts from 275 MSAs, which consist of 287,590 tract periods. I focused on city tracts which have at least 50% of housing units in an urban area, to ensure that tracts identified as gentrifying were not actually experiencing suburbanisation.
Measuring gentrification and its subtypes
I measure gentrification as a change in a tract’s class demographics and housing values, building on previous operationalisations (Atkinson and Wulff, 2009; Bostic and Martin, 2003; Freeman, 2005; Hwang and Sampson, 2014; Owens, 2012; Timberlake and Johns-Wolfe, 2016; Wyly and Hammel, 1998). I define a tract as gentrifying if it had at least a half standard deviation increase in the class characteristics of residents and in the price of housing greater than the MSA between Census years. Specifically, I code a tract as gentrifying if it had (1) a percentage change increase in either (a) the proportion of residents with a college degree or higher or (b) mean family income, 2 and (2) a percentage change increase in either (a) average housing values or (b) average rental costs, 3 with both increases being at least a half standard deviation above changes in the MSA. 4 Thus, an increase in socioeconomic status could be due to the proportion of residents with a college degree or higher, mean household income or both. I compare the change in each tract to the MSA in order to control for broader social and economic changes in each Census year. While other studies use a threshold of a specified percentage change (Ellen and O’Regan, 2011; Owens, 2012; Owens and Candipan, 2018), I adjust the threshold to each MSA. I use a half standard deviation rather than a full standard deviation in order to produce comparable estimates to other studies (Ding et al., 2016; Freeman, 2005; Owens, 2012; Wyly and Hammel, 1998). Using this threshold helps to reduce the likelihood that changes in the characteristics of tract residents are due to increases in the education and income of long-term tract residents rather than recent in-movers, because increases must exceed average changes in the MSA. In theory, all MSA tracts could experience an increase in college-educated residents due to the overall increase in college access, for example. I only identify tracts as gentrifying if they experience change exceeding the average MSA change, because I cannot identify whether in-movers or long-term residents drive a measured increase in publicly available Census data.
Some tracts had missing data because of either zero population or no data collection for the geographic areas in a Census year. Rather than assuming an actual value of zero, I recoded zero values to missing. I then measured whether gentrification occurred between 1970 and 1980, 1980 and 1990, 1990 and 2000 and 2000 and 2010. Missing values made calculations impossible for 32% of tracts in the 1970 to 1980 period, 17% for 1980 to 1990 and 3% for both 1990 to 2000 and 2000 to 2010. Among the remaining tracts, 1387 experienced gentrification in 1970 to 1980, 6820 in 1980 to 1990, 7078 in 1990 to 1000 and 8336 in 2000 to 2010.
As shown in Table 1, I find that gentrification occurred in 4% to 14% of tracts during the four periods of study. 5 This includes three mutually exclusive types. Super-gentrification captures a change in a tract’s residents from middle to upper class (Centner, 2008; Lees, 2010), which was indicated if a tract experienced gentrification and had an average household income in the third quintile or higher. Super-gentrification was present in 45% to 64% of gentrifying tracts.
Tracts by gentrifying, gentrification type, racial composition and year.
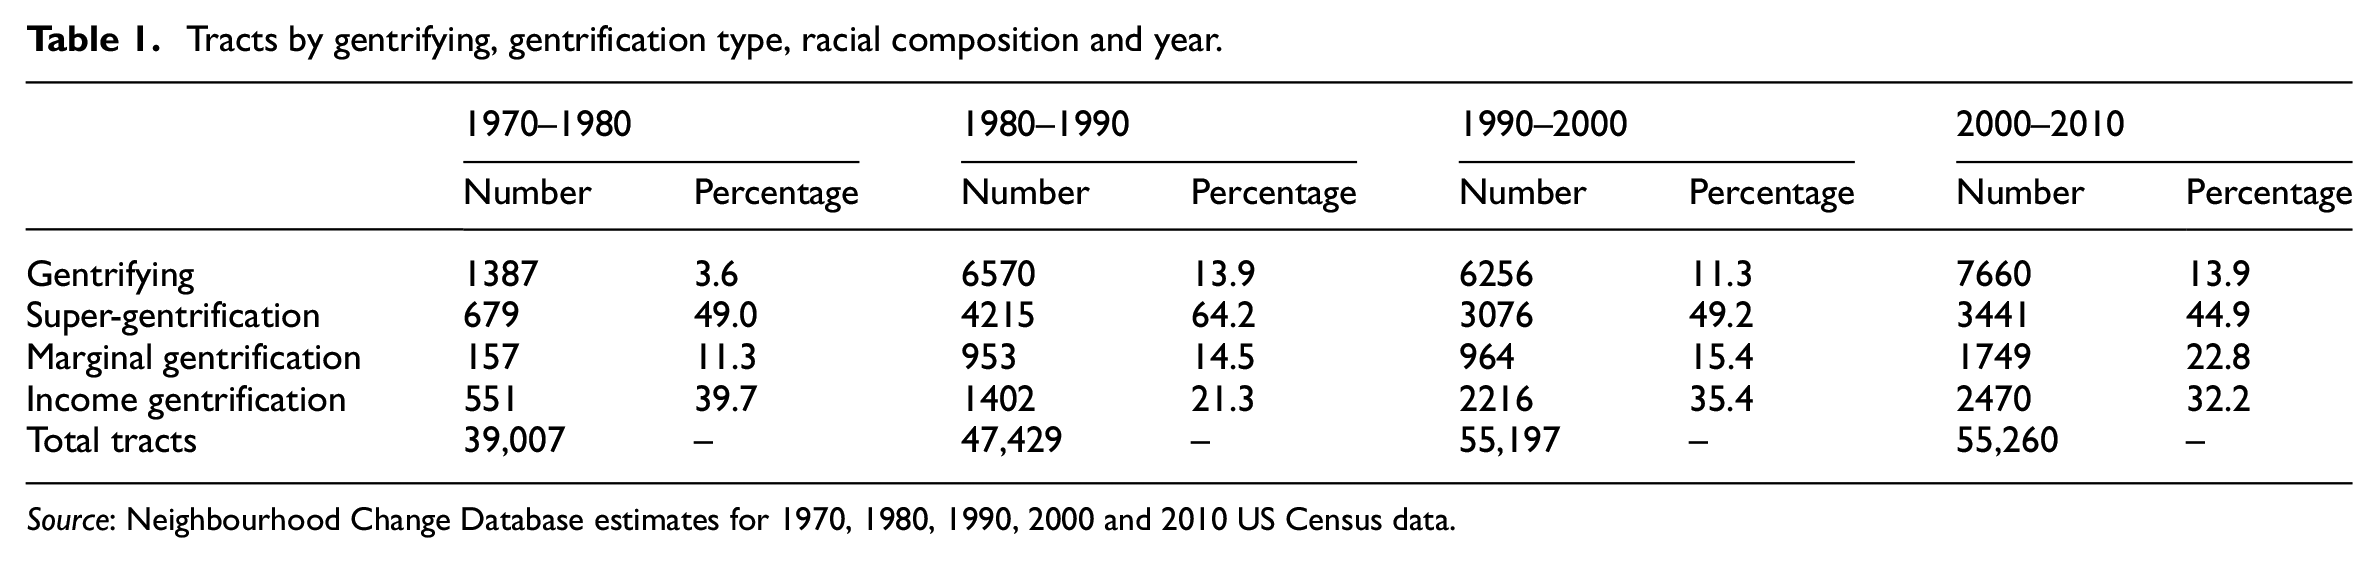
Source: Neighbourhood Change Database estimates for 1970, 1980, 1990, 2000 and 2010 US Census data.
Marginal gentrification captures lower-income tracts with increases in the education, but not income, of tract residents (Lees et al., 2008; Smith, 1996). This subtype often marks the first wave of gentrification (Lees et al., 2008). Marginal gentrification was the least frequently occurring subtype, with 11% to 23% of gentrifying tracts.
Finally, income gentrification captures the remaining lower-income gentrifying tracts which experienced an increase in higher-income residents, including tracts that experienced an increase in the educational attainment and income of tract residents. Income gentrification captures the traditional definition of gentrification, which is associated with an increase in the incomes of residents of low-income neighbourhoods (Smith, 1996). These tracts made up 21% to 40% of gentrifying tracts over time.
Measuring race
My analysis uses the racial categories non-Latino white, black, and Asian and Latino, 6 which varied by Census year. The 1970 Census data do not include a measure for Asian. 7 In addition, the 2000 data allowed respondents to select more than one race for the first time, which the NCDB converted to one racial category. 8
In the analyses below, I use measures that indicate the majority racial composition of each tract because prior studies show that there is a non-linear relationship between percentage black and the likelihood of gentrifying (Hwang and Sampson, 2014). As the percentage black in a tract increased, Hwang and Sampson (2014) found a non-linear decrease in the likelihood of a tract experiencing gentrification, which had the largest effects for majority black tracts. I calculated the majority racial composition based on a group being 50% or more of a tract’s residential population. A tract that was 60% black, 30% Latino and 10% white was coded as majority black. If no racial group made up 50% or more, I coded it as ‘no racial majority’. In 2000, tracts with no racial majority were on average 49.7% white, 22.4% black, 28.5% Latino and 12.5% Asian. I excluded all majority Asian tracts due to their small sample size and low likelihood of gentrifying over the period of study. 9
Data limitations
Using Census data to measure gentrification has several limitations. First, Census tract boundaries do not necessarily align with neighbourhoods. Thus, while my findings have implications for processes affecting neighbourhoods, I discuss tracts. Second, Census data is collected every 10 years, so any changes that happen between those years are not captured. This infrequent data is most problematic if a tract has experienced an increase associated with gentrification, followed by a decline that would appear as no change. Finally, Census data do not allow for the tracking of household or individual mobility. I use an MSA-level threshold in my operationalisation of gentrification in order to minimise the effect of this, as discussed above.
Race and gentrification over time
Gentrifying tracts were predominately majority white across the period of study, although they grew more diverse over time. As shown in Table 2, tracts of all racial compositions experienced gentrification in every period of study, although the proportion varied and changed over time. Overall, majority non-white gentrifying tracts increased. Between 1% and 22% of majority black tracts and 8% and 22% of majority Latino tracts experienced gentrification.
Total and gentrifying tracts by majority racial composition and year.
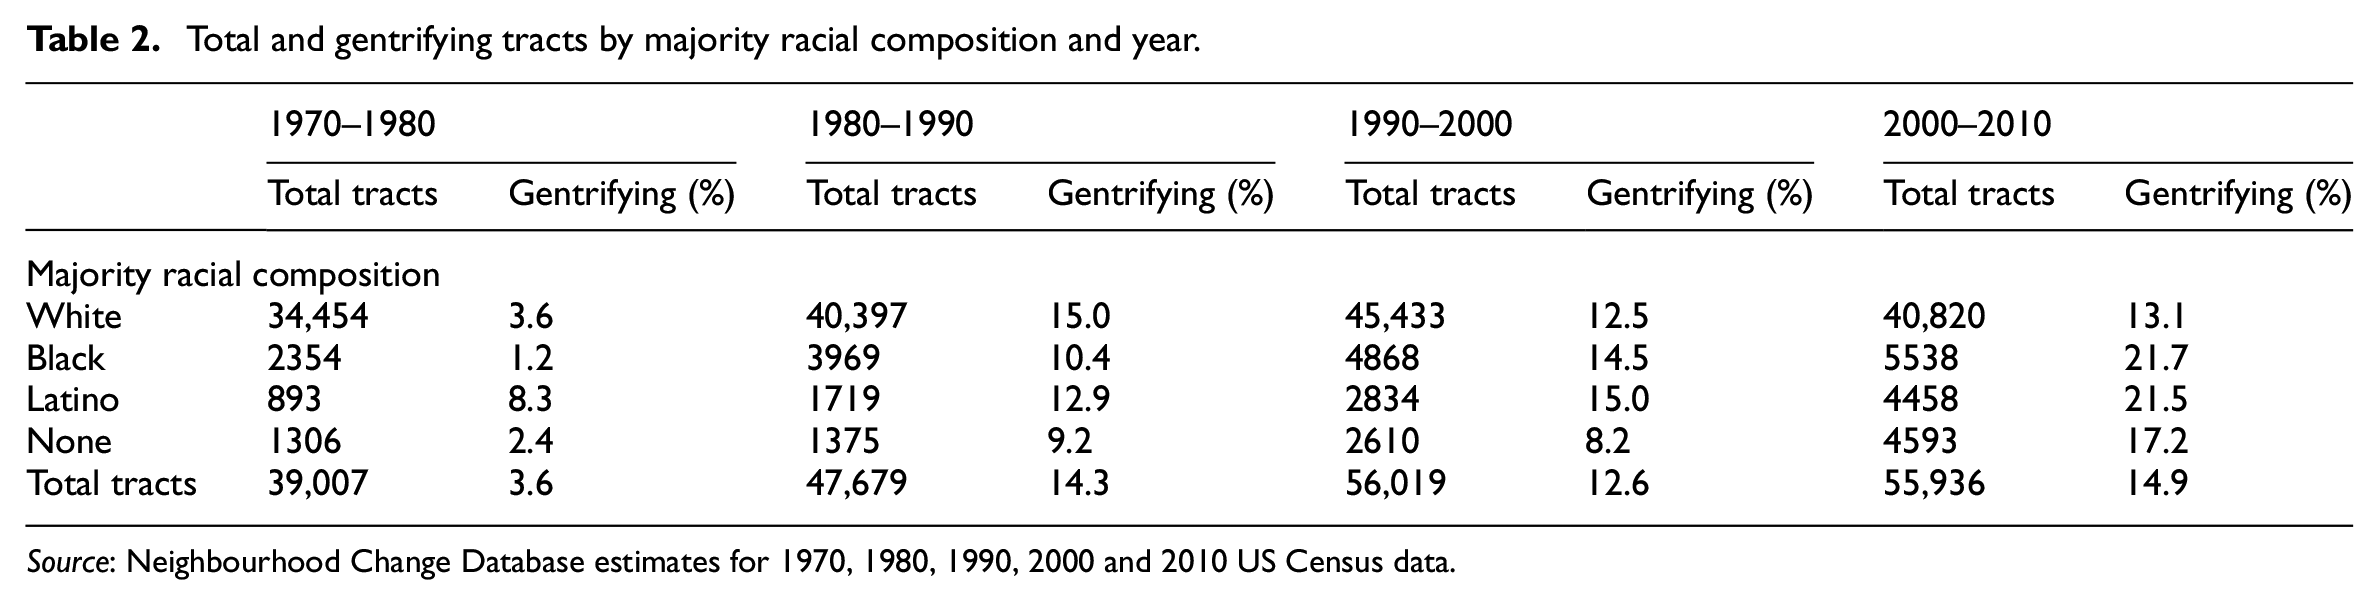
Source: Neighbourhood Change Database estimates for 1970, 1980, 1990, 2000 and 2010 US Census data.
Because of the large number of majority white tracts overall, most gentrifying tracts were majority white over time. However, the proportion of non-white tracts that were gentrifying increased from less than 1% of gentrifying tracts in the 1970 to 1980 period to 36% in 2000 to 2010. Most of the change was due to black and Latino tracts, as they were 2% and 5% of gentrifying tracts in 1970 to 1980 and 14% and 12% in 2000 to 2010. Despite this change, majority white tracts were the largest proportion of gentrifying tracts in every time period.
To further test these descriptive findings, I used a logistic regression model with robust standard errors to predict how a tract’s initial racial composition affected the likelihood of a tract gentrifying in each Census year, while controlling for other factors such as class composition, housing conditions and MSA. The outcome of interest in all models is the likelihood of gentrifying, which is equal to 0 when a tract has no likelihood and equal to 1 when it has a likelihood. I ran the models separately for each Census year.
In the models presented in Table 3, I control for a number of theoretically and empirically relevant resident, tract and metropolitan characteristics that may influence the probability of gentrifying. The resident characteristics capture factors that contribute to the desirability of a neighbourhood to potential in-movers. The tract poverty rate provides an indicator of the class composition of the tract (Ellen and O’Regan, 2008), which is associated with perceptions of crime and violence (Sampson, 2012), a factor that influences neighbourhood desirability. I also include average family income to control for class differences in tracts by race. I control for the length of time that residents have lived in a tract to capture both the population stability and the semi-recent (prior five years) popularity of the tract. 10 Finally, I include the percentage of children because a significant presence of children in a neighbourhood is an important factor for families making mobility decisions (Crowder et al., 2012; Fischer et al., 2004), but could also dissuade younger in-movers without children (Heidkamp and Lucas, 2006; McKinnish et al., 2010).
Logistic model results for experiencing gentrification, by majority racial composition and year.
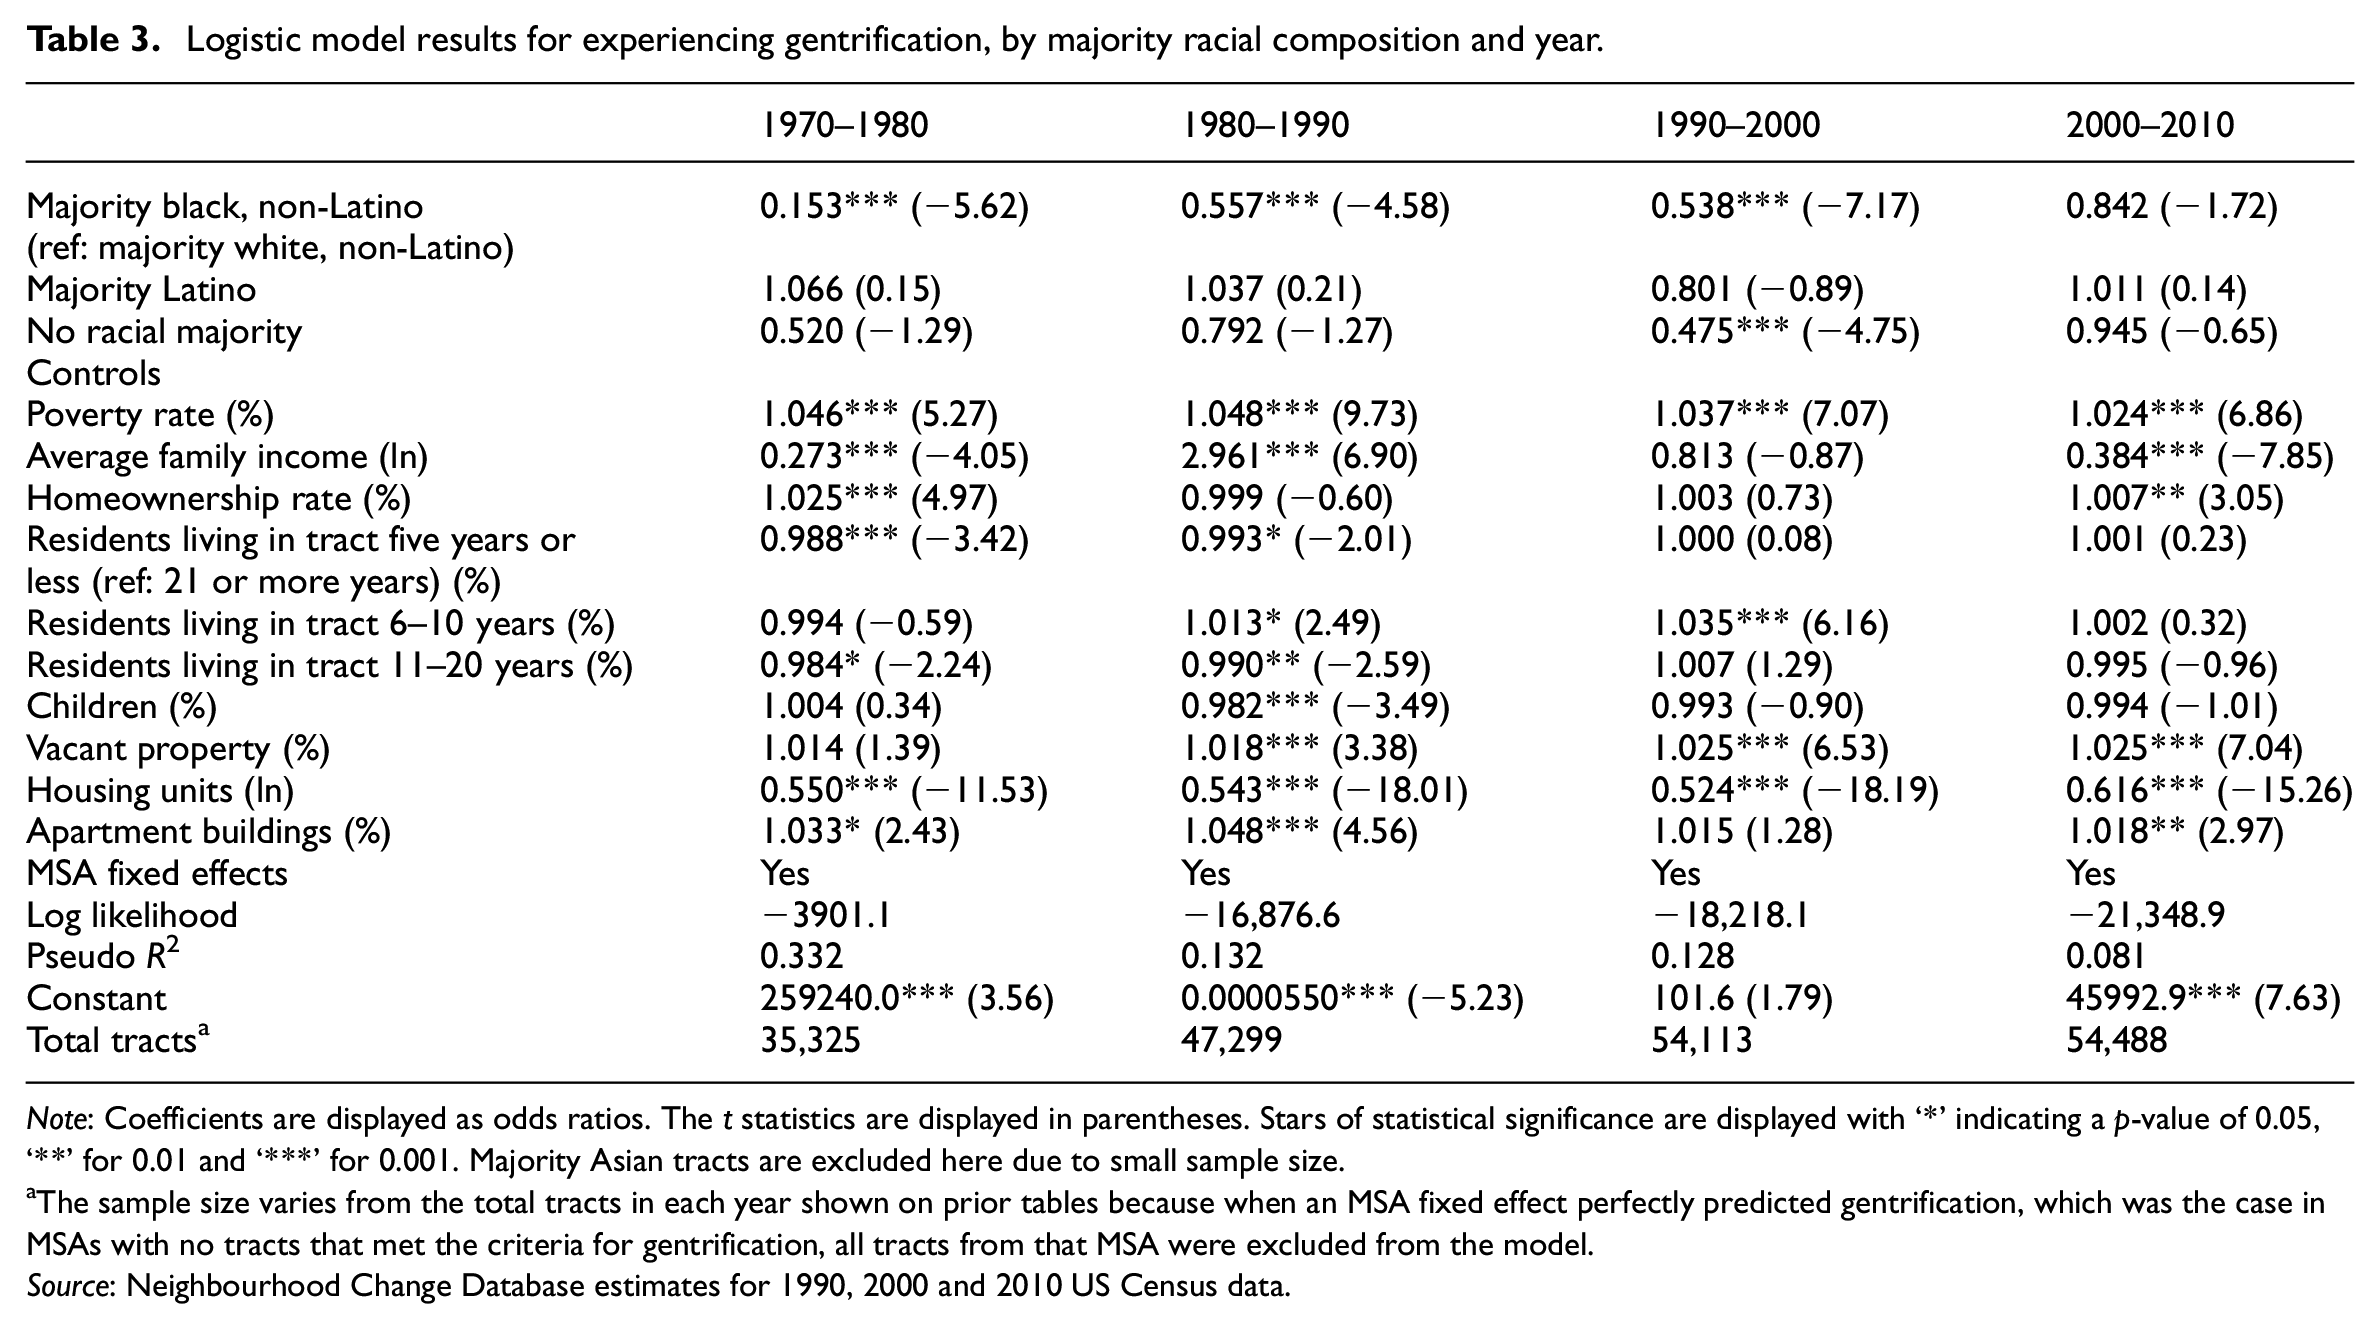
Note: Coefficients are displayed as odds ratios. The t statistics are displayed in parentheses. Stars of statistical significance are displayed with ‘*’ indicating a p-value of 0.05, ‘**’ for 0.01 and ‘***’ for 0.001. Majority Asian tracts are excluded here due to small sample size.
The sample size varies from the total tracts in each year shown on prior tables because when an MSA fixed effect perfectly predicted gentrification, which was the case in MSAs with no tracts that met the criteria for gentrification, all tracts from that MSA were excluded from the model.
Source: Neighbourhood Change Database estimates for 1990, 2000 and 2010 US Census data.
The controls for characteristics of housing serve as measures of the attractiveness and availability of an area to higher-income in-movers. Homeownership captures the availability of potential buying options. Similarly, percentage of vacant property captures both the availability of property and the potential for visible disorder (Landis, 2015; Smith, 1996). The natural log of the total housing units provides a measure of how residential a tract is. Finally, I control for the presence of apartment buildings or buildings with five or more bedrooms to indicate the overall nature of housing stock. The final control variables are MSA-level fixed effects, which capture any unmeasured, time-invariant characteristics of the metropolitan area that might influence the results for its tracts (Allison, 2005). These factors include racial composition (Charles, 2006; Crowder et al., 2012; Emerson et al., 2001; Fischer et al., 2004; Logan, 2013; Massey and Fischer, 2003), labour market conditions (Sassen, 2011; Smith, 2002) and housing market conditions (Quigley and Raphael, 2004) during the year prior to gentrification. 11 I use these control variables in all subsequent regression models.
Table 3 shows the likelihood of a tract gentrifying, as predicted by the tract’s majority racial composition in the prior census year. Thus, the coefficients for the 1970 to 1980 period show the effect of a tract being majority black, majority Latino or having no racial majority in 1970 on the likelihood of a tract gentrifying by 1980. The coefficient is in comparison to majority white, so a coefficient less than one is a lower probability than a majority white tract and a coefficient greater than one is a higher probability.
Overall, there are two consistent patterns in the relationship between race and gentrification. 12 First, the results in Table 3 confirm that gentrification was less likely in majority black tracts than majority white (Ellen and O’Regan, 2008; Freeman and Cai, 2015; Galster et al., 2003; Hwang, 2015; Hwang and Sampson, 2014; Landis, 2015; Owens, 2012; Owens and Candipan, 2018; Timberlake and Johns-Wolfe, 2016). This pattern was consistent across 1970 to 2000, ranging from 85% lower odds in the 1970 to 1980 period than majority white tracts to 46% lower odds in the 1990 to 2000 period. The only period in which majority black tracts had similar odds of gentrifying as majority white tracts was the 2000 to 2010 period.
Second, the racial composition of tracts that were just as likely to gentrify as majority white tracts suggests an increasing non-black diversity over time. The most consistent patterns of this trend were for majority Latino tracts, which were the only tracts consistently just as likely as majority white tracts to gentrify in every Census year (Ellen and O’Regan, 2008; Owens and Candipan, 2018; Timberlake and Iceland, 2007). In contrast, tracts with no racial majority were equally likely to gentrify as majority white tracts in every period but 1990 to 2000 when they had 53% lower odds. Thus, by the 2000 to 2010 period, gentrification was equally likely across tracts of all racial compositions while controlling for other factors. 13
In sum, gentrification was most likely in majority white and Latino tracts, followed by tracts with no racial majority and majority black tracts, for most of the 1970 to 2010 period. This replicates the findings of previous studies of race and gentrification, but also masks whether tracts of different racial compositions experience similar kinds of gentrification.
Racial variation in where and how gentrification occurs
While gentrification is generally less likely in majority black tracts over time, between 2% and 14% of gentrifying tracts were majority black over the period of study. In this section, I explain how gentrifying tracts of different racial compositions vary in their characteristics and how those qualitative differences affect how gentrification unfolds. I find that tracts that are majority black, majority Latino or have no racial majority have demographic characteristics associated with poverty, and thus experience a different kind of gentrification from majority white tracts.
Gentrifying majority white tracts were distinct in both socioeconomic and housing characteristics over the period of study. In particular, majority white gentrifying tracts had lower rates of poverty, higher average family incomes, higher rates of homeownership and lower rates of vacancy in the census year prior to gentrification than majority non-white tracts and tracts with no racial majority. These characteristics were most distinct from majority black tracts followed by majority Latino, which had the highest poverty and vacancy rates, and the lowest average family income and homeownership rates on average. Majority white gentrifying tracts in 2010 had an average family income of US$64,197 in 2000, a 67% homeownership rate, an 11% poverty rate and an 8% vacancy rate. In contrast, majority black gentrifying tracts had an average family income of US$35,970, a 40% homeownership rate, a 34% poverty rate and a 14% vacancy rate. These differences were present even within gentrifying tracts in the same income quintile. For instance, comparing the majority white and black gentrifying tracts in the lowest income quintile in 2000, majority white tracts had a higher average family income by US$5477, a higher homeownership rate by nine percentage points, a lower poverty rate by 15 percentage points and a lower vacancy rate by four percentage points. Overall, majority white gentrifying tracts were qualitatively distinct from gentrifying majority black and Latino tracts.
These differences in tract-level characteristics could attract different types of change, which I investigated by analysing the type of gentrification by majority racial composition. As shown in Figure 1, the distribution of the types of gentrification were not the same by majority racial composition. Majority white tracts were predominately higher-income tracts experiencing super-gentrification. In fact, over 60% of gentrifying majority white tracts experienced super-gentrification in both 1990 to 2000 and 2000 to 2010. Income gentrification was the next most frequent for majority white gentrifying tracts (24% in both periods), followed by marginal gentrification (12% and 13%). In contrast, tracts that were majority black, majority Latino or had no racial majority experienced income gentrification in 64% to 72% of tracts in 1990 to 2000 and 43% to 49% of tracts in 2000 to 2010. For these non-white gentrifying tracts, marginal gentrification was second most frequent (18% to 29% in 1990 to 2000 and 25% to 42% in 2000 to 2010). Finally, super-gentrification was rare in majority black and Latino tracts, at around 10% or less. Thus, majority white gentrifying tracts were more likely to be middle-income tracts that became higher income, while majority black, majority Latino and tracts with no racial majority were more likely to be low-income tracts that experienced increases in income or education.
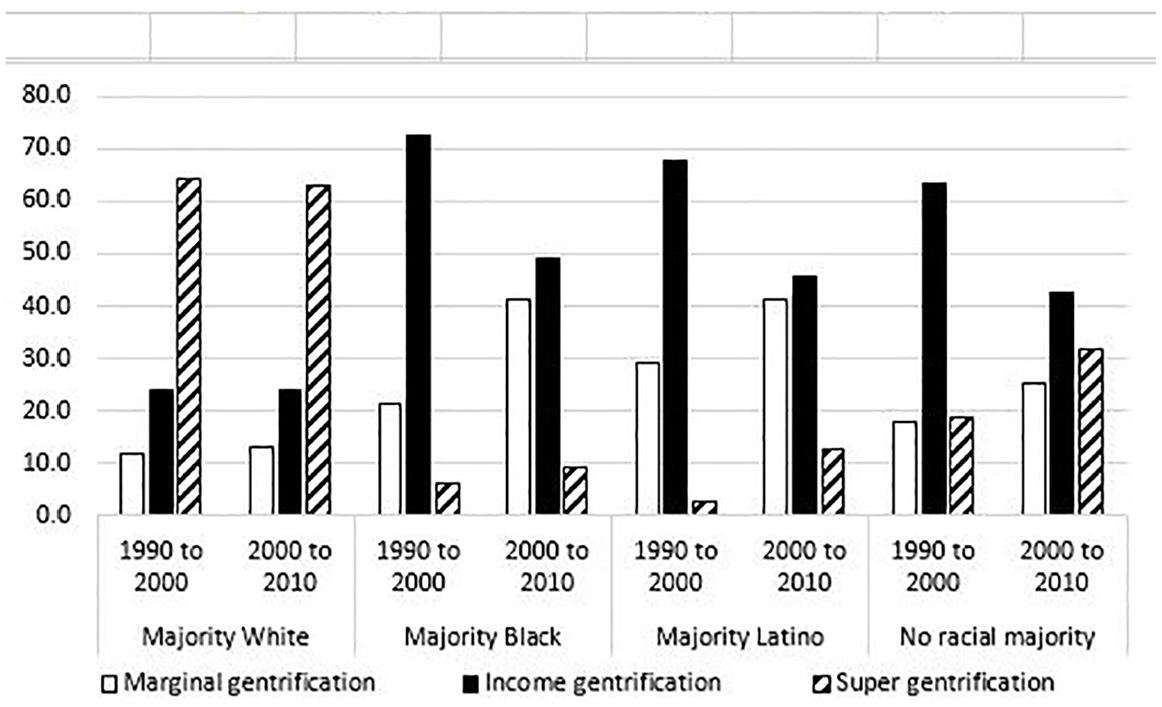
Type of gentrification by racial majority.
These descriptive findings could be due to other differences in the characteristics of gentrifying tracts by race, so I further tested whether gentrification subtype varied by majority racial composition while controlling for resident, tract and metropolitan characteristics. Table 4 shows the results of this logistic regression, with robust standard errors predicting the likelihood of a gentrifying tract experiencing marginal gentrification in the first two columns, income gentrification in the second and super-gentrification in the third. Each of these dependent variables is equal to either 1 or 0. As shown in the first two columns, marginal gentrification was more likely in tracts that were majority Latino, majority black or had no racial majority than majority white tracts in change between all years, even when controlling for homeownership, poverty, vacancy rates and family income. 14 In fact, the odds of experiencing marginal gentrification increased for majority Latino and no racial majority tracts between 1990 to 2000 and for all non-white tracts between 2000 to 2010. For example, majority Latino gentrifying tracts had a 266% higher odds of experiencing marginal gentrification than majority white gentrifying tracts in change between 1990 and 2000, but a 476% higher odds between 2000 and 2010. The difference was smaller for majority black and no racial majority gentrifying tracts, but they were still more likely than majority white tracts to experience marginal gentrification in the 1990 to 2000 period (87% higher odds for tracts with no racial majority) and the 2000 to 2010 period (222% higher odds for majority black tracts and 136% higher for tracts with no racial majority). 15
Logistic regression results for experiencing gentrification by type of change.
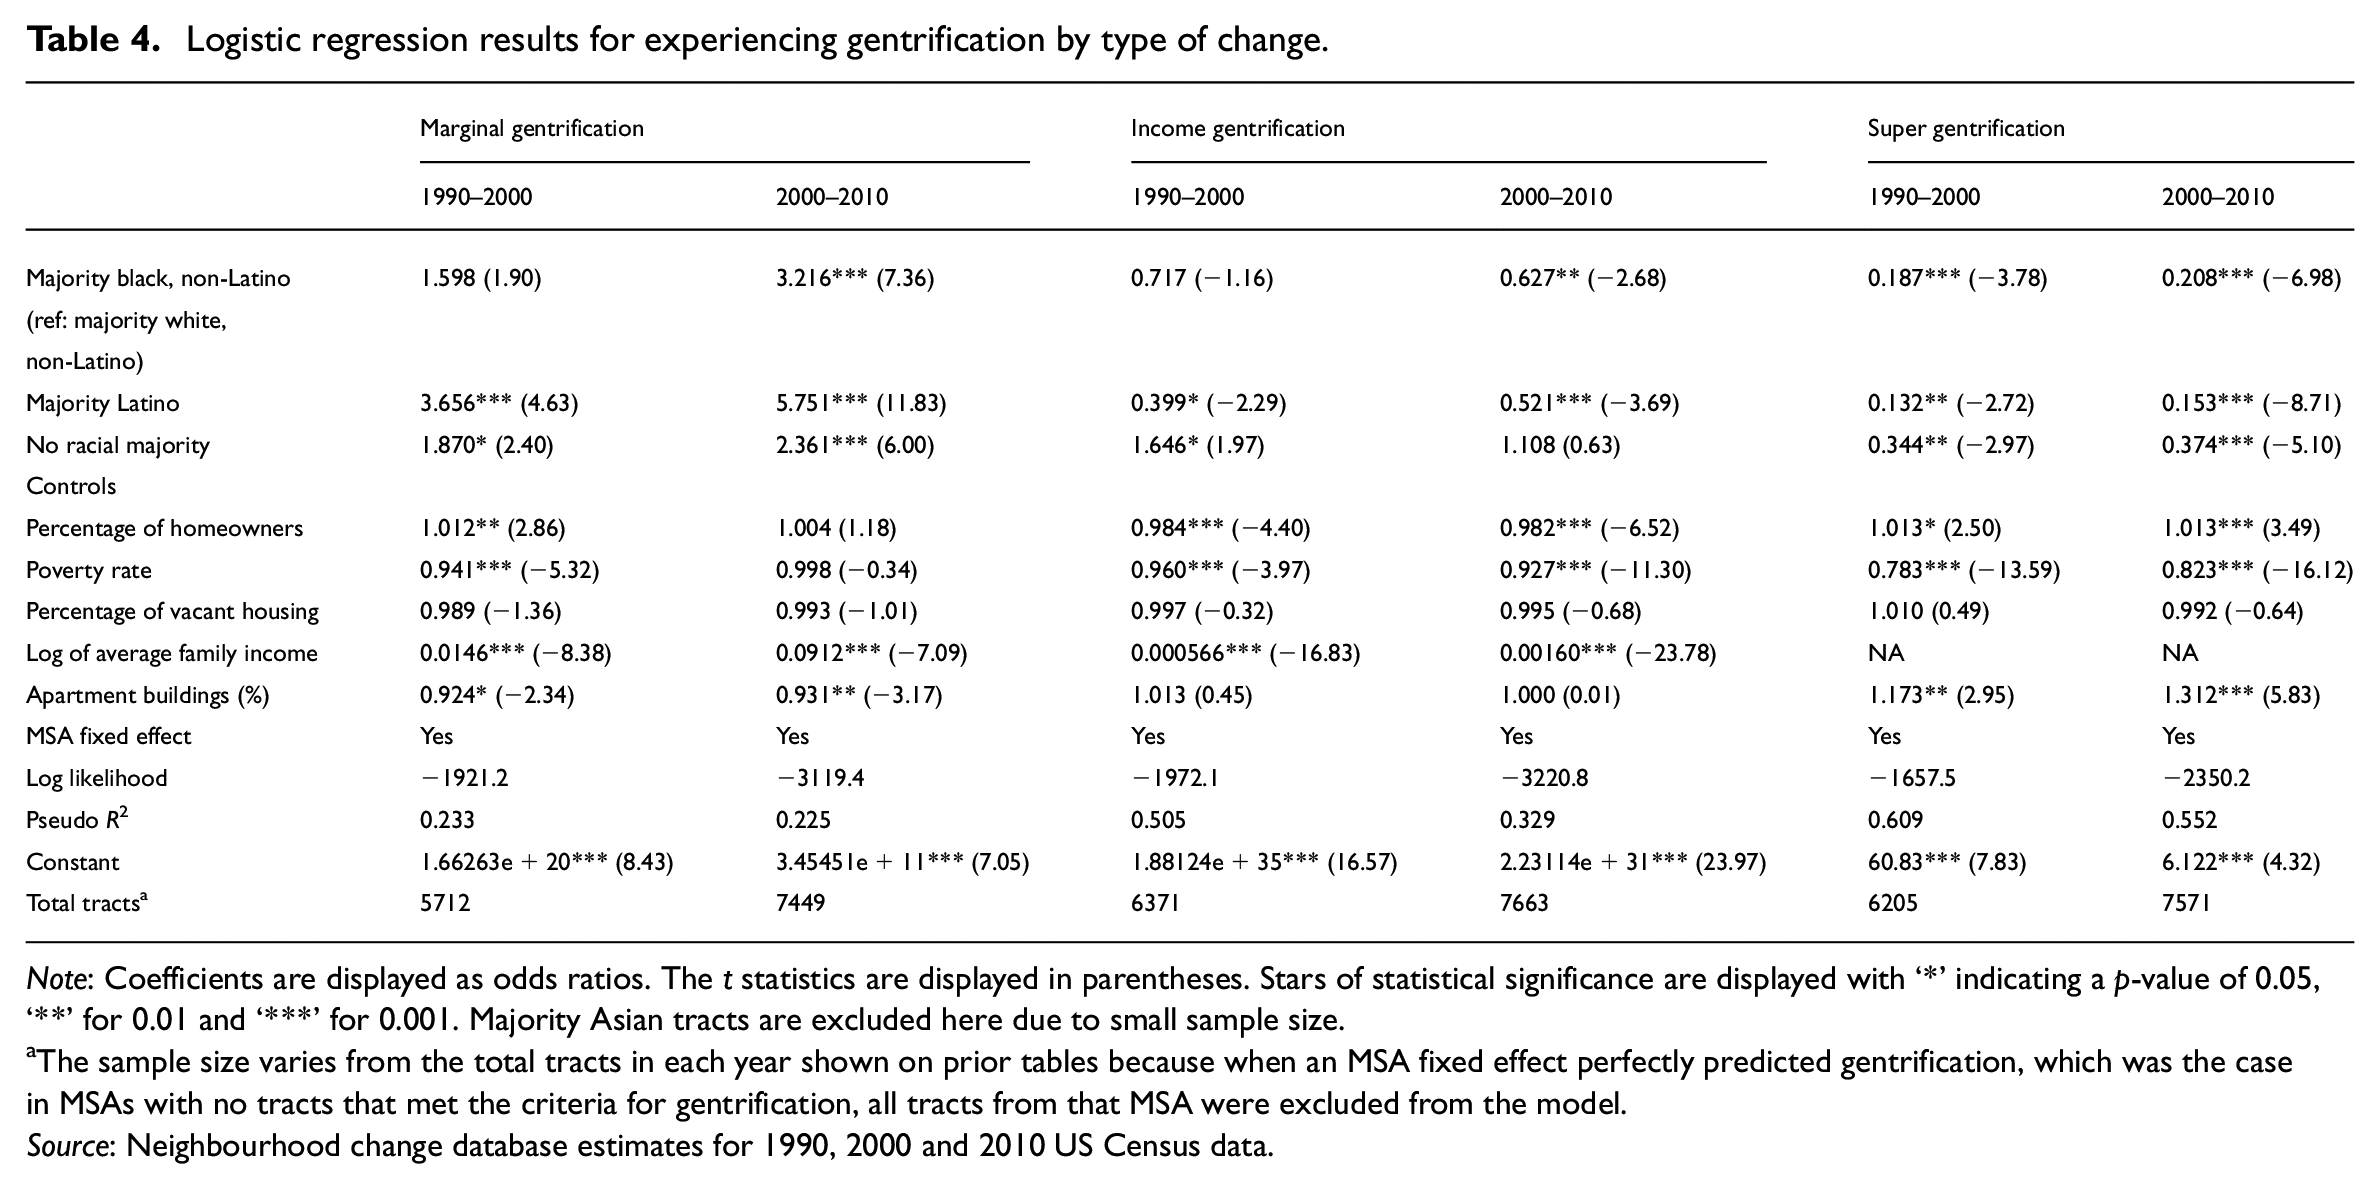
Note: Coefficients are displayed as odds ratios. The t statistics are displayed in parentheses. Stars of statistical significance are displayed with ‘*’ indicating a p-value of 0.05, ‘**’ for 0.01 and ‘***’ for 0.001. Majority Asian tracts are excluded here due to small sample size.
The sample size varies from the total tracts in each year shown on prior tables because when an MSA fixed effect perfectly predicted gentrification, which was the case in MSAs with no tracts that met the criteria for gentrification, all tracts from that MSA were excluded from the model.
Source: Neighbourhood change database estimates for 1990, 2000 and 2010 US Census data.
Super-gentrification, shown in the last two columns, was most likely in majority white tracts in both periods. 16 Majority Latino gentrifying tracts had the lowest likelihood of experiencing super-gentrification in comparison with majority white tracts, with an 87% lower odds in the 1990 to 2000 period and a 85% lower odds in 2000 to 2010. Majority Latino gentrifying tracts were closely followed by majority black tracts with 81% and 79% lower odds, and tracts with no racial majority with 66% and 63% lower odds.
The only results that differed from the descriptive statistics when controlling for differences in tract-level characteristics emerged for income gentrification, shown in the middle columns. While the descriptive findings suggested that it was more likely in non-white tracts, the regression results indicate that income gentrification was only more likely in tracts with no racial majority than majority white tracts during the 1990 to 2000 period, with 65% higher odds. 17 The least likely to experience income gentrification in both periods were majority Latino gentrifying tracts, with 60% lower odds than majority white gentrifying tracts in the 1990 to 2000 period and 48% lower odds in 2000 to 2010. Majority black gentrifying tracts were equally likely to experience income gentrification as majority white tracts in 1990 to 2000, but less likely in 2000 to 2010 with 37% lower odds.
These findings of racial differences in tract-level characteristics and type of gentrification suggest that gentrifying neighbourhoods experience different kinds of change depending on their racial and class characteristics. Predominately poor black and Latino neighbourhoods experienced increases in the educational attainment but not the incomes of residents, while more middle-class white neighbourhoods experienced increases in income, making them upper class. Because higher-income and college-educated Americans are more likely to be white or Asian (Reeves and Joo, 2017), these trends could also affect the racial composition of black and Latino gentrifying tracts.
The implications of gentrification for racial composition
While previous quantitative studies have found racial change in gentrifying tracts, it is unclear whether this is true across subtypes of gentrification. I find that while gentrification generally leads to increases in white and Asian residents and declines in black and Latino residents, the degree of change varies depending on whether a tract is experiencing marginal gentrification, or income or super-gentrification. Income and super-gentrification replicate the broader patterns of gentrification overall, while marginal gentrification produces less racial change, except in majority black tracts.
Table 5 summarises the results from logistic regression models with robust standard errors that test whether there was an increase or decrease in the number of residents in each racial category 18 due to exposure to gentrification in any form and the three subtypes between 1990 to 2000 and 2000 to 2010 by a tract’s majority racial composition. 19 I use an increase or decrease of the number to avoid variations in both the numerator of the percent of a racial category (number of residents in a racial category) and the denominator (total residents in a neighbourhood) that could be associated with gentrification. Looking at whether there is an increase or decrease isolates the general change in presence of each group regardless of the scale of that change.
Logistic regression results predicting racial composition by gentrification type: 1990–2000, 2000–2010.
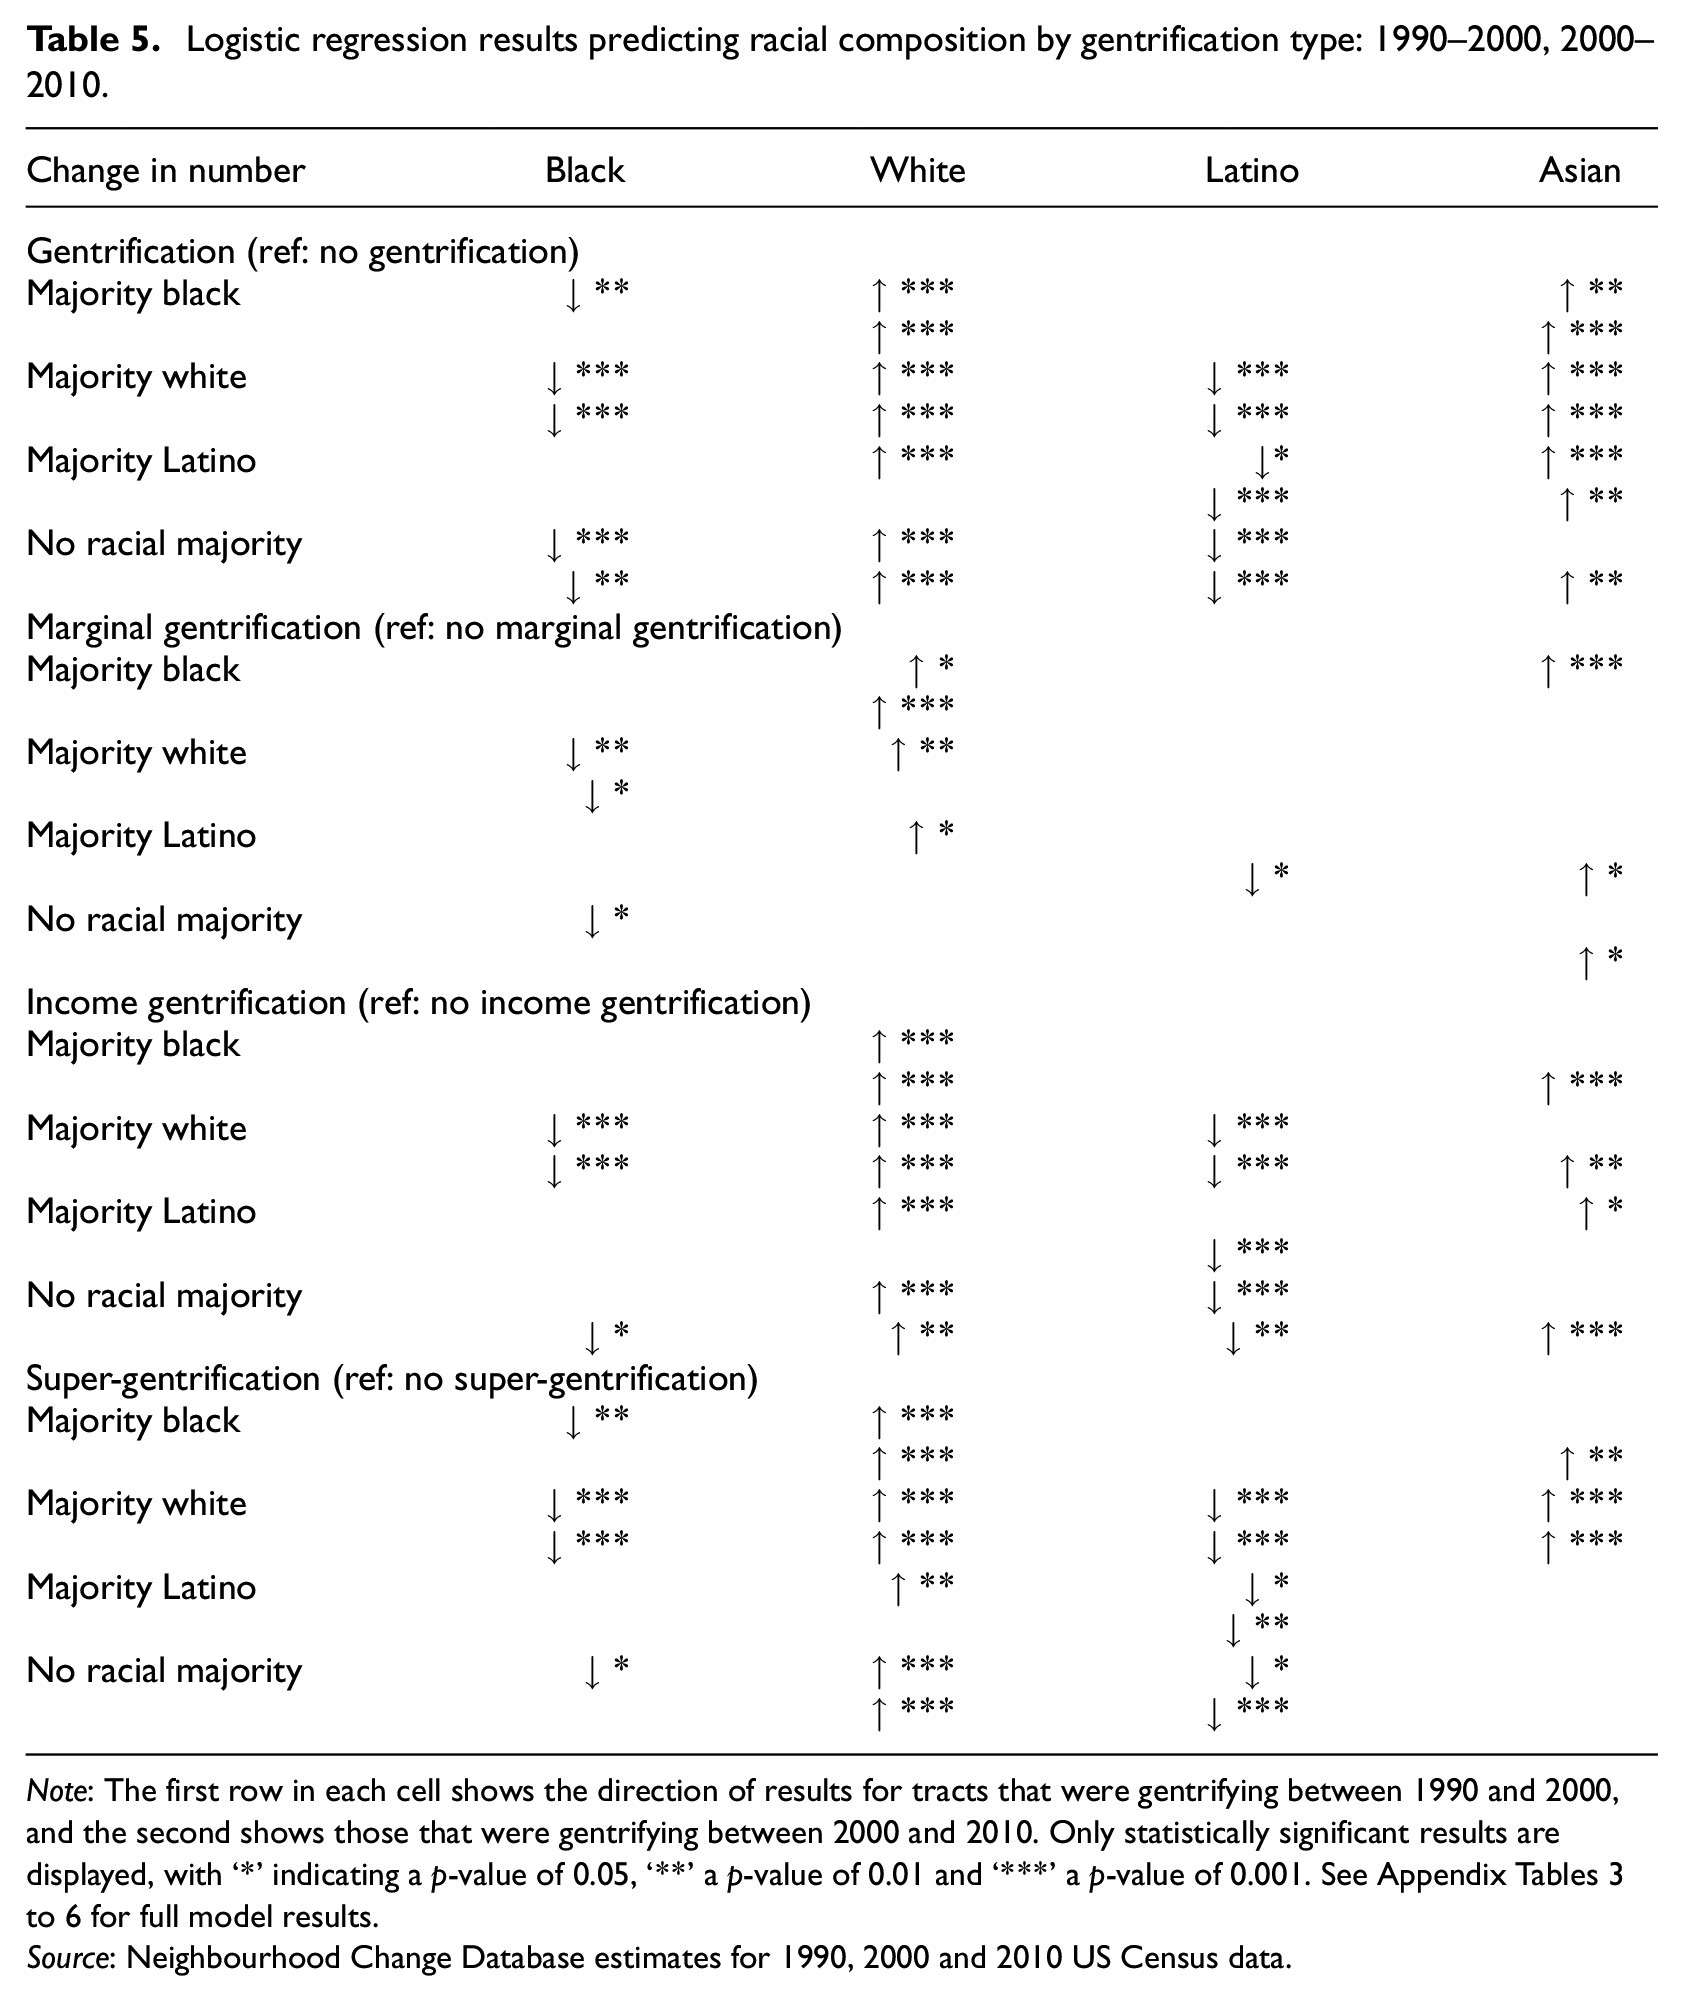
Note: The first row in each cell shows the direction of results for tracts that were gentrifying between 1990 and 2000, and the second shows those that were gentrifying between 2000 and 2010. Only statistically significant results are displayed, with ‘*’ indicating a p-value of 0.05, ‘**’ a p-value of 0.01 and ‘***’ a p-value of 0.001. See Appendix Tables 3 to 6 for full model results.
Source: Neighbourhood Change Database estimates for 1990, 2000 and 2010 US Census data.
The cells in Table 5 display an arrow for each statistically significant result in the direction of the effect, with the top row displaying 1990 to 2000 and the bottom row 2000 to 2010. As shown in the first panel, exposure to any gentrification was consistently associated with a higher likelihood of an increase in white and Asian residents across tracts of different racial compositions in comparison with tracts that did not gentrify. In addition, gentrification generally increased the odds of a decline in the number of black and Latino residents, with the exception of the number of Latino residents in majority black tracts and the number of black residents in majority Latino tracts. Thus, overall, exposure to gentrification led to more white and Asian residents and fewer black and Latino residents. These changes could make majority white tracts more racially segregated and majority black, Latino and no racial majority tracts more racially integrated. However, the extent to which these changes affect overall composition may depend on the type of gentrification to which a tract is exposed.
The second panel displays the results for tracts that experienced marginal gentrification, showing that this is associated with less racial change overall, as indicated by fewer arrows and stars. The most consistent result was a higher odds of an increase in the number of white residents, but this result was only consistent over both time periods for majority black tracts. Majority white tracts and tracts with no racial majority had higher odds of decreases in the number of black residents with exposure to marginal gentrification. In contrast, majority Latino tracts had higher odds of a decline in the number of Latino residents and majority black, Latino and no racial majority tracts an increase in the number of Asian residents. The most consistent and strongest results were for majority black tracts, which had a higher likelihood of an increase in the number of white residents in both periods and Asian residents in 1990 to 2000. Overall, marginal gentrification was associated with fewer and less-consistent changes in racial composition than gentrification overall, but it may produce the largest changes in the racial composition of majority black tracts.
In contrast, exposure to both income gentrification (third panel) and super-gentrification (fourth) mirrored the overall effects of gentrification. Tracts experiencing income gentrification and super-gentrification had a higher likelihood of an increase in white residents and a decline in Latino and black residents. In fact, only majority Latino tracts in the 2000 to 2010 period did not have higher odds of an increase in the number of white residents. The increased odds of a decline in Latino residents was consistent for both types of gentrification for majority white, majority Latino and no racial majority tracts. While the results were less consistent for changes in the number of black and Asian residents, income gentrification and super-gentrification were associated with higher odds of a decrease in the number of black residents in majority white and no racial majority tracts, and an increase in Asian residents in majority black and white tracts. Super-gentrification was also associated with higher odds of a decline in the number of black residents in majority black tracts, and income gentrification with increases in Asian residents in majority black and no racial majority tracts. These patterns closely mirror the patterns for gentrification overall, suggesting that income gentrification and super-gentrification are associated with more racial change than marginal gentrification.
Thus, while gentrification leads to racial change, the kind of gentrification a tract experienced produced variation in the degree of racial change. Exposure to marginal gentrification was associated with less racial change than income gentrification and super-gentrification, while both income gentrification and super-gentrification were associated with more white and Asian residents and fewer black and Latino residents. Although this could increase racial diversity in majority black and Latino tracts, it also raises concerns about the potential displacement and erasure of the black and Latino communities that previously called those areas home.
Conclusion
This article demonstrates how the historical legacy of neighbourhood disinvestment by race influences present-day trajectories. While prior studies often acknowledge that gentrifying low-income neighbourhoods experienced disinvestment prior to gentrification (Smith, 1996), there is less acknowledgement that disinvestment varied by racial composition and, thus, that gentrification is likely to vary by race. The historical legacy of racist urban policies and practices in the US, including redlining, urban renewal and steering (Hirsch, 1993; Sugrue, 1996), has implications for the present trajectories of neighbourhood change. Acknowledging and incorporating this history means accounting for how racial differences in class standing, wealth holding, homeownership and neighbourhood investment affect the present conditions and characteristics of American neighbourhoods. It also highlights the need for further theorising and empirical research on how these characteristics have subsequently affected trajectories of neighbourhood change, including gentrification, but also of neighbourhood decline and stagnation.
While the prior literature has established where gentrification occurs based on racial composition (Freeman and Cai, 2015; Galster et al., 2003; Hwang, 2015; Hwang and Sampson, 2014; Owens, 2012; Owens and Candipan, 2018; Timberlake and Johns-Wolfe, 2016), this article documents racial differences in the characteristics of gentrifying tracts, whether differences in tract characteristics lead to variation in how gentrification occurs and how these changes affect tract racial composition in later periods. I find that majority non-white gentrifying tracts exhibited more characteristics of poverty and thus were more likely to experience marginal gentrification than majority white tracts. In contrast, majority white gentrifying tracts were more likely to experience increases in income through super-gentrification and income gentrification than non-white tracts. Because super-gentrification and income gentrification were more consistently associated with increases in white residents and declines in black residents, gentrification in majority white tracts may contribute to increased racial segregation, while majority black and Latino gentrifying tracts may be becoming more racially diverse, a hypothesis that future research should investigate. Ultimately, these findings expand our understanding of the relationship between neighbourhood racial composition and gentrification, including how broader racial hierarchies affect neighbourhood change. They further demonstrate that gentrification neither unfolds in one way nor affects all neighbourhoods in the same way.
This evidence has several implications for future research about gentrification and race. First, the concept of gentrification is so broad that we have a limited understanding of the prevalence of the full range of distinct subtypes. Qualitative researchers have documented a wide range of subtypes at the neighbourhood level, including state-led gentrification (Hyra, 2008), studentification (Smith, 2005), super-gentrification (Lees, 2010) and tourism gentrification (Gotham, 2005). Yet researchers studying where and when these subtypes emerge beyond qualitative case studies are severely restricted by data limitations. Efforts to engage with new and innovative sources of quantitative data must continue to fully investigate and understand these trends to expand our understanding beyond the three subtypes described here.
Second, while this study focuses on the US, the implications go beyond the American context. Race, ethnicity and class are highly correlated and contribute to segregation in many other societies (Christopher, 2001; Musterd, 2005; Wong, 2000). While the categories of race and ethnicity may vary, they are still likely to have a relationship with gentrification in a non-US context. Future research should test this relationship in other countries in order to inform our understanding of how race and ethnicity inform where and how gentrification occurs.
Finally, these findings suggest the need for theories that integrate what we already know about race and class into the concept of gentrification. While focusing on class dimensions has made the concept broadly applicable across nations, integrating an understanding that all cases include some kind of racial or ethnic hierarchy will push researchers to consider how highly correlated dimensions of segregation contribute to processes of neighbourhood change (Hwang, 2015). We already know that (a) characteristics of housing type and maintenance, resources and amenities and resident characteristics vary by neighbourhood racial composition; (b) race and class influence what neighbourhoods are seen as desirable; and (c) those patterns of desirability influence where gentrification occurs. Each of these factors should be incorporated into theories about gentrification to broadly explain the variation in how gentrification unfolds. While this article suggests a start to this theory, additional research including systematic literature reviews is needed to understand the extent of these racial variations in whether and how gentrification unfolds and what the implications are of that type of gentrification.
Supplemental Material
sj-xlsx-1-usj-10.1177_0042098020963853 – Supplemental material for Racial composition and trajectories of gentrification in the United States
Supplemental material, sj-xlsx-1-usj-10.1177_0042098020963853 for Racial composition and trajectories of gentrification in the United States by Zawadi Rucks-Ahidiana in Urban Studies
Footnotes
Acknowledgements
The author would like to thank Amanda Boston, Carolina Reid, Claude Fischer, Esther Yoona Cho, Gillian Gualtieri, Jackelyn Hwang, Jessica Schirmer, Margaret Weir, Michaela Simmons, Mohammed Rafi Arefin, Sandra Smith, the Race/Ethnicity and Inequality Workshop at UC Berkeley, and the SPARKLES writing group for their feedback on prior drafts of the article; Glenn Deane and Nora Broege for their methodological guidance; and the editors of Urban Studies and the three anonymous reviewers for their thoughtful feedback.
Declaration of conflicting interests
The author(s) declared no potential conflicts of interest with respect to the research, authorship, and/or publication of this article.
Funding
The author(s) received no financial support for the research, authorship, and/or publication of this article.
Supplemental material
Supplemental material for this article is available online.
Notes
References
Supplementary Material
Please find the following supplemental material available below.
For Open Access articles published under a Creative Commons License, all supplemental material carries the same license as the article it is associated with.
For non-Open Access articles published, all supplemental material carries a non-exclusive license, and permission requests for re-use of supplemental material or any part of supplemental material shall be sent directly to the copyright owner as specified in the copyright notice associated with the article.