



Abstract
Post-war neighbourhoods across the USA have declined in socioeconomic status over the past few decades. Over this same time period, the relative status of many of these neighbourhoods has dipped below that of older neighbourhoods. With the characteristics of post-war housing being arguably undesirable by current standards, extant literature claims the functional obsolescence of post-war housing is contributing to low and declining neighbourhood socioeconomic status. What remains unclear is whether the effect observed is due to housing age – post-war housing is vulnerable to physical depreciation given its age – or if there is a true post-war vintage effect influencing neighbourhood socioeconomic status beyond what age alone would predict. Using a panel model spanning 1990 to 2010, three main findings emerge. First, the presence of greater shares of post-war housing in neighbourhoods is associated with a small but significant decrease in neighbourhood status. Second, this effect varies across and within urban and suburban neighbourhoods. Third, there exists substantial heterogeneity in the effect across metropolitan areas that differ by housing supply growth and price. Together, these results imply that policymakers should consider the negative effects of functional obsolescence on top of the ills associated with ageing homes within certain spatial contexts.
Introduction
Post-war housing is ageing en masse, much like the baby-boomer generation it once sheltered. This housing, built between 1945 and 1969, began entering middle age at the turn of the last century and now represents the largest volume of middle-aged housing the USA has ever experienced at one time. 1 The current state of many suburbs and neighbourhoods dominated by this vintage housing is that of decline. Compared with outer ring suburbs, 63% of metropolitan post-war suburbs (sometimes referred to as inner ring suburbs) are in decline in terms of income, population and poverty (Hanlon, 2008). When looking at a neighbourhood’s own relative socioeconomic status over time, post-war neighbourhoods consistently declined over the 1970 to 2010 period (Airgood-Obrycki, 2019). On top of this decline, economic growth within post-war suburbs is dwarfed by that of outer rings, and industry loss plagues many of these communities (Hanlon, 2012).
During its time, the simple post-war home and uniform development represented the pinnacle of construction technology and the household desires of returning war veterans and their families. Fast-forward 40 to 50 years and it is now argued that post-war housing is no longer aligned with current consumer demand. One corner of planning literature hypothesises the decreased demand for the physical characteristics of housing and the typical subdivision layouts that dominated the post-war era to be the main factors contributing to the current observations of decline (Airgood-Obrycki, 2019; Hanlon, 2007, 2008, 2012; Lucy and Phillips, 2000, 2006; Short et al. 2007). Hanlon (2007) states, ‘… style, size, and uniformity of post-war housing may be more important to suburban decline than merely the issue of housing age’. The specific undesirable characteristics Hanlon may be referring to are the typical uniform lot sizes and architectural styles – a half-dozen basic plans – offered by the large, national developers of the time (Jackson, 1985). These quickly constructed one-storey or one and a half-storey homes often had 8-foot ceilings, four to six rooms, two bedrooms, a front picture window and no basement (Jackson, 1985).
Indeed, preferences for housing have diverged from modest post-war structures to larger exurban single-family homes. The average size of a newly constructed single-family home in 1950 was 1065 square feet (National Association of Home Builders, 2000). By 2015, the average jumped by 155% to 2721 square feet (US Census Bureau, 2015). Two-thirds of new homes built in 1950 contained two or fewer bedrooms and only 4% had two or more bathrooms. In contrast, 47% of new single-family homes in 2015 contained four or more bedrooms, with only 10% containing two bedrooms or less. Just as extreme, only 4% of 2015 new-builds offered one and a half bathrooms (a half bathroom contains a toilet and sink only) or less while 38% contained three or more bathrooms. Combined, these observations imply the average post-war home is outmoded by current standards and preferences.
This mismatch, along with the observations of relatively low socioeconomic status and higher frequency of decline of post-war neighbourhoods, appear to support the hypothesis regarding a negative post-war vintage effect. Households with the means and mobility may be disinclined to invest in post-war homes and neighbourhoods given their characteristics and perceived quality. However, more central neighbourhoods of older vintages have previously been in decline and are now showing signs of recovery in some metropolitan areas. Is what we are observing with post-war housing and neighbourhoods merely a continuation of this cycle? In other words, this observation may be consistent with the lifecycle of housing depreciation and the filtering process that commonly ensues. Furthermore, additional confounding between an age and vintage effect can occur when metropolitan-level time trends are not taken into consideration. Metropolitan-level exogenous factors such as industry decline and housing supply shocks may influence observations of low socioeconomic status and decline within post-war neighbourhoods. For example, Rust Belt cities such as Cleveland and Detroit grew tremendously during the post-war era given the presence of strong manufacturing industries and have experienced economic decline in recent decades. Conversely, over these same recent decades, some metropolitan areas experienced very limited increases in new housing supply in the face of high housing price growth – that is, extreme housing supply inelasticity.
In this paper, I investigate whether the presence of post-war housing is uniquely associated with variation in neighbourhood socioeconomic status within a metropolitan area. Specifically, after accounting for housing age, neighbourhood characteristics, and external local and more regional forces, does the presence of greater shares of post-war housing in a neighbourhood correspond to lower levels of socioeconomic status? I also consider how these effects might vary both within and across urban and suburban built environments. This variation is of particular interest given the emphasis in extant literature on post-war housing as a predominantly suburban form of development. Lastly, I explore potential variation across metropolitan areas with differential trends in new housing supply growth and housing prices. This heterogeneity may induce policy-relevant variation in the effect of post-war housing on neighbourhood socioeconomic status. To separately identify the effect of post-war housing vintage versus housing age on relative levels of socioeconomic status, a census-tract-level panel model is used. Neighbourhood socioeconomic status is measured using within-metro neighbourhood percentile rank by median household income.
Aggregate findings indicate that lower-income-ranked neighbourhoods contain higher shares of older homes. However, the presence of more post-war housing amplifies this negative effect somewhat. In metropolitan areas with high housing prices (e.g. Boston), this relationship is driven by urban post-war neighbourhoods. In metropolitan areas with lower housing supply growth and housing prices (e.g. Cleveland) post-war housing does not influence neighbourhood status beyond what is accounted for by housing age. However, in metropolitan areas with substantial new housing supply growth and lower prices (e.g. Atlanta), the negative post-war effect is nearly 2.5 times larger than the aggregate effect, signalling access to affordable new suburban housing may allow households to exercise income-related preferences over post-war housing and neighbourhoods.
The following section outlines how particular housing characteristics associated with age and vintage influence housing depreciation and neighbourhood socioeconomic status. Discussion of the model specifications, descriptions of data and results follow. The paper concludes with an overview of the findings and policy implications.
Background
Housing depreciation
What are the channels through which housing characteristics influence the decline and relative status of a neighbourhood? As the separate lifecycles of households and housing units evolve over time, the value of the house to its inhabitants depreciates as the bundle of services comprising the housing unit age and/or change. This bundle of services is not limited to the specific characteristics of the housing unit itself; it is also associated with external features such as neighbourhood services, the built environment and the socioeconomic status of neighbours. As the value of the bundle of services declines, households adjust their housing through repairing, maintaining and improving current housing, or migrating out of current housing and possibly the current neighbourhood in order to slow, stall or avoid housing depreciation.
Factors affecting depreciation of a home that are internal to the housing unit include physical deterioration and functional obsolescence. Physical deterioration is closely associated with ageing but can also be attributed to vintage and maintenance levels as physical deterioration depends on the original quality of construction and subsequent maintenance of the structure (Francke and van de Minne, 2017, Lusht, 1997; Wilhelmsson, 2008). As post-war housing is squarely in middle age and argued to be of poor quality, age- and quality-driven physical deterioration would be expected for current post-war housing structures. Additionally, many post-war homes are outmoded in terms of their structural characteristics, as discussed, implying post-war housing is at risk of both physical deterioration and functional obsolescence.
Post-war housing may be subject to external forces of depreciation such as local neighbourhood externalities or broader regional externalities. A household may have a hard time justifying repair and maintenance costs when negative neighbourhood externalities put downward pressure on the return from such an action (Baer and Williamson, 1988; Gyourko and Saiz, 2004; Hanlon, 2007). Broader market conditions such as housing supply inelasticity may put upward price pressure on otherwise depreciating homes. Variation in these forces across neighbourhoods and metropolitan areas may result in differences in the post-war vintage effect.
Empirically, the role of age in housing depreciation is well established (see Francke and van de Minne, 2017, for a summary) and effort has been made to disentangle age effects from maintenance as well as vintage effects at the micro level. Of note are two papers that identify a vintage effect separate from an age effect: Coulson and McMillen (2008) find a sharp downward shift in 1940s housing prices which may imply a certain level of cachet for pre-1940s homes, Rolheiser et al. (2020) find that post-war homes compared with other vintages in the Netherlands experienced the lowest levels of price appreciation during 2000 to 2017. There is some suggestive evidence of a post-war effect at least with respect to housing price dynamics.
Neighbourhood-level age versus a post-war vintage effect
With more post-war housing within a neighbourhood, aggregate functional obsolescence and physical depreciation could contribute to neighbourhood-level disinvestment and subsequent status decline. The majority of existing evidence of this decline focuses on changes in income over ten-year census periods (Lee and Leigh, 2005; Lucy and Phillips, 1997, 2006) with some authors choosing to use a composite index of decline (Airgood-Obrycki, 2019; Hanlon, 2008, 2012; Lee and Leigh, 2007). The more recent work by Airgood-Obrycki finds that post-war neighbourhoods across the USA lost socioeconomic status over the 1970 to 2010 time period, with loss of status in the Midwest eclipsing that in other regions. However, areas that have experienced more suburban growth such as Atlanta and Dallas also exhibit high rates of status decline. Airgood-Obrycki concludes by agreeing with previous literature regarding the role of ‘lack of desirable housing stock’ and ‘the emergence of modern, outer suburban neighbourhoods’ in contributing to the decline of post-war neighbourhoods. The observations of post-war neighbourhoods being in decline within these studies coincide with the vintage entering middle age; not old enough for wholesale redevelopment but still suffering from expensive maintenance and upkeep. Without empirically accounting for age-related physical depreciation, it is not clear how much status loss can be attributed to post-war housing and neighbourhood characteristics.
And, in fact, housing age is a persistent source of neighbourhood status change over time. Middle-aged housing in particular has the largest negative impact on the change in neighbourhood socioeconomic status (Rosenthal, 2008). This finding is in line with theories and empirical evidence of filtering and redevelopment (Arnott and Braid, 1997; Baer and Williamson, 1988; Charles, 2013; Weicher and Thibodeau, 1988). While middle-aged housing may be filtering down the income distribution because of physical depreciation, there is also a higher probability of redevelopment for the older cohort of housing. 2
Methods
I consider three main points of inquiry in this investigation. (1) Is there a systematic post-war vintage effect with respect to neighbourhood socioeconomic status? (2) Does this effect vary both within and across urban, inner ring suburban and outer ring suburban areas? (3) Does the effect vary across metropolitan areas with differential trends in new housing supply growth and housing prices?
The unit of analysis is the neighbourhood with a relative measure of household income used as a proxy for neighbourhood socioeconomic status. Post-war housing within a neighbourhood is measured as the share of homes built between 1950 and 1969. Previous literature focuses on post-war neighbourhoods and suburbs through the use of a binary variable identifying a tract as post-war or not. A continuous post-war housing share allows for the identification of the marginal effect of increased shares of post-war housing within a neighbourhood. From this linear marginal effect, an aggregate post-war neighbourhood effect is calculated by estimating the difference in income ranking for a low post-war share neighbourhood versus a high post-war share neighbourhood. Further, I identify broader post-war suburban effects by comparing post-war neighbourhoods across urban and inner/outer ring suburban built environments. The sensitivity of the neighbourhood-level analysis is tested using a binary categorisation for post-war neighbourhoods.
Model
Estimation of the post-war vintage effect relies on the separate movement of age and vintage over the time periods considered. Specifically, the age of the post-war vintage changes over time; thus, there exists variation in age that is separate from the neighbourhood-level variation in post-war vintage. Cross-sectional variation is exploited to identify the post-war effect whereas longitudinal variation identifies the age effect. In order to separately identify post-war vintage and age effects within a panel of neighbourhood-level data, I restrict both vintage and age effects to be stationary relative to each other over the time period considered while still controlling for metropolitan-area-specific time effects in order to account for city trends. I do not include additional vintages (pre-1950, for example) as the associated vintage effects cannot be accurately identified given data restrictions. 3 However, this does not impact the identification of a unique post-war vintage effect. The coefficients on the housing age shares represent a composite effect of age and omitted vintages. The coefficient on post-war share singles out the effect post-war vintage might have beyond the age effect associated with post-war housing.
Equation (1) presents the OLS specification used to identify the systematic post-war housing effect:

Three variations of equation (1) are considered in the main results. First, the post-war effect on neighbourhood income rank (represented by the coefficient on
Data
Census-tract-level data are used to proxy for neighbourhoods in this analysis. The years 1990, 2000, 2010 are considered as they allow for consistent observation of the housing-age variables (0–9, 10–19, 20–29, 30–39, 40–49, 50 or more years old). Decennial census-tract-level data for the years 1990 and 2000 with 2010 boundaries are constructed from the National Historical Geographic Information System (NHGIS) using the areal interpolation and land cover weighting methodology developed by Logan et al. (2014) (Manson et al., 2019). The America Community Survey (ACS) covering 2008–2012 is used as a proxy for 2010 and is also retrieved from NHGIS. Median household income, share of housing units by number of bedrooms, homeownership rate, vacancy rate and housing unit density are retrieved from the census and the ACS.
The binary post-war neighbourhood variable used in the robustness check of the post-war neighbourhood-level analysis is based on the relative share of post-war housing within a tract. More specifically, if the share of housing units built between 1950 and 1969 is larger than the share built pre-1950 and larger than the share built post-1969 (i.e. a relative majority), then the tract is classified as post-war.
Identification of urban versus suburban tracts is not straightforward – an official census definition does not exist. Municipal boundaries are often a poor proxy as many central cities contain what would be considered by residents to be suburban land use. A more accurate definition of urban versus suburban land use should be based on land-use intensity (Kolko, 2015). 5 Other forms of categorisation are based on housing vintage. Inner ring suburbs, for example, are assumed to have been predominantly built-out from 1950 to 1969. This definition ignores neighbourhoods dominated by slightly older or slightly newer vintages that exist at densities consistent with proximate post-war neighbourhoods. For this research, I choose a definition of urban, inner ring suburban and outer ring suburban tracts based on the density of people within a census tract and the density of the buildings measured through the use of satellite imagery. The categorisation is based on a density index developed by Gebeloff (2019). 6 I drop tracts classified as ‘rural’ from the analysis. This index is based on 2016 data so a concern may be that any densification of inner ring tracts that took place between 1990 and 2016 may lead to the misclassification of a tract as urban. Upon inspection, housing unit density changed very little on average. This is in line with the observation that American cities have become more sprawling over time and not more compact (Taylor, 2019). The vast majority of new development has taken place at the fringes leaving the density of inner suburban neighbourhoods mostly intact.
I use data on residential permits and median house price per square foot to group metropolitan areas by housing market type. The annual residential permit average from 1990 to 2010 per the number of existing housing units in 1990 (in 1000s) at the metro-level is calculated using the Census Building Permits Survey (US Census Bureau, 2019). Metro-level median house price per square foot is retrieved from Zillow (Zillow, 2019). High growth metropolitan areas are those in the top 25th percentile of the average permits. Similarly, high price metropolitan areas are those in the top 25th percentile of the median price per square foot. Four groups are constructed: low–mid supply growth, low–mid price; low–mid supply growth, high price; high growth, low–mid price; high growth, high price.
The Census for Retail Trade, Census Building Permits Survey, Zillow median house price data and the urban/suburban classification data do not fully coincide in terms of metropolitan areas represented. The total number of metropolitan areas covered by all four data sets is 221. A balanced panel of census tracts is constructed after dropping tracts designated as rural and tracts where the proportion of people living in group quarters is more than 0.40. I further reduce the sample by Winsorising tracts (removing extreme values) that contain post-war housing in the top 5th percentile because of strong non-random characteristics displayed in these tail census tracts. 7 Tracts with post-war shares over 0.66 in 2010 are removed and the sample is rebalanced. This results in 91,689 tract-year observations.
Descriptives
When first built, post-war housing was typically constructed within contiguous residential subdivisions. Because of this spatial concentration, however, tracts may have either high or low shares of post-war housing. Plotting the pooled (all years) post-war housing share distribution does not depict stark patterns of many tracts with very low shares and many tracts with very high shares of post-war housing (see Figure 1(a)); although there is a small mass of tracts with lower shares. This aggregate histogram somewhat masks the underlying spatial patterns that are more clearly seen in Figure 1(b) where the post-war share distribution by tract type is plotted. Both urban and inner ring suburban tracts have fatter right tails indicting that more tracts with higher shares of post-war housing exist within these neighbourhood types. This plot shows that the mass of tracts with low shares of post-war housing are predominantly located within inner ring tracts. Upon inspection, these tracts tend to be dominated by housing built between 1970 and 1989. The amount of variation of post-war housing share present in each metropolitan location highlights the importance of exploring the effect of post-war housing not just in inner ring suburbs but across metropolitan areas as a whole. It is true that post-war neighbourhoods are more predominant within inner ring suburbs – 51% of post-war neighbourhood tracts, as identified by the binary post-war neighbourhood variable, lie within inner ring suburbs – but with 34% and 16% occurring within urban areas and outer ring suburbs, respectively, it is important to explore post-war effects in these geographies as well. In other words, the post-war neighbourhood is not entirely monolithic.
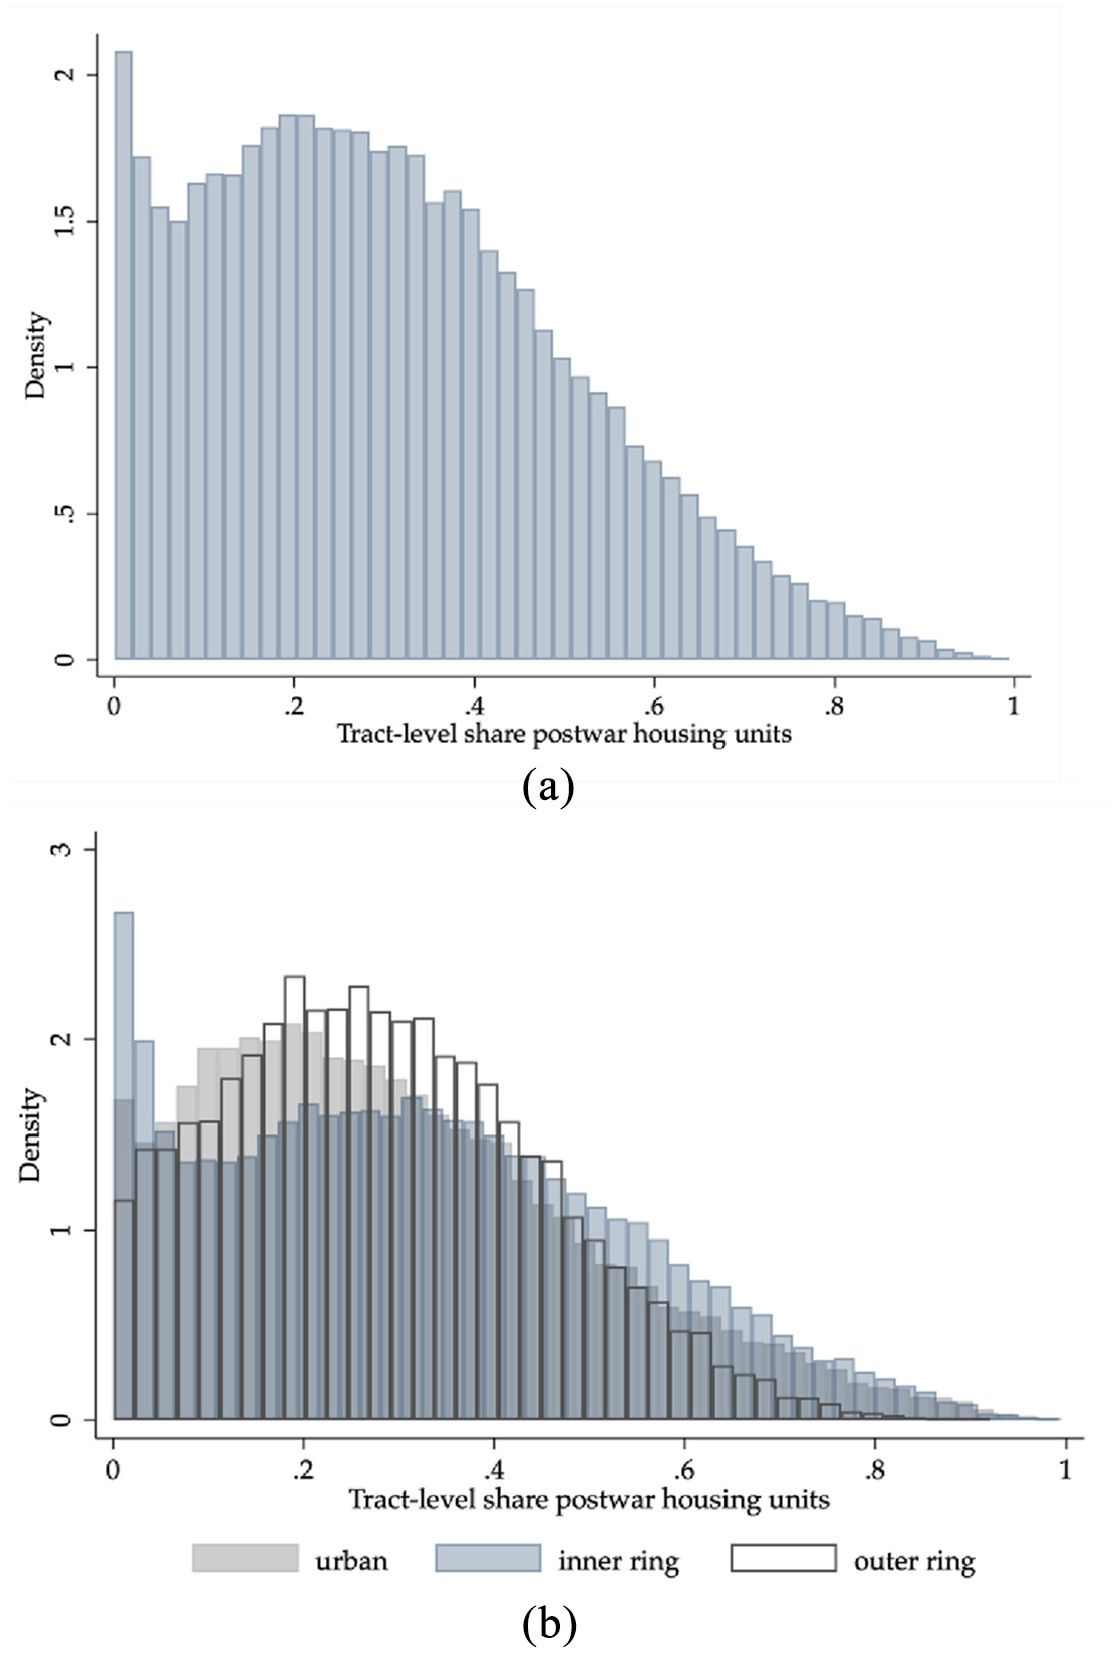
Post-war share histograms: (a) all tracts, and (b) by tract type.
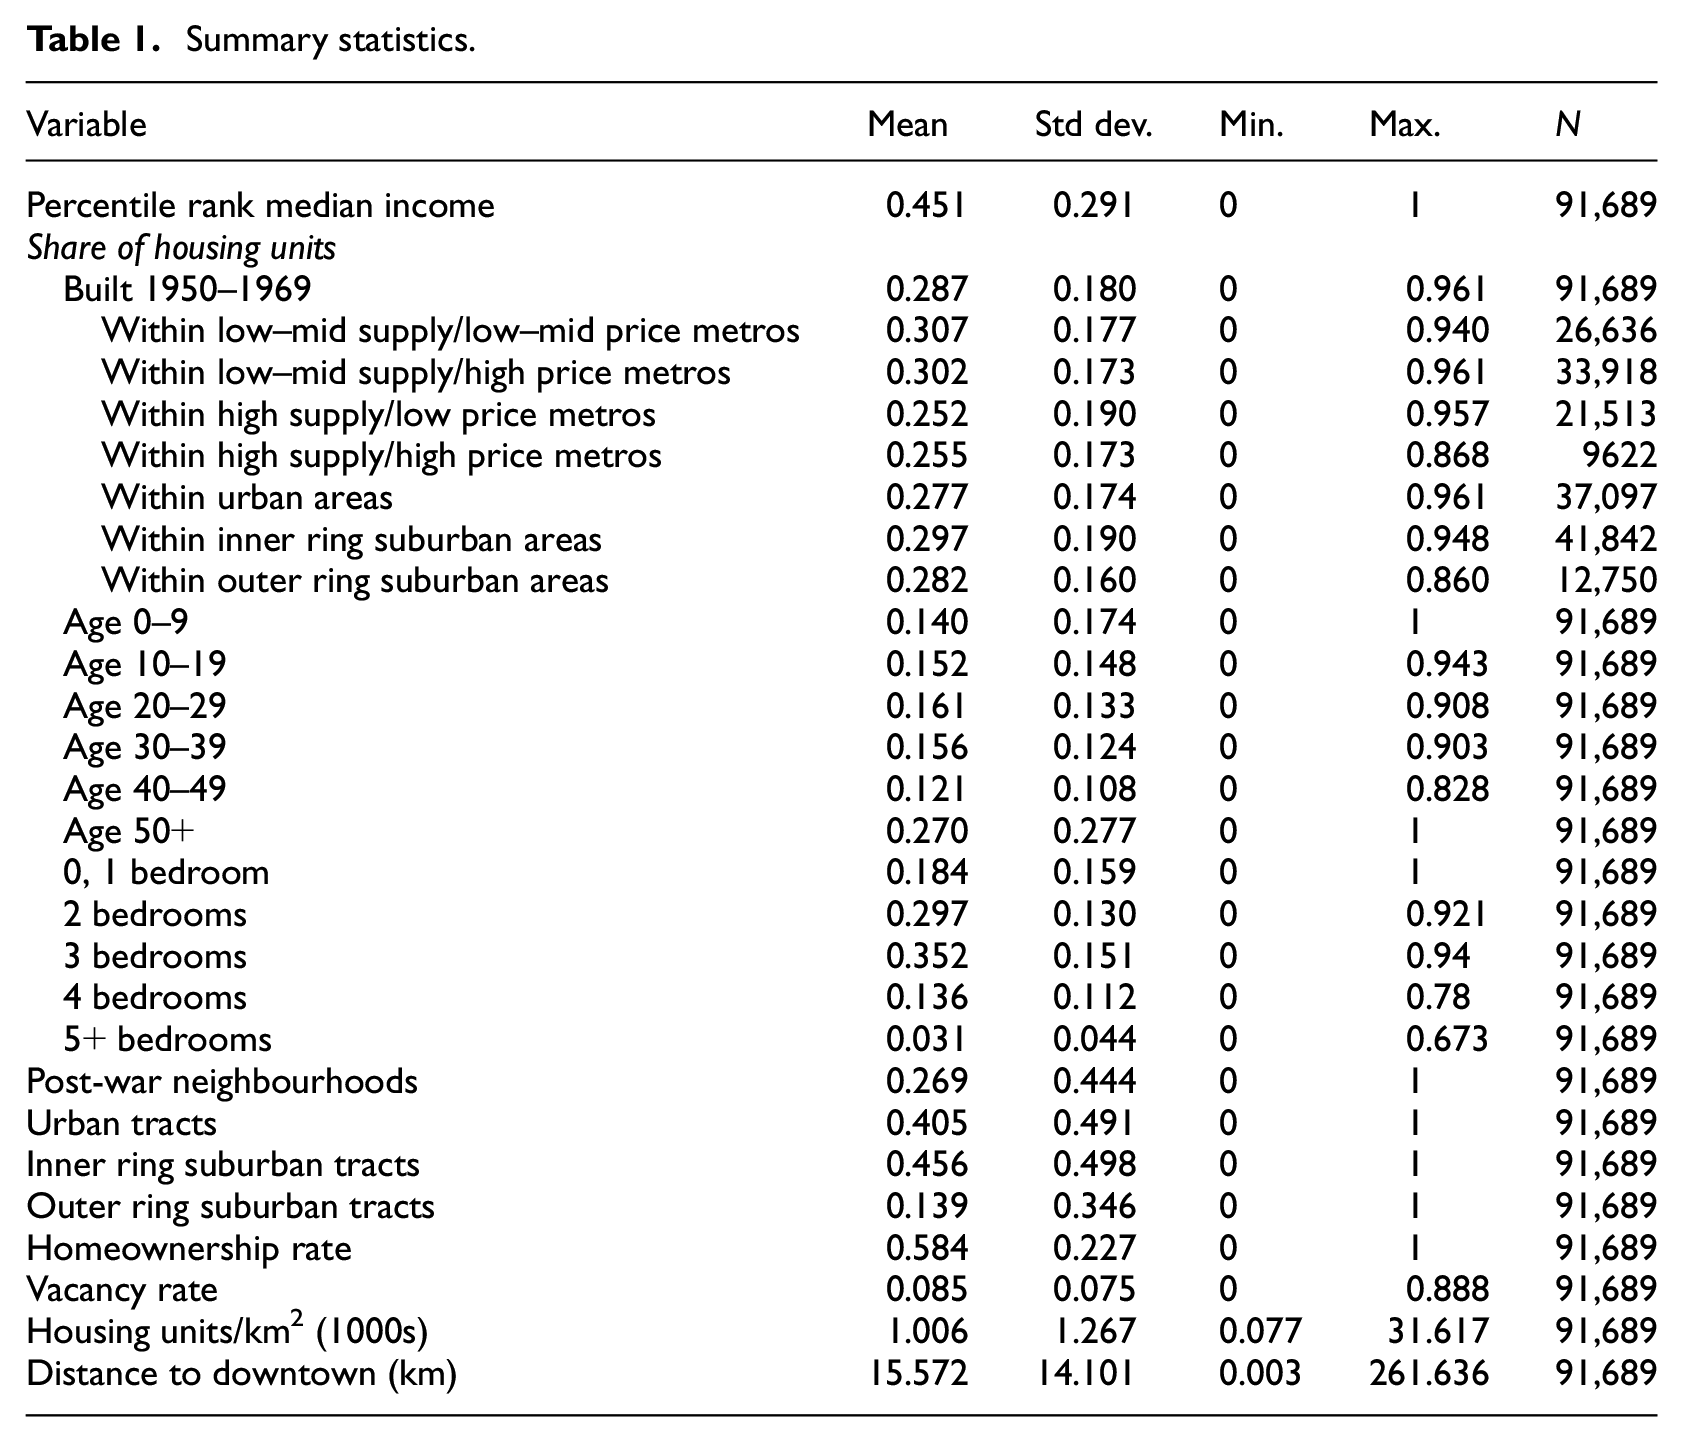
Summary statistics are provided in Table 1. Statistics for the post-war share within various tract types are also provided. The mean share of post-war housing in all tracts across all years is 0.287. Within the metropolitan subgroups, about 30% of the housing stock in metropolitan areas with low–mid new housing supply growth is post-war housing. The mean share drops to just over 25% for tracts in high supply growth metropolitan areas. Mean post-war housing share is highest within inner ring suburban tracts at 30%. Mean shares for urban and outer ring suburban tracts are similar at 28%. Overall, 27% of tracts are categorised as post-war neighbourhoods based on the binary variable constructed. Inner ring suburban tracts make up the largest share of tracts at 45%, followed by urban tracts at 41% with outer ring suburbs representing 14% of all tracts.
Summary statistics.
Results
Post-war housing effect
I begin with the question of whether there exists a systematic post-war housing effect. Table 2, column I, displays the effect when housing age is not accounted for. The coefficient on post-war share is large and negative as expected; its magnitude implies that a 0.10 increase in the share of post-war housing in a neighbourhood is associated with a 2.84 percentile point (pp) drop in the percentile rank of median household income. Controlling for the housing age distribution in column II, the post-war coefficient drops sharply in magnitude, implying a 0.399 pp decrease in income rank with a 0.10 increase in post-war share. 8 This large decrease in coefficient magnitude indicates that the housing age distribution within a neighbourhood is driving much of the observed lower-income rank associated with larger shares of post-war housing. However, the post-war coefficient still represents a small but significant negative post-war effect that is unique from the housing age effect. The housing age coefficients display the typical U-shape with the negative age effect subsiding slightly for the oldest homes.
Aggregate regressions, median income percentile rank dependent variable.

Notes: Post-war share variable used in specifications for columns I–V, post-war neighbourhood binary variable used in column VI. All specifications include metro × year fixed effects. Cluster-robust standard errors in parentheses.
p < 0.01, **p < 0.05, *p < 0.1.
The interaction terms included in column III provide confirmation of heterogeneous effects within each of the three land-use typologies. Larger shares of post-war housing in urban and inner ring suburbs are associated with lower neighbourhood income rank, with the magnitude in urban areas more than 1.5 times larger than in inner ring suburbs. Conversely, the outer ring interaction implies that larger shares of post-war housing in outer ring suburban tracts are associated with higher income rank. For ease of comparison, Figure 2(a) displays the marginal effect of post-war share on income rank from column II (labelled ‘baseline’) alongside the total marginal effects of the post-war share with respect to urban, inner ring, and outer ring typologies from column III. The total marginal effects for urban, inner ring and outer ring areas are −0.0631, −0.0384 and 0.0392, respectively.

Aggregate and stratified marginal effects and predicted income rank for post-war housing and neighbourhood-level results: (a) post-war share marginal effects for systematic and within tract type interaction; (b) post-war neighbourhood predicted income percentile rank across tract type.
The last question for the main specification is whether undesirable housing characteristics are contributing to the systematic post-war housing effect observed in column II. The post-war share coefficient becomes positive but small in magnitude with the inclusion of housing units by number of bedrooms (column IV). This indicates that the negative systematic effect may be due to the fact that neighbourhoods with more post-war housing will, on average, have larger shares of homes with smaller numbers of bedrooms. While suggestive, I interpret this finding with caution.
Post-war neighbourhood effect
Calculating the effect of a larger difference in post-war shares provides an estimate of a post-war neighbourhood effect. To do this, I use the difference between the average share of post-war housing in non-post-war tracts (0.20) and post-war tracts (0.51). This difference in share of 0.31 is associated with a significant 1.23 pp lower income rank in post-war neighbourhoods compared with non-post-war neighbourhoods. Within urban and inner ring suburbs, post-war neighbourhoods are 1.95 and 1.19 pp lower in income ranking compared with their non-post-war neighbourhood counterparts. Conversely, post-war neighbourhoods in outer ring suburban areas have an income ranking 1.20 pp higher than non-post-war outer ring suburban neighbourhoods.
What about comparisons across the typologies? For example, what is the difference in ranking for a post-war neighbourhood in an inner or outer ring suburb versus a post-war neighbourhood in an urban area (all else equal)? This question is addressed by comparing the predicted income rankings across the three typologies when the post-war share equals 0.51. The income rankings for post-war neighbourhoods in inner and outer ring suburbs are 5.16 and 9.49 pp higher than the urban post-war neighbourhood ranking (see Figure 2(b)).
How do these post-war neighbourhood effects estimates compare with specifications using the binary post-war neighbourhood categorisation instead of post-war share? Findings are qualitatively similar. For the systematic effect, post-war neighbourhoods have a 0.84 pp lower income rank than non-post-war neighbourhoods on average (Table 2, column V). This is a slightly more conservative estimate compared with the share-based estimate. Since the definition of post-war neighbourhood includes neighbourhoods with post-war shares lower than 0.51, this is not unexpected. Comparing post-war versus non-post-war neighbourhoods within typologies (Table 2, column VI), post-war neighbourhoods compared with non-post-war neighbourhoods in urban and inner ring suburban tracts have 0.92 and 1.59 pp lower income rankings, respectively (these effects are not significantly different from one another). However, post-war neighbourhoods in outer ring suburbs rank 1.82 pp higher than non-post-war neighbourhoods. The predicted income ranking of post-war neighbourhoods’ across typologies indicates that inner and outer ring suburban post-war neighbourhoods’ income rankings are 4.08 and 9.08 pp higher than urban post-war neighbourhoods, respectively.
Overall, both the housing- and neighbourhood-level results for the systematic specification indicate a small but significant post-war effect after controlling for the housing age distribution. The effect is largest in urban areas both within and across land use typologies. This suggests an urban built environment component to the negative post-war effect, although a small inner ring suburban component also exists.
Heterogeneous effects across metropolitan areas
Does the post-war effect differ across metropolitan areas with varying housing market pressures? Figure 2(a) plots the systematic and total marginal effects for the land use typology interaction for each metropolitan group (see Table 3 for regression output). A systematic post-war effect does not exist in metropolitan areas with low–mid new housing supply growth and prices (group 1, column I). The effect remains small and insignificant within all typologies (column II). Metropolitan groups with high prices (groups 2 and 4) have effects of similar magnitude for both the systematic effect (columns III and VII) and the effects within land use typologies (columns IV and VIII). The systematic effect is relatively small and negative but is large and negative within urban tracts, small and insignificant within inner ring tracts, and large and positive within outer ring tracts. Group 4 estimates are less precise given the smaller sample size. Of note is the variation in the housing age coefficients. In particular, a large negative relationship between the share of older homes and neighbourhood income ranking for metropolitan areas with low–mid house prices (groups 1 and 3) exists.
Metropolitan stratifications, median income percentile rank dependent variable.
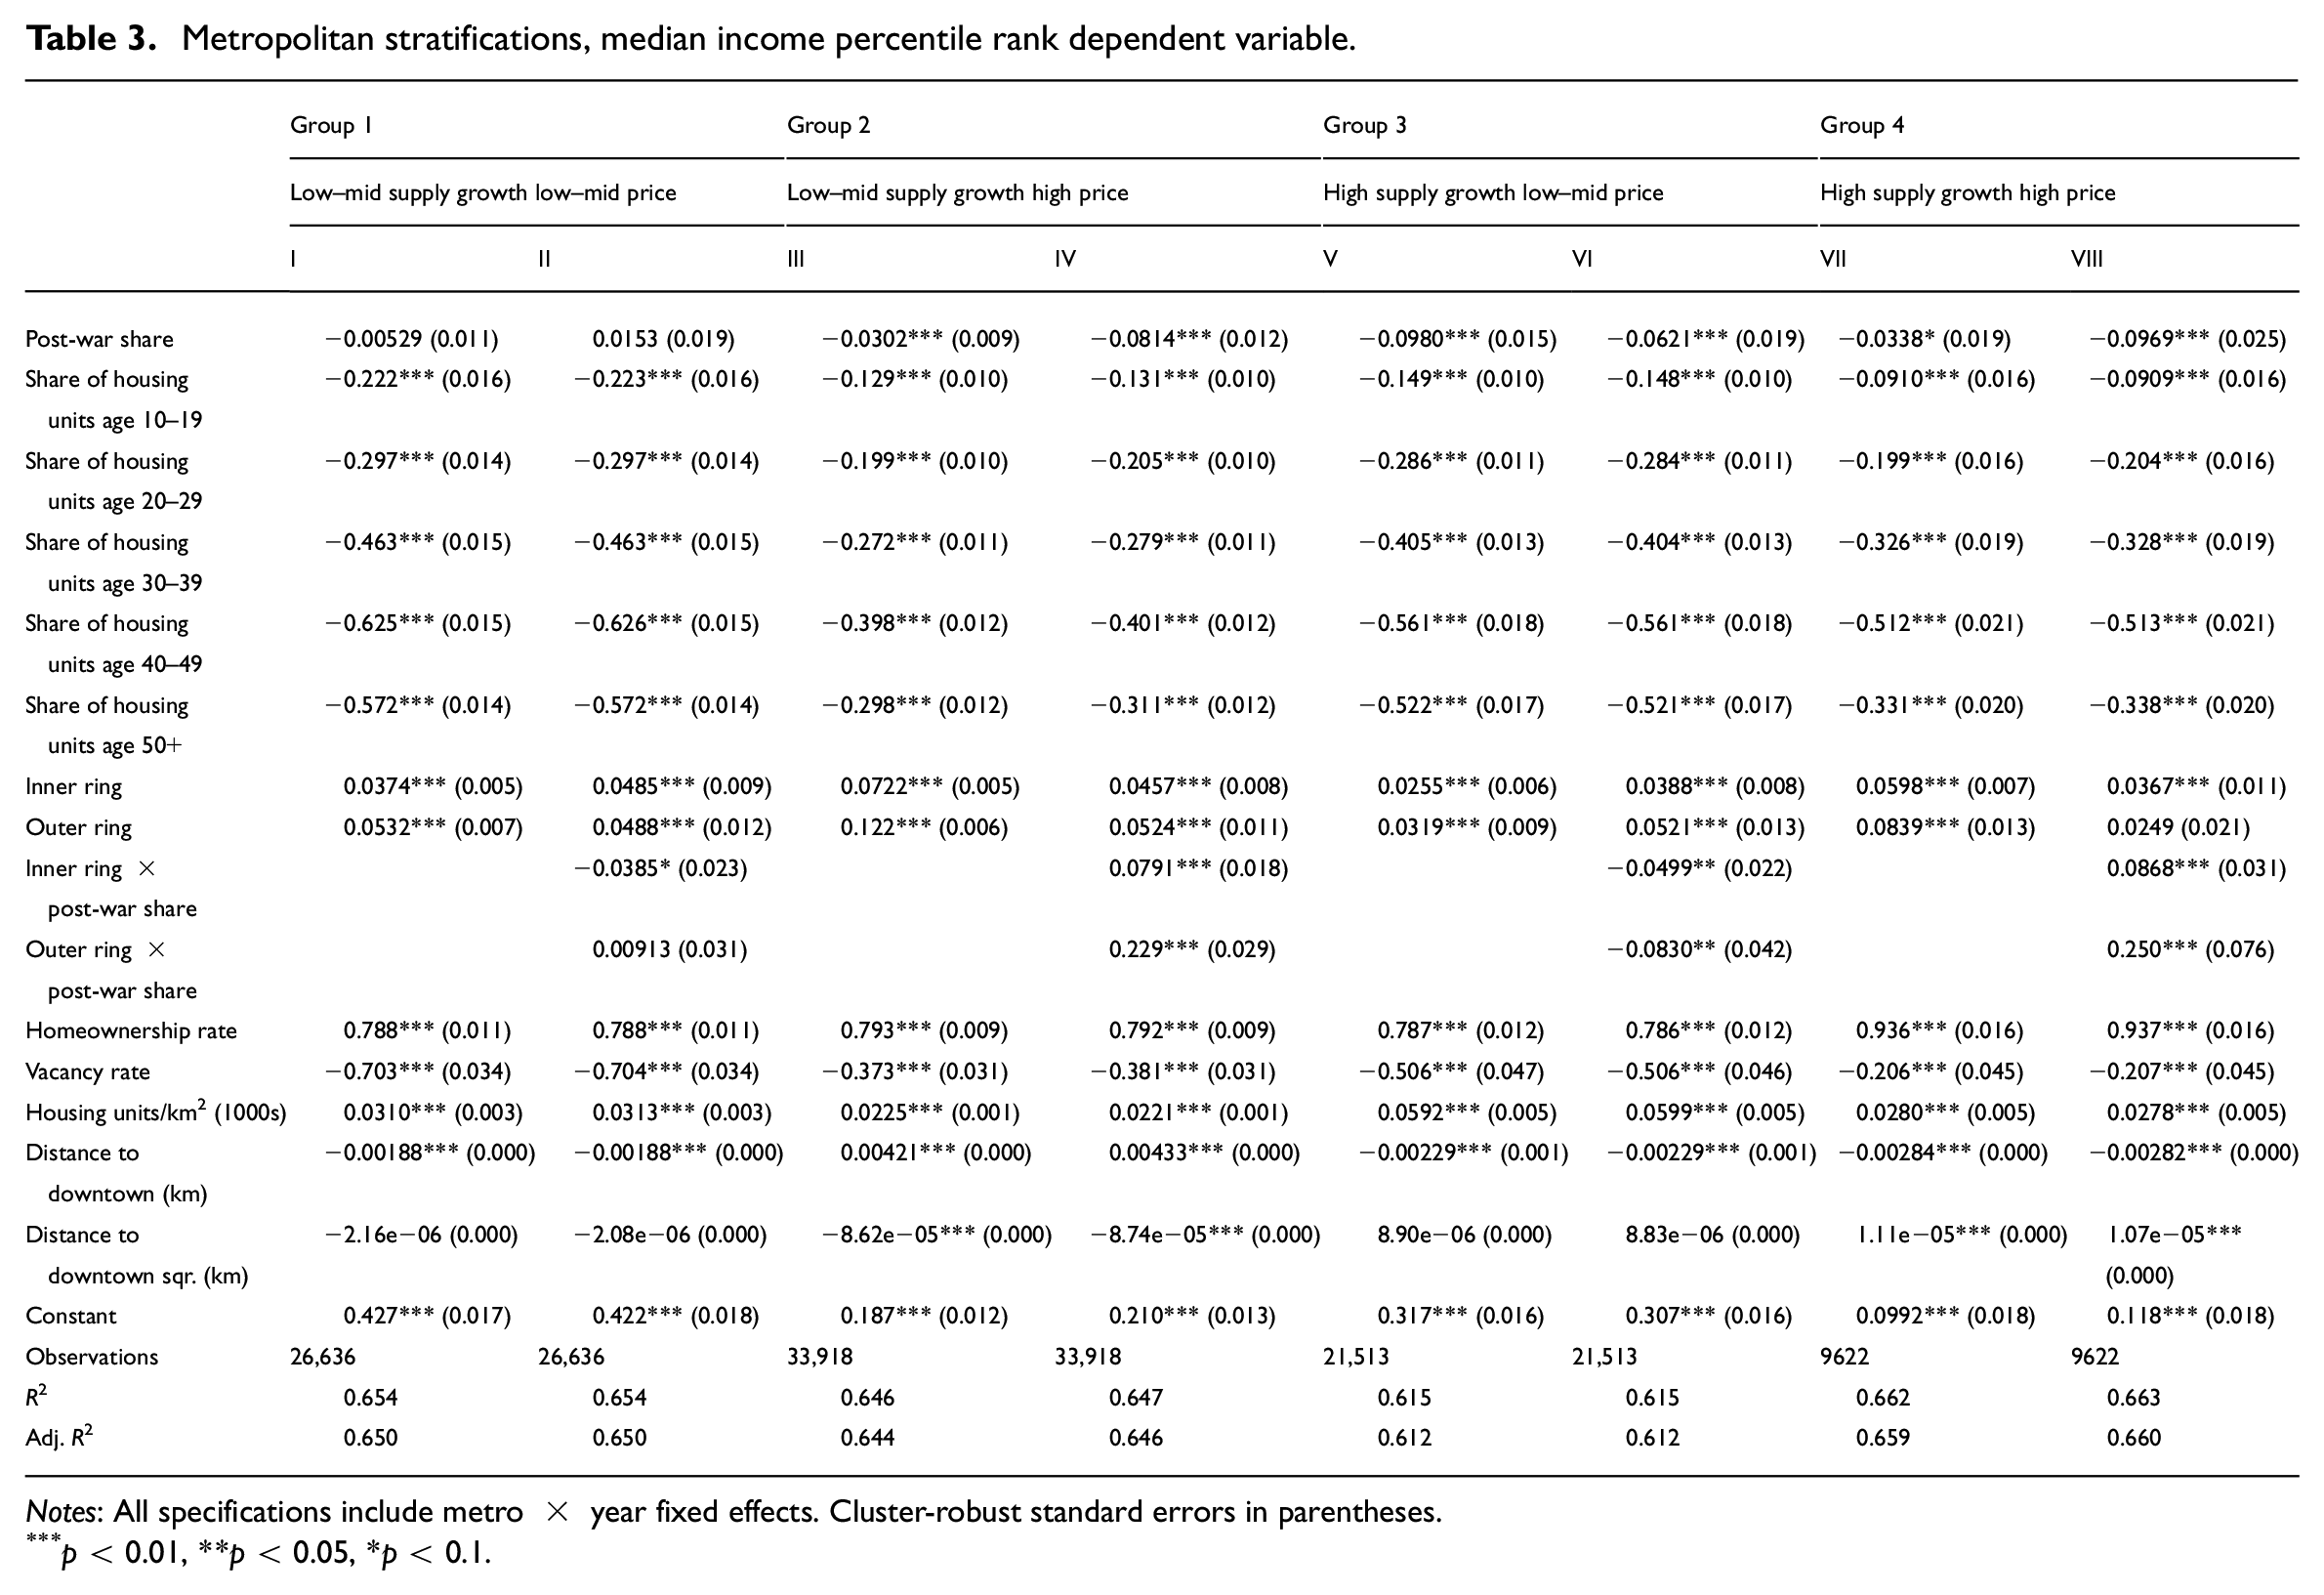
Notes: All specifications include metro × year fixed effects. Cluster-robust standard errors in parentheses.
p < 0.01, **p < 0.05, *p < 0.1.
Group 3 (high new supply growth and low–mid prices) is somewhat of an outlier. The negative systematic effect is three times the magnitude of the Group 2 and 4 estimates. Further, the effect within typologies remains negative for all typologies and is largest for outer ring tracts and smallest for urban tracts – although suburban effects are not significantly different from one another.
In Figure 2(b), predicted income rankings evaluated at a post-war share of 0.51 are compared across typologies. 9 The differences in the predicted income rank are quite large for high housing price metropolitan areas (Groups 2 and 4) compared with low–mid supply growth and low–mid price metropolitan areas (Group 1) – with urban post-war neighbourhoods ranking lowest and outer ring post-war neighbourhoods ranking highest. For example, the income ranking of outer ring post-war neighbourhoods for Group 2 metropolitan areas is 17 pp higher than that of urban post-war neighbourhoods. Interestingly, the rankings across the land use typologies for high supply and low–mid price metropolitan areas (Group 3) are not significantly different from each other at the 1% level. This implies a consistency in the negative post-war neighbourhood effect across urban and suburban typologies.
Together, these findings imply that substantial heterogeneous effects exist when looking across metropolitan areas that face variation in housing supply growth and price. When lower cost new supply is available, higher income households may be able to exercise preferences over post-war housing by sorting away from neighbourhoods with more post-war housing. This may signal that post-war housing is of comparatively lower quality and less desirable. The resulting large negative post-war effect is present across both urban and suburban areas. Conversely, in metropolitan areas with lower cost housing but with lower amounts of new supply, it is the general ageing of homes – post-war or not – that is the significant driver of lower socioeconomic status.
Conclusion
Planning literature has singled out undesirable characteristics common to post-war homes and housing developments as sources of low and declining neighbourhood socioeconomic status. However, the true role of post-war structures and developments cannot be fully ascertained without considering the confounding effect of housing age. Post-war homes are middle aged and are physically depreciating. Thus, it remains unclear whether housing age or undesirable post-war housing characteristics are contributing to observed neighbourhood status. Further, important heterogeneity in the relationship between post-war housing and neighbourhood status may exist across urban versus suburban built environments. This heterogeneity may also extend across metropolitan areas that vary with respect to housing market pressures associated with new housing supply growth and housing prices.
I contribute to the literature by identifying a post-war vintage effect separately from an age effect at the neighbourhood level. Aggregate results indicate that neighbourhood socioeconomic status is predominantly associated with the ageing of housing within the neighbourhood. However, a small systematic negative post-war effect remains after controlling for housing age along with local characteristics and metropolitan-level trends. Exploring this effect within and across urban and suburban built environments highlights a larger negative post-war effect associated with more urban forms of post-war neighbourhoods and a positive effect associated with less dense outer ring suburban forms.
When looking across metropolitan areas that face variation in new housing supply growth and price, significant heterogeneity is also found. Neighbourhoods in metropolitan areas with limited growth accompanied by lower house prices display significantly lower levels of income associated with the presence of older homes generally, but not post-war homes separately. Conversely, in metropolitan areas with high housing supply growth and lower prices, more post-war housing within a given neighbourhood is uniquely associated with lower levels of income. Thus, income-related preferences over post-war housing may exist but are only being exercised when newer, affordable alternative housing options exist. Importantly, these results are USA-specific and cannot be generalised to post-war housing and neighbourhoods in other countries.
The effect of ageing is putting many post-war neighbourhoods at risk of wholesale deterioration as this vintage reaches a critical age in terms of the cost of maintenance. In metropolitan areas with new affordable alternatives to this housing stock, the undesirable characteristics of post-war housing may add to age-associated depreciation. This depreciation, however, allows for housing stock to filter down the income distribution and in turn provides housing to lower-income households (Rosenthal, 2014). But providing deteriorating low-quality housing to lower-income households is not desirable. Across metropolitan areas in the USA, it is socioeconomically disadvantaged households – poor households with children and older adults in particular – that face the most acute home repair needs (Divringi et al., 2019). Further, the small size of many post-war homes may increase the risk of overcrowding in lower-income post-war neighbourhoods. How do we ensure that at-risk households are not further burdened by ageing and/or obsolete housing? Should policy vary across metropolitan areas depending on market conditions and the built environment? And what are the potential obstacles associated with deploying such policies?
Renovation of existing and construction of new affordable housing could lessen the burden of ageing and obsolete housing on at-risk households. Existing subsidy programmes for renovation and retrofitting already address issues related to age and construction material and can be applied directly to post-war housing. However, the ability to remedy functional obsolescence related to size (total square footage, number of bedrooms, number of bathrooms, etc.) may be limited given the amount of investment needed for the scale of renovation required to address issues of size. Additional policies should consider the relaxation of single-family zoning to allow for new affordable multi-family developments. Combined, subsidy programmes and zoning relaxation have the potential to increase the supply of appropriate and safe housing options for lower income families.
Policy should also consider specific spatial contexts of post-war housing and neighbourhoods. Urban and inner ring suburban post-war neighbourhoods may represent locations that are more proximate to transit and central areas of employment – a crucial neighbourhood characteristic for lower income families. In metropolitan areas with housing supply constraints coupled with high prices, these neighbourhoods are likely future targets for wholesale redevelopment. In metropolitan areas with ample new supply and lower housing prices, post-war neighbourhoods experience relatively low levels of status regardless of urban or suburban location. Less accessible outer ring post-war neighbourhoods may be particularly burdensome for lower income families as households make trade-offs between housing costs and commuting costs.
The interconnectivity between housing, employment, and transportation highlighted here provides support for holistic regional housing policies. It is argued that geographically broad approaches to policy could limit sprawl and subsequently reduce traffic congestion while simultaneously promoting social equity (Basolo and Hastings, 2003). Regional policy may be additionally beneficial for post-war suburbs that land in ‘policy blind spots’ as they are not separate political jurisdictions and therefore do not qualify for state or federal funding (Orfield and Puentes, 2001). However, success of regional housing policy has been mixed largely due to the unwillingness of communities to accept more affordable housing (Basolo and Hastings, 2003). Banning strict single-family zoning across a metropolitan area and not just in limited locations may prove to be a crucial first step in the implementation of successful regional policy. While the results of this paper identify substantial variation in the relationship between post-war housing and neighbourhood socioeconomics, taken together they reaffirm the need for policymakers to treat seriously the potential negative externalities associated with housing characteristics.
Footnotes
Declaration of conflicting interests
The author(s) declared no potential conflicts of interest with respect to the research, authorship, and/or publication of this article.
Funding
The author(s) received no financial support for the research, authorship, and/or publication of this article.
