



Abstract
We examine the relationship between rail accessibility and the pattern of demographic characteristics at long-established Rail Transit Served Communities. The analytical methods involve the juxtaposition of property premium estimates and assessment of spatial effects on demographic composition. Despite finding considerable property premiums associated with access to rail transit across metropolitan Sydney, we report little evidence of sorting in relation to economically advantaged or disadvantaged residents. Further, the demographic groups commonly linked to gentrification, including high-income and professionals, are not found to dominate areas of high rail accessibility and only those with advanced educational qualifications are shown to increase in concentration with closer access to rail transit.
Introduction
As cities throughout the world upgrade and extend their rail transport infrastructure the impact on neighbourhood demographics, that is, residential sorting, and the implications for transit accessibility become important issues. Proponents of new rail infrastructure emphasise its strong environmental and economic benefits. Rail offers a low greenhouse gas emissions alternative, promotes urban consolidation and reduces urban sprawl. It also improves labour productivity by increasing the scale and efficiency of spatial economic interactions (Maré and Graham, 2009). On the other hand, critics raise concerns about the impact of rail-induced property premiums on disadvantaged groups in relation to residential attainment, and matters of occupational and social mobility. Indeed, while rail infrastructure is often seen as being crucial for sustainable long-term urban development there appears to be little knowledge of its impact on residential sorting, defined by Maré et al. (2012) as the distribution of households and individuals across neighbourhoods. Zuk et al. (2015: 3) point out that ‘At a time when so many…regions are considering how best to accommodate future growth via public investment, developing a better understanding of its relationship with neighborhood change is critical to crafting more effective public policy’. In this paper we contribute to the literature by investigating whether property premiums and other rail-induced consequences are related to demographic characteristics nearby rail stations using Australian data for metropolitan Sydney.
The bulk of residential sorting literature focuses on the process of suburban renewal, predominately studying the decline, and subsequent revitalisation and gentrification of neighbourhoods. These studies typically deal with short term changes in property values that emerge from a revaluation of neighbourhood attributes in response to various catalysts, such as public investment. The evidence from this strand of literature suggests that declines in affordability can lead to neighbourhood income inequality and other demographic shifts. This occurs because better-off households are able to sort according to their preferences and less well-off are subject to displacement (Reardon and Bischoff, 2011; Watson, 2009).
While investment in public transit can increase the value of surrounding neighbourhoods, our understanding of its potential to catalyse long term residential sorting is inconclusive. A number of studies find that neighbourhoods with a higher concentration of public transit are more likely to attract lower income households who cannot afford private transport (Brueckner and Rosenthal, 2009; Giuliano, 2005; Glaeser et al., 2008). However, other research indicates that neighbourhoods with a greater concentration of transit services can be more attractive to higher-income residents, because of job access and the amenities that emerge at transport hubs (Duncan, 2011; Taylor and Ong, 1995). Barton and Gibbons (2017) provide support for this hypothesis by reporting that the concentration of, specifically, rail transit predicts higher income levels. Moreover, Pollack et al. (2010) suggest that high-income, car owning residents tend to price-out core transit users, that is, renters and low-income households, from transit-rich neighbourhoods. Finally, McKenzie (2015) finds that rail-accessible neighbourhoods have younger populations, less families with dependants, better incomes, higher educational attainment and a propensity to use rail transit.
In this paper we shed light on the relationship between rail accessibility and the residential sorting of key demographic groups in the context of the metropolitan Sydney region. The groups selected from the literature relating to gentrification and displacement, are those likely to influence, or be influenced by, property price premiums and other factors concerning accessibility. However, it should be noted that our analysis does not attempt to explore changes linked to gentrification and displacement over time. This would be impractical given the scope of the study, which involves station openings that span more than a century. Rather, we examine Rail Transit Served Communities (RTSCs), at a point in time, to explain demographic structure at different levels of rail accessibility. In this way, we can compare the uncovered patterns with those that the literature suggests are likely to be found at communities transitioned by significant public attributes.
Our study provides a twofold contribution to the literature. First, we reveal the extent of rail-induced residential property premiums across metropolitan Sydney. Thus, we address the lack of evidence concerning proximity premiums at established RTSCs in this region. Second, we examine how these premiums, along with other factors associated with rail access, are related to the concentration of several demographic groups. This will establish the demographic characteristics of neighbourhoods in RTSCs and provide insights into potential sorting effects nearby future rail developments.
To measure the impact of rail station proximity we collected data on 23 long-standing rail stations interspersed throughout metropolitan Sydney, and divided each of these target locations into accessibility zones based on distance to the rail station. We also considered the effects of spatial variability taking into account cross-metropolitan differences. Thus, we provide a first attempt to analyse all key demographic variables in a comprehensive exploration of RTSCs across the metropolitan Sydney region.
We chose to investigate metropolitan Sydney for two reasons. First, the city has an effective rail system, which is valued by the community it serves. Second, its rail system is sufficiently mature to allow for the emergence of distinctive demographic patterns at locations surrounding rail access sites. This is particularly important since the literature reports that the process of sorting is slow (Wei and Knox, 2015), meaning that demographic patterns are best observed not at locations that have recently experienced changes to their attributes, but rather at those that have had sufficient time to fully respond to such changes. Rail transit is also an important part of the city’s future urban development strategy. Like many cities around the world, Sydney has embarked on significant investments in metro rail, including a AUS$20 billion two-stage project, which constitutes Australia’s largest ever transit infrastructure undertaking. This increase in rail investment in Sydney, as well as abroad highlights the need to understand its relationship with residential sorting.
We summarise our results as follows. Despite revealing considerable rail-induced property premiums across metropolitan Sydney, this study finds little evidence of sorting according to residents’ economic and social status. The demographic groups commonly linked to gentrification, including high-income and professionals, are not found to dominate areas of high rail accessibility. Only those with advanced educational qualifications exhibit greater concentration with closer access to rail transit. Also, we find no clear evidence that vulnerable groups necessarily avoid rail-induced location costs. Similarly, we report no evidence for the greater incidence of motor vehicle ownership nearby rail stations. Only families with dependants appear influenced by rail-induced property premiums. Regarding geographical differences, spatial analysis suggests considerable variation in property premiums associated with station distance across the metropolitan region. These differences are found to have implications for residential sorting based on educational attainment, employment, family structure, tenure and motor vehicle ownership. Our results provide useful information for policymakers, urban planners, equity advocates and businesses that rely on understanding rail-induced effects and residential sorting.
Empirical methodology
Rail-induced premiums are the manifestation of the utility offered by proximity to rail stations, which is capitalised into property values. Premiums are primarily driven by incoming residents who desire convenient access to rail transit. However, the same premiums may act as a deterrent to those who are less willing or unable to pay for accessibility. These effects can be seen as the advantages and disadvantages, or the externalities, associated with living in the proximity of rail transit. Given that these effects vary with distance from a rail station, our task is to identify how demographic structure corresponds with different levels of rail accessibility.
Our approach, which draws on Carleton (2019), is based on a sequential procedure that proceeds in three steps. First, we explain the relationship between property premiums and rail accessibility at established stations in metropolitan Sydney. Our study employs the Hedonic Pricing Model (HPM) to ascertain if the utility associated with rail transit manifests itself in the form of property price premiums and if it is influenced by geographical distance to rail access. Essentially, it is a ‘Global’ model which estimates the average magnitude of rail-induced location premiums at accessibility zones surrounding rail stations. The HPM assumes that market property prices can be modelled as:

where
P = Property transaction price;
S = A vector of variables relating to property structural features;
A = Measures of location relative to important points of reference, such as public transport and employment centres;
N = Local environmental factors that influence quality of life.
Second, it is likely that property premiums vary over the metropolitan area. Thus, we formulate a ‘local model’ known as Geographically Weighted Regression (GWR) 1 to assess the behaviour of factors that influence residential property prices. This technique operates within a traditional regression framework but incorporates local spatial relationships. Our study employs a semi parametric Gaussian GWR model described as:

where
Pi Property transaction price at point
(
The significance of GWR for the present research is its ability to reveal local patterns in the data and to shed light on some of the variance unexplained by the HPM. For example, if HPM results suggest a decay of price premiums with greater distance from the station, the GWR model will identify how representative this finding is across different locations and whether there are exceptions to the global average. If there are intrinsic variations across the study area then this may qualify HPM findings and influence our approach to demographic analysis.
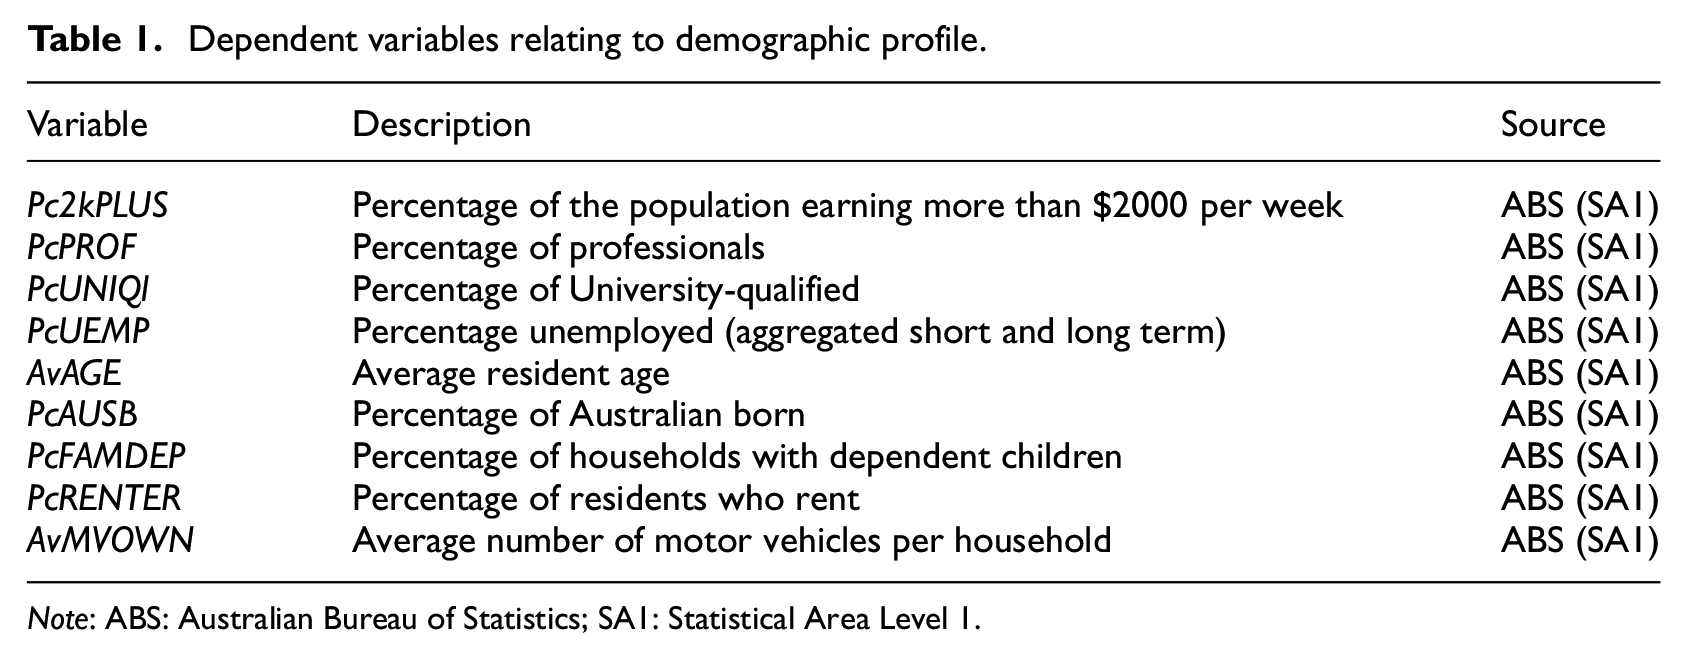
The third step of our modelling is the main focus of this study. It involves an analysis of residential sorting at the study locations. The task here is to determine if the concentration of demographic variables is spatially dependent on rail accessibility zones which exhibit different rail-induced property premiums. Demographic factors used in this study are listed in Table 1.
Dependent variables relating to demographic profile.
Note: ABS: Australian Bureau of Statistics; SA1: Statistical Area Level 1.
The choice of demographic factors used to examine sorting is guided by the literature on the role of public investment in driving gentrification and displacement. Gentrified communities are often studied in terms of residents’ income, profession and educational status (Atkinson, 2000; Kahn, 2007). Evidence of displacement generally considers age, housing tenure, family structure, employment status and ethnicity (Atkinson, 2000; McKenzie, 2015; Schill et al., 1983). Further, and specifically related to transit locations, car ownership is considered an important metric to gauge the success of modal substitution in urban transport (Pollack et al., 2010). Regarding ethnicity the relevant issue in Australia is the vulnerability of immigrants who may have less access to financial support than locally born residents. For the purpose of this study recent immigrants proxy for ethnicity.
Analysis of residential sorting employs a regression analysis to isolate the effect of distance from rail stations. Control variables for the regression are drawn from the price premium model and include quality of rail transit service factors, motorway accessibility, the size of respective local commercial complexes (by employment), access to the nearest recreational body of water, metropolitan districts and population density. All these additional factors are likely to influence location affordability and therefore residential sorting. Our model is expressed as:

where:
We employ two criteria to determine if rail accessibility and demographic patterns are related. This involves comparing the modelled behaviour of both property premiums and the concentration of demographic characteristics. In doing so, we reveal the groups that underpin premiums and those that seek to avoid them.
Study location and data
Sydney currently has around 5.23 million residents and is designated an Alpha+ Global City with regional economic status similar to Singapore, Shanghai and Hong Kong. With strong population growth and limited options for city centre or greenfield expansion, urban planners have opted for land use intensification and a polycentric urban environment. This involves dispersing job opportunities, retail and cultural facilities throughout the metropolitan area, along the strategic corridors of a hub and spoke rail system. Coinciding with polycentrism, zoning regulations have been implemented to encourage residential intensification nearby public transport infrastructure in growth areas. 2
Our data comprise demographic characteristics compiled for neighbourhoods in the proximity of 23 rail station sites which have been in operation for at least 30 years. The residential price data draws on 11,912 medium to high density housing (MHDH) 3 transactions between 2010 and 2012 with prices adjusted to 2011 dollars (AdjPRICE). Similarly, demographic data are collected from the census of the same year. Demographic data are aggregated at the SA1 neighbourhood level, which is the smallest geographical unit of ABS census data. SA1s generally contain between 200 and 800 residents and average 400 residents. This study involves 857 SA1s which are carefully aligned with observations from the first stage analysis. 4 That is, SA1 neighbourhood characteristics (Table 1) are assigned to each house transaction observation and then both sets of data are split into one of five accessibility zones.
Accessibility zones are constructed on the basis of ‘walk to’ distances to rail stations as follows 5 :
Zone-1 (maximum 200 m from the closest station entrance) represents the immediate rail catchment area. Although this zone offers close access to rail transit, it is also subject to potentially negative externalities associated with station proximity and the surrounding commercial complex.
Zone-2 (201–600 m) represents the primary rail catchment region where an increasing number of walk trips is concomitant with greater distance from the station.
Zone-3 (601–1000 m) contains the average walk distance of trips to the station.
Zone-4 (1001–2000 m) is the outer limit of the catchment area 6 in a range where trip frequency falls with greater distance from the station. 7
Zone-5 (greater than 2001 m) constitutes an area of low rail accessibility, where rail stations have limited value. In this zone residents’ first mode of transport is likely to be other than rail. Zone-5 acts as the control location, which provides the benchmark to gauge price/sorting differences in the other access zones.
The influence of metropolitan spatial diversity is also an important consideration. In this study, zone premium/demographic data are classified into one of six Sydney metropolitan districts representing areas of greatest community homogeneity. 8 Station locations and district boundaries are shown in Figure 1 below.
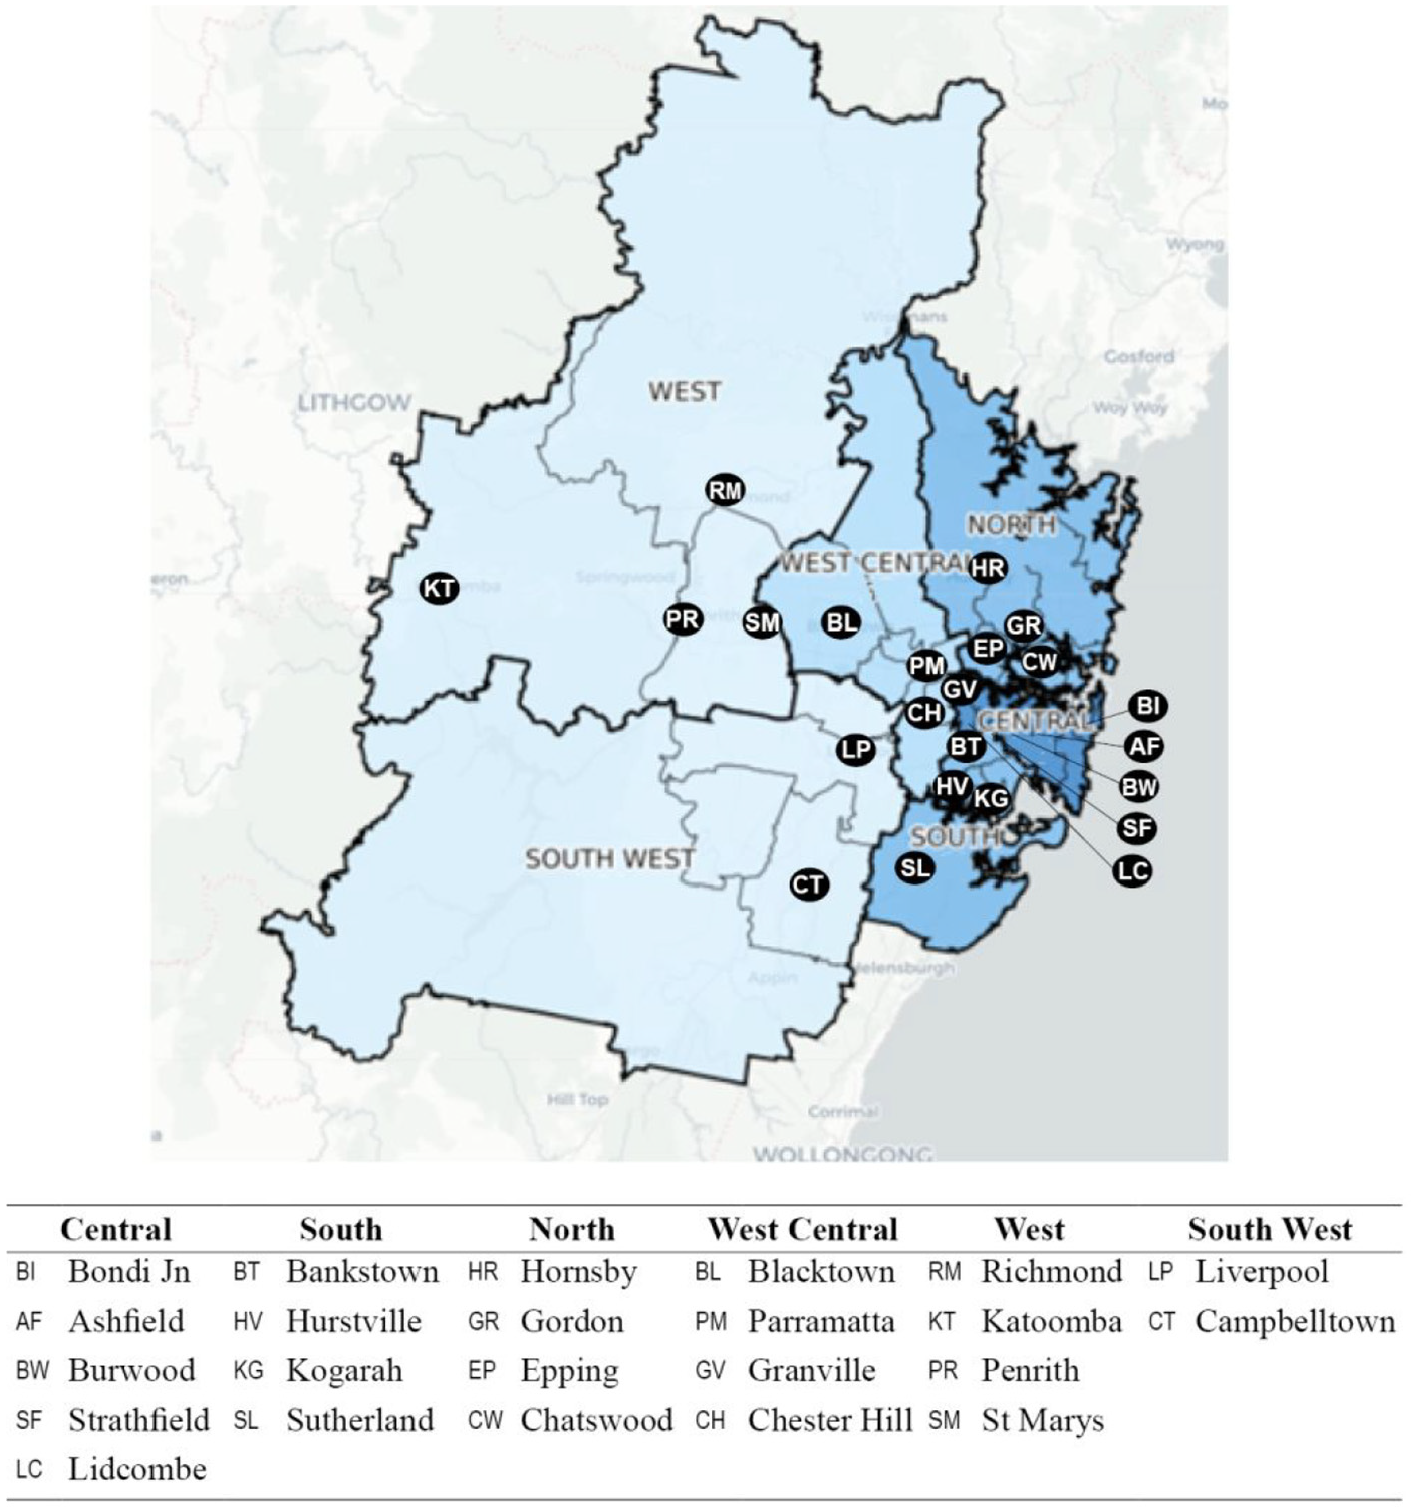
Study locations and Sydney metropolitan districts.
Descriptive statistics are presented in Table 2, which relates to data taken from all zones. Variables include four geographical features and each of the pertinent demographic group statistics.
Key variables by district.

Districts differ primarily due to their proximity to the CBD and coast. For example, Central, North and South districts offer more desirable locations than districts farther west due to their relatively easier access to the CBD and the coastal or harbour environments. Proximity to the coast is particularly desirable given its aesthetic appeal and moderate climatic conditions. Although less desirable in terms of ambience, the West Central district has the advantage that it is the geographic centre of the Sydney metropolitan region. This district includes Parramatta, which is earmarked for development as Sydney’s ‘alternative’ CBD. The remaining outer districts, comprising West and South West, are developing areas with a focus on more affordable single-family detached housing. Nevertheless, some suburbs in these areas feature high value residential property.
Table 2 reveals a noticeable east to west reduction of property values (ADJPRICE). It should be noted that the valuation advantage of the North district is not particularly aligned with population density (SPOPDN), as it appears in other districts. This suggests other factors at play, such as the attraction of the North’s unique aesthetics and the desire and ability of residents to secure large residential lots. On the other hand, greater housing price pressure is generally associated with a higher propensity for medium to high density residential housing (PcMHDH). As expected, demographic groups often associated with gentrification such as high income (Pc2KPLUS), university qualified (PcUN IQL) and professionals (PcPROF), are more likely found in districts with higher value housing.
Empirical findings
We start by discussing rail-induced house price premiums and then turn to our results on residential sorting due to rail station proximity.
Rail accessibility and property price premiums
The dependent variable is the log of indexed (adjusted) property prices, which is transformed to reduce skewness and also to aid the interpretation of the results. A HPM is estimated with MHDH sales data across the study area represented by 41 predictive variables relating to property structure, accessibility and neighbourhood characteristics. Overall, the HPM achieves a high degree of explanatory power with an adjusted R2 of 0.809 and a high F statistic, which supports model performance. Furthermore, the random behaviour of residuals and lack of heteroscedasticity suggest low risk of misspecification through omitted variables.
Pertinent results from this model concern the zone variables. After controlling for the size of the local commercial precinct and other factors we find that areas of high rail accessibility, represented by variables Zones-1, 2, 3 and 4, each register positive coefficients when compared with control Zone-5. Specifically, location premiums registered for Zone-1, 2, 3 and 4 are 13.1%, 17.1%, 13.1% and 5.5%, respectively. This shows that the rail accessibility price premium is highest at Zone-2 ($77,463) and this drops away in Zone-3 ($59,343) and again in Zone-4 ($24,915). The fact that the price premium in Zone-1 is less than Zone-2 is not unusual. Zone-1 is subject to the negative impact of externalities associated with station adjacency. The coefficient of each accessible zone is significant at the 1% level.
Other accessibility factors that emerge from the HPM and may influence settlement patterns are rail service quality, motorway access and the size of the local commercial complex. Regarding the quality of rail service variables, the results show stations that offer parking and more rail lines, and therefore better connectivity, are associated with higher property values compared with other station locations. Next, motorway access generates price premiums within 500 m of the access point. Finally, the net result of positive and negative externalities associated with the size of the local commercial complex produces a highly significant and positive coefficient. This means that home seekers value local communities with greater employment potential and larger commercial and public infrastructure.
Having reported these baseline findings we proceed to extend the study via GWR modelling, which is used to augment the analysis with geographical location. GWR examines local processes that give rise to spatial autocorrelation and spatial heterogeneity. While global HPM analysis provides an important indication of the average effect of rail a local GWR model highlights evidence of non-conformity at the sub-region level.
In this study, GWR model diagnostics suggest improved model performance compared with the initial global model approach. First, they indicate an increase in the adjusted R2 from 0.809 to 0.891, over the HPM, implying that GWR provides a better explanation of housing prices, after taking into account the degrees of freedom. This is further corroborated by a substantial reduction in the Akaike information criterion (AIC) statistic indicating a model of better fit. Finally, the F test result suggests there is significant improvement over the global model.
Concerning the results of the GWR model, we focus on the behaviour of the variable measuring distance to the station, which is expressed as a continuous variable ln(STN). The results show that the impact of this factor changes in magnitude and sign over space which suggests that residential price decay relative to station distance does not uniformly apply across metropolitan Sydney. Indeed, in some cases property values may actually rise with greater distance to the station. The latter’s exceptional circumstances are due to the competing attraction of a waterside aspect, which counters and dominates the effect of rail accessibility. This geographical attribute is likely to be reflected in demographic patterns. A continuous distance control variable for proximity to water should, therefore, be included when considering residential sorting.
As noted, GWR reveals considerable price variation across the metropolitan area, which suggests that rail accessibility generates different proximity premiums depending on geographical location. Areas nearby rail access which have fewer employment centres and greater commuter distances are valued less than other areas. The output from this exercise suggests that the global model spatial averages tend to underestimate the price effect of accessibility in the CENTRAL, NORTH, WEST CENTRAL and SOUTH districts and overestimate its effect in the WEST and SOUTH WEST districts (Table 3). Hence, districts are an important consideration in terms of the potential impact of rail on residential sorting.
Estimates of the coefficient for distance to the station [dependent variable: ln(AdjPRICE)].

GWR confirms that inner suburbs are generally more densely populated than those on the fringe of the metropolitan area. However, there is some evidence that suggests, at least in the inner suburbs, a tendency for greater density nearby rail stations. These population density differences reflect land demand and are consistent with the estimates of proximity premiums found in the price premium results. Population density and price constraints conflate to produce limited dwelling configurations and tenure types that may not be suited to all demographic groups. This reinforces the notion of selective tenancy at rail locations based on prospective residents’ perceptions of economic utility by rail transit and moderated by the costs associated with accessibility and the suitability of local characteristics and housing types.
An indirect effect of rail-induced property premiums is the tendency to foster MHDH housing nearby rail stations. Many SA1 inner district neighbourhoods close to rail hubs register 100% MHDH occupancy. This is partially attributable to rail access and partially due to other factors, such as the size, importance and desirability of the local commercial district. Given the prominence of MHDH nearby rail stations, it is important to understand the relationship between this housing type and residential sorting.
Life-cycle considerations may influence the location decisions of families with dependants. Australian Bureau of Statistics (2017) data show the age group most likely to begin a family (25–34) are common in apartment occupancy. On the other hand, older age groups with established families (children aged between 5 and 14) are more likely to occupy single family detached dwellings. This conforms to the conventional view that areas with a higher proportion of apartments feature younger residents and a smaller proportion of families with older children. However, from an average age perspective, specifically at locations nearby rail stations, this ignores the impact of older residents who rely on the convenience of rail transit.
National census data also show most apartments are rented (59%) with the remainder owned either outright or with a mortgage. This contrasts with separate dwellings where rental occupancy makes up only 21% (ABS, 2017). These observations lead us to posit that a higher proportion of renters occupy high rail-accessible neighbourhoods compared to neighbourhoods with low rail access.
Rail and residential sorting
For many home-seekers rail stations enhance the attraction of nearby neighbourhoods. We examined how this might manifest itself into differences in the demographic profile of neighbourhoods with high compared to low rail access. The magnitude of location premiums is an indication of the value attributed to the amenity. In this research, the utility and price effect are assumed implicit in the zone variables and residential decisions of home-seekers are expected to take these factors into account. Hence, controlling for the local commercial complex, and other factors affecting home-seeker decisions, the demographic patterns of rail accessibility zones are a response to the utility and/or costs associated with rail access.
The findings show that premiums, associated with rail access, tend to rise substantially between Zones-5 and 2 and then marginally fall in Zone-1, with the latter still recording a substantial premium (see Rail accessibility and property price premiums section). The study also reveals substantial variation of premiums across Sydney regions. This means different districts are likely to deliver different levels of rail access affordability. Having established the trajectory and magnitude of rail-induced property premiums, we are now ready to examine the sorting behaviour of demographic groups and how they respond to the utility/affordability associated with nearby rail access.
There are two parts to residential sorting analysis. The first part examines the overall distribution of each demographic variable to determine if it is weighted more heavily in rail-accessible neighbourhoods (Zone-1 to Zone-4) compared to neighbourhoods with limited rail access (Zone-5). The second part examines spatial patterns of the demographic variables in more detail. This involves testing if demographic patterns align with the behaviour of property price premiums identified in price premium results. The criteria for establishing evidence of a nexus between the pattern of property price premiums and the concentration of demographic variables are explained as follows.
Criterion 1: Determining dominant groups in rail accessibility zones
This exercise determines if a demographic group has, on average across the metropolitan region, a significantly larger concentration (at the 1% Level) in the combined high rail-access Zones-1, 2, 3 and 4, (GZ1234), compared with low rail-access Zone-5. If so, this is described as a dominant group. Only dominant groups are considered in Part 2 analysis.
Criterion 2: Determining residential sorting in rail accessibility zones
This criterion has two additional conditions that assess the relationship between rail accessibility and demographic patterns.
First, after controlling for the size of the commercial complex and population density in neighbourhoods with high rail access, a demographic group will, on average across the metropolitan region, have a significantly larger concentration in each of the first three high rail-accessible zones (Zones-1, 2 and 3), compared with low rail-accessible Zone-5.
Second, the concentration of a demographic group in Zones-2, 3 and 4 either diminishes or increases with distance from the station. 9 Meeting both these conditions indicates a strong association between rail accessibility and residential sorting. Hence, this analysis reveals how demographic groups respond to either the positive utility offered by close proximity to rail access or the negative costs it incurs. The application of the criteria leads to the following conclusions.
No significant trend in income and age distribution
Discriminant analysis was used to assess spatial dependency for determining dominant groups by regressing the demographic variable on GZ1234 only. The estimated coefficient results for both income (Pc2kPLUS) and age (AVAGE) variables revealed that there was no significant difference between GZ1234 and the base case Zone-5. This means the behaviour of observations for these variables do not satisfy the first criterion.
Dominant groups at rail accessibility zones
Table 4 shows a list of demographic groups that meet the first criterion. This identifies groups that are disproportionately represented in rail-accessible zones (GZ1234) compared to Zone-5. Three groups (PcAUSB, PcFAMDEP and AVMVOWN) return negative coefficients which means that overseas born residents, families without dependants and low motor vehicle ownership have proportionately greater representation in GZ1234 than their counterparts.
Results for GZ1234 with demographic characteristics as the dependent variables.

Criterion 2 requires the application of multivariate regression to isolate the relationship between accessibility and the concentration of demographic groups (See Empirical methodology section). The pertinent results of this exercise are reorganised and presented in Table 5, which shows zone coefficients for each demographic variable adjusted for spatial variations (recorded by district). At this point, it should be noted PcPROF is absent from the table. Although there is a positive weighting of professionals in the combined rail-accessible area (first condition, Criterion 2), the individual zone results show this is distinctly not the case for residences closest to the rail station. That is, Zones-2, 3 and 4 coefficients are positive and diminish with greater distance from the station. However, Zone-1 has a negative weighting and both Zone-1 and Zone-4 are not significant. Overall, the sorting pattern of professionals does not meet the second condition of Criterion 2 and is therefore excluded from further analysis.
Measuring variation across zones and districts.

Educational attainment variable (PcUNIQL)
The zone coefficients produced in Table 5 reveal a relationship between distance to the rail station and the concentration of university-qualified residents, across all districts. In this case, the signs of coefficients for Zones-1, 2, 3 and 4 are all positive and significant according to Criterion 2. Replicating the results presented in the property premium model, the largest coefficient for PcUNIQL is found in Zone-2 and this diminishes with increased distance from the station. The finding supports the postulate of rail access utility, which suggests the value derived from rail transit varies with proximity to the station.
Table 5 also demonstrates the magnitude of difference in the concentration of university-qualified residents across districts and zones. This conflation of zone and district estimates shows the highest concentrations of this group are found in NORTH, CENTRAL and SOUTH. However, the relatively small number of university-qualified residents in the western sector (WESTCEN, WEST and SOUWEST) dramatically reduces the magnitude of the concentration of this demographic group in the accessibility zones.
Unemployment variable (PcUNEMP)
The sign of each rail-accessible zone coefficient is positive and statistically significant. Also, the rail-accessible zone coefficients diminish in value with greater distance from the station. This suggests that rail travel is an important service for the unemployed and supports the notion that, for many in this category, the cost of alternative car transport may be an impediment to residing in communities with poor rail access. The premiums associated with rail-accessible neighbourhoods need not be a major issue for those that find themselves in long term unemployment. To some extent, this is mitigated by the provision of social housing in the Sydney metropolitan area and the tendency for this housing to be rail accessible.
Regarding the metropolitan districts, the spatial distribution of PcUEMP is contrary to the pattern encountered in the case of educational attainment. Table 5 shows that PcUEMP at WESTCEN, SOUWEST and West have relatively higher concentrations compared with the eastern districts. Again, this is intuitively correct considering the lower value of residences in the study locations. The highest relative concentration is found in WESTCEN, which has, overall, potentially larger employment opportunities than WEST and SOUWEST.
Australian born variable (PcAUSB)
The signs of coefficients for each zone are negative and significant. The magnitude of the PcAUSB coefficient grows with closer proximity to the station, which means there is an increasing proportion of non-Australian born residents. The strength of the relationship with rail access is clearly demonstrated by the fact that non-Australian born residents are undeterred by the negative externalities associated with very close proximity to the station (Zone-1). The data support the notion that immigrants generally value public transport more than Australian born residents and that rail accessibility contributes significantly to the spatial distribution of immigrants.
Another geographical factor that influences the location decisions of non-Australian born residents is population density which, can lead to higher MHDH concentration. In this case, the coefficient is negative and significant, which suggests that larger concentrations of Australian born are found in areas with lower population density and therefore the converse is true for immigrants. On the other hand, from a district perspective there appears to be little evidence of east/west differentiation, which is common to the pattern of other demographic groups. The highest concentration of non-Australian residents born is located in the WESTCEN district (Table 5).
Families with dependants (PcFAMDEP)
The difference in the prevalence of families with children is noticeable across geographies. Apart from WEST, which is not significant, there appears to be a preference for households with dependent children to locate outside the CENTRAL district. This is not surprising given that a unit of land size is relatively more expensive in the latter district. The theme concerning sensitivity to the residential property cost is also reflected in the lack of SPOPDN significance, which implies that property cost rather than space is the dominant driver behind family sorting.
Renters (PcRENTER)
Renters are subject to occupancy costs that are proportional to property values based on rental yields. Arbitrage ensures these yields are reasonably constant across the metropolitan area. However, in absolute terms rents vary, with locational premiums, according to station proximity. Given this, our findings indicate that, similar to non-Australian born residents, renters display strong evidence of spatial dependency. The sign of PcRENTER coefficients is positive for each zone and the magnitude diminishes with distance from the rail station. Similar to the results for non-Australian born, the concentration of renters grows progressively towards the station. In addition, the growing concentration is strongly aligned with zones despite the competing influence of SPOPDN.
Regarding broader geographical differences, Table 5 reveals that renters are more likely concentrated in SOUWEST and WEST where house prices, and therefore rents, at RTSCs are relatively low. However, CENTRAL registers the third largest proportion of renters, despite its high accommodation costs. This can be attributed to the attraction of a large job market and the prevalence of high paying employment in the district. Overall, while metropolitan districts are influential, rail-accessible zones have far greater impact on renter distribution.
Motor vehicle ownership (AVMVOWN)
Finally, this section examines the life-style characteristic concerning motor vehicle ownership and the influence location has on household vehicle numbers. Estimates for GZ1234 show a negative and highly significant coefficient. The results reveal average motor vehicle ownership is considerably lower (48.74 percentage points) in high rail-accessible neighbourhoods compared to neighbourhoods with low rail access. The t-statistic is also the largest recorded for all Criterion 1 analyses in this research and we find that GZ1234 alone accounts for approximately 34.83% of the variation relating to motor vehicle ownership. These results suggest location, particularly in relation to rail accessibility, has a substantial influence on average motor vehicle ownership.
There is clear evidence of diminishing average motor vehicle ownership as one moves closer to a rail station. Analysis reveals rail-accessible zones are overwhelmingly important amongst the set of predictive variables. Other significant factors are SEMPLOY and SPOPDN. The results show larger commercial complexes and areas of greater population density (where there are more public transportation options, including more abundant bus stops) feature lower motor vehicle ownership.
Conclusion
Despite heavy property premiums, in many respects residential sorting patterns in neighbourhoods nearby mature rail stations appear atypically gentrified. Contrary to previous research, young and high-income residents do not dominate rail-accessible areas. Also, the residential pattern of professionals, which is often associated with gentrification, registers no clear evidence in that respect. However, the study does reveal a greater concentration of residents with advanced educational qualifications in these areas.
Regarding groups considered susceptible to the effects of location premiums, we find no conclusive evidence that foreign born residents, unemployed and renters are disadvantaged in their pursuit of housing nearby rail stations. On the contrary, these groups are shown to underpin such premiums. Also, the notion that low-income households are supplanted by higher-income, car owning residents, at transit-rich neighbourhoods, is not supported by our study. Of the nine demographic groups examined, only families with dependants appear to be sensitive to rail-induced property premiums. This is evident after controlling for other factors such as population density, which can influence home-seeker location decisions.
This study gives rise to a number of matters for future consideration. First, while our analysis reveals that unemployed residents are not constrained by rail-induced property premiums it does not mean that housing for this, and other economically disadvantaged groups, is adequate. Second, although the study shows consistent age distribution across high and low rail access neighbourhoods, it does not delineate the effect of various age brackets. Anecdotal evidence alludes to the possibility that both younger and older residents prefer to locate nearby rail access, which may obscure the existence of some age bias detected at a more granular level.
Overall, our findings are a positive endorsement of policy, which aims to provide equitable access to transport and reduce reliance on motor vehicles at RTSCs. The study also alludes to the prospects of substantial value capture potential, which can be used to finance future rail projects and mitigate the risks of adverse unforeseen circumstances relating to residential sorting.
Footnotes
Declaration of conflicting interests
The author(s) declared no potential conflicts of interest with respect to the research, authorship, and/or publication of this article.
Funding
The authors disclosed receipt of the following financial support for the research, authorship, and/or publication of this article: Joyeux and Milunovich acknowledge support from the Australian Research Council Discovery Grant DP190102049.
