
Abstract
The risks of combustible cladding were most catastrophically illustrated by the Grenfell Tower fire in London in mid-2017 which killed 72 people. Prior to this, in late 2014, the Lacrosse Tower fire in Melbourne, Australia, provided a prescient illustration of the risks of combustible cladding. This study examines the effect on Melbourne prices, rents and transactions of these fires from 2005 to mid-2019. The dynamics of prices and rents provide important information about the extent to which the housing market reaction was driven by safety or financial concerns. This is because tenants are primarily exposed to the safety risks of combustible cladding while the prices paid by owner-occupiers reflect both safety and financial concerns – such as future remediation costs. We find an overall decline of around
Introduction
In the early hours of 25 November 2014, the Lacrosse Tower, in the Docklands area of central Melbourne, suffered a serious fire. The source of the fire was a stray cigarette butt discarded by an occupant on the eighth floor of the building. Within a couple of minutes, the fire had spread across several floors. The speed with which the fire expanded, and grew in intensity, was a result of the combustible cladding that the building had on its external walls. At its peak, the fire covered almost the whole of one side of the building, from the sixth to the 21st floor (Melbourne Fire Brigade, 2021). The building was evacuated during this event and, luckily, there were no fatalities.
As it later transpired, Melbourne’s Lacrosse Tower fire was a prescient warning of the dangers posed by combustible cladding. On 14 June 2017, the occupants of Grenfell Tower in North Kensington, London, were not as fortunate as those of the Lacrosse Tower. A faulty fridge ignited a fire on the fourth floor of the building. The fire spread rapidly and soon engulfed the whole building – aided by combustible cladding on the building’s exterior. The fire led to 72 people losing their lives. This event, and the graphic pictures of the charred and burning wreck of the Grenfell Tower, attracted significant global media attention.
These fires led to the ‘discovery’ of the widespread use and risks of combustible cladding in Australia, and elsewhere. This triggered a crisis that spanned housing policy and planning regulators in government, builders and materials importers in industry and property owners, occupants and investors in the housing market. The crisis is ongoing and is having important implications for each of these groups. In this study, our particular focus is on how the combustible cladding crisis impacted the housing market and why.
There is naturally significant interest in the size of the decline in prices for homes that were caught up in concerns about combustible cladding. Perhaps more interesting, in terms of better understanding how housing markets function, is the question of why prices fell. There are two main factors that could have potentially driven the dynamics of prices in response to the crisis. First, there are of course concerns about the safety of residential buildings containing combustible cladding – that is that one may perish in a combustible cladding-fuelled fire. Second, the price declines may also reflect financial concerns. The owners of properties containing combustible cladding are exposed to significant financial risk. This is because it is likely that authorities will require the combustible cladding to be removed from these buildings at some point. Some or most of this cost is likely to be borne by the owners. In this study, our key focus is on the question of whether safety or financial concerns were the main drivers of the housing market reaction to the combustible cladding crisis.
A key insight is that we can identify the relative importance of safety and financial concerns by comparing changes in rents and prices. This is because renters are exposed to the safety, but not the financial, risks of combustible cladding. On the other hand, prices paid by owner-occupiers reflect both safety and financial concerns.
We use data for Melbourne, from January 2005 to June 2019, to explore the dynamics of prices and rents over this period. An extended difference-in-difference (DID) method is proposed and applied. This examines trends in prices and rents before and after the fires for treated relative to control properties. One challenge we face is that the authorities have not made public which buildings have combustible cladding. This is purportedly because of the risk of terrorism (ABC, 2019). Despite this, participants in the housing market will likely have a clear idea of whether the building in which they reside has combustible cladding. They have access to non-public information, such as body corporate reports, discussions with building managers and real estate agents and information held by local planning authorities. 1
Given this complexity, we take a two-pronged approach to constructing groups of properties that are likely to be affected by combustible cladding. First, we define our main treatment group as high-rise properties built in 1997 or later. Our focus on this group of properties mirrors that of the Victorian Building Authority (VBA) – the government authority which regulates the building industry in Melbourne. They are currently auditing all buildings constructed since March 1997 that have three or more stories (Victorian Building Authority, 2021b). This reflects the regulator’s judgement that a high proportion of these buildings are likely to contain dangerous levels of combustible cladding. 2 On the contrary, buildings constructed prior to 1997 are much less likely to contain combustible cladding. Second, through extensive searches and inquiries, we can identify a subset of the treated buildings which we are certain contain combustible cladding. This information primarily comes from address-level requests to the VBA. 3 This second approach gives a more tightly defined set of properties that helps in better identifying the precise effect of combustible cladding. However, both treatment groups allow us to compare the movement of prices and rents for a similar group of properties and to shed light on whether safety or financial concerns drive the housing market response. We compare the dynamics of prices, rents and transactions for these two treatment groups against a control group – all high-rise buildings that were constructed before 1997.
A key challenge in DID analysis is ensuring that the set of control properties is representative of the treated properties. If price trends in treated and control properties are different before the fires, then the control group cannot provide a credible counterfactual for the treated group after the fires. We propose and apply a novel DID approach. This optimally re-weights the control observations so that the temporal dynamics observed for the weighted control group are similar to those of the treated properties before the fires.
As well as examining prices and rents, our study addresses some additional implications of the crisis. First, we identify the speed with which the twin fires were capitalised into Melbourne prices and rents. The Lacrosse Tower fire was the first fire in Australia that provided insight into the risks of combustible cladding. 4 The Grenfell Tower fire was a dramatically more salient event for many, because of the extensive global media coverage it received and the high death toll. 5 These two events are likely to have had different information content for different participants in the housing market. Second, we identify the size and timing of the price discount that property investors require to purchase a home affected by combustible cladding. This enables us to explore any differences between investors and owner-occupiers in their reaction to the fires. Third, we examine the transaction frequency of homes that were affected by combustible cladding. This provides some evidence about the liquidity of affected homes in response to the crisis.
Our results highlight a number of aspects of the combustible cladding crisis. First, we find that the properties exposed to combustible cladding risks exhibited significant price declines relative to control properties. Prices for treated properties that were built in or after 1997 fell by around
In section 2, we outline the literature related to our study. Section 3 discusses our data. Section 4 outlines the empirical methodology and the extended DID approach. In section 5, we outline and interpret our results. The final section summarises our conclusions.
Related literature
Our study is related to the large literature investigating the housing capitalisation effects of changes in local amenities. While our focus on the combustible cladding crisis is unique, other studies have looked at a range of related events, such as transport infrastructure (Lieske et al., 2021; Melser, 2020), prospective sea-level rise (Bernstein et al., 2019; Keys and Mulder, 2020), exposure to flood risks (Rambaldi et al., 2013), changes in school quality or characteristics (Haisken-DeNew et al., 2018; Melser et al., 2021), the effect of visual amenities such as wind farms (Gibbons, 2015) and the impact of informational shocks about nuclear power resulting from the 2011 Fukushima accident (Bauer et al., 2017; Fink and Stratmann, 2015; Kawaguchi and Yukutake, 2017; Tajima et al., 2016; Tanaka and Zabel, 2018). A key focus of these studies is quantifying the overall effect on prices of the events of interest. While this is also a focus of ours, we build upon existing analyses by using rents to quantify the importance of different mechanisms driving the change in housing prices (Melser, 2020).
A related focus of the literature has been on better understanding the temporal dynamics of price adjustment in response to such shocks. For example, following the Fukushima nuclear accident, Tanaka and Zabel (2018) found that the effect on US house prices in proximity to nuclear power stations was negative. But this effect was short-lived and dissipated after around a year. Beltrán et al. (2019) found a large negative impact on the price of homes in the UK shortly after they had been flooded. But the effect disappeared after four to five years. McCoy and Walsh (2018) looked at the impact of wildfires on house prices in the US state of Colorado and also found a relatively short-lived effect on home prices. We will add to this literature by documenting the temporal dynamics of the housing market response to the combustible cladding crisis.
We also focus on the question of housing market liquidity. A key feature of housing as an asset class is its illiquidity (Carrillo and Pope, 2012). It seems likely that properties affected by combustible cladding may have been more difficult to sell. In related work, Keys and Mulder (2020) found that properties that were exposed to sea-level rise experienced falls in transaction volumes of 15–20% in comparison to unexposed homes. Given this context, it is interesting to explore the extent to which homes affected by combustible cladding become ‘stranded assets’ and unsaleable.
Our study also addresses issues around informational asymmetries in housing markets. Kurlat and Stroebel (2015) have documented the fact that sellers who have lived longer in a local area, and hence are likely to be better informed, tend to get better prices. On the flip side, several studies have examined out-of-town home buyers compared with locals. Zhou et al. (2015) found they pay higher prices, while Chinco and Mayer (2016) show they earn lower capital gains than do locals. Our data enable us to separately examine the response of owner-occupiers, investors and renters to the combustible cladding crisis. This enables us to identify the extent to which these groups used or reacted to information differently throughout the period examined.
Data
Our primary data source is information on housing sales and advertised rents from Australian Property Monitors (APM). The housing sales information is an amalgam of administrative data from the state’s Valuer General (VG) – a government agency that records all housing sales as a matter of public record and to levy taxes – and from a major property listing website. 6 The VG data records information on sales prices. This is supplemented with data from the listing website on property characteristics, such as the number of bedrooms, bathrooms and car spaces. The rental data has listing prices from the same website. While they are not transaction rents, they are likely to closely approximate these given that there is limited negotiation over rents in Australia. Similar details on a property’s characteristics are available for the rental and prices data.
We also use data from the biennial Census of Land Use and Employment (CLUE) run by Melbourne city. This records information on the date of construction of a building and its number of floors. We use this information in constructing our treatment and control groups in line with the VBA. They audited buildings with three or more stories which were built in or after 1997. For housing transactions outside Melbourne city, we infer this information from the data. Using the transactions data, the construction year is calculated by identifying the earliest year in which a transaction took place for a building. We also record the number of unique units for which we have transactions and only focus on buildings with at least 20 or more. These buildings are likely to have at least three stories.
We have data for several inner- and middle-ring suburbs in Melbourne. Our study area has a population of more than half a million according to the 2016 census. Figure 1 illustrates the locations for which we observe home purchase transactions. We use data from the start of 2005 until June 2019. 7
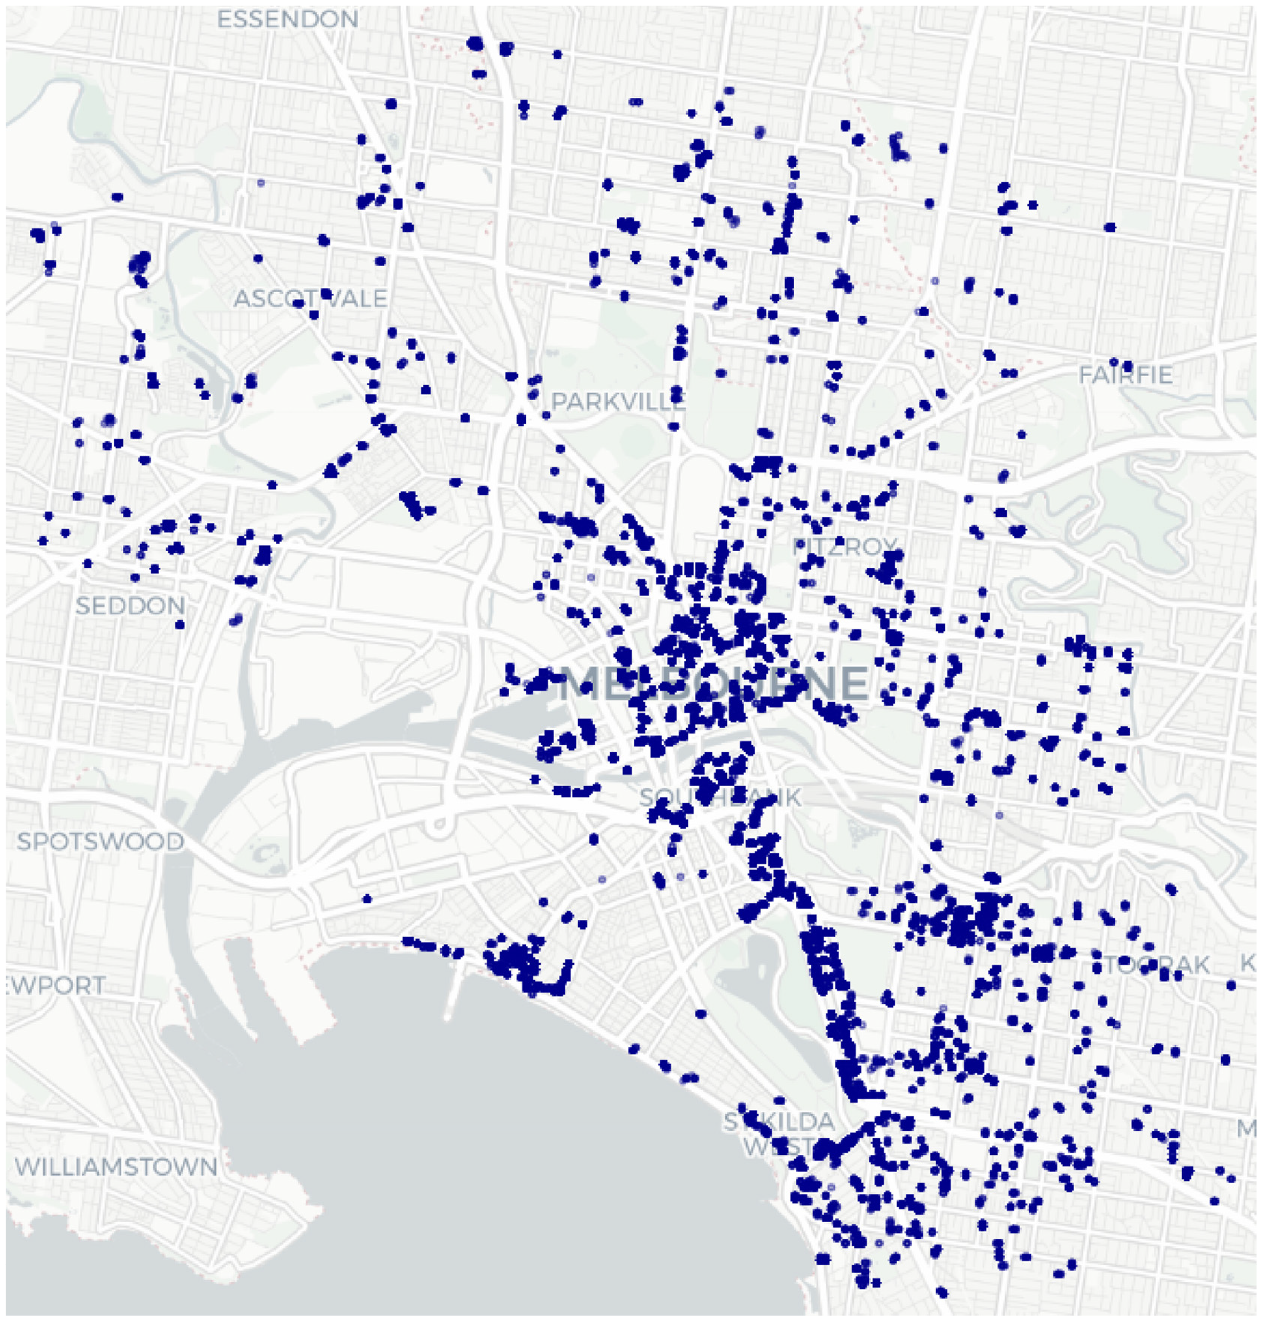
Geographic distribution of home sales in our data.
The fact that we have data on rents and sales prices means that we can identify transactions by investors, as compared with owner-occupiers. We consider a window of three years before and after the sale of a property. If the property was rented before the sale, then it is likely that the seller was an investor. Likewise, if it was rented after the sale then the buyer is also likely to have been an investor. This enables us to separately investigate the activity of investors and owner-occupiers in the housing market.
To model transaction frequency, we use the sales data to construct a panel data set as to whether a property sold in a particular period. This creates an observation for each property in each quarter since it was built. We create an indicator variable ‘sold’, which is equal to one if a property was sold in a particular period and zero otherwise.
Summary statistics
Let us now turn to an examination of the data. In Table 1, we report summary statistics for prices, rents and the transaction indicators across the various samples we use to estimate models.
Summary statistics.
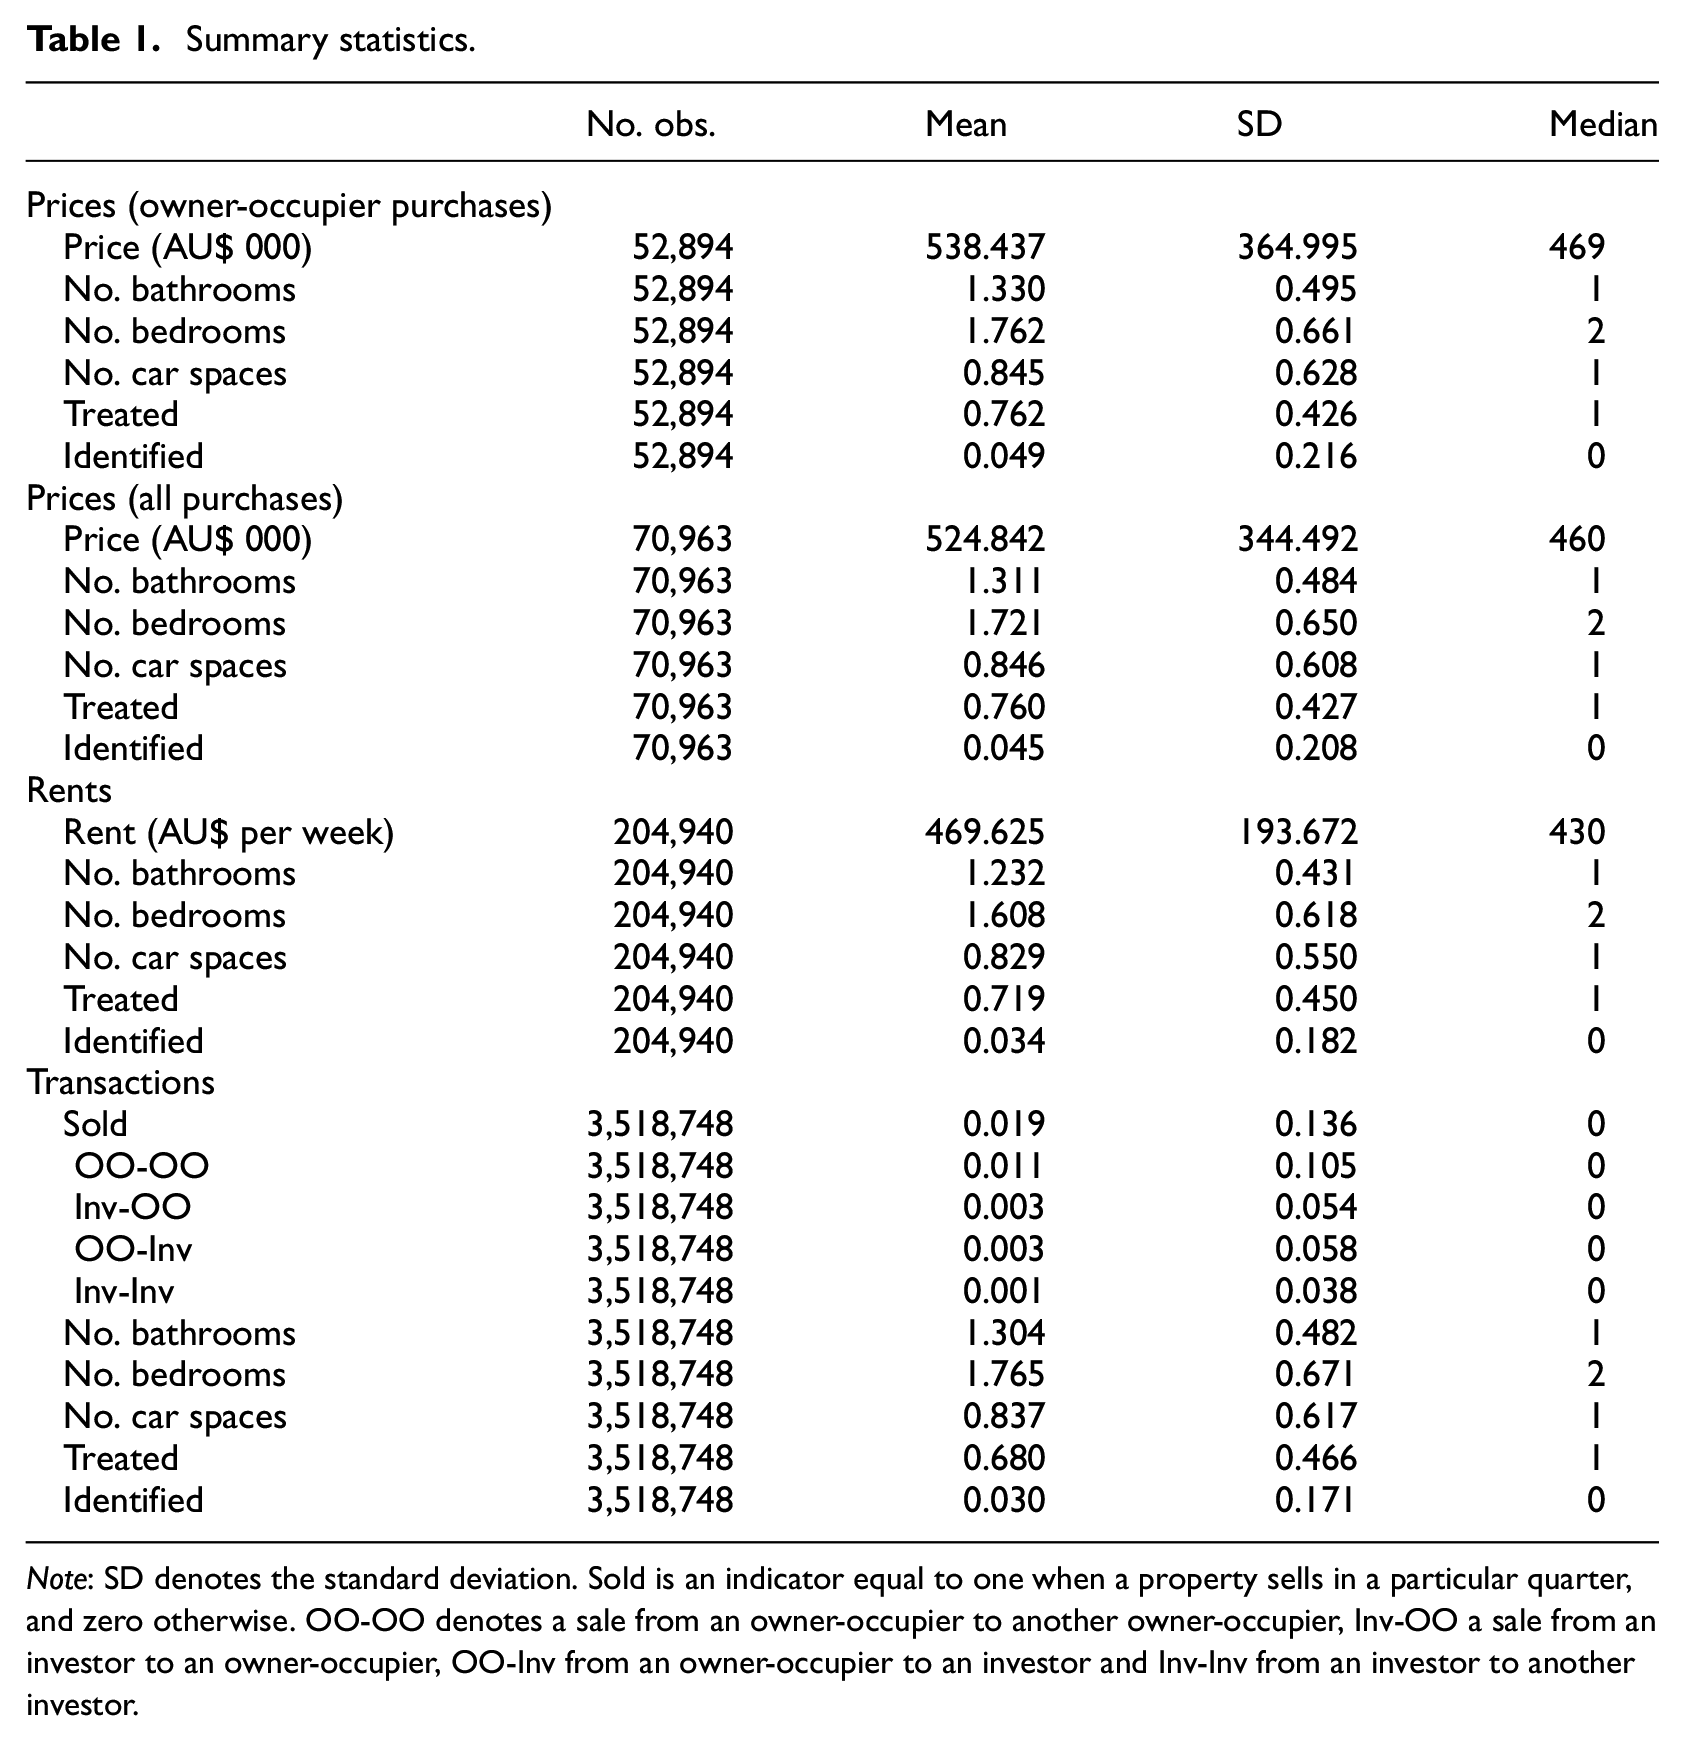
Note: SD denotes the standard deviation. Sold is an indicator equal to one when a property sells in a particular quarter, and zero otherwise. OO-OO denotes a sale from an owner-occupier to another owner-occupier, Inv-OO a sale from an investor to an owner-occupier, OO-Inv from an owner-occupier to an investor and Inv-Inv from an investor to another investor.
First, let us examine prices. We report two samples. The first is for purchases by owner-occupiers and has
Second, let us turn to rents. The number of rental observations is larger than that for home sales at
Third, the panel data set on transactions is, by construction, much larger than either of the prior data sets, with
Empirical methodology
We use an extended DID approach to examine the effect on prices, rents and transactions of the Lacrosse Tower fire in late 2014 and the subsequent Grenfell Tower fire in mid-2017. We compare properties which are likely to have had combustible cladding, and those which certainly did, to those which did not. An extended DID method is proposed which re-weights the control group so that it is as similar as possible to the treated group. We estimate a number of models. Our leading model is of the form,
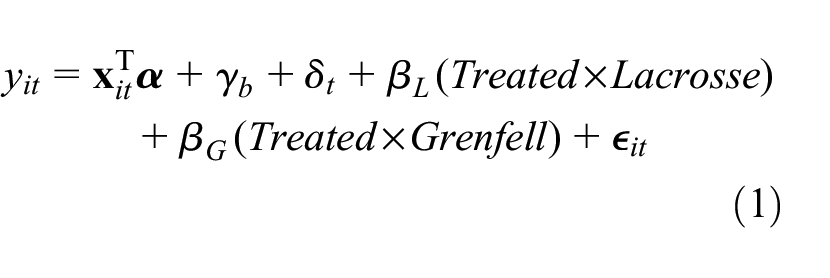
Here
First, we add additional effects to model (1) for the group of identified properties that we are sure contain combustible cladding. This provides a fuller picture of the effects of combustible cladding on the housing market and allows us to check the robustness of our main results.
Second, we investigate a more general model. In equation (1), it is assumed that treated and control groups exhibit common trends. Indeed, this is the key identifying assumption required to generate a plausible counterfactual for the treated group. In order to explore the reasonableness of this assumption, we estimate a model which allows for unique time trends for treated and control properties. Here we drop the various treated dummy variables in equation (1) and instead include separate time-dummy functions for treated,
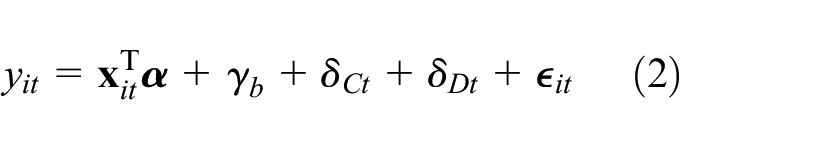
Naturally, this model nests the model shown in equation (1), as it allows for a unique time trend for treated and control groups. This model provides useful visual insights into differences in the effects of the fires on treated and control properties (Kawaguchi and Yukutake, 2017; Melser, 2020).
We extend the usual DID approach by developing a novel method for improving the similarity between the treatment and control groups. Ideally, we would like trends in prices/rents/transactions to be as similar as possible between the treated and control groups before the fires. If this is the case, then the control group is likely to provide a plausible counterfactual for the treated observations. Our approach is related to the synthetic control method developed by Abadie (2021). Like this approach, we seek to re-weight untreated observations so that they provide a more accurate control group for the treated observations. Our context is different from that in which synthetic control is generally applied, because there are many thousands of potential control observations and they are not observed every period. To address this, we re-weight observations for each building in the control group. This reduces the number of parameters to estimate because many of the observations will be in the same buildings. The weights are chosen so that the time trends for control observations better mimic those of the treated observations prior to the Lacrosse Tower fire. 8 Once we have the optimal weights, we proceed with a standard DID analysis by estimating equations (1) and (2) using these weights.
Results
We now turn to our results. In the subsequent sections, we discuss our results for prices, rents and transactions. We compare the results using both equal and optimal weights for control properties. In our results, Treated properties are those built from 1997, which are very likely to contain combustible cladding, and Identified properties are those which we are certain contain combustible cladding. Control properties are those built before 1997.
Prices
In Table 2, we report a range of results outlining the impact of the Lacrosse and Grenfell fires on home prices. Model P1 estimates equation (2). This allows for a different time trend in treated and control properties both before and after the fires. The price indexes are illustrated in Figure 2. Model P2 is similar except we use optimal weights. The purpose of this re-weighting of observations is to make the time trends in the control group as similar as possible to the treated group prior to the fires. We can see that it does this as the treated and control indexes are much closer in the figure which uses optimal weights than in the equally weighted case. Table 2 also shows that in the optimally weighted case we cannot reject the null hypothesis of common trends with a p-value of
Results – prices.
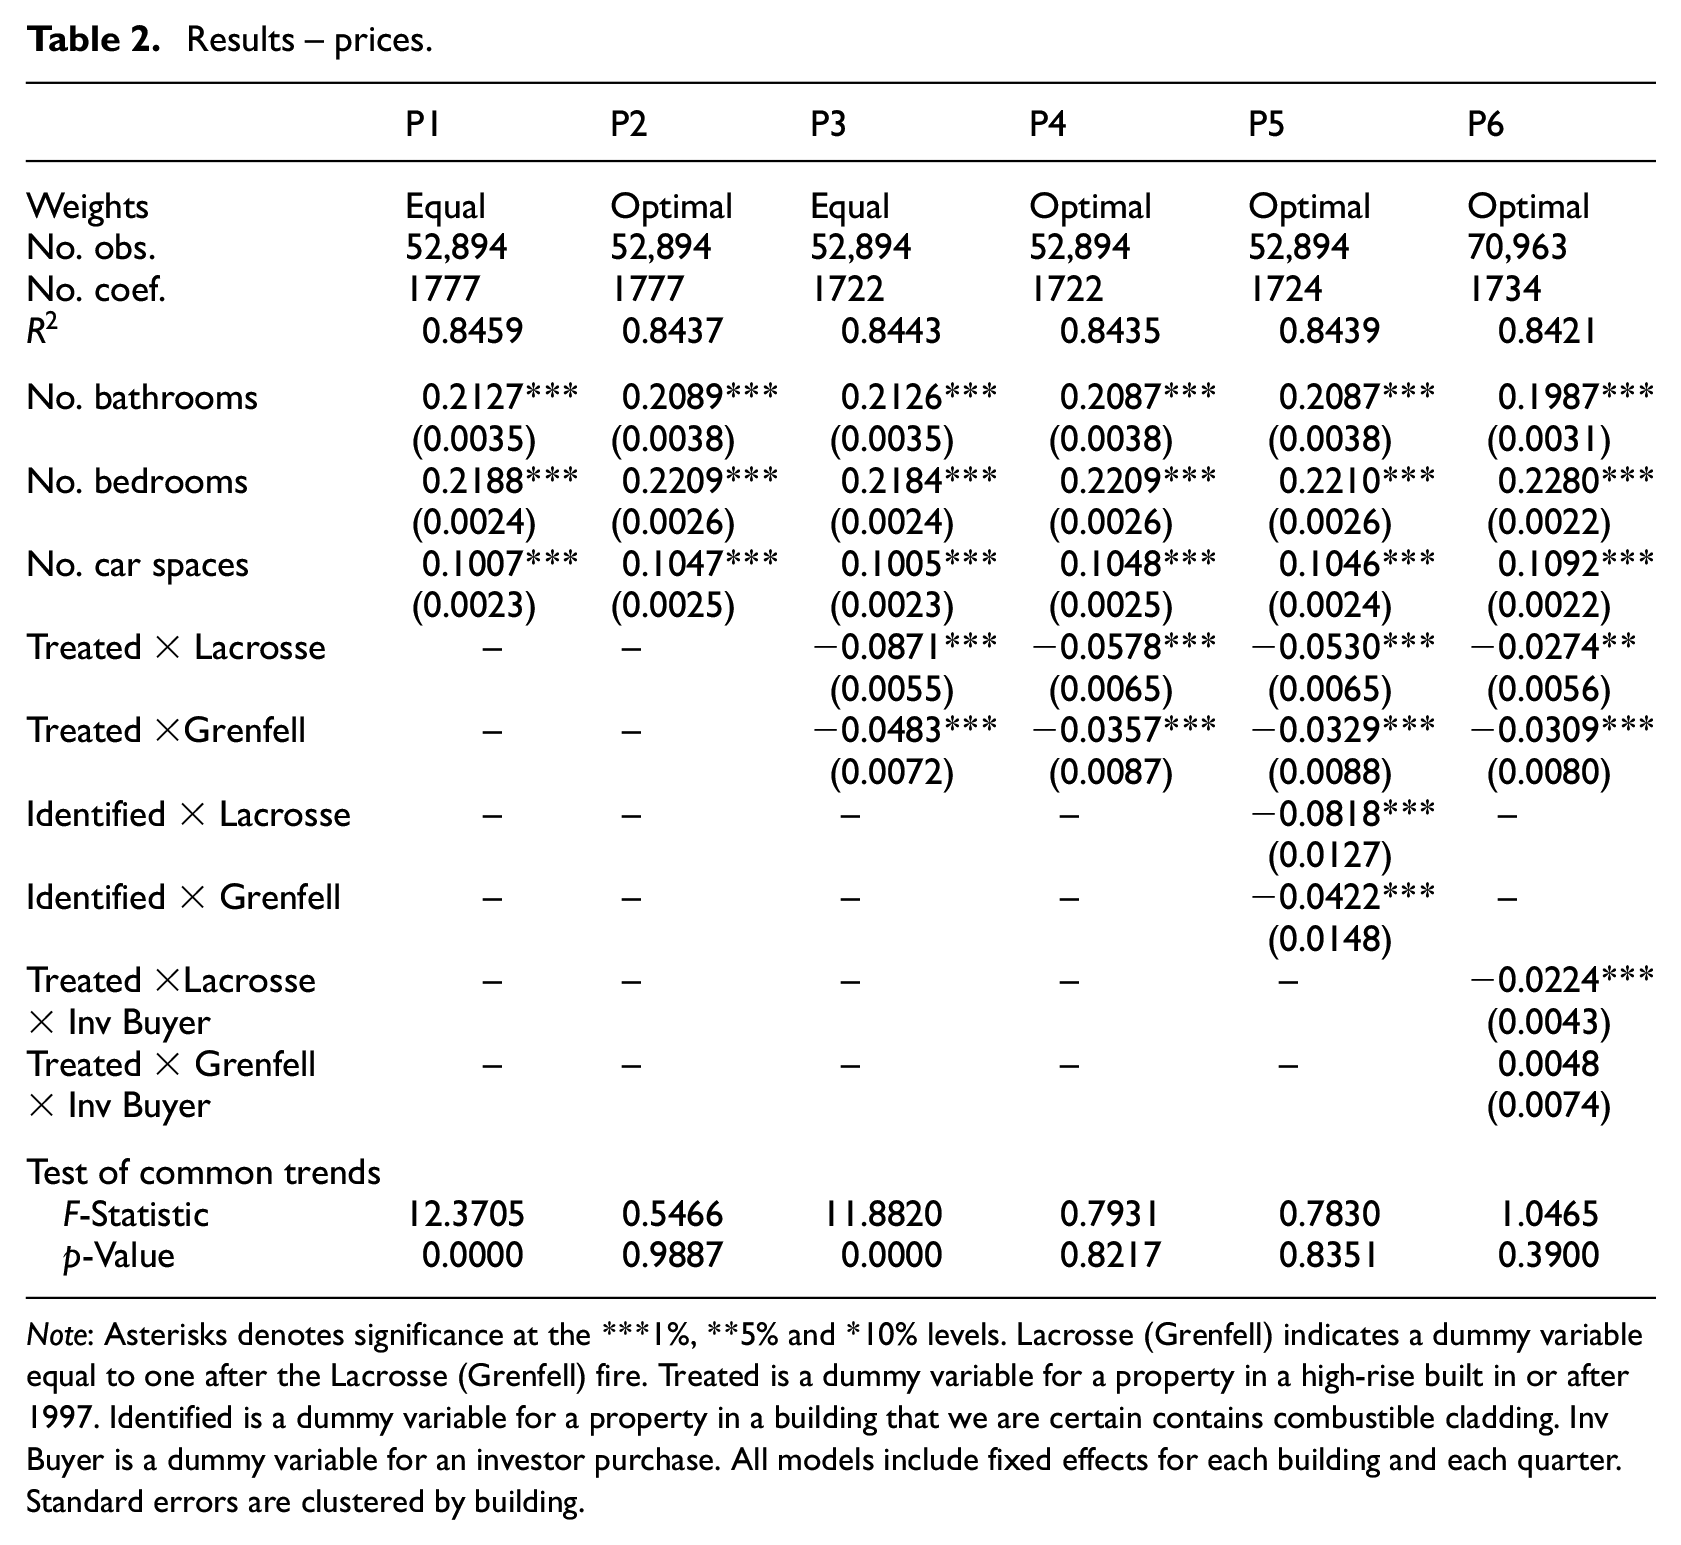
Note: Asterisks denotes significance at the ***1%, **5% and *10% levels. Lacrosse (Grenfell) indicates a dummy variable equal to one after the Lacrosse (Grenfell) fire. Treated is a dummy variable for a property in a high-rise built in or after 1997. Identified is a dummy variable for a property in a building that we are certain contains combustible cladding. Inv Buyer is a dummy variable for an investor purchase. All models include fixed effects for each building and each quarter. Standard errors are clustered by building.
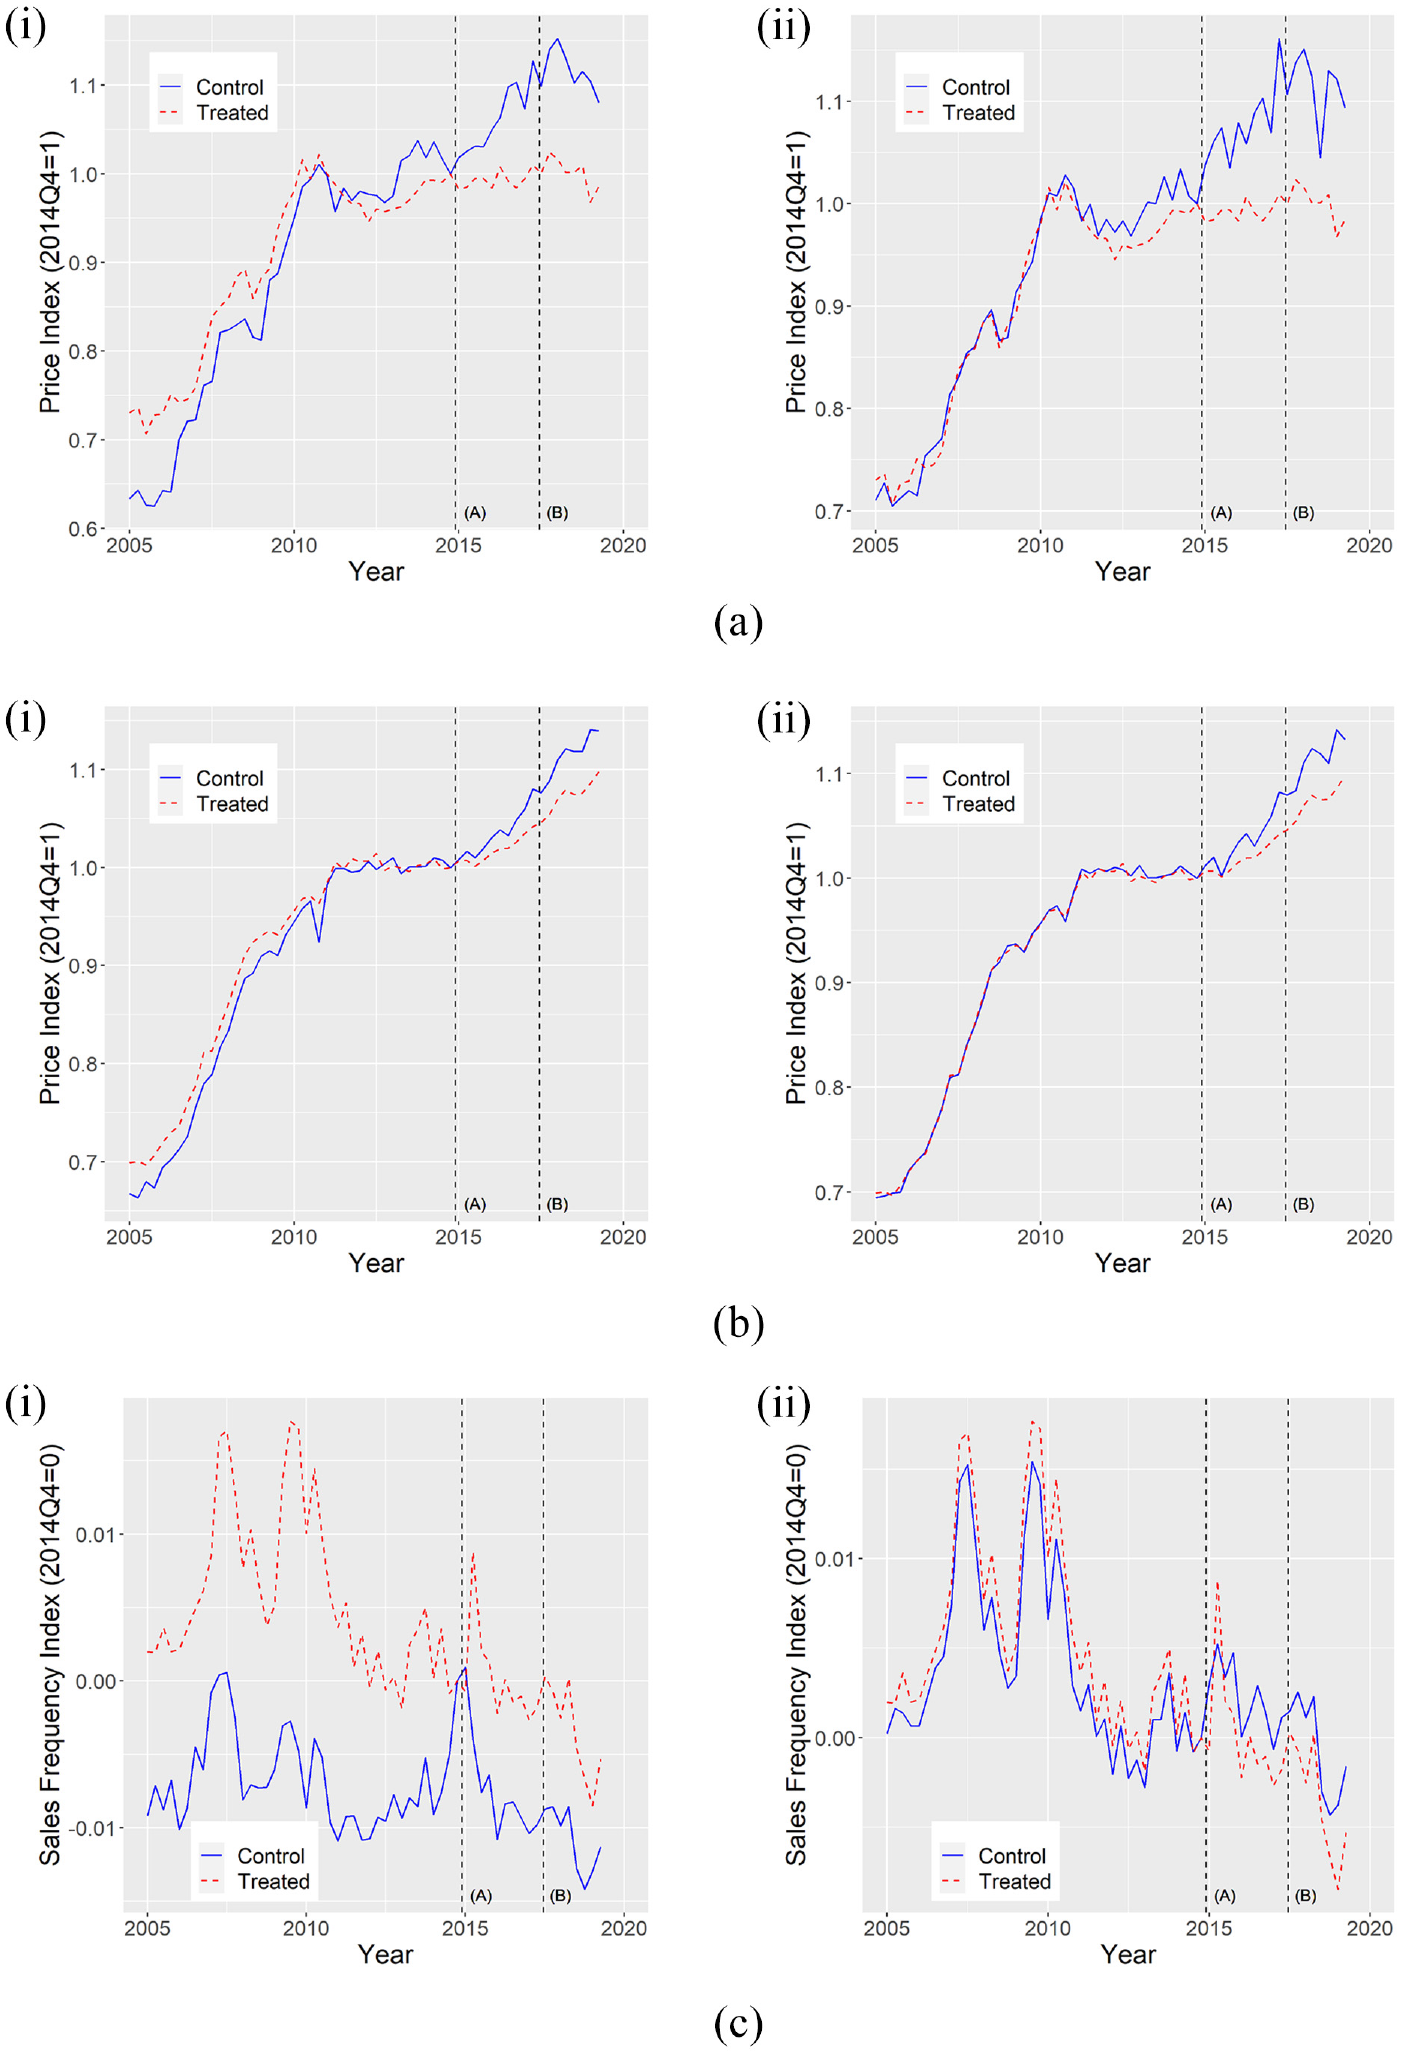
The effect of the fires. (a) Prices (owner-occupier purchases). (i) Equal weights. (ii) Optimal weights. (b) Rents. (i) Equal weights. (ii) Optimal weights. (c) Transactions. (i) Equal weights. (ii) Optimal weights.
Models P3 and P4 estimate equation (1) and provide estimates of the average effect of the two fires. These models use equal and optimal weights respectively. In the case of equal weights, we reject the null hypothesis of common trends prior to the Lacrosse Tower fire. Hence, we prefer the results using our optimal weighting approach. Here we cannot reject the null hypothesis of common trends. The results indicate a very significant effect of the fires on housing prices. In model P4, prices drop by around
In model P5, we include additional terms for Identified properties. These are treated properties built in or after 1997 and which we are certain contain combustible cladding. The coefficients record an additional decline in prices of around
The effect we find of combustible cladding on housing prices is large in the housing capitalisation literature. It is comparable to the effect, of 10–20% found by Mueller et al. (2009) for exposure to wildfires in Southern California. Our effects are much larger than those in many of the other housing events studied in the literature. For example, Rambaldi et al. (2013) found a
Finally, model P6 uses data on home purchases by both owner-occupiers and investors. In this model, we estimate how investor-buyers’ behaviour changed after the Lacrosse Tower and Grenfell Tower fires. The estimated coefficients reveal that investors’ willingness to pay for a home affected by combustible cladding declined further than that of owner-occupiers. In model P6, investor-purchased properties had price declines of a further
Rents
In Table 3, we illustrate the effect of the two fires on rents. The models are analogous to those estimated for prices. Models R1 and R2 use equal and optimal weights respectively. These models impose no a priori structure on the evolution of rents for the treated and control groups before and after the fires. The resulting indexes are plotted in Figure 2. They show a relatively modest deviation in rents which is most evident after the Grenfell Tower fire in mid-2017. As was the case for prices, it is clear that the optimal weighting of control observations significantly improves the plausibility of the assumption of common trends. Table 3 reports that the F-test rejects the hypothesis of common trends with equal weights but not for the optimally weighted case.
Results – rents.
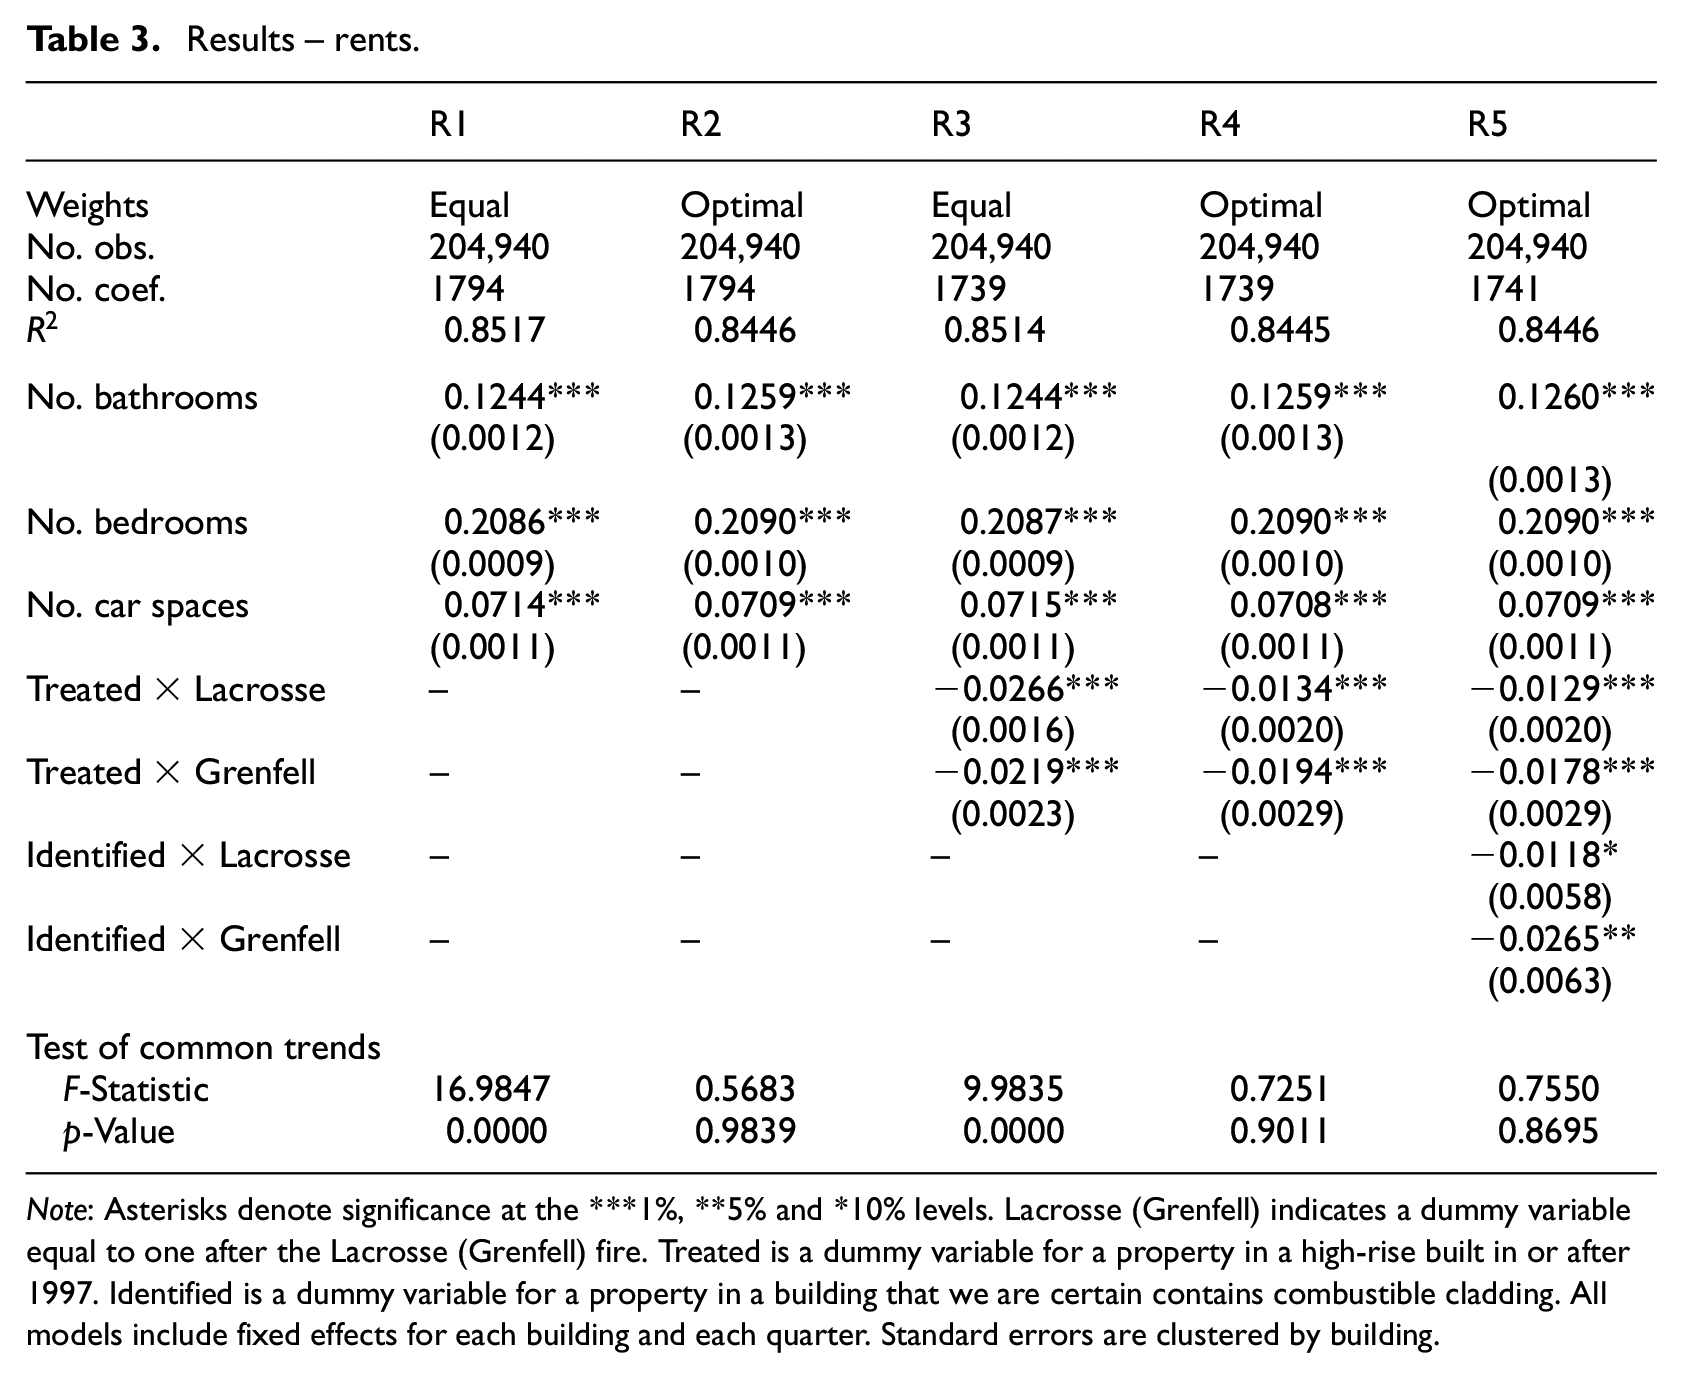
Note: Asterisks denote significance at the ***1%, **5% and *10% levels. Lacrosse (Grenfell) indicates a dummy variable equal to one after the Lacrosse (Grenfell) fire. Treated is a dummy variable for a property in a high-rise built in or after 1997. Identified is a dummy variable for a property in a building that we are certain contains combustible cladding. All models include fixed effects for each building and each quarter. Standard errors are clustered by building.
In models R3 and R4, we estimate the average effect of each of the fires on rental prices. The optimal weighting approach is preferred because in this case we cannot reject the null hypothesis of common trends prior to the Lacrosse Tower fire. The coefficient estimates for rents in model R4 show a decline of around
Model R5 estimates an additional effect for Identified properties and uses optimal weights. For those properties, which we know have combustible cladding, rents declined by around an additional
As we previously outlined, renters are exposed primarily to the safety risk posed by occupying a building with combustible cladding. On the other hand, owner-occupiers are exposed to both the financial and safety risks. Using our main treated group – high-rise properties built from 1997 onwards – we found a
Another key feature of our results is how the changes in prices and rents differed across the two fires. In an interesting contrast with the results for prices, we find that relatively more of the decline in rents occurred after the Grenfell Tower fire. For prices, the main adjustment took place after the Lacrosse Tower fire. As we previously noted, the Grenfell Tower fire was much more widely publicised than the Lacrosse Tower fire. Our results indicate a difference in attentiveness and understanding of renters and buyers – with renters being relatively more responsive to the more salient Grenfell Tower fire.
Transactions
In Table 4 we provide results from a linear probability model as to whether a property was sold in a given period. We create a panel dataset for each home starting from the period it was constructed. A dummy variable is created which is equal to one in any quarter that a home sold and zero otherwise.
Results – transactions.
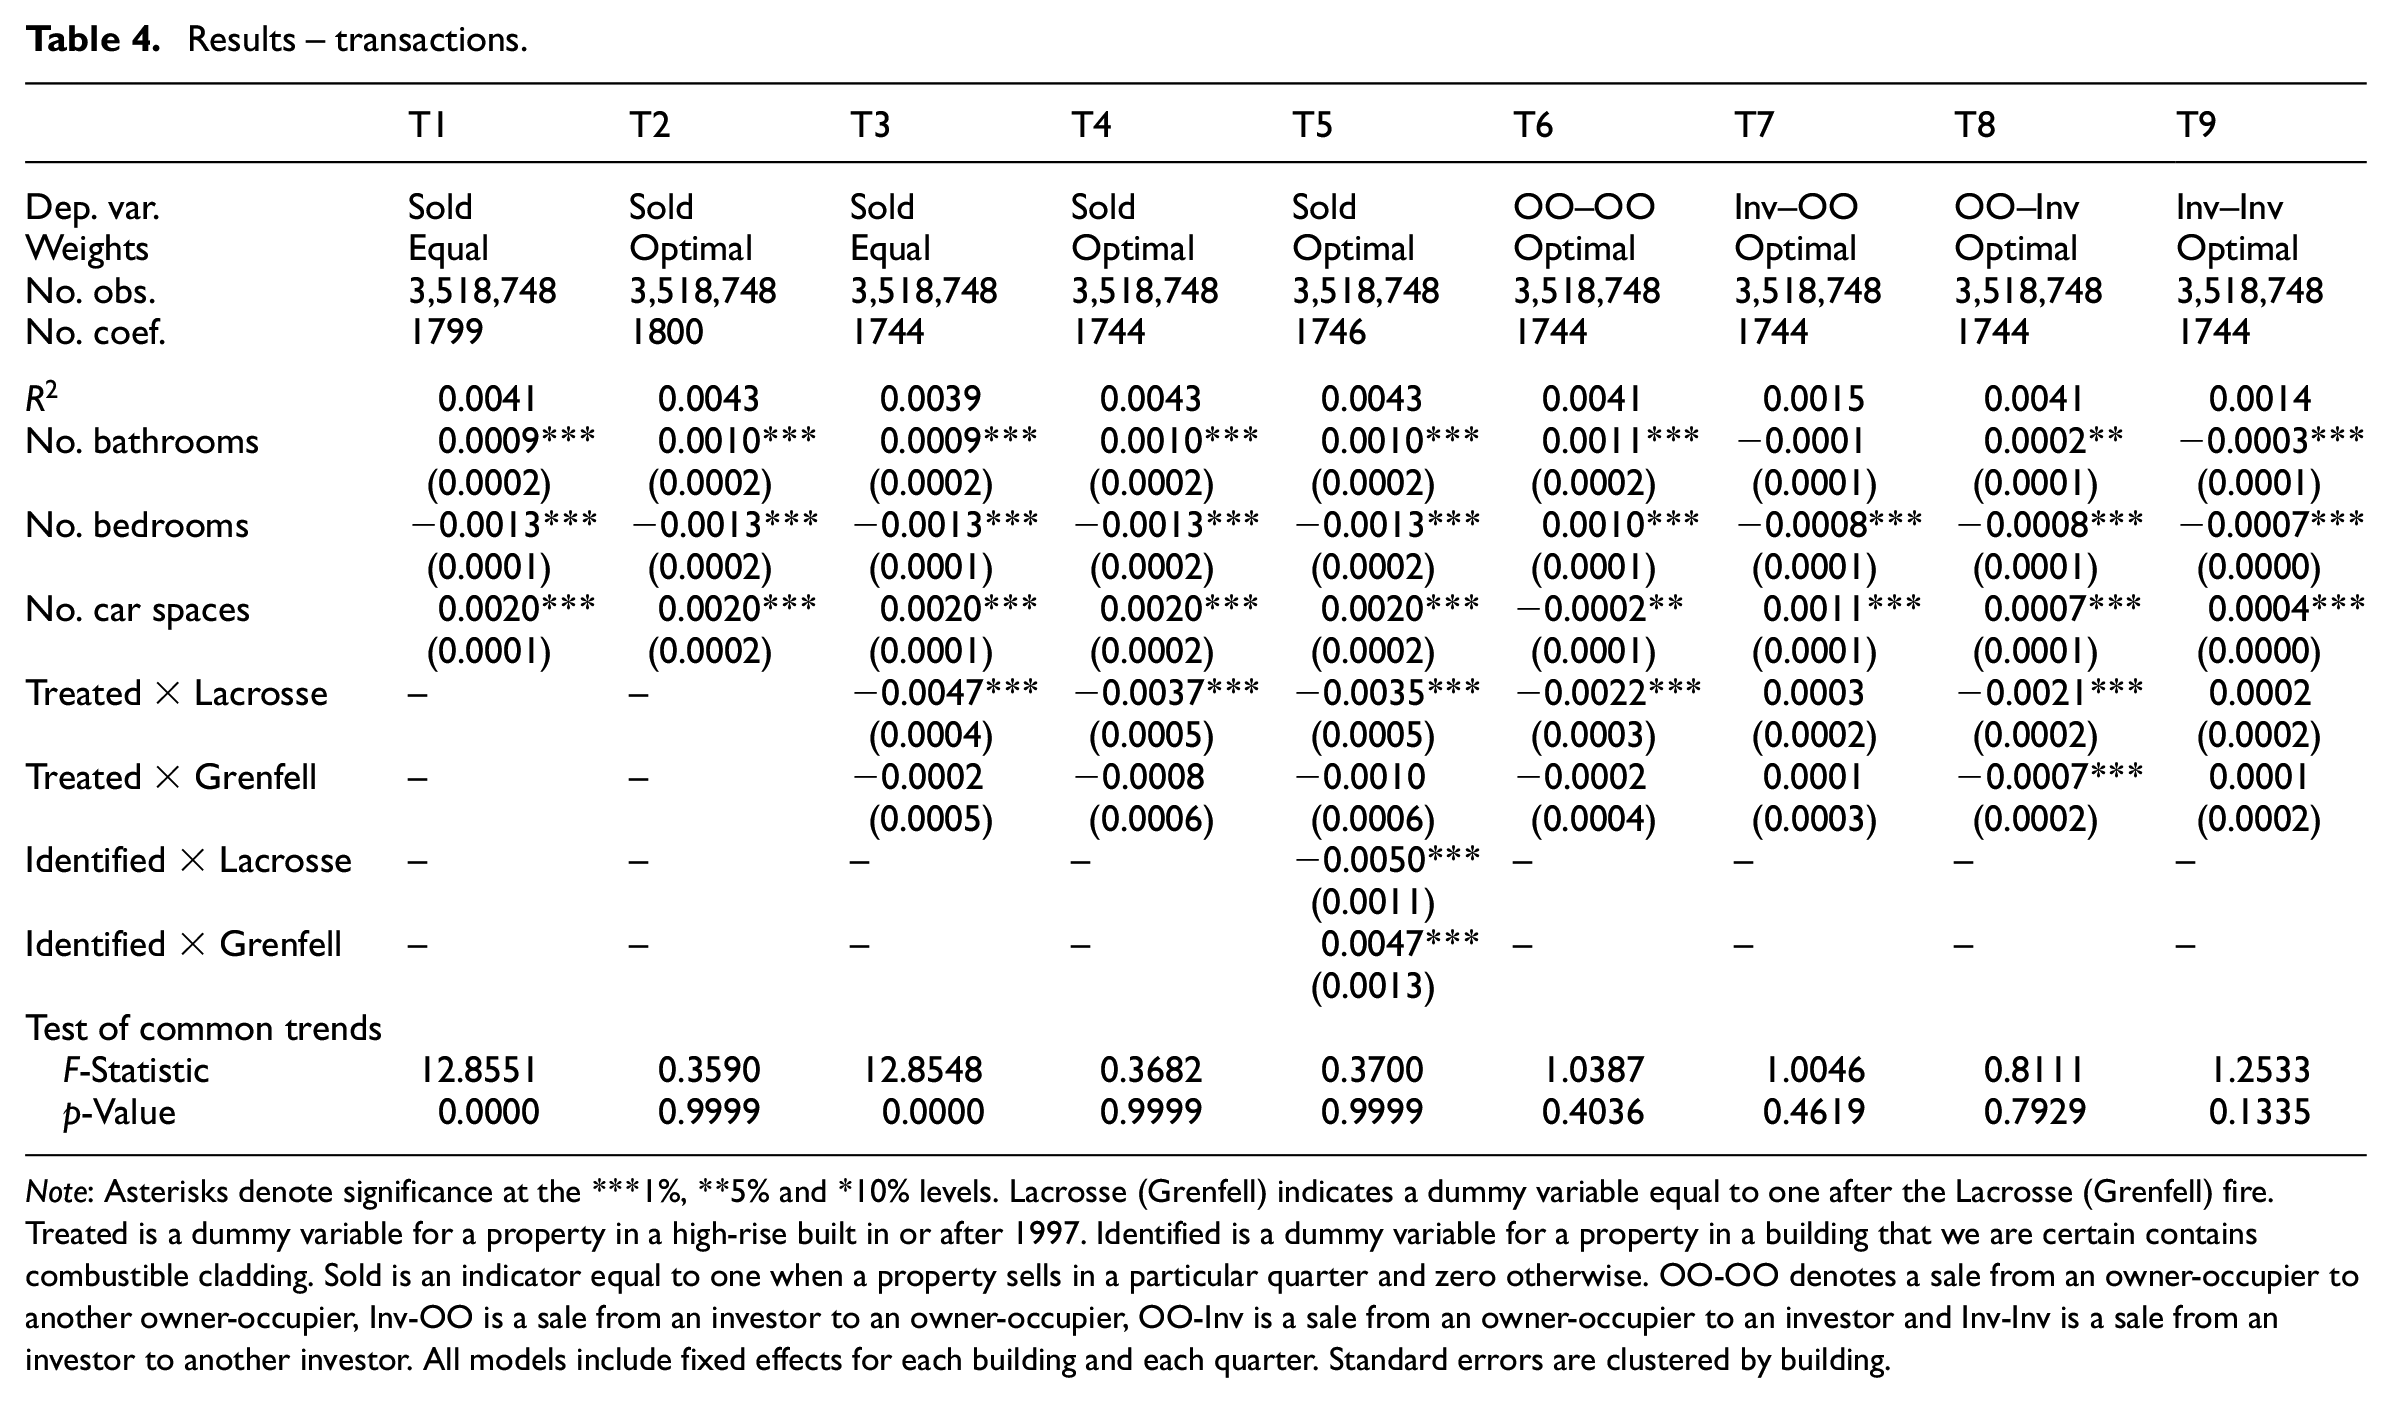
Note: Asterisks denote significance at the ***1%, **5% and *10% levels. Lacrosse (Grenfell) indicates a dummy variable equal to one after the Lacrosse (Grenfell) fire. Treated is a dummy variable for a property in a high-rise built in or after 1997. Identified is a dummy variable for a property in a building that we are certain contains combustible cladding. Sold is an indicator equal to one when a property sells in a particular quarter and zero otherwise. OO-OO denotes a sale from an owner-occupier to another owner-occupier, Inv-OO is a sale from an investor to an owner-occupier, OO-Inv is a sale from an owner-occupier to an investor and Inv-Inv is a sale from an investor to another investor. All models include fixed effects for each building and each quarter. Standard errors are clustered by building.
Models T1 and T2 allow for general trends in sales both before and after the fires as in equation (2). The indexes reflecting the quarterly dummy variables for sales frequency are shown in Figure 2. A clear finding from these figures is that there is significantly more similarity in the temporal sales frequency trends between the treated and control groups after using the optimal weights. Nevertheless, the index of transaction probability is quite volatile, which makes it challenging to visually identify whether there are changes in transaction frequency for treated properties after the fires.
In models T3 and T4, we use equal and optimal weights respectively to estimate the average effects of the fires on transactions. We find a statistically significant decline in transactions after the Lacrosse Tower fire, but no additional decline after the Grenfell Tower fire. Thus, we find a persistent decline in transaction volume for affected properties from the Grenfell Tower fire to the end of our data in mid-2019. Our findings are broadly consistent with the literature, which has found that negative shocks lead to illiquidity in the housing market. For example, Keys and Mulder (2020) found big falls in transactions for properties exposed to sea-level rise.
In model T5, we include effects for properties definitively identified as having combustible cladding. Our results indicate a further large decline in transactions after the Lacrosse Tower fire, but this is negated by a rise after the Grenfell Tower fire. Over the whole period, we find no consistently lower level of transactions for these properties compared with other treated properties.
In Models T6 to T9, we estimate the effect on transactions for the four possible sale types: owner-occupier to owner-occupier (OO-OO), investor to owner-occupier (Inv-OO), owner-occupier to investor (OO-Inv) and investor to investor (Inv-Inv). For example, in T6 the dependent variable is equal to one when the sale is from an owner-occupier to another owner-occupier and zero otherwise. The models are estimated using optimal weights. These models provide additional detail on whether particular groups within the housing market reacted differently to the fires. We find statistically significant declines in sales for OO-OO and OO-Inv after the Lacrosse Tower fire and also for OO-Inv after the Grenfell Tower fire. The results imply a broad-based reduction in transactions by both owner-occupiers and investors.
Conclusion
In this study, we have documented the housing market effects of the combustible cladding crisis in Melbourne, Australia. We examined how the fires in Melbourne’s Lacrosse Tower and London’s Grenfell Tower impacted housing prices, rents and transaction frequency. We constructed a control group of properties built prior to 1997 which are highly unlikely to contain combustible cladding. This was compared with properties built after this period, which have a much higher chance of containing combustible cladding, and a subset of these properties which we are certain contain combustible cladding. DID methods were used to look at the change in the variables of interest before and after the fires took place. We extended the standard DID approach by optimally re-weighting observations in the control group so they exhibited similar time trends to those in the treated group. This improves the plausibility and robustness of our results.
We found that owner-occupiers required a price discount of around
Supplemental Material
sj-pdf-1-usj-10.1177_00420980221110785 – Supplemental material for The housing market reaction to the combustible cladding crisis: Safety or financial concerns?
Supplemental material, sj-pdf-1-usj-10.1177_00420980221110785 for The housing market reaction to the combustible cladding crisis: Safety or financial concerns? by Daniel Melser in Urban Studies
Footnotes
Acknowledgements
I thank Australian Property Monitors (APM), Aurin and Melbourne City Council for making the data available that were used in this study. These organisations bear no responsibility for the views expressed in this study.
Declaration of conflicting interests
The author declared no potential conflicts of interest with respect to the research, authorship, and/or publication of this article.
Funding
The author received no financial support for the research, authorship, and/or publication of this article.
Supplemental material
Supplemental material for this article is available online.
Notes
References
Supplementary Material
Please find the following supplemental material available below.
For Open Access articles published under a Creative Commons License, all supplemental material carries the same license as the article it is associated with.
For non-Open Access articles published, all supplemental material carries a non-exclusive license, and permission requests for re-use of supplemental material or any part of supplemental material shall be sent directly to the copyright owner as specified in the copyright notice associated with the article.