



Abstract
The main aim of this article is to elevate the accuracy in reflecting the efficiency of tourism destinations. A mean–variance shortage function approach is applied to help destination management organizations (DMOs) minimize the instability and maximize the return of their inbound tourism. This approach seeks to identify tourists’ origins on which destination managers must allocate additional resources in order to ensure growth and stability of their destination. Empirical analysis is implemented in the case of France, which faces increasing competition. The results indicate that there is room for improvement for the French DMO to achieve the best performing strategy. But the main contribution of this article is methodological: the framework of this article offers tourism policy makers explicit and innovative guidelines for risk and performance management.
Introduction
For many years, the tourism sector complained that governments ignored them and that people in general were systematically overlooking its economic and social significance. In recent years, these complaints have declined as governments have increasingly recognized the economic importance of tourism. Now, the development of tourism activities, with regards to their externalities, is a crucial issue for many countries and regions in the world. As regards meta-management functions, this context has favored the development of specific organizations engaged in the marketing and/or the management of destinations (Ritchie and Crouch 2003; Pikes 2004; Minguzzi 2006; Bornhorst, Ritchie, and Sheehan 2010). Through the years, a wide range of studies about destination management organizations (DMOs) have been conducted and these make up the so-called destination management stream. For Sainaghi (2006), studies in this field have tended to use an approach that focuses primarily on content and as a result, the problem of method often remains implicit. But operators and local tourism offices often have a clear idea of the challenges faced by their destination and of possible solutions that can be implemented, the relevant question then being not what to do but how to do it. This problem brings up the traditional distinction between two important streams in strategic management: the static stream, centered on contents (strategic contents), and the dynamic stream, centered on processes (strategic processes). Accordingly, the stake of this article is for DMOs, which have to play a central role in the development of their jurisdiction and to make it more competitive. It makes a fresh contribution to the literature on tourism by using a new methodological approach (the transposition of Markowitz’s and Luenberger’s approaches) and offers new insights into the tourism management literature.
Although quantitative objectives can be clearly defined in business management (cash flow, sales, etc.), it is not the same for DMOs as they are not-for-profit organizations. However, although a DMO cannot move with the objectives of profitability, the fact remains that it has duties toward its territorial dominion. For Bornhorst, Ritchie, and Sheehan (2010), the roles of DMOs are three in number: work toward enhancing the well-being of destination residents; do everything necessary to ensure that visitors are offered satisfactory visitation experiences; and ensure the provision of effective destination management and stewardship. In summary, their role is to extend the tourism competitiveness of their dominion because it may measure economic dependence of a defined area on the tourism sector. As such, a destination with a good competitiveness is a territory that is competitive with respect to its assets endowments and in the deployment of those resources (Gomezelja and Mihalic 2008). Then, the question that arises is how to improve the tourism competitiveness of a destination? This is the key issue addressed here.
The tourism sector shows considerable instability in demand. If there is no doubt about the fact that increasing tourist arrivals contribute to the growth of income and employment, decreased arrivals can adversely affect the local economy. Then, and according to Jang and Chen (2008), efforts should be made to moderate the level of fluctuations in tourism demand. In other words, volatility management of arrivals needs to be incorporated into destination management. However, arrivals produce overnight stays (or bed-nights) and although these two concepts seem similar, it is interesting to separate them because the number of overnight stays better characterizes economic returns of tourism. Moreover, it is possible to have a large number of arrivals for a few bed-nights—a situation that is for Barros, Botti et al. (forthcoming) symptomatic for an inefficient destination.
As previously explained by Sinclair (1999), the instability of demand for international tourism may be the result of economic, political, and social changes, and tourists from different countries are sensitive in different ways to changes in these variables. But the promotional activities of DMOs—when they represent relevant uses of available promotional resources—may also minimize the volatility of tourism demand. In their literature summary, Bornhorst, Ritchie, and Sheehan (2010) show that issues dealing with marketing and promotional activities tend to quantitatively dominate issues related to other managerial functions such as membership and stakeholders, policy and strategy/holistic perspective, information and research, or financial management, probably because it is the closest function to the main DMO activity, that is, tourism demand management.
Even though return and risk in tourism cannot be defined in exactly the same way as in the field of finance, the basic principles of the financial portfolio theory can be applied to rationalize DMOs’ decision making. Despite this fact, only a few studies have used return and risk concepts in tourism (Board, Sinclair, and Sutcliffe 1987; Board and Sutcliffe 1991; Sinclair 1999; Jang 2004; and Jang, Morrison, and O’Leary 2002, 2004). And no one has suggested a model dealing with both mean–variance model and the shortage function to examine the performance of DMOs although it is a relevant combination as it enables to analyze DMOs’ choices according to their two main goals, growth and stability of their destination demand. Along this line, this article attempts to offer a practical tool to help organizations charged with destinations development. It segments tourists by origins, as often done in the tourism industry, and proposes to DMOs a frontier that can be used as a benchmark for an efficient promotional resources allocation. Accordingly, our article provides a practical framework to achieve the main destination policy makers’ objective, that is, determining the most appropriate allocation of public funds.
The remainder of the article is structured as follows. The next section briefly describes the methods. The main elements of financial portfolio theory and the shortage function are addressed in this section. The following section shows empirical settings (the foreign tourism demand in France) and results. Then we discuss the results’ significance and usefulness for the French national DMO and also, more generally, for other organizations in charge of the tourism competitiveness of a defined area. The final section concludes, offering some limitations of our research and future research directions.
Theoretical Framework
Even if the potential tourism demand is still very high, emergence of new destinations make the competition harder between areas keen to attract tourists. But if tourism is subject to many uncertainties, we can consider that efficient marketing and promotional programs may be viewed as relevant tools for achieving success for a destination. Thus, nothing is a foregone conclusion in tourism, and efficient deployment of resources may be considered as a significant determinant of destination success.
Recently, researchers have increased their interest in the tourism destination competitiveness concept, and destination managers are now aware that besides comparative advantage and price, many other variables determine the competitiveness of their dominion. According to Crouch and Ritchie (1999), destination success is determined by two different advantages: on one hand, comparative advantages reflect destination resources endowment, and on the other hand, competitive advantages are those that have been established as a result of effective resources deployment. In this line, tourism destination competitiveness partly depends on the DMO’s ability to add value to available resources (Crouch 2006). Destination management in consequence can be considered to be strategic, and tourism decision makers must take steps to enhance the competitiveness of their destination. According to this line, this study tries to increase the accuracy in reflecting tourism destinations’ performance and to consider, as previously done by Jang and Chen (2008), that policy makers have two objectives: to maximize potential returns and to manage market fluctuations. As tourism demand depends on several parameters and considering the fact that each origin (e.g., Germany, Russia, Portugal, etc.) constitutes a source of revenue, each origin may be identified with different levels of risk and return.
Figure 1 presents the mean–variance space in which is embedded our theoretical framework. This space is based on the idea that all the information about a portfolio of risky stocks may be summed up in the values of two parameters: the standard deviation and the expected value of the portfolio return, briefly stated as the risk and return. The efficient frontier, which is the upper boundary of the mean–variance space, represents those portfolios for which the expected return is the highest for any level of risk, and for which the risk is the lowest for any level of expected return.
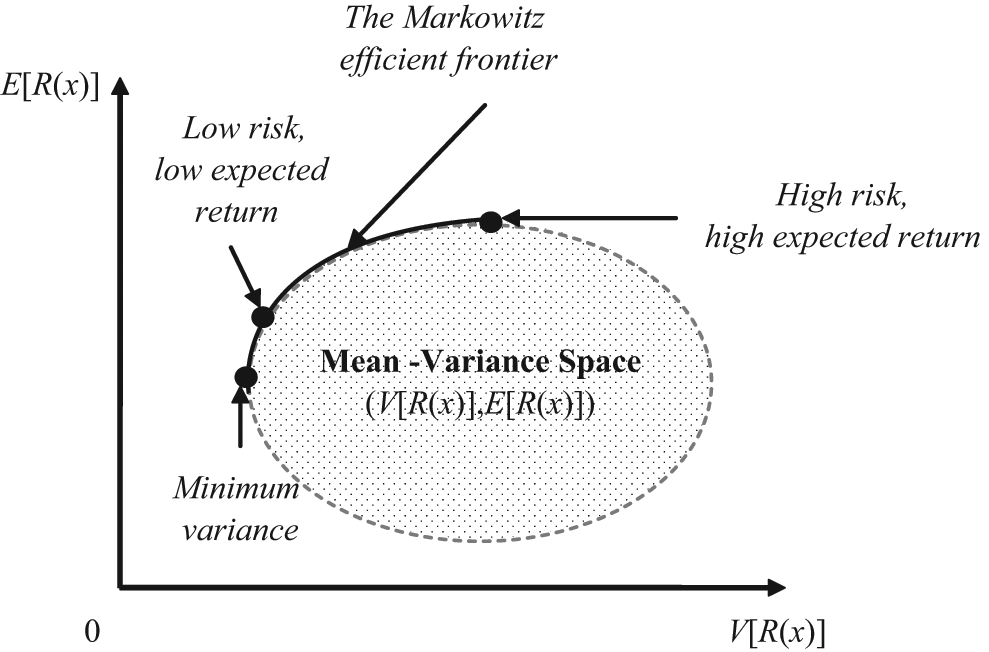
The Markowitz mean–variance space
The Markowitz Model
The mean–variance model was introduced by Markowitz (1952, 1959) for gauging portfolio efficiency. Among other problems (in particular computational costs), the major problem of this model lies in the choice of a direction reaching the efficient frontier. To overcome this difficulty, we use in our study the shortage function Chambers, Chung, and Färe (1998), which is a useful tool for efficiency measurement as it looks simultaneously and in a pre-assigned direction at return expansion and risk reduction. It determines then the shortcut that enables an observed asset to reach the efficient frontier. Several applications of the shortage function have been done in the data envelopment analysis (DEA) field. These applications are always relevant from the viewpoint of a manager because they indicate not only best practices but also efforts to provide efficiency (Barros 2005). Here, we are putting forward another link to some extent to the application of DEA. DMOs have indeed to find the optimal strategy, that is, the strategy that minimizes the risk and maximizes the return of their inbound tourism demand. Regarding this aim, DEA is an appropriate tool as we shall explain further in this article.
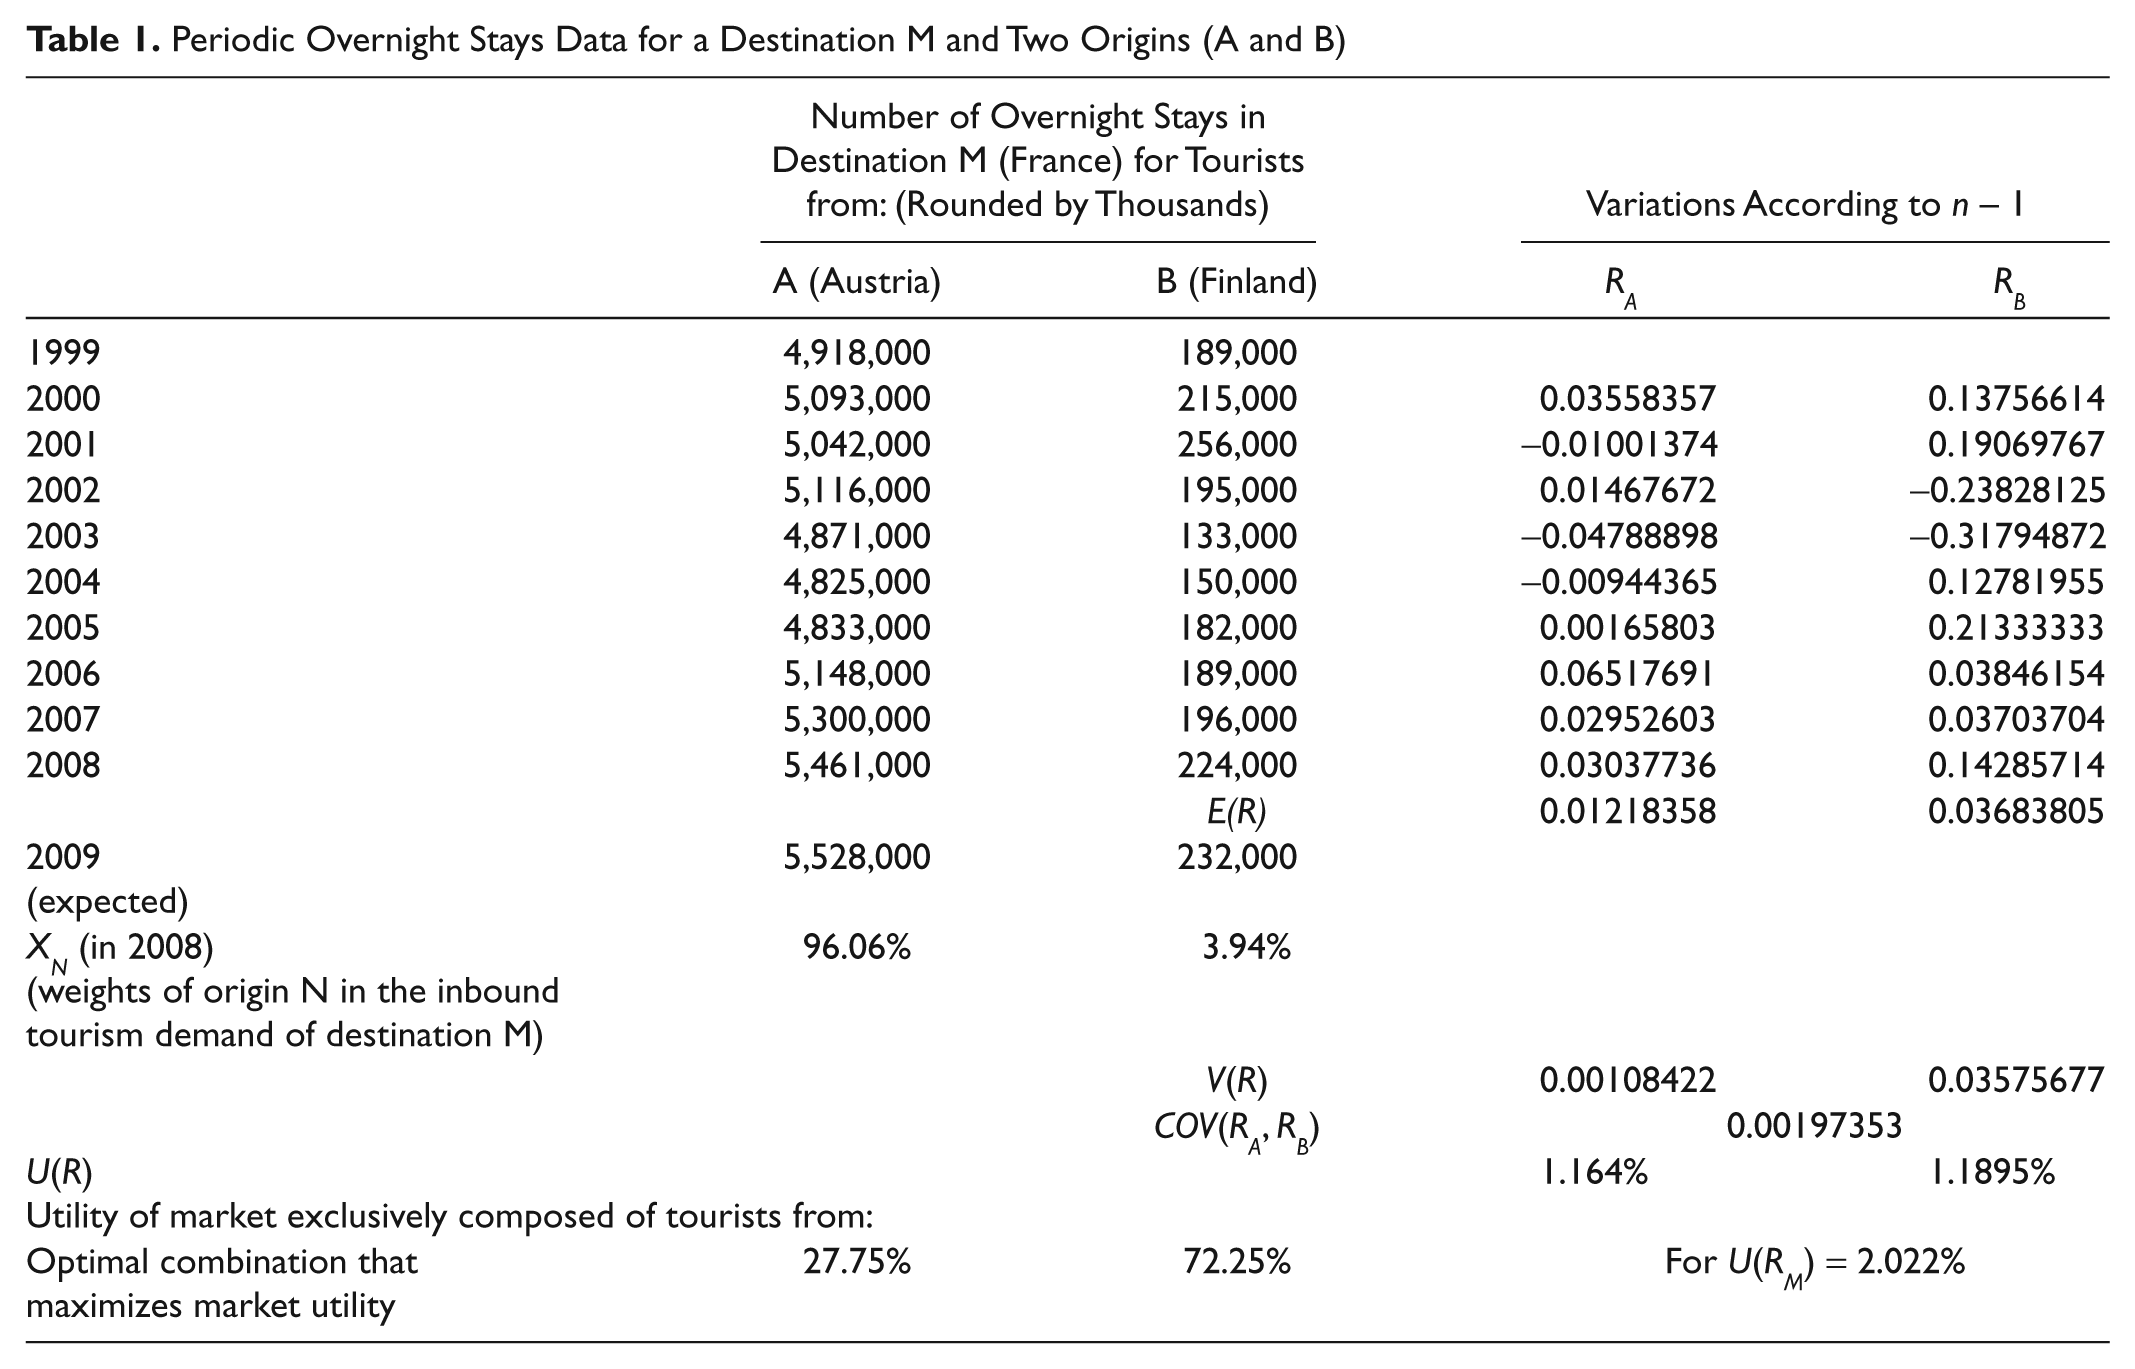
To practically understand our aim, and to distinctly explain our framework to calculate return, risk, and market utility (which is DMOs’ objective), it is useful to take a straightforward example. Take for instance a destination M (France) and its tourists coming from only two countries, namely, A and B (respectively, Austria and Finland in this example). Accordingly, periodic overnight stays data enable us in Table 1 to compute historical variations (RA and RB) and respective weights of origins A and B in the global inbound tourism demand of the destination M (XA and XB). Moreover, the same data allow us to expect for the next period respectively E(RA) and E(RB) for each origin and E(R M ) = X A E(R A ) + X B E(R B ) for the global inbound demand. Accordingly, subscript M corresponds to the global inbound demand of France and includes two origins A and B. The fluctuation of this virtual inbound demand (its risk) depends on the variance–covariance matrix of origins, which can be calculated as follows:

The market utility is used to measure destination manager’s satisfaction; higher the utility, better is the satisfaction. Following the mean–variance model, the market utility is formally given by equation (2) below:
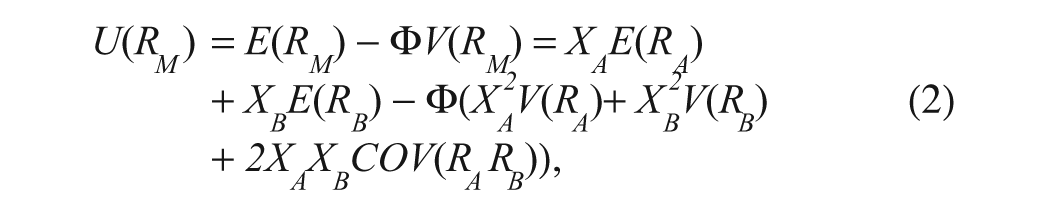
where Ф stands for the decision maker’s risk aversion. For our case study, based on other authors’ research, for example, Morey and Morey (1999) and Briec, Kerstens, and Lesourd (2004), we use Ф = 0.5. Results from the empirical example shown in Table 1 means that the destination M (France) may expect for the next period a positive variation of 2.022% of its global amount of overnight stays if and only if it manages to ensure that its inbound demand includes 27.75% of Austrian tourists and 72.25% of Finnish tourists. According to this framework, the DMO’s objective is to influence segments’ weights (XA and XB) by pursuing policies that enable obtaining the combination of origins that maximizes market utility.
Periodic Overnight Stays Data for a Destination M and Two Origins (A and B)
Optimal Portfolio Determination in Static Time
The main problem of the variance–covariance Markowitz model as shown in the previous subsection is that of testing it empirically, as computational costs of solving quadratic programs are high. Therefore, and according to Briec, Kerstens, and Lesourd (2004), Farrar (1962) was apparently the first researcher to experiment the Markowitz model. The contribution of this article therefore is the integration of an efficiency measure into the Markowitz model. From a practical viewpoint, this framework (developed for the first time by Briec, Kerstens, and Lesourd 2004) projects each origin onto the relevant part of the frontier according to a meaningful efficiency measure. On the other hand, capital asset pricing management (CAPM; introduced by Sharpe [1963] and used by Jang and Chen [2008]) traces the whole efficient portfolio frontier with a critical line search method.
Let us consider a market with n financial assets. Note E(Ri) for i = 1, . . . ,n; the expected return of the stock i; and Ω the covariance matrix of these assets such that Ω i,j = Cov(Ri, Rj) for i,j ∈. {1,…,n} Note that a portfolio is a combination of one or more of these assets. Their proportions may be represented by the vector x = (x1, x2, . . . ,xn) with Σxi = 1 for i = 1, . . . ,n and xi ≥0. In this line, the expected return of a portfolio x is defined by

where xi is the proportion of the asset i in the portfolio x, E(Ri) the expected return of the same asset i and n the number of assets constitutive of the market. Along the same line, the variance of the portfolio x return is defined by

Following the Markowitz’s mean–variance model, the representation set of portfolios is defined by

For a given degree of risk aversion, Markowitz defined the following utility function to compute the corresponding efficient portfolio:

where µ > 0 and ρ > 0 . Accordingly, if µ = 0, the utility of the portfolio will only correspond to a minimum variance portfolio and if ρ = 0, the the decision maker will ignore any risk fluctuation. Note that this utility function satisfies the positive marginal utility of expected return and negative marginal utility of risk. Following Uysal, Trainer, and Reiss (2001), risk aversion (the ratio
In the (Var[R(x)], E[R(x)]) space, portfolios are included in a hyperbole as shown in Figure 1. Efficient portfolios for which, on one hand, the expected return is higher for a given level of risk or, on the other hand, risk is lowest for a given level of expected return, are obtained by removing inefficient subsets dominated by the graph. The following program maximizes the mean–variance utility function:

where the ratio
The Shortage Function
To apply the Markowitz model, we proceed in a different way from Jang and Chen (2008). First, because those authors used the number of arrivals, we use overnight stays, which correspond to the total number of nights spent by one customer in a hotel. Accordingly, two people staying three nights in a hotel represents six overnight stays as well as six people staying only one night in the same hotel. Then, to measure the distance between each stock and the efficient frontier, we use the shortage function that is a generalization of the distance function traditionally used for production efficiency measurement. This concept was introduced by Luenberger (1992) and has been used in several sectors; Briec, Kerstens, and Lesourd (2004) and Briec, Kerstens, and Jokung (2007) suggest an application in the financial sector, as did Peypoch and Solonandrasana (2006) Peypoch (2007) and Barros, Botti et al. (forthcoming) for tourism. The shortage function can also be used by the Luenberger productivity indicator, which has been applied to indicate performance evolution of decision-making units (Blancard et al. 2006; Guironnet and Peypoch 2007; Barros et al. 2008; Barros and Peypoch 2008; Barros, Peypoch and Williams (2010)). Formally speaking, the disposal representation set is defined as

This subset may be rewritten as follows:

The above subset represents the weakly efficient frontier, that is, the set of all mean–variance points that are not strictly dominated:

According to the properties explained by Briec, Kerstens, and Lesourd (2004), we can use the shortage function to gauge markets’ efficiency from equation (11), which is the shortage function for the portfolio x in the direction of the vector g = (–gV, gE):

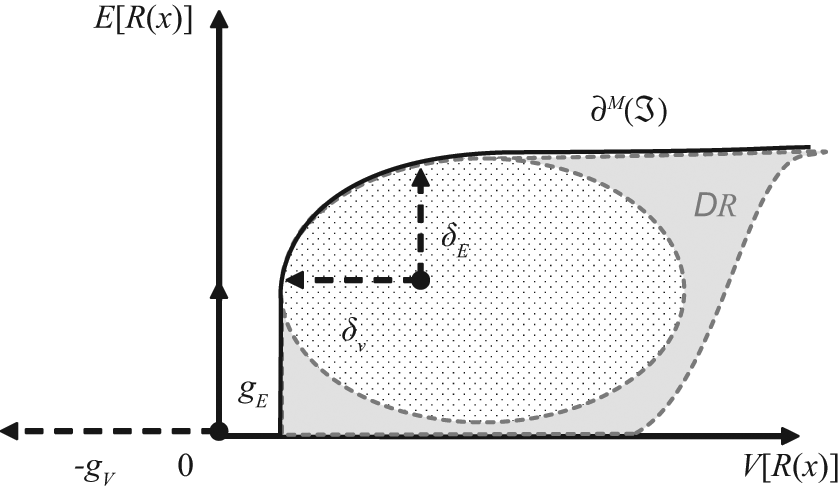
Note that if Sg(x) = 0, no improvement is needed as the portfolio of origins x is an efficient point. Otherwise, we have an inefficient point and the shortage function is assumed as an indicator of performance. As its name indicates, this function projects some points of the set on the efficient frontier in a preassigned direction Figure 2. It measures the shortcut in the direction of g, which looks simultaneously for improvements in variance reduction and mean expansion. Morey and Morey (1999) measure performance focusing on radial potentials for either risk contraction or return expansion Figure 3. Our article suggests a framework to identify how a destination may ensure both maximum stability and growth in terms of tourists’ overnight stays. Accordingly, the shortage function generalizes Morey and Morey distance function. In the risk reduction orientation, since gE = 0, g = gV, that is, for a given level of expected return, the function looks at the risk reduction possibilities. The shortage function then becomes

In the return expansion orientation, since gV = 0, g = gE; that is, for a given level of risk, the function computes the possible expansion of the expected number of overnight stays.

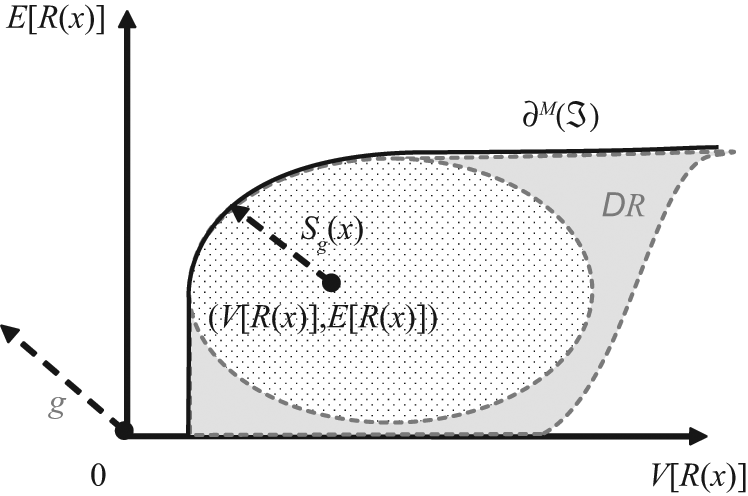
The shortage function
Morey and Morey distance functions
Data and Results
French Paradox and Data
Many authors have written about the key role played by tourism in the economy in general and in development in particular. In the past 30-year period, total international tourist flows have grown by a factor of six and, accordingly, tourism has become, on one hand, one of the main economic sectors and, on the other hand, one of the sectors that have recorded the most important growth. In France, the tourism sector represents a major economic issue (more than 6% of the French GDP), and France is the leading country in terms of arrivals. This can be explained by the remarkable variety and extreme beauty of its heritage: from prehistoric caves to the finest art collections of its museums (Louvre, Orsay), from architectural masterpieces of its past abbeys, cathedrals, and castles to nowadays impressive monuments (Arche de la Défense, Viaduc de Millau), from amusement parks (Disneyland) to vineyards and wonderful beaches. According to the French Tourism Authorities, France’s most visited areas are Provence-Alpes-Côte d’Azur (more than 100 million overnight stays each year), Rhône-Alpes (more than 90 million), and Languedoc-Roussillon (more than 75 million). Its most visited monuments are Musée du Louvre (more than 6 million visitors), Tour Eiffel, Château de Versailles, and Mont Saint-Michel—reflecting the fact that all those who enjoy history, culture, and the art of living have their needs met. Despite this hegemonic situation, the debate focuses in France on the tourism sector because it does not play the role of an economic booster any more. This is what is commonly called the “French tourism paradox”: France is the first tourism destination in the world in terms of arrivals, but it generates less income through this industry than other countries. As a matter of fact, based on the international balance of payment account, France holds the third place behind United States of America and Spain.
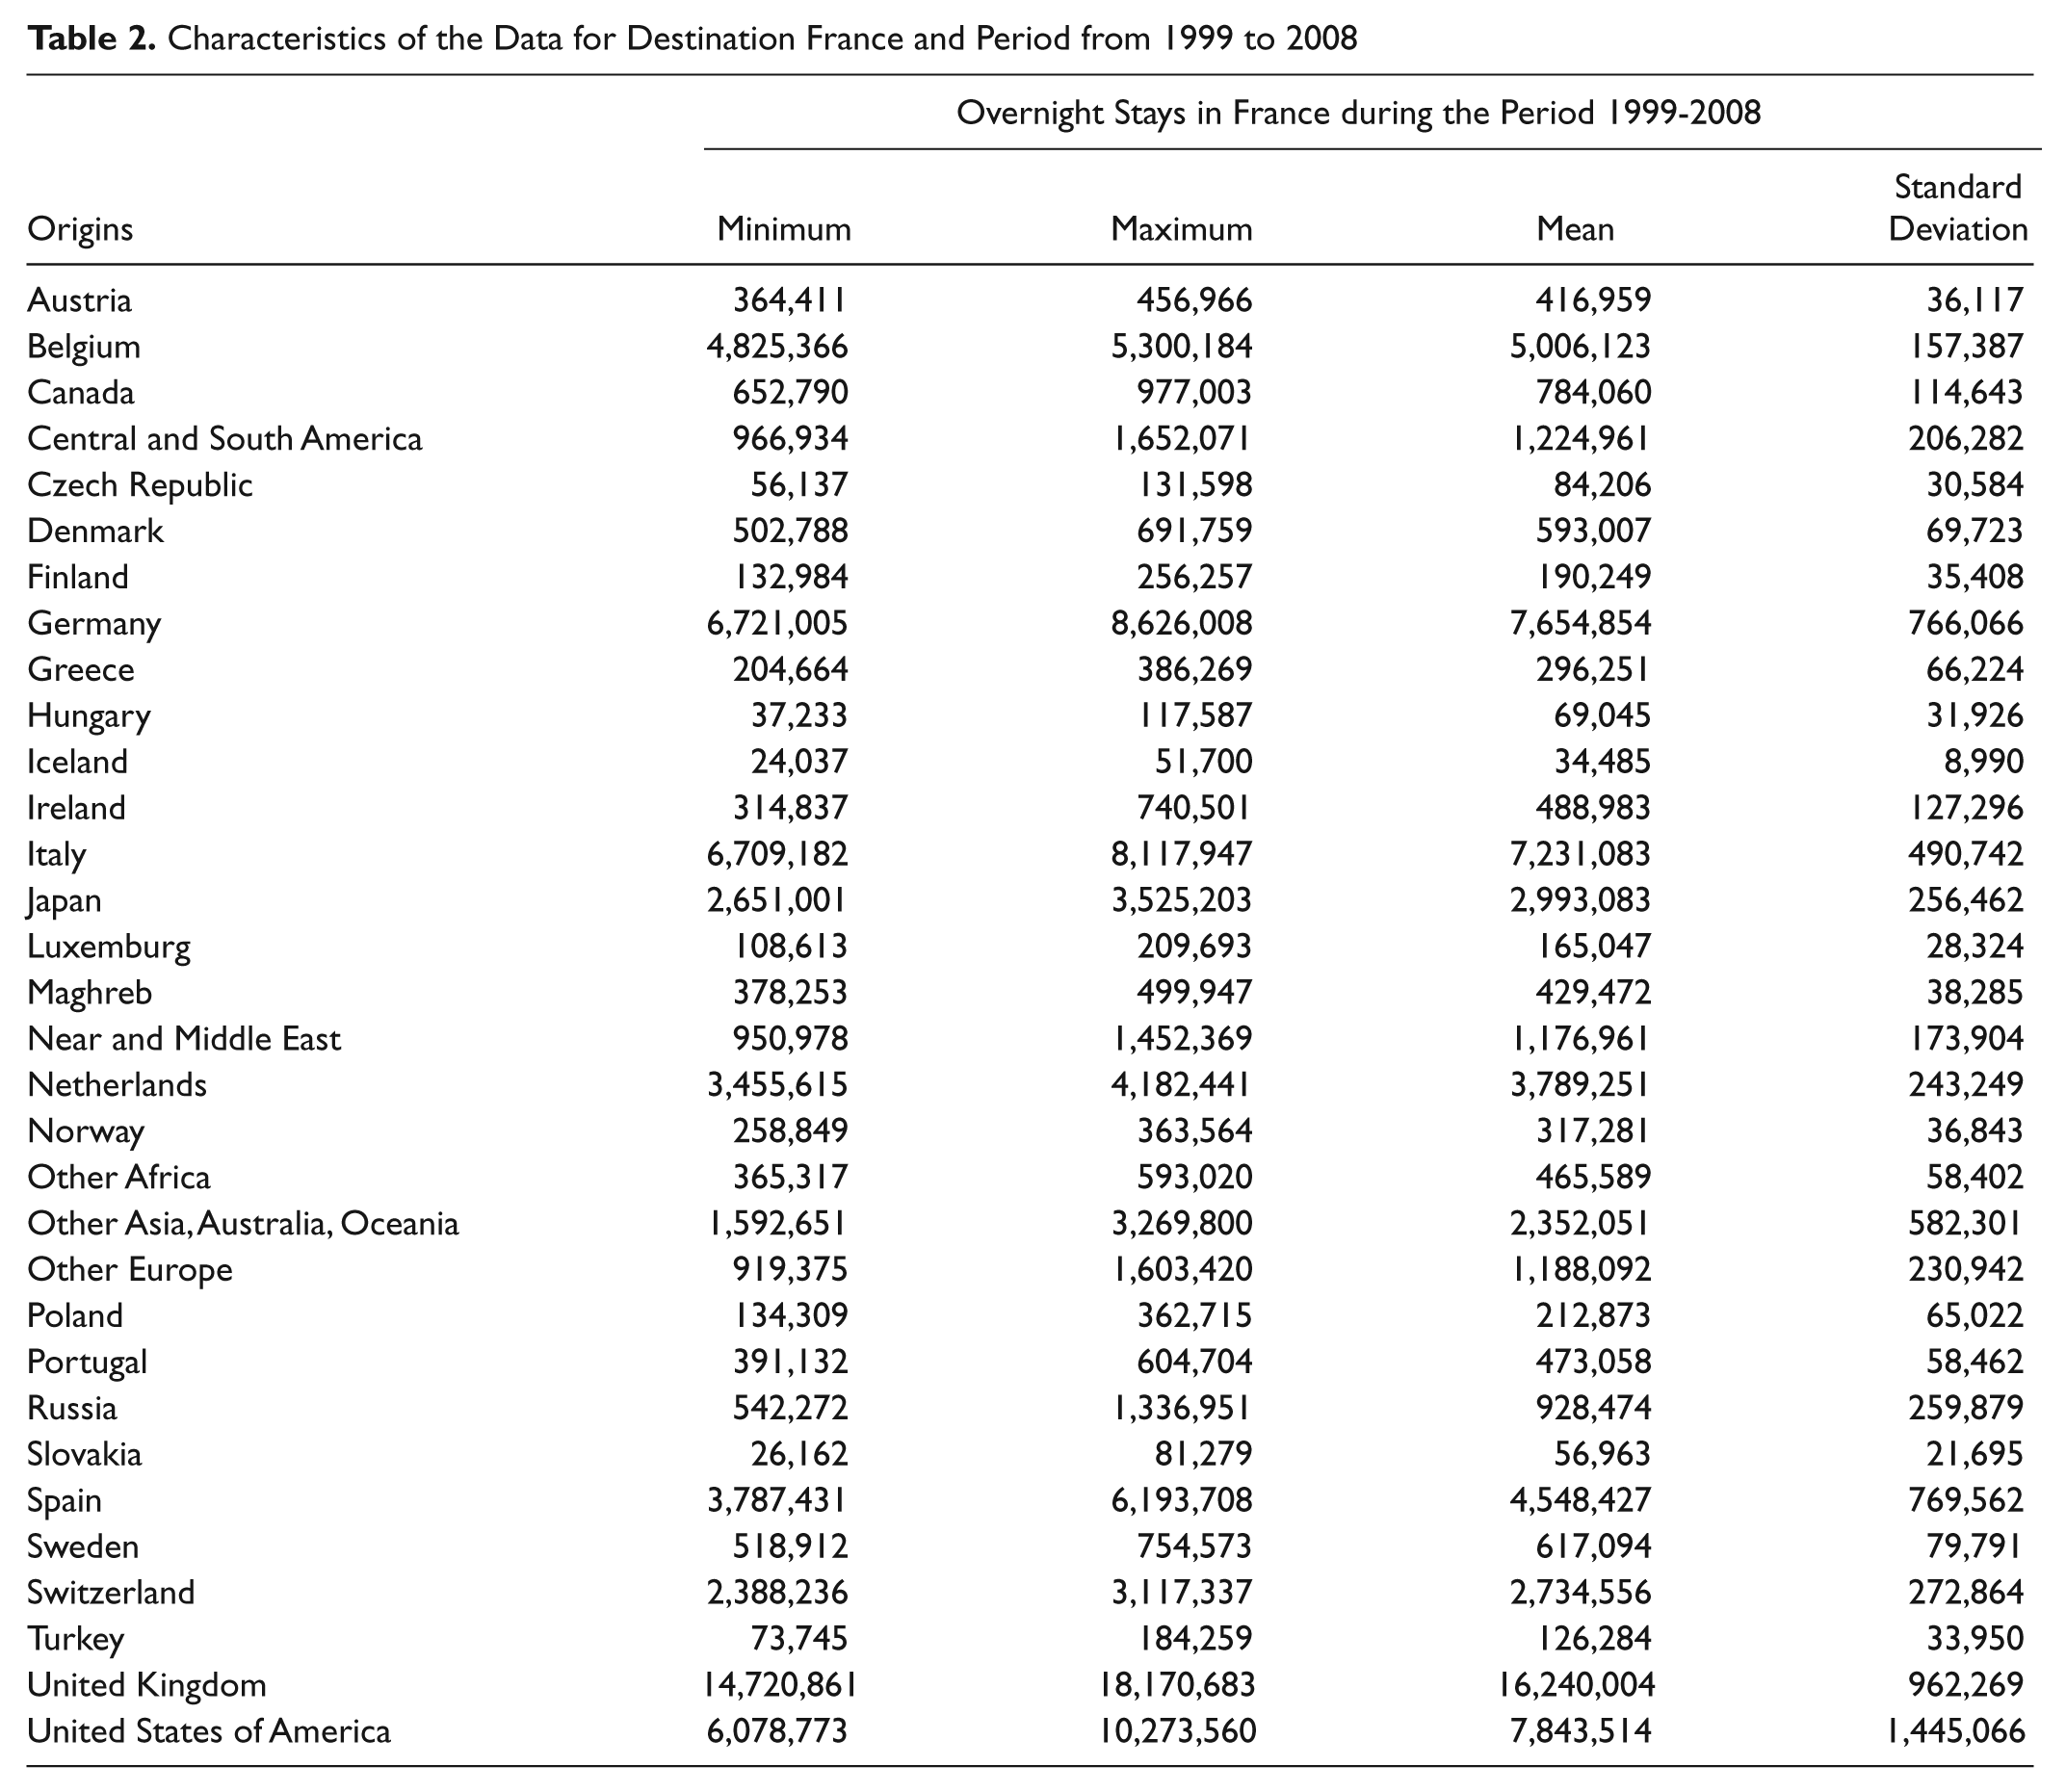
Accordingly to the theoretical framework explained earlier, this article segments the French tourism inbound demand into submarkets represented by origins. In this line, DMOs have to find the optimal combination of origin, that is, the combination that minimizes the instability and maximizes the return of their inbound tourism demand. Table 2 presents several characteristics of the analyzed destination. To calculate the expected return and its risk of variation, financial portfolio approach requires data representing stock prices. This study uses overnight stays as a proxy for the price of each origin. Developing tourist arrivals yields substantial income for the local economy. But destinations always have an optimal tourist arrivals figure and starting from a certain number of tourists, it becomes less attractive for the other tourists. Accordingly, working on destinations development leads to further thought such as the carrying capacity (Butler 1996; Prato 2001) and to focus on the number of overnight stays. Moreover, tourists from northern Europe like to visit countries of southern Europe like Spain, Italy, and Portugal; numbers of them generally stop over only for a few days in France. An investigation of the French Tourism Office estimates that in recent years more than 15% of inbound arrivals are due to the fact that France is a stopover place. However, and especially because the discrepancy between the two rankings is not only due to the geographical features of France, it is not an irreversible situation and it can be a good learning curve to research methods to improve the French government’s tourism strategies.
Data are from a statistical publication of the major tourism institution in France, Atout France.2 It is clear from the last column of Table 2 (standard deviation) that data are spread out over a large range of values as tourism demand relies on changes in prices, tourists’ income or travel costs, political unrest, or changing tastes and fashions. Accordingly, DMOs’ efficiency in the management of their promotional resources is a major issue.
Characteristics of the Data for Destination France and Period from 1999 to 2008
Results of the Optimal Portfolio Determination with the Shortage Function
Results from our theoretical framework are presented in the accompanying tables. For each origin, they present both return and risk level and relative efficiency. The relative efficiency is measured by the distance between a given origin and the efficient frontier. This distance represents possible improvements and can be measured in three directions: vertically in maximizing overnight stays expectancy, horizontally in reducing volatility, and third in both. Accordingly, this article has a real interest for DMOs as it does not only highlight the best-performing portfolios but also sets the stage for performance improvement practices.
Table 3 displays the vertical frame and emphasizes that for the next period, France may expect from Germany more than 7,663 million overnight stays. But this predicted figure should be carefully considered because it is associated with a standard deviation of 711,430 overnight stays. Moreover, for the same degree of risk, overnight stays may reach a level of 13,531,342, meaning that France can improve German overnight stays expansion by exactly 76.57%.
Expected Overnight Stays Expansion Results (Mean–Variance Vertical Frame) for 2009
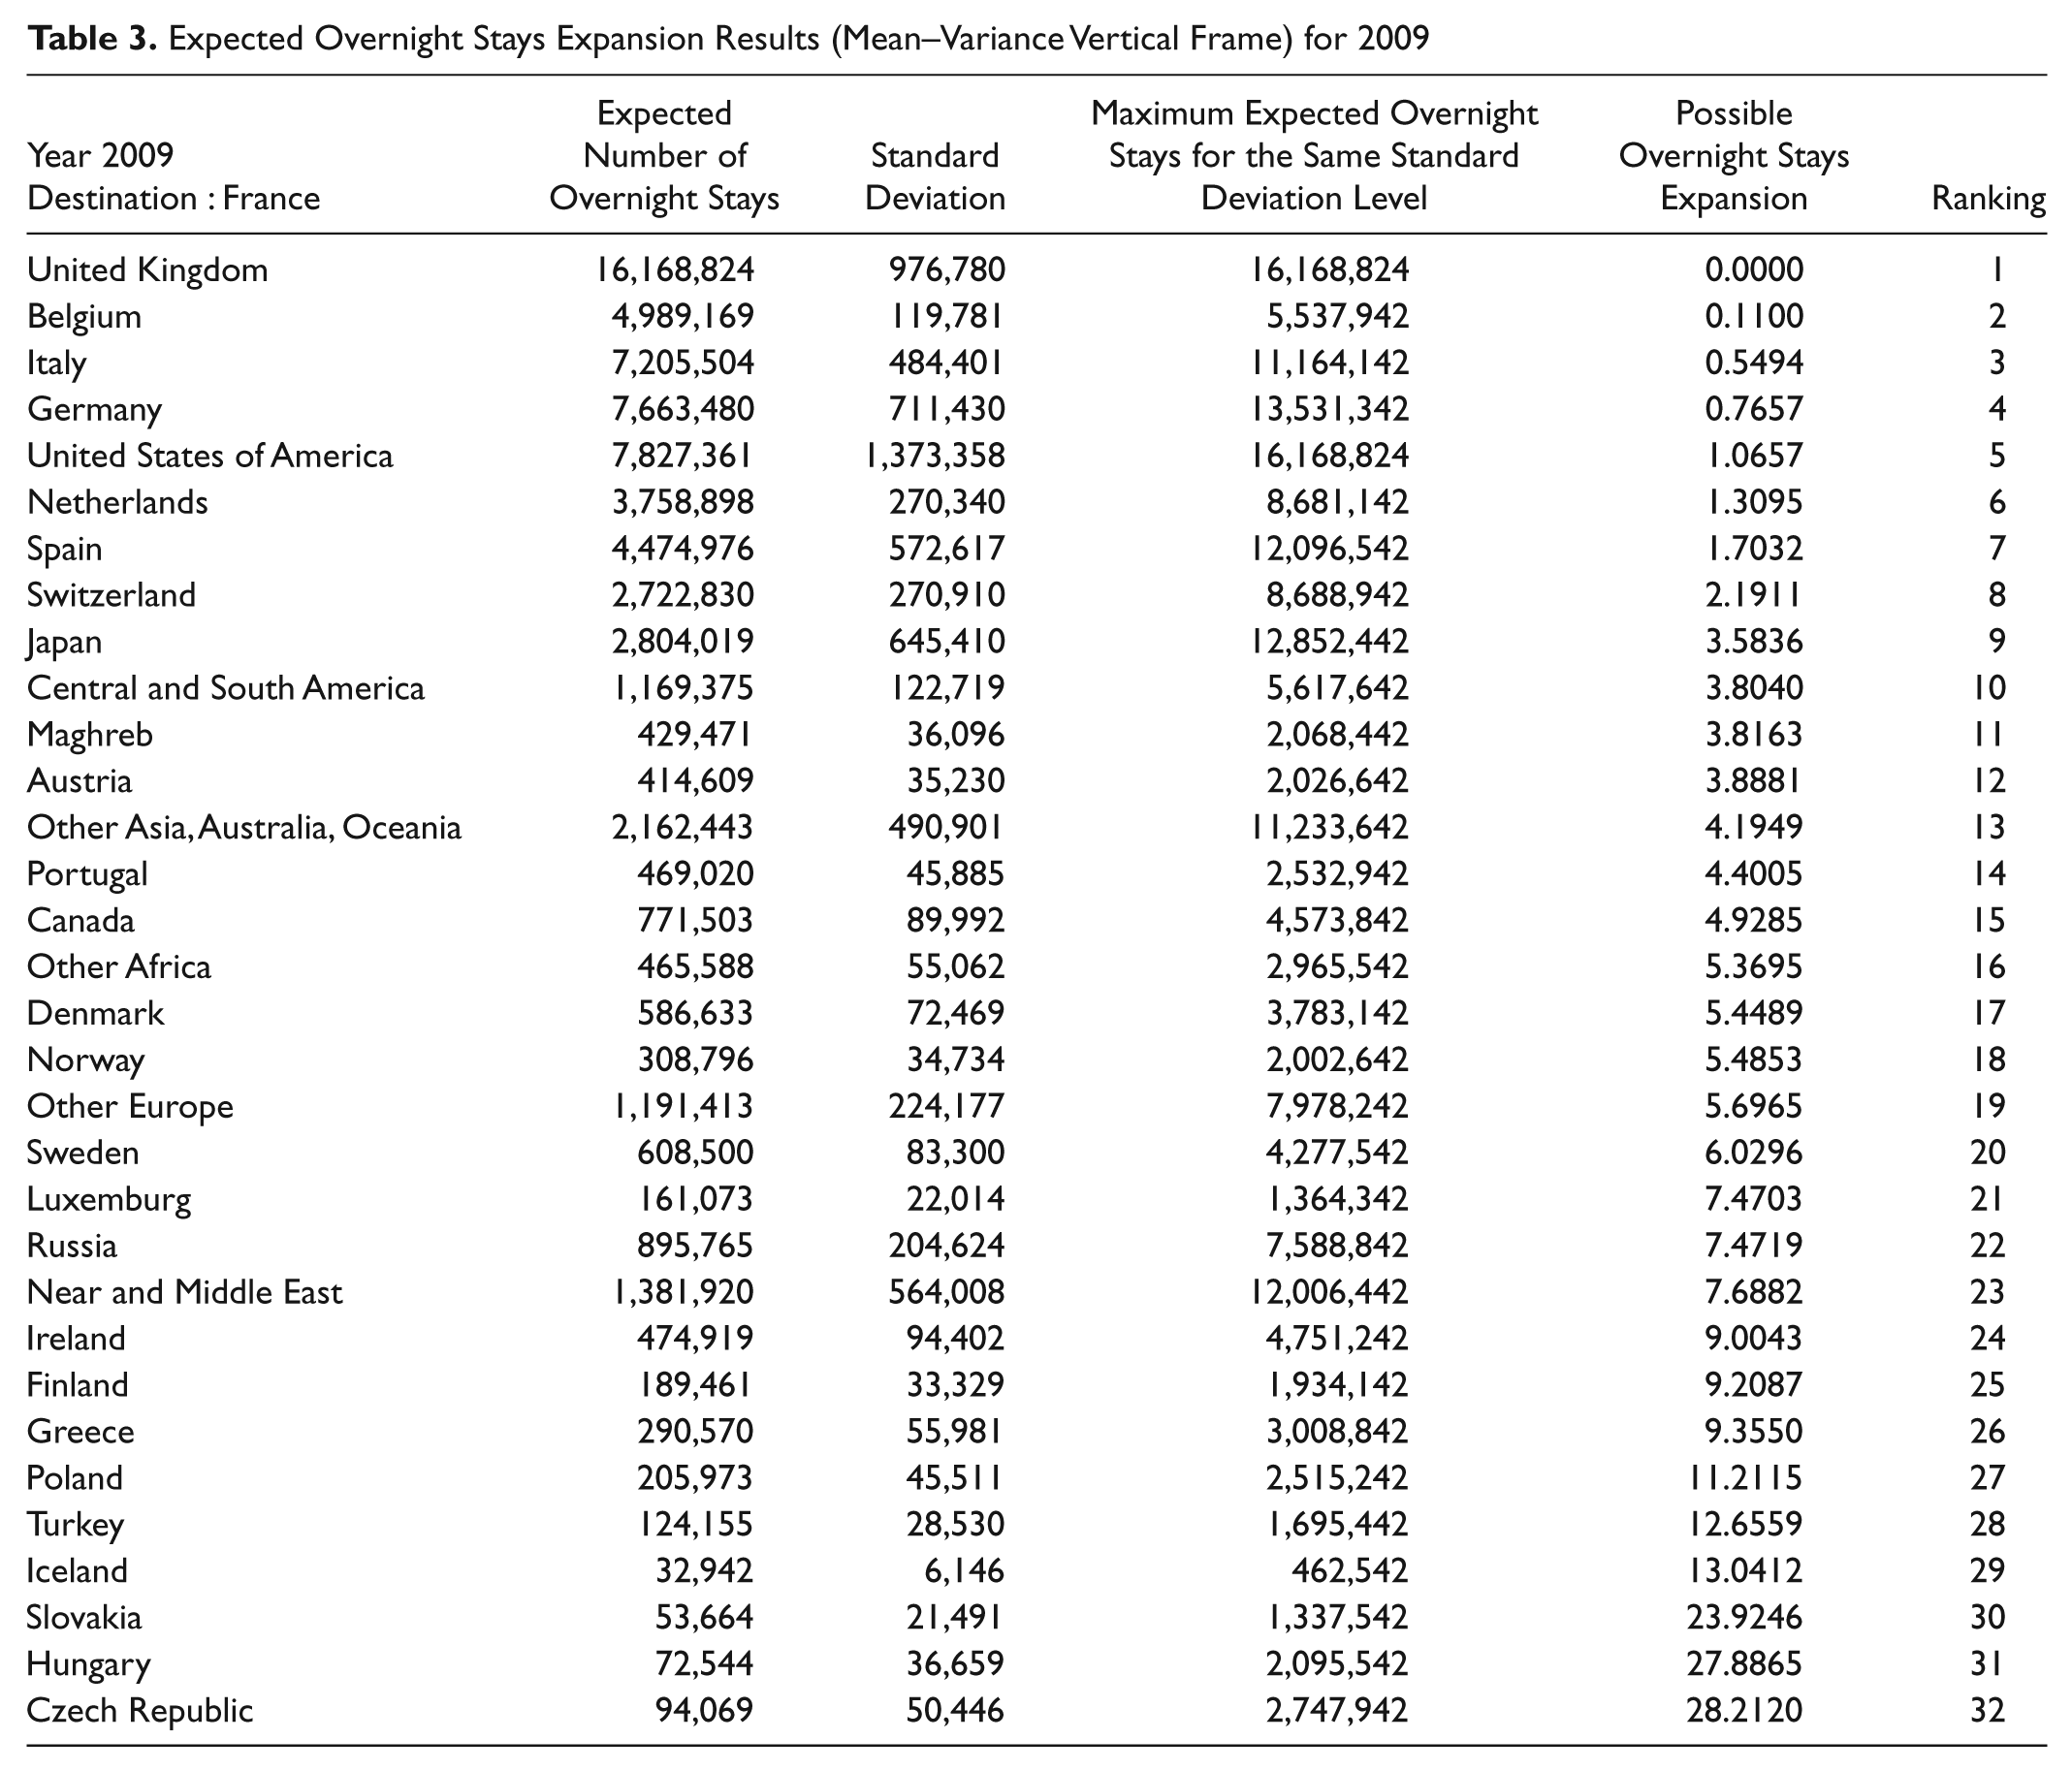
Table 4 demonstrates the horizontal frame, that is, the risk contraction perspective. As previously said, France may expect from Germany more than 7,663 million overnight stays with a standard deviation of 711,430. But the framework chosen in this study enables us to say that France as a destination should be able to reduce the instability of this origin because for the same number of overnight stays, the standard deviation of Germany could be 208,085. France may therefore improve German market stability by exactly 70.75%. As a consequence of this, two previous approaches, and regarding the results presented in Tables 3 and 4, it can be stated that the outcomes of this article show that there is room for adjustment in the marketing policy of the French DMO. Following Leiper’s attraction system theory (1990) and Rita and Moutinho’s (1992) findings, despite the numerous factors that may influence tourism demand, pragmatism implies that promotion is the more relevant tool to place destinations in the strongest position. According to Leiper (1990), tourists are never literally attracted, pulled, or magnetized; they are pushed by their own motivation toward the places where they expect their needs will be satisfied. Accordingly, tourists are motivated to experience an attraction (the nucleus in Leiper’s system) when an information (the marker) reacts positively with their needs and wants. Then, good promotional resources allocation at tourists’ origins is a primary step to achieve competitiveness. The framework developed here is then useful as it enables to identify benchmarks to reach.
Risk Contraction Results (Mean–Variance Horizontal Frame) for 2009

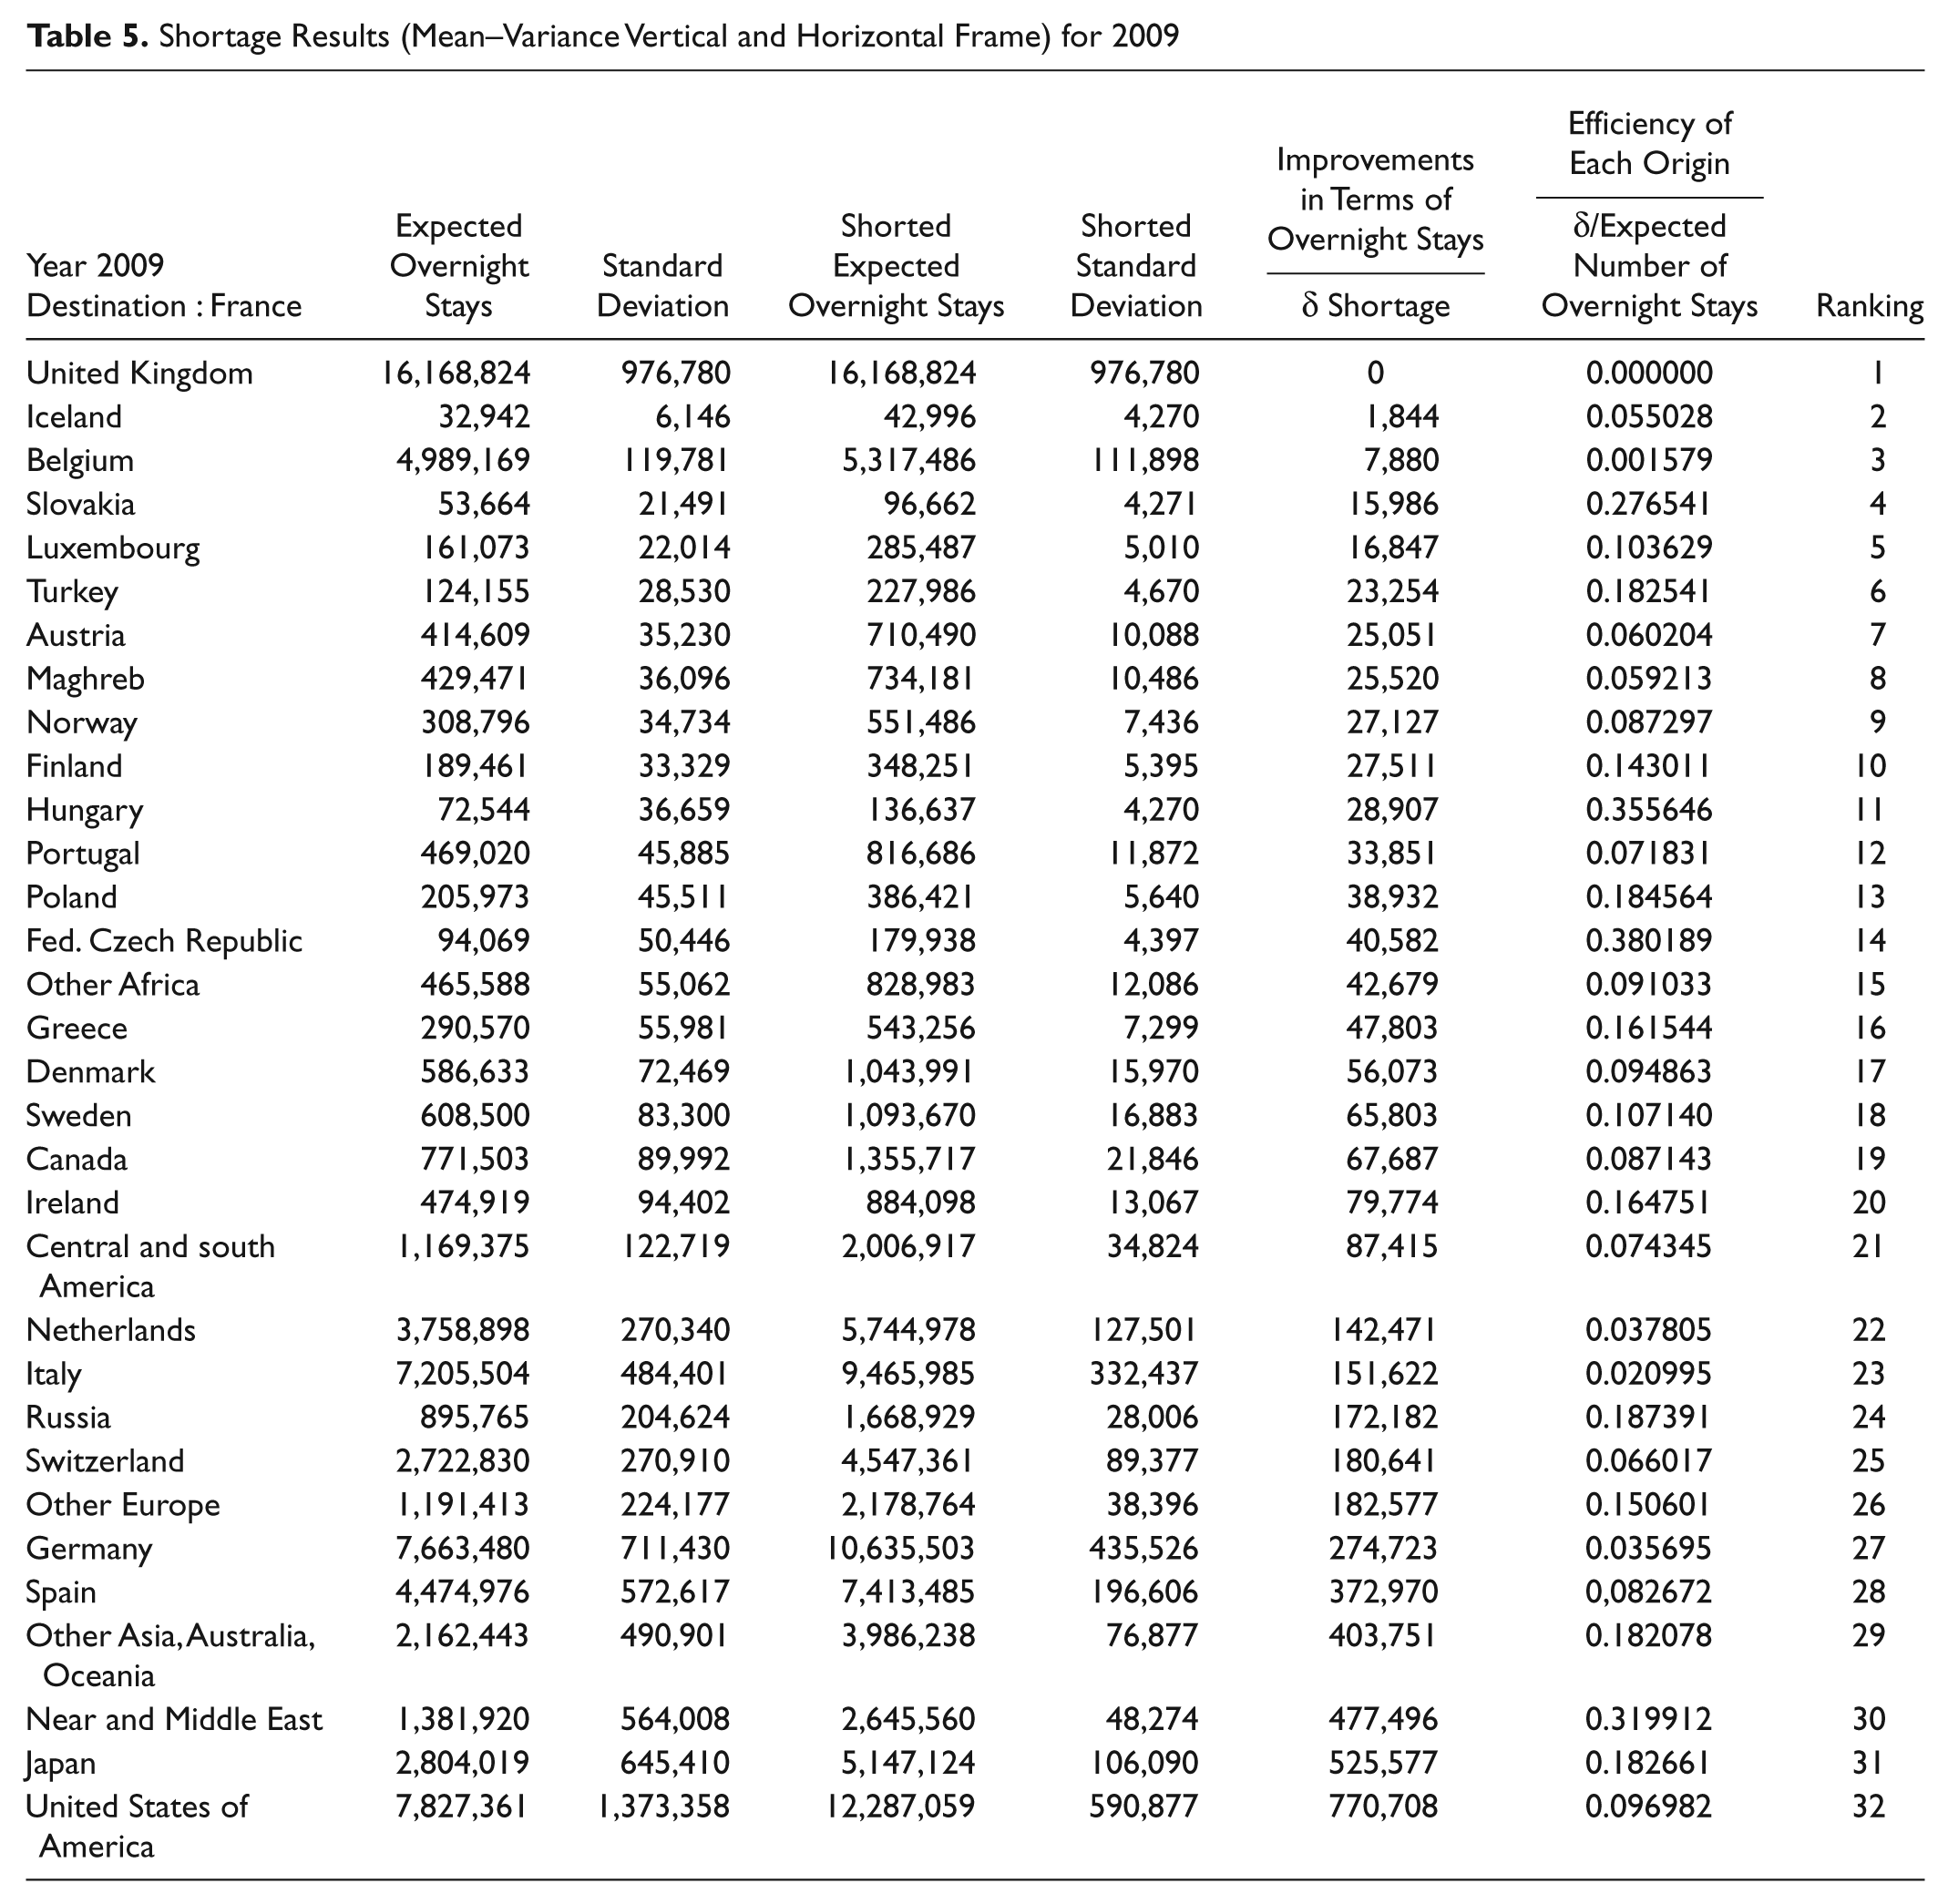
Table 5 simultaneously incorporates the previous two perspectives as shown in Figure 4. As previously explained regarding Tables 3 and 4, for the next period (2009) France may expect from Germany more than 7,663 million overnight stays with a standard deviation of 711,430. The theoretical framework used identifies a point to serve as a benchmark for seeking improvements. Accordingly, point X in Figure 4 represents the German benchmark (V = 435,526; E =10,635,503), which indicates that the French DMO may expect for its destination 10,635,503 overnight stays, with 435,526 overnight stays of variation from the German segment. Moreover, our results show that point X is composed of 21.37% Spanish overnight stays, 33.86% Italian overnight stays, and 44.78% English overnight stays. Then, compared to a portfolio including Spanish, Italian, and English tourists, a portfolio exclusively made of German tourists must improve its overnight stays stability and growth to be efficient. The theoretical framework adopted in this article enabled us to say the French DMO needs to improve the number of German overnight stays by 274,723, which is given by δ in equation (11). In Table 5, we adopt real quantities of possible improvement in terms of overnight stays (column 6) to rank origins. Efficiency of origins (column 7) is given by the ratio δ/expected number of overnight stays. This choice enabled us to take into account the share market of each origin and, accordingly, Germany has 3.5% shortage, which represents 274,723 overnight stays, and Denmark has 9.4% shortage, which represents 56,073 overnight stays. For efficient origins, shortage is equal to 0%, meaning that regarding these ones, the French DMO maximizes return and minimizes risk.
Shortage Results (Mean–Variance Vertical and Horizontal Frame) for 2009
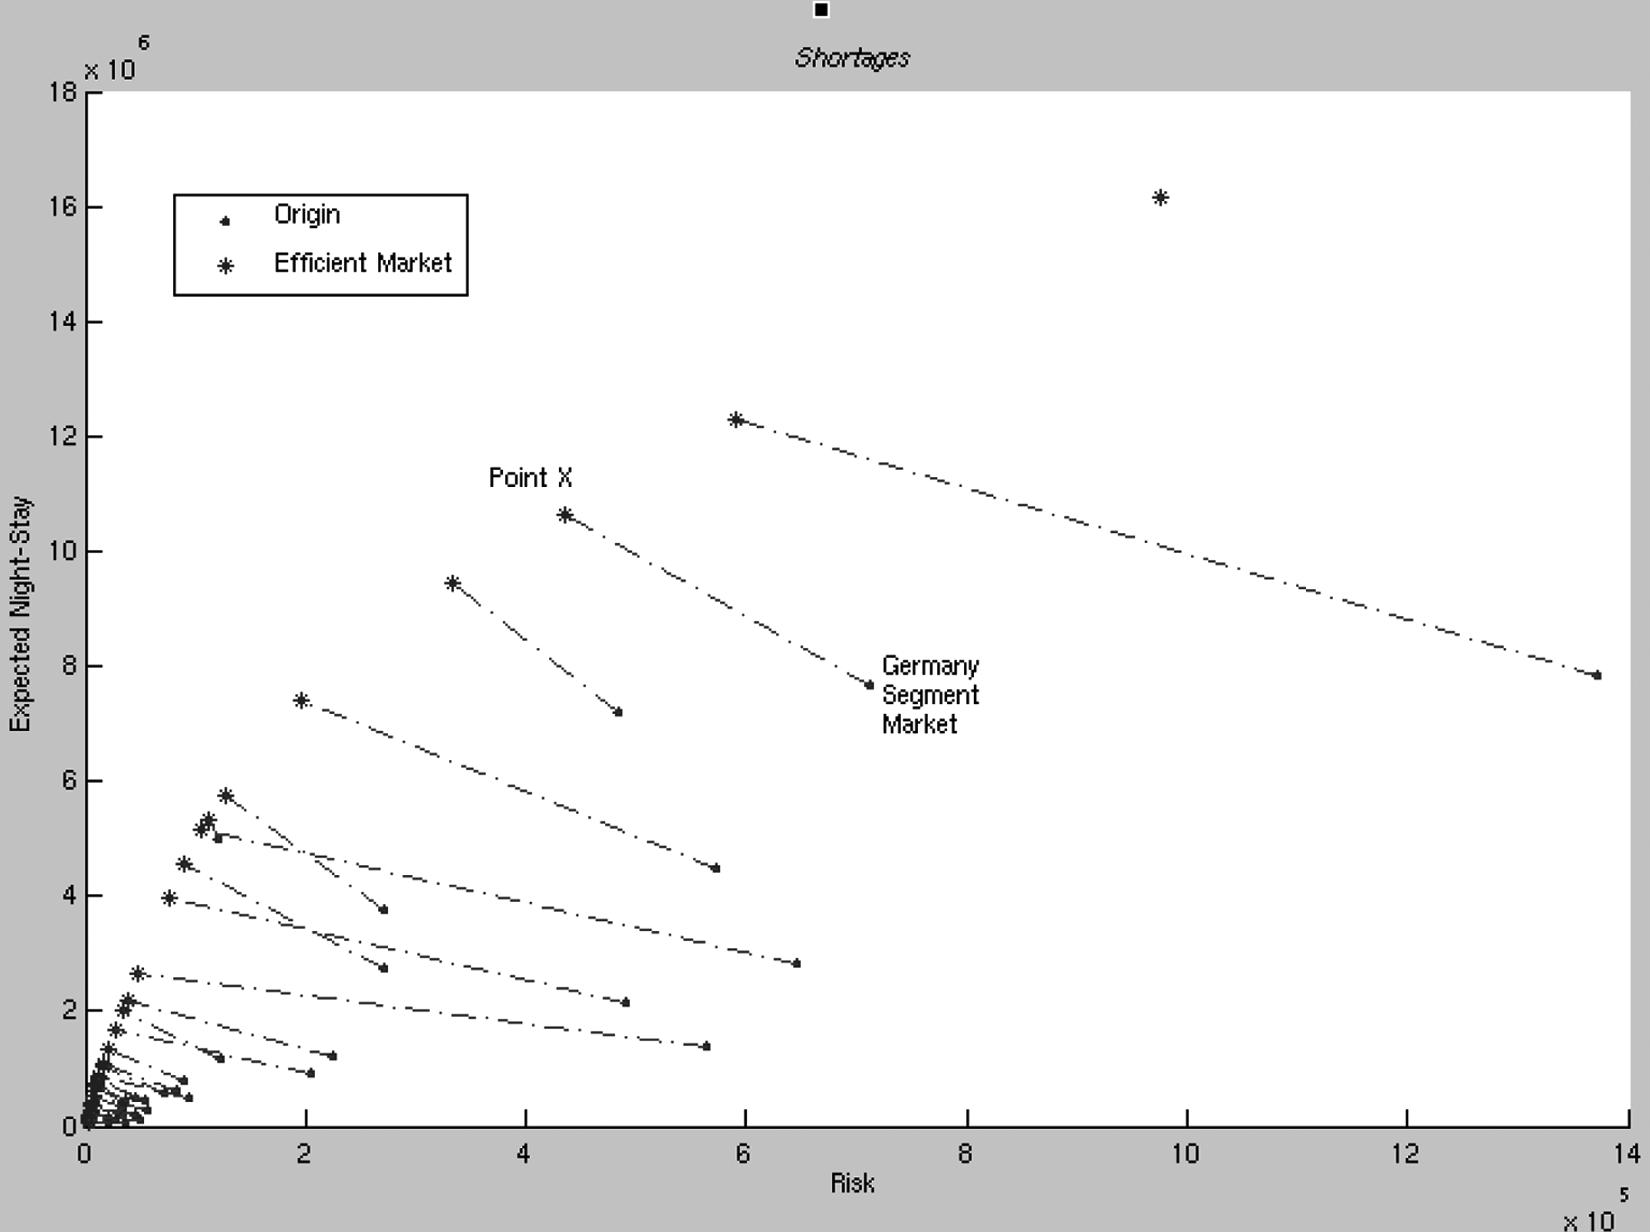
Projections on the efficient frontier
Discussion
As efficiency is of interest to management specialists who want to make an accurate diagnosis of the decision-making units they manage or advise, benchmarking analysis is one of the ways to drive them toward the frontier of best practices. In our case, by calculating scores denoting efficiency of different origins, this article estimates the potential improvement that can be made by inefficient ones. Furthermore, to propose a chart to help DMOs with analyzing the demand of their destination, Figure 5 below represents results of Table 5, which are results obtained from the shortage framework. On the risk–return tradeoffs chart, each origin can be compared to the global mean expectancy and/or to the global mean standard deviation designated by the black triangle. This distribution allows to identify four groups of origins: (1) stable with low growth origins, (2) stable with high growth origins, (3) unstable with low growth origins, and (4) unstable with high growth origins.
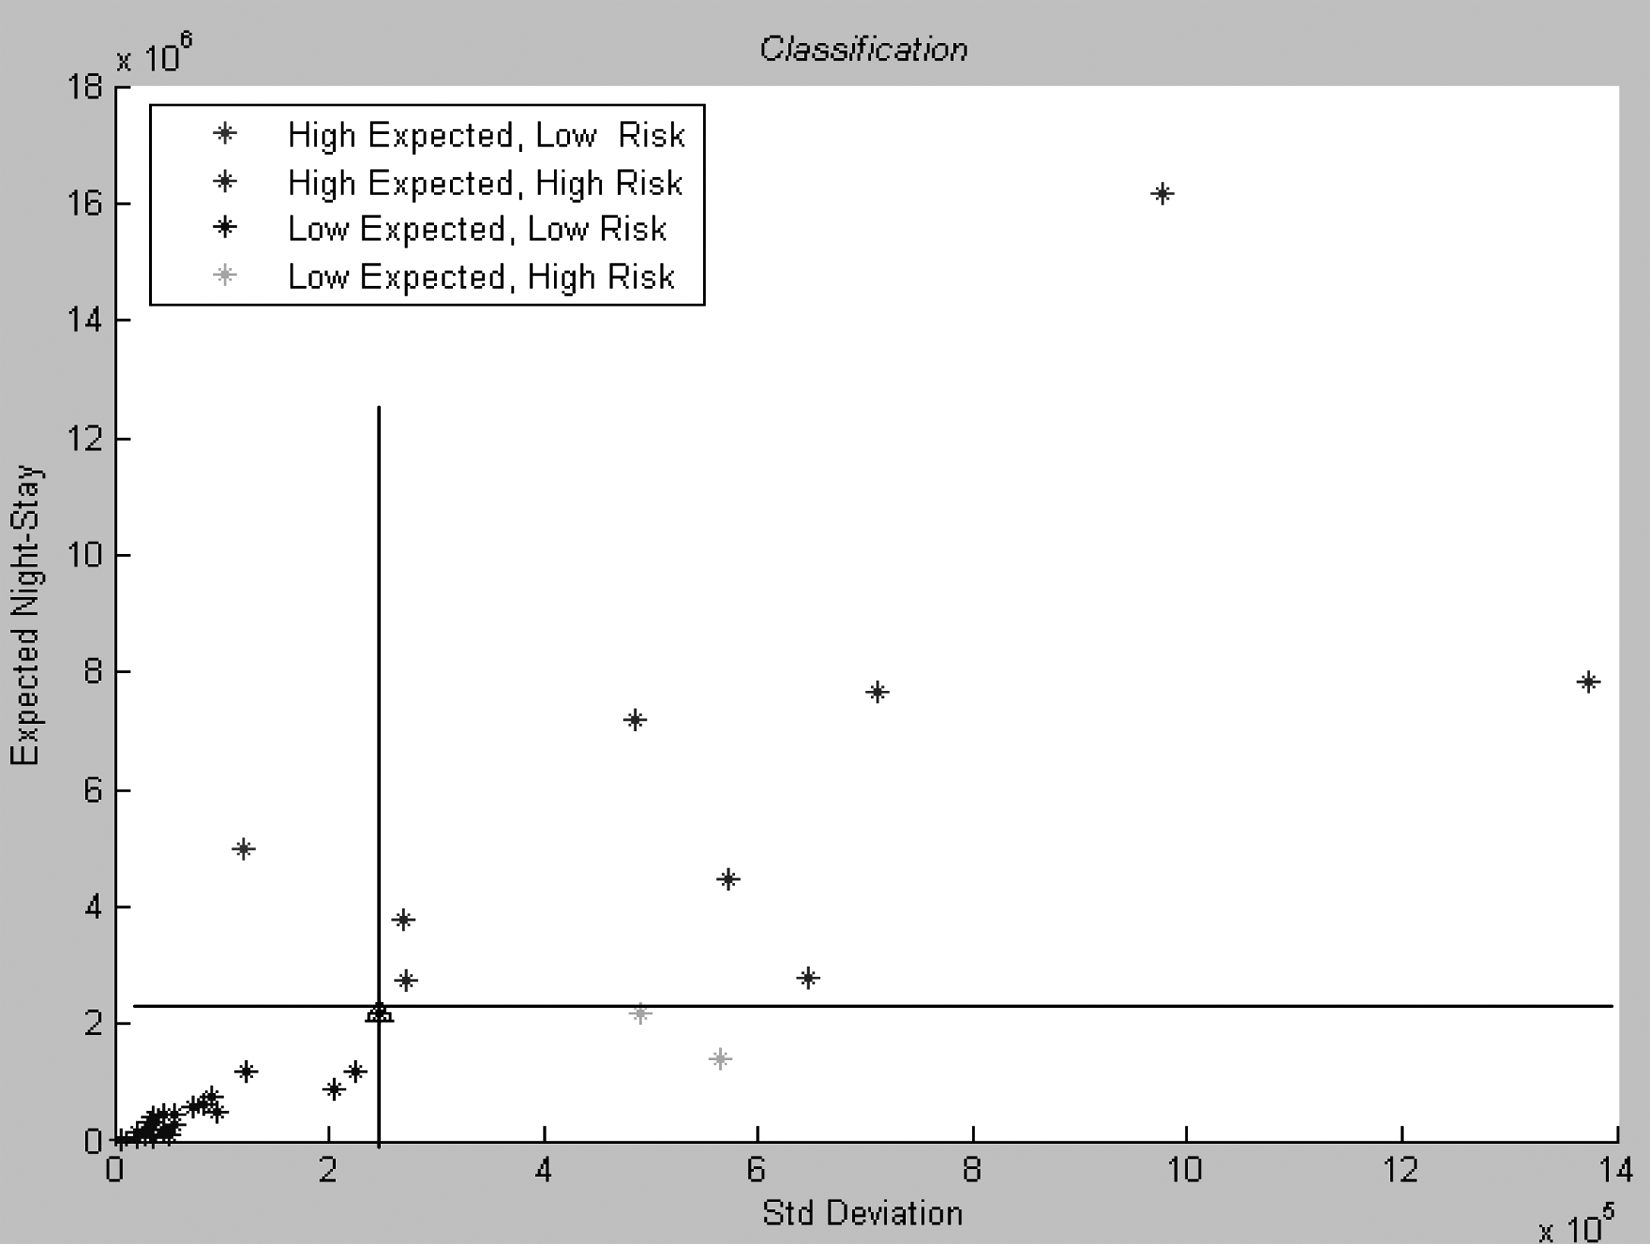
Classification of origins
The identification of these four classes relates us to the concept of growth–share matrix, such as the BCG (Boston Consulting Group) matrix. In the early 1970s, the Boston Consulting Group developed a model for managing a portfolio of different business units or major product lines. The BCG growth–share matrix displays the various business units of a company on a graph of the market growth rate versus market share relative to competitors. Then, it has two dimensions: market share and market growth. The basic idea behind it is that the bigger the market share a product has or the faster the market grows the better it is for the company. The main value of this matrix lies in the resources allocation framework that it proposes: resources are allocated to business units according to where they are located on the map. The BCG matrix assists decision makers who face investment dilemmas and may be used to determine what to prioritize in the portfolio of a company. To ensure long-term value creation, a company should have a portfolio that contains both high-growth products in need of cash and low-growth products that generate a lot of cash. It has previously been used by several researchers, for example, Turnbull (1990) and Laimer and Weiss (2009).
Since the earliest trading days, the trade-off between risk and return has been the basis of every investment decision (Stambaugh 1996). Similar to financial managers who try to best allocate risks between different stocks, DMOs have to manage their destination as if it was a portfolio or origins. Assuming that a link may be made between variance (risk) and cash usage, it is possible to make an analogy between the BCG matrix and the mean–variance framework. This link seems to be totally founded as risk can be defined as the “chance” of loss, that is, the amount of possible expenses. According to this analogy, high-growth products (stars and question marks in the BCG matrix) are those whose risk is higher because they are the ones that require the most investment (generally speaking, stocks with higher returns are indeed riskier). Similarly, low-growth products (cash cows and dogs in the BCG matrix) are those whose risk is lower, that is, those that require less capital and have a strong profitability (notably cash cows).
Applying this way of thinking to our case study helped us to determine four groups of tourists Table 6: (1) those who come from countries that represent high return–high risk markets, that is, “stars” origins; (2) those who come from countries that represent high return–low risk markets, that is, “cash cows” origins; (3) those who come from countries that represent low return–low risk markets, that is, “dogs” origins; and (4) those who come from countries that represent low return–high risk markets, that is, “question marks” origins.
Classification of Origins in Analogy with BCG Matrix
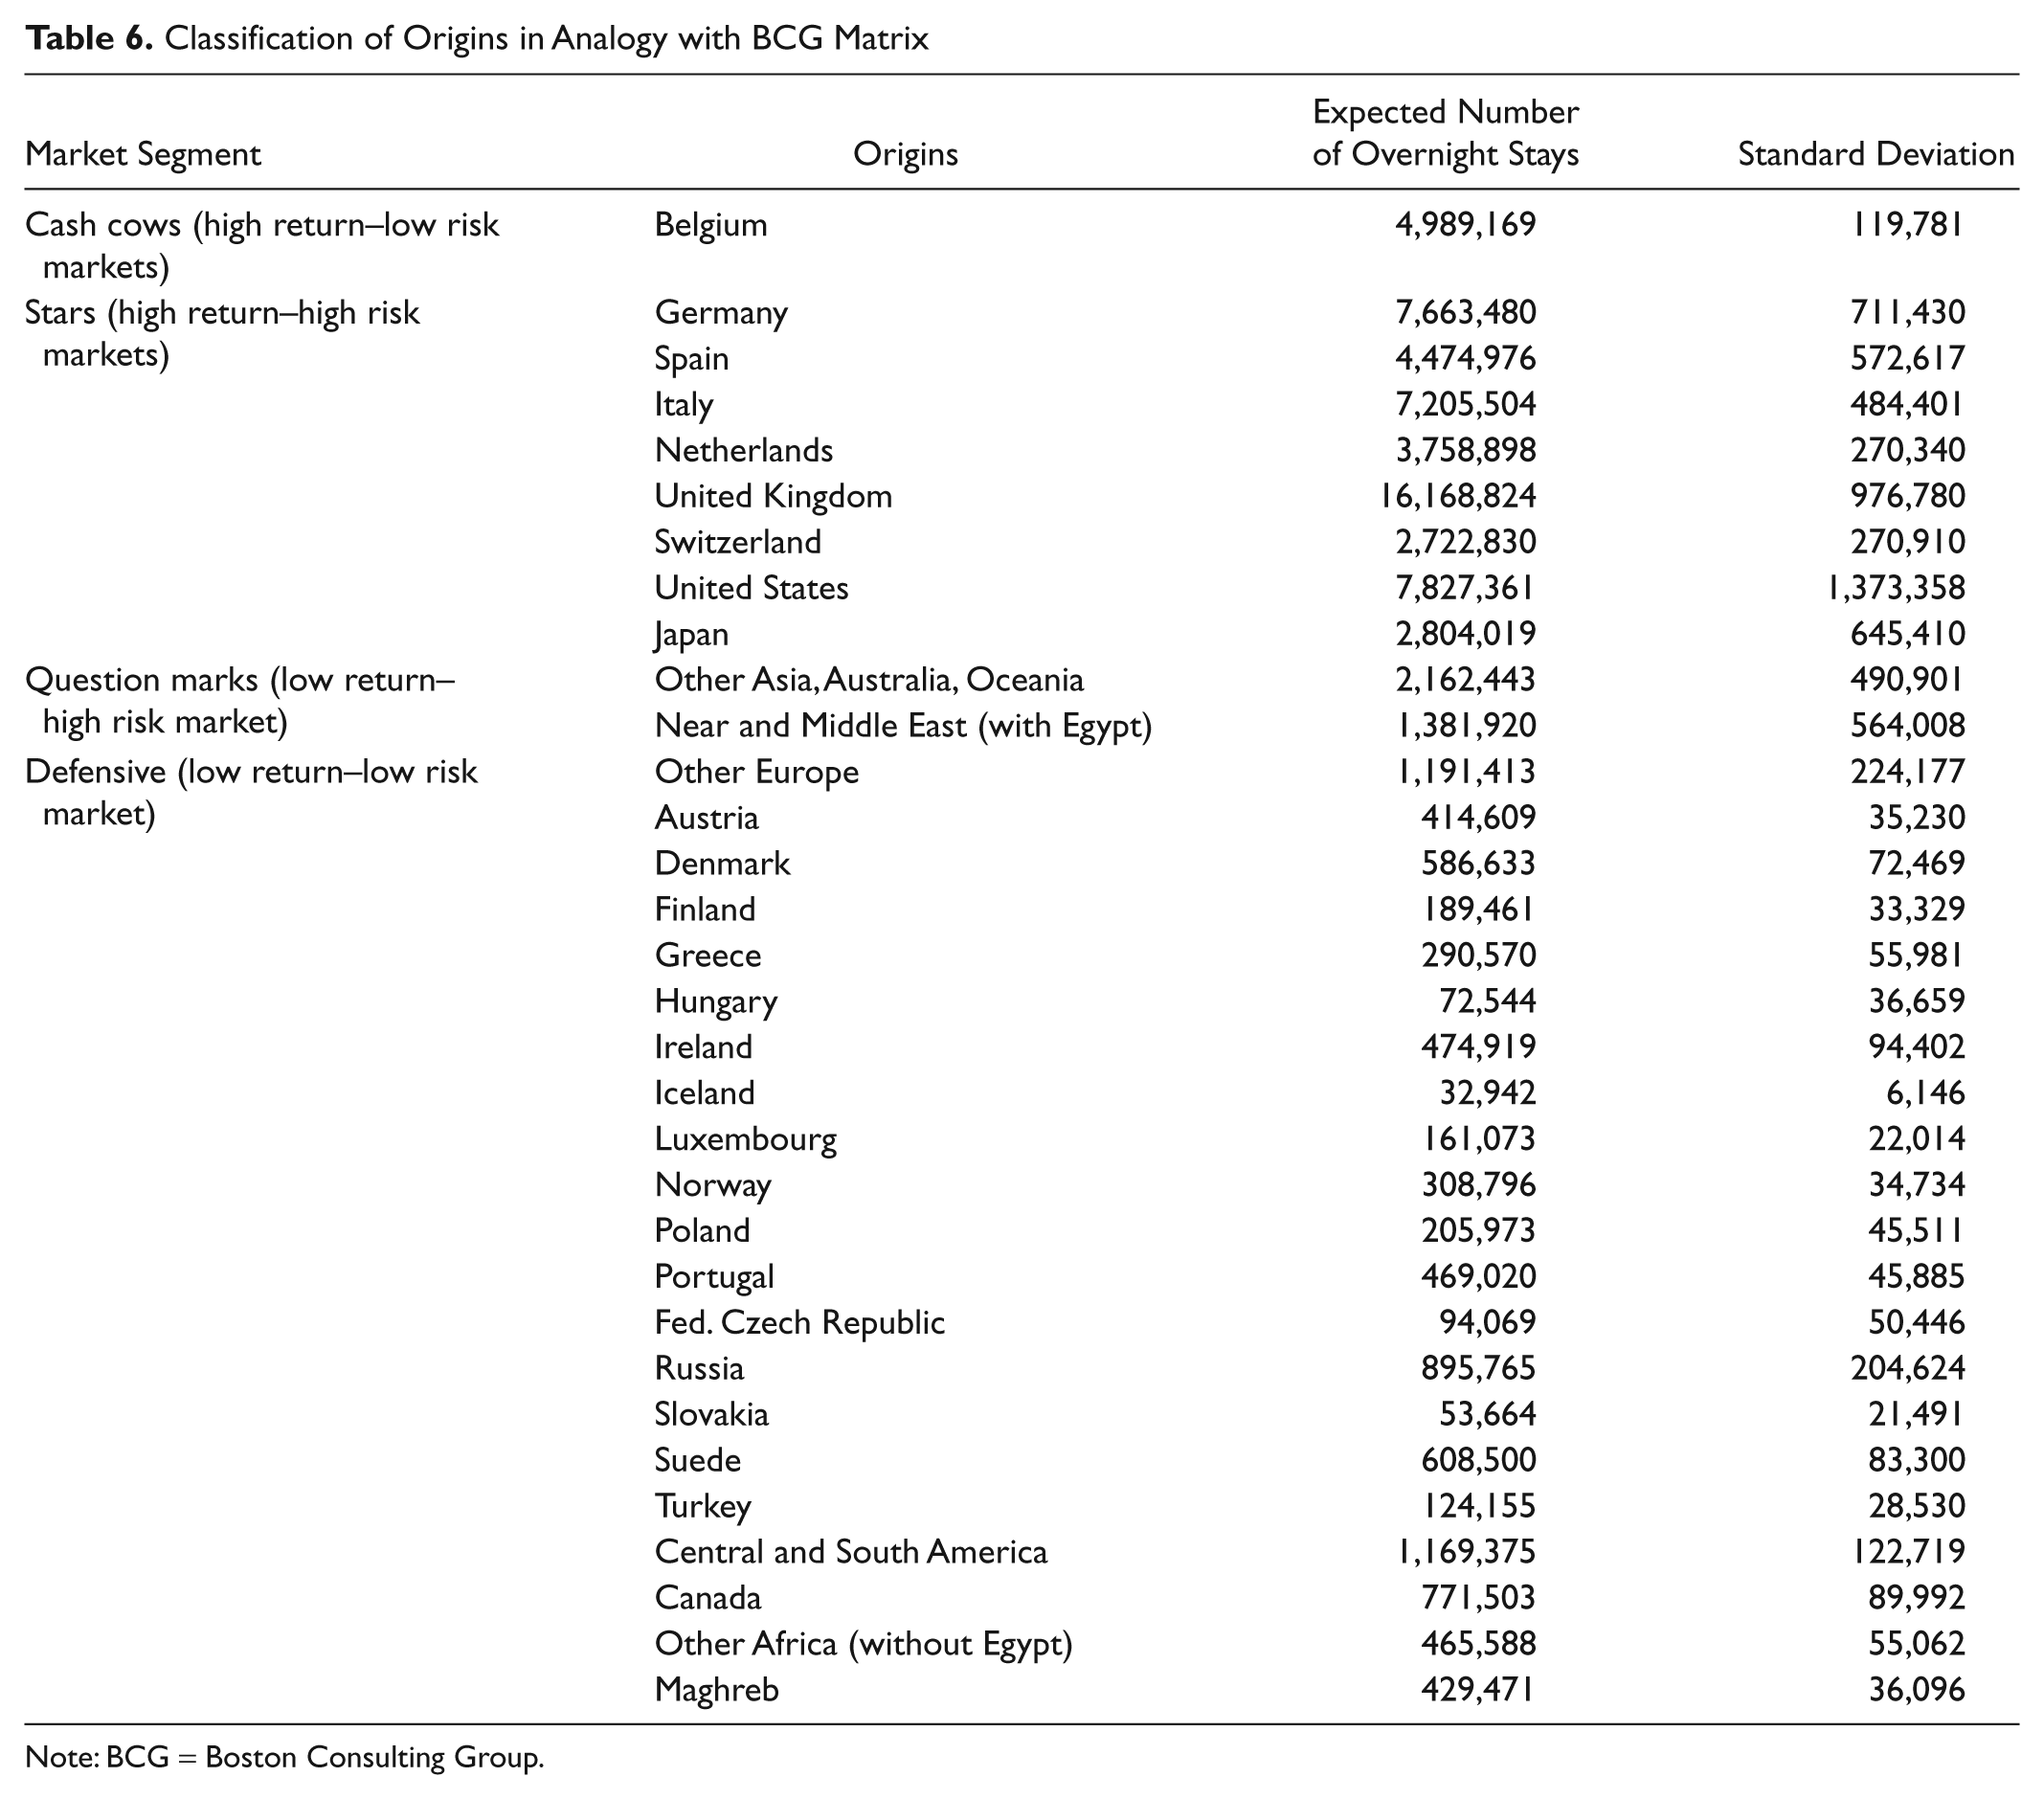
Note: BCG = Boston Consulting Group.
As previously discussed, tourism development and tourism competitiveness improvement are dependent on the managerial skills of DMOs. The purpose of this study is to propose to destination managers a tool to rationalize their decision making with regard to what is more profitable and less risky to invest in. Accordingly, our guideline aims to help DMOs to be more efficient with respect to their resource allocation (e.g., promotional resources) in terms of tourists’ origins. To rationalize their decisions, DMOs need to focus on stars origins, which represent best investments as their return is high. But these origins also represent the segment where the risks are the highest. In this line, in order to target these segments, DMOs must implement an appropriate promotional policy to try to retain their loyalty. In this perspective, it is necessary to work on tourism attractions of the selected destination. Indeed, understanding how tourists perceive attractions provides a means for destination managers to anticipate the tourist’s length of stay and to optimize their attraction offer (Botti, Peypoch, and Solonandrasana 2008). Otherwise, as funding is needed to support promotion and other marketing actions, it is important for DMOs to focus on the cash cow origins that generate profit. It may be interesting to develop a strategy to maintain destination market share regarding these different origins in order to keep this funding source for other projects. As regards stars, large market share mean competitive advantage and therefore economies of scale and experience that give an advantage over competitors. Question marks are uncertain segments, because these segments have a strong competition and do not generate profits. The question is therefore on their maintenance or disappearance. Dogs segments may be retained as long as it releases enough resources to finance itself.
Conclusions, Limitations, and Future Research
Competition among tourism destinations gets tougher and tougher. While DMOs’ roles have already been pointed out by several authors (Bornhorst, Ritchie, and Sheehan 2010), much remains to be done to understand how DMOs can be more efficient so as to make their destinations more competitive. In this line, this article suggests a framework to help DMOs improve their efficiency in the promotion of their dominion. Regarding this topic, previous analyses are restricted to a small number of studies while all economists know that when demand decreases, efficiency becomes a major issue, because of the ever more intense pressure of competition. Accordingly, a number of studies have considered the measurement of efficiency in the tourism industry since the 1990s. Among others minor studies, Hwang and Chang (2003) or Barros and Mascarenhas (2005) used the DEA methodology for evaluating hotels’ efficiency while Köksal and Aksu (2007) or Barros and Dieke (2007) worked on travel agencies. Then, when compared with other research fields, the bibliography of DMOs’ performance is clearly brief for such an important aspect of the tourism industry. With the present study, we endeavor to steer the attention of tourism management researchers to this neglected aspect of the fastest-growing industry in the world.
The aim of this article is to provide a credible, step-by-step and innovative application of the mean–variance model in tourism, in order to provide DMOs a framework to justify their choices according to their goals (growth and/or stability of their destination). By the way, this article makes a fresh contribution to the tourism literature. Indeed, it is the first to introduce the shortage function in the mean–variance model and accordingly provide somehow a new and useful approach to asses DMOs’ performance. Moreover, as computational costs of solving quadratic programs are high, it is difficult to empirically apply the full-covariance Markowitz model. This article then uses the framework developed by Briec, Kerstens, and Lesourd (2004) that enables to integrate an efficiency measure into the single-period Markowitz model. Accordingly, although this study follows Jang and Chen (2008) (considering that volatility management of tourism demand needs to be incorporated into destination management), its added value lies in the developed scheme. Theoretically, it brings tourists’ origins portfolio theory in line with the developments (shortage function) in the production theory field. From a practical viewpoint, it is easier to compute and therefore extend the empirical toolbox of tourism managers.
To maximize its tourism strategy, and following the results presented above, the French tourism authority can choose a combination of origins according to its risk preferences. If the French DMO pursues simultaneously overnight stays expansion and market variability reduction, it has to mainly focus its efforts on the United Kingdom market. In the same order of idea, it must also focus on Belgium, Italy, and Netherlands. If it only wants to reinforce the loyalty of inbound tourists (i.e., volatility reduction strategy), it has to mainly promote its destination to United Kingdom, Belgium, Iceland, Italy, and Germany. Otherwise, if it wants to improve the number of overnight stays, it musts enhance its promotion policy in the following countries: United Kingdom, Belgium, Italy, Germany, United States, Netherlands, and Spain. In this line, the general conclusion is that the French tourism DMO has loads to do to improve the competitiveness of destination France. However, more in-depth research is required to strengthen our framework and to back up these first results.
Although this study tries to propose a convincing framework, we can identify some limitations. First, our attempt remains a prospective model and not a predictive one, so DMOs may use it as a part of a Plan-Do-Check-Act (PDCA) management outline. Second, tourism demand and expected overnight stays depend on several factors. If the model used in the paper takes into consideration tourism demand variance, it implies a Gaussian distribution of the tourism demand growth. Nonnormality, explained by transport price (low cost), infrastructure carrying capacity (congestion), and/or exceptional events (natural disasters, terrorism, international sport event) may yet be considered by including in this framework the third moment (skewness). Long-term data series could also help calculate the Luenberger productivity indicator that gauges assets performance and enables measurement of efficiency and technological changes within a time span (Blancard et al. 2006; Barros and Peypoch 2008; Barros et al. 2010). Technological changes result in the shift of the frontier in time, that is, change in the tourism volume, as efficiency changes reveal decision-maker performance. Last but not least, our approach might be used on alternative data sets, that is, other destinations.
Footnotes
Acknowledgements
The authors acknowledge the three anonymous reviewers for their helpful comments and Nicolas Peypoch (CAEPEM, University of Perpignan Via Domitia, France) for his observations and encouragements. Their respective contributions have greatly improved this article.
The author(s) declared no potential conflicts of interest with respect to the research, authorship, and/or publication of this article.
The author(s) received no financial support for the research, authorship, and/or publication of this article.