




Abstract
This study showed the benefits that can be accrued by using a common technique in cognitive anthropology—free listing—but less common in the tourism scholarship. This article discusses the use of free listing as applied to a particular tourism experience popular in North America, Spring Break. The findings of this study suggest that a cohesive cultural domain concerning this experience exists and that it was shared by the participants in this study. Results further showed that participants’ cognitive representations of Spring Break were consonant with the “Spring Bacchanal” stereotype of Spring Break but, paradoxically, were at odds with the participants’ own Spring Break experiences. This cognitive-behavioral discrepancy is discussed in light of existing literature. Implications for scholars and practitioners as well as directions for future research are suggested.
Introduction
Free listing, or free recall, is a qualitative data gathering technique used to elicit elements of a cultural domain, defined as a “set of items that are all of the same type” (Borgatti 1994: 261). The purpose of free listing is to “identify, measure, and describe variation in cultural knowledge between groups” (Schrauf and Sanchez 2008: 3). Free listing is a simple process that consists of posing the question(s) “How many X’s do you know” or “How many kinds of Y’s can you think of?” to a number of participants, where X and Y are distinct cultural domains, such as animals one might encounter on a farm (Henley 1969), or Mexican home remedies (Trotter 1981). The number of cultural domains that can be analyzed by free listing is virtually endless and is limited only by the researcher’s imagination.
Free listing’s main assumption is that the individual understanding of cultural domains is neither random nor unique, that is to say, members of a given culture share cognitive representations of cultural phenomena. Such representations are not exclusive to each individual, but rather contain common elements along a continuum of different levels of agreement (Weller 2007). Much can be learned from free lists, both at the individual and aggregate levels. For example, if one were to ask a group of people to list “all the things that can go wrong during a holiday” it is likely that we would have rather long and heterogeneous lists, but that nonetheless would share certain commonalities (e.g., flight delay, lost luggage, misplaced hotel reservation). Ordinarily, free lists tend to produce a great deal of items listed by one or two persons; a smaller number of items listed by a few people; and an even fewer number of items that everyone or almost everyone lists (Bernard 2006). It is in the similarities, or levels of agreement, evidenced by the items free listed by the participants that the researcher is interested.
Which items are free listed and which are not, in what order, and how often, as well as the length of each individual free list, are important variables that reveal something of the structure and composition of each cultural domain (De Munck 2009; Weller and Romney 1988). Items that are listed first in a respondent’s free list are thought to be more prominent than items listed last; items that are listed by a greater number of informants are also thought more prominent than items that only few people mention; and the length of each individual free list is a measure of an individual’s knowledge of a given cultural domain (Bernard 2006; Borgatti 1999). Furthermore, whom the researcher asks to produce free lists is also worthy of analysis. Going back to the previous example of “all the things that can go wrong during a holiday,” it seems plausible to assume that posing that same question to a group of travel agents and to a group of tourists would yield different outcomes—it is likely that the travel agents’ responses would be more cohesive than the tourists’. Often the researcher is also interested in seeing if the content and length of a set of free lists varies with other factors, such as gender, socioeconomic status, age, and so forth.
There are numerous advantages to the use of free listing as a data gathering technique (Bernard 2006; De Munck 2009; De Munck and Sobo 1998; Quinlan 2005; Weller and Romney 1988). First, it is a simple and inexpensive process that requires only paper and pencil but that can also be carried out using more sophisticated means, such as online surveys (e.g., EducaraSURVEY software). Second, it is easily comprehended by informants and research assistants, requires littler training to master, and can be done with illiterate participants as well. Third, when properly conducted, it can yield a surprising amount of rich data about a given cultural domain, which can then be studied using more advanced means of analysis such as pile sorts, triad tests, cultural consensus analysis, and so on. Fourth, it constitutes an ideal icebreaker when conducting in-depth interviews (as occurred in the present study) and is often used to ease the interviewee into certain topics of conversation. Lastly, and perhaps more importantly, it provides emic data about a given topic/cultural domain, that is, it provides data from the participant’s perspective, unfiltered and unencumbered by external categorizations imposed by the researcher.
On the other hand, free listing is not without drawbacks; free listing data are vulnerable to external stimuli, such as displaying a picture of a violin and asking a participant to make a list of “musical instruments.” Free listing data are also intrinsically “personal and egocentric” (Quinlan 2005: 202), wherein each free list is influenced by an individual’s personal experiences, thus making broad generalizations from a single free list difficult. What is more, free listing data also require some ethnographic knowledge of the topic at hand, as different participants will often free list synonyms of the same concepts (e.g., “beer” and “suds”; “alcohol” and “booze”). It is up to the researcher to code the data, taking into account that sometimes apparent synonyms have different meanings (Borgatti 1999; Fleisher and Harrington 1998). For these reasons, free listing is best used in conjunction with other qualitative techniques, such as in-depth interviews, or as a stepping stone for more detailed quantitative analyses, such as cultural domain analysis (Borgatti 1994), cultural consensus analysis (Romney, Weller, and Batchelder 1986), and cultural consonance analysis (Dressler et al. 2005).
It remains a point of contention among cognitive anthropologists whether free list data constitute cultural consensus data or not. Whereas some scholars argue that free lists constitute a measure of cultural knowledge, thus being amenable to cultural consensus analyses (Borgatti 1994; De Munck 2009; Schrauf and Sanchez 2008), other anthropologists sustain the inverse. For instance, Weller (2007) argues that free list data should be used only as an elicitation procedure of cultural domains on which further cultural consensus analysis (i.e., consensus questionnaires) can then be made, following procedures outlined earlier by Weller and Romney (1988).
Free listing has been used to study a variety of topics, from types of illnesses (Weller 1983) to prison inmates’ perceptions of quality of life (Fleisher and Harrington 1998). Seminal articles are Bousfield (1953), Gatewood (1984), Henley (1969), Romney and D’Andrade (1964), and Trotter (1981). More recently, it has been used extensively to look at intra- and intercultural variations of cognitive knowledge concerning health and illness (Fiks et al., forthcoming; Schrauf and Sanchez 2004, 2008). In the past decade alone, hundreds of articles have been published that have used free listing as a research technique, with particular emphasis in the fields of cognitive anthropology (e.g., Winkler-Rhoades et al. 2010), medicine (e.g., Regis et al. 2011), ethnobotany (e.g., Hopkins 2011), and linguistics (e.g., Alvarado and Jameson, forthcoming).
Free listing is particularly useful when the researcher seeks to understand certain social experiences or phenomena through the eyes of those who participate in it, in what is otherwise known as the experiential or phenomenological approach to the study of social phenomena (Husserl 1931; for a review of phenomenology as a research approach, see Creswell 1998). Beginning with Cohen’s seminal article in 1979, there have been several important phenomenological studies of tourism, which have emphasized tourists’ lived experiences (Jamal and Hollinshead 2001; Li 2000; Mannell and Iso-Ahola 1987; Uriely, Yonay, and Dalit 2002). Moreover, the use of phenomenology in tourism studies has known a vigorous resurgence in recent years (e.g., Santos and Yan 2010; Szarycz 2008; Tung and Ritchie, forthcoming; for a critical review of the use of phenomenology in tourism studies, see Pernecky and Jamal 2010).
Nonetheless, and in spite of numerous advantages of using emic methods of data collection—such as free listing—when conducting phenomenological inquiry (Bernard 2006), one is hard pressed to find examples of the use of free listing in tourism research. Moreover, we can only conjecture as to why, given the prevalent use of free listing in other social sciences, the technique is virtually unknown to tourism scholars. Perhaps because the qualitative nature of the free listing data collection process is unappealing to more statistically minded researchers, or because the quantitative analysis needed to make sense of free list data puts off more qualitative-inclined scholars, or perhaps because of a lack of familiarity with the cognitive anthropology literature, few tourism studies have used free listing as data-gathering tool. To my knowledge, only two studies have used free listing within the context of tourism research (Blangy, McGinley, and Chevalier 2008; Thermil and Sheaffer 2004). This gap in the tourism literature is worthy of exploration.
In the present article, I report on the use of free listing as applied to a particular tourism experience popular in North America, Spring Break (SB). This annual spring migration of millions of undergraduate students from the United States and Canada toward warm and sunny locales such as Panama City Beach, Florida, and Cancun, Mexico, has captured the imagination of many, and an increasing number of tourism scholars have devoted their attention to this phenomenon (e.g., Apostolopoulos, Sönmez, and Yu 2002; Josiam et al. 1998; Josiam, Smeaton, and Christine 1999; Litvin 2009; Ribeiro and Yarnal 2008; Sönmez et al. 2006).
The Spring Break Experience
Existing SB research has focused mainly on spring breakers’ behavior and motivations, which have both been equated with extreme types of activities, such as binge drinking, casual and unprotected sex, and drug-taking (e.g., Apostolopoulos, Sönmez, and Yu 2002; Maticka-Tyndale, Herold, and Mewhinney 1998; Ribeiro and Yarnal 2008; Smeaton, Josiam, and Dietrich 1998). Extensive media interest and coverage of extreme types of SB behavior has reinforced and perpetuated the notion of SB as a “Spring Bacchanal” (Marsh 2006). Media outlets such as Music Television (MTV) have sustained the image of SB as a rite of passage, contributing to the formation of an SB stereotype, revolving around the notion of “tiny bikinis, sweaty muscles, and beer” (Russell 2004: 303).
Most of the extant SB research lends support to Maticka-Tyndale, Herold, and Mewhinney’s (1998) assertion that SB constitutes a particular case of situational disinhibition (Eiser and Ford 1995). Some tourism scholars contend that the peculiar nature of the SB experience is conducive to an environment wherein “the usual rules and moral codes do not apply” (Maticka-Tyndale, Herold, and Mewhinney 1998: 262). In such environment, behaviors such as binge drinking, casual sex and, to a lesser extent, drug-taking, are not only more easily accepted by spring breakers, but constitute normative behavior. Such behavior is then highlighted and propagated by the media, which in turn influences the would-be spring breakers’ perceptions of the SB experience (Apostolopoulos, Sönmez, and Yu 2002; Bai et al. 2004; Lee, Maggs, and Rankin 2006; Maticka-Tyndale, Herold, and Mewhinney 1998; Ribeiro and Yarnal 2008; Smeaton, Josiam, and Dietrich 1998; Sönmez et al. 2006).
More recent studies, however, suggest that this one-size-fits-all view of SB may not be entirely accurate, and that a wider range of SB experiences exists. For example, a number of scholars (Cronin 1996; Lee, Maggs, and Rankin 2006; Litvin 2009; Ribeiro and Yarnal 2008) found little difference between on campus (pre and post-SB) and SB patterns of alcohol consumption. Factors such as gender, fraternity/sorority membership, year in school, travel motivations, and personal and religious beliefs were also found to affect the extent to which participation in the SB experience was corresponded with the aforementioned SB stereotype (Grekin, Sher, and Krull 2007; Josiam et al. 1998; Lee, Maggs, and Rankin 2006; Maticka-Tyndale and Herold 1999; Mattila et al. 2001; Sönmez et al. 2006).
Moreover, whereas earlier research (e.g., Maticka-Tyndale, Herold, and Mewhinney 1998) pointed toward the notion of SB as a liminal experience (from the Latin lìmen, meaning threshold, i.e., a time/space outside ordinary being and experience, implying a reversal of social roles and rules, and often heralding a new status for those who had experienced it—see Turner 1969), more recent studies have challenged this assumption, arguing instead that SB is but an exacerbated continuation of practices that undergraduates already engage in during the rest of the school year (Litvin 2009; Ribeiro and Yarnal 2008). Thus, existing research on SB should be evaluated with care, and tourism scholars with an interest in SB would do well to consider that for many North American undergraduates, participation in the SB experience is not necessarily synonymous with “tiny bikinis, sweaty muscles, and beer” (Russell 2004: 303).
Lastly, in spite of a burgeoning body of literature on this travel phenomenon, few studies have looked at SB from the spring breakers’ perspective. Examples of the latter are Gale and Beeftink’s (2005) discussion of research epistemologies using SB as a case study, Klenosky’s (2002) means–end analysis of SB destinations, Mewhinney’s pioneering work on the sexual attitudes of spring breakers (Mewhinney, Herold, and Maticka-Tyndale 1995; see also Maticka-Tyndale and Herold 1997; Maticka-Tyndale, Herold, and Mewhinney 1998; Maticka-Tyndale and Herold 1999), Litvin’s (2009) mixed methods study of SB, and Ribeiro’s (2008; see also Ribeiro and Yarnal 2008) phenomenological account of SB. Not only are more qualitative studies of SB needed, with the intent of providing a greater level of detail and meaning in regard to spring breakers’ individual experiences, but SB data obtained via different methods should be sought and comparatively analyzed, if the SB experience is to be understood in all its complexity. SB thus lends itself to an ideal setting in which emic techniques of data collection such as free listing can be utilized, with benefits not only for the study of new research methodologies in tourism research but also toward a better understanding of the SB experience.
The present study sought to investigate the potential of free listing as a valid tool of inquiry for tourism research using SB as a case study, by analyzing cognitive perceptions of the SB experience, measured both before and after participation in SB by free list outputs (a procedure I dubbed “concomitant free listing”), within the context of self-reported accounts of the SB experience.
Methods
The data presented in this article are part of a larger study that consisted of a phenomenological account of the SB travel experience from the point of view of undergraduate freshmen (Ribeiro 2008). In the spring of 2007, two sets of free lists were obtained from a convenience sample of 14 undergraduate students (8 females, 6 males; 13 freshmen, 1 senior) from a large Mid-Atlantic university, known for its “party reputation.” Participants received monetary compensation for participating in the study ($20.00 per interview, for a total of $40.00). Time, bureaucratic, and financial constraints did not allow for random sampling procedures or a larger sample size but the number of participants in this study is nonetheless consistent with standard practices in both in-depth interviewing and free listing, which point toward a minimum of 10 participants (e.g., Guest, Bunce, and Johnson 2006; De Munck 2009). Based on existing SB research and extant literature on young people’s vacation behavior (e.g., Gledhill-Hoyt et al. 2000; Maticka-Tyndale, Herold, and Mewhinney 1998; Wechsler et al. 2000), only freshmen were selected, as it was hypothesized that the intensity of the SB experience would be greater for first-year college students. Additionally, one senior going on his first SB experience was also selected, in order to investigate if any major discrepancies arose between the senior and the freshmen’s first SB experiences. Participant demographics and respective SB destinations can be found in Table 1.
Participants’ Demographics and Spring Break Destinations
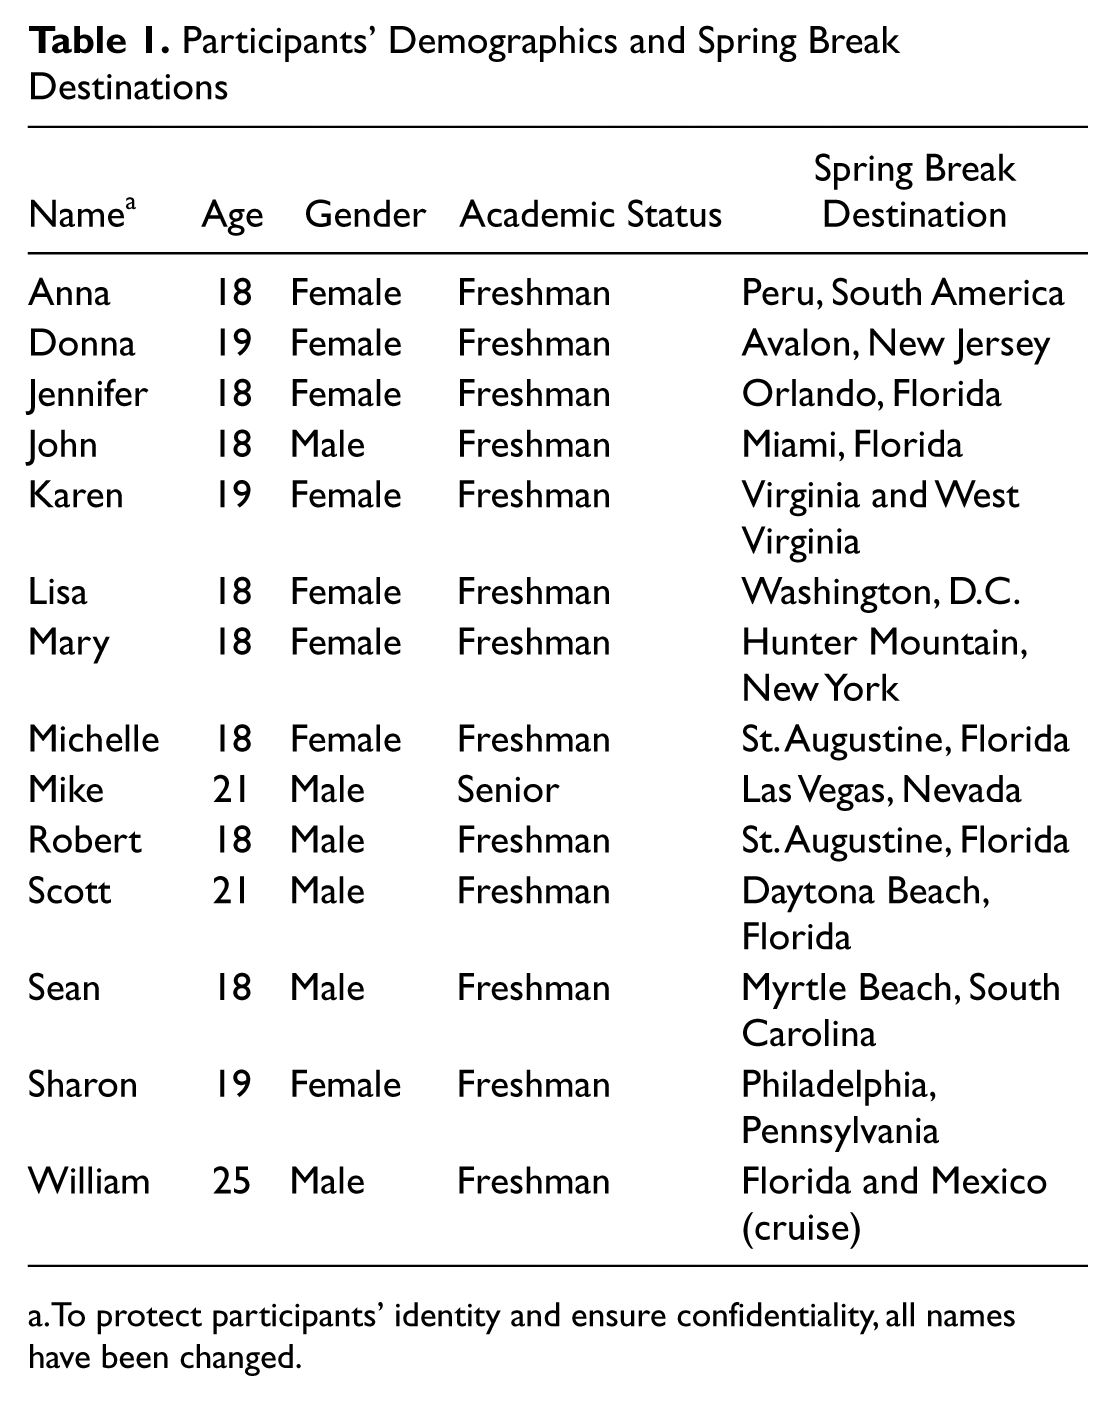
To protect participants’ identity and ensure confidentiality, all names have been changed.
Free lists were obtained in the context of in-depth interviews (each lasting from one to three hours), conducted both before and after SB. At the beginning of each interview, participants were given a blank sheet of paper and a pencil and asked to “Please list all the words and/or expressions that come to your mind when hearing the expression ‘spring break.’” The free listing prompt varied slightly after SB: the participants were then prompted with “Now that you have been on spring break, please list all the words and/or expressions that come to your mind when hearing the expression ‘spring break’” (my emphasis). No time limit was given for this task. Participants were repeatedly prompted to list more items, and each free list item was discussed in turn and used to prompt other items (Ryan, Nolan, and Yoder 2000). The first set of 14 free lists was obtained two weeks before participants were due to leave for SB and the second set of 14 free lists was obtained one week after students returned from their SB vacation, in order to capture the overall feeling of excitement that precedes and follows the SB experience, following existing research on this topic (Wirtz et al. 2003).
I labeled this procedure of obtaining repeated diachronic free lists from the same sample “concomitant free listing,” to distinguish it from “successive free listing” (i.e., soliciting free lists from different samples within the same population—Ryan, Nolan, and Yoder 2000). Items were coded following basic free listing procedures (Smith 1993), and two separate data sets (one for each set of free lists) were converted into matrix form (itemXinformant matrices where each cell corresponds to the position of each free listed item within the free list, e.g., 0 = not mentioned, 1 = first, 2 = second, etc.) using the statistical software program ANTHROPAC version 4.983/X (Borgatti 1996).
Data Analysis
Descriptive statistics and paired samples t-tests were used to analyze frequency distribution of free list items and compare free list length, mean saliency, and mean item position within free lists. Pearson correlations were calculated to gauge the correspondence between the two sets of free lists according to the same variables. Item saliency was computed using Smith’s S (Smith and Borgatti 1998; corrected by Sutrop 2001). This measure of saliency is given by the formula S = F / (N mP), where F is the frequency with which a given term is mentioned, N is the sample size (i.e., number of participants), and mP is the mean position of an item. The aforementioned ANTHROPAC itemXinformant matrices were exported to an Excel spreadsheet that was then used to calculate Smith’s S following analogous procedures to those described by Smith (1993).
Visual representation of free list data was obtained via metric multidimensional scaling (MMDS; Borg and Groenen 2005, Kruskal and Wish 1978), a widely used technique to display free list data (e.g., Borgatti 1996; Harman 2001; Gravlee 2005). Shortened versions of the ANTHROPAC itemXinformant matrices, containing only the most salient items, were recoded and transformed into dyadic itemXinformant matrices in Excel, with each cell coded either as 1 (when a participant mentioned a given item in her free list) or as a 0 (when she did not). The recoded matrices were then transformed into itemXitem matrices using the “Similarities” function in UCINET version 6.288 (Borgatti, Everett, and Freeman 2002). Successive MMDS representations were generated in UCINET until acceptable stress values were achieved and the resulting model(s) made sense to the researcher in light of the participants’ descriptions of their respective SB experiences.
It should be noted that the itemXitem matrices used to generate the MMDS representations are not, strictu sensu, similarity data (Weller 2007). Following the aforementioned debate among cognitive anthropologists concerning the use of free listing data to generate cultural consensus models (cf. Borgatti 1996; Weller 2007), the MMDS data presented in this article should not be viewed as similarity data (i.e., items clustered together do not represent similar items—e.g., “sand” and “alcohol”; Figure 2A) but rather as proximity data. That is, items clustered together in the MMDS representations should be viewed as items that participants tend to mention together and consequently associate with one another. Cluster stability was analyzed subjectively by the researcher, who according to free listing procedures is left to interpret the (dis)similarities between clusters of free list data in each MMDS representation (Schrauf and Sanchez 2004, 2008). Thus, whether or not such items are similar to one another is a matter of interpretation, not an assumption of the model. Moreover, given that MMDS was used (as opposed to nonmetric MDS), the location of the points as well as the distance between them in two- and three-dimensional Euclidean space were calculated following a process known as stress majorization, which aims at increasing the goodness of fit of the model (Borg and Groenen 2005). UCINET performs this process automatically (Borgatti, Everett, and Freeman 2002).
Lastly, interpretation of results was done based on the context of the participants’ descriptions of their SB experiences and their perceptions of the SB phenomenon. While space constraints precluded the use of extensive quotes from participants, nonetheless some were used in the discussion section to illustrate particular points the researcher thought to be of relevance.
Results
Frequency Distribution and Free List Length
The first set of free lists (obtained before SB) contained 77 different items. Of those, only twenty-four (31%) were mentioned by more than one participant. The second set of free lists (obtained after SB) contained 90 different items (an increase of 19%). Twenty-three (26%) items were mentioned by more than one participant in the second set of free lists. There was little variance in the most commonly free listed items from one set of free lists to the other. For example, the 20 most commonly free listed items before SB were, in decreasing order of frequency, beach, friends, warm weather, tan, sun, fun, party, Florida, no school, alcohol, MTV, girls, relax, bars, bikinis, Mexico, family, crazy, travel, and expensive, whereas the 20 most commonly free listed items after SB were, also in decreasing order, friends, beach, relax, warm weather, fun, sun, girls, alcohol, new people, family, sleep, clubs, bars, laughing, bikinis, sand, expensive, tan, and sunburn. The frequency distribution of both sets of free lists followed very similar patterns, as can be seen in Figure 1.
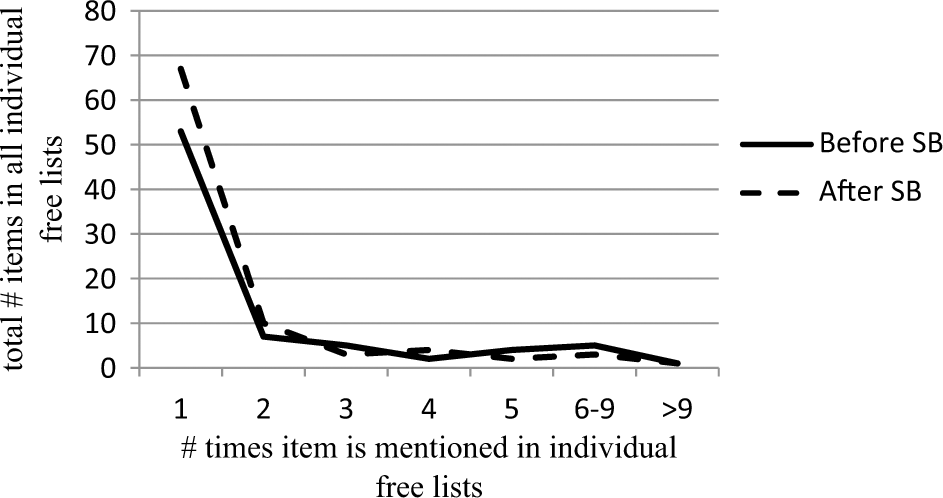
Frequency distribution of free list items
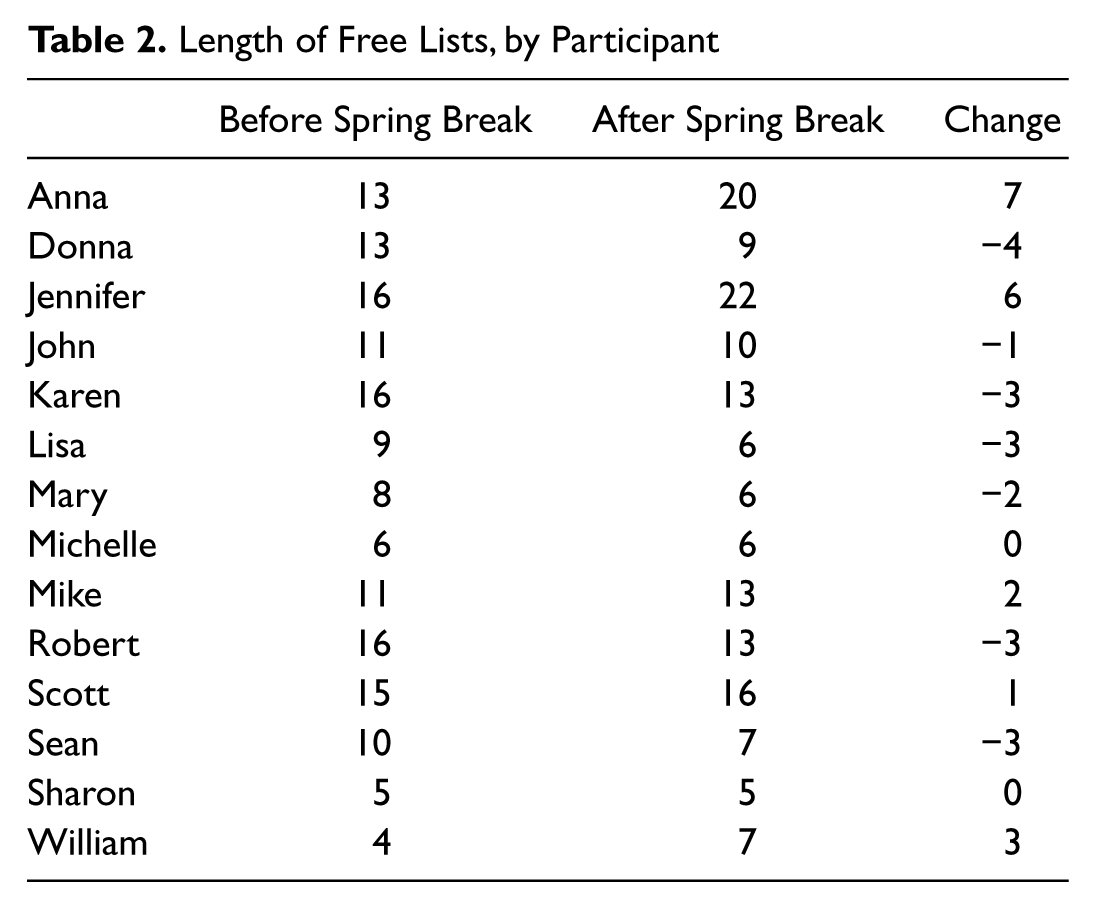
The length of each individual free list (i.e., the number of items mentioned by each participant) did not suffer significant changes, as Table 2 shows. Five (36%) participants listed more items after SB than before, seven (50%) listed fewer items, and two (14%) participants listed exactly the same number of items on both free lists. There was no significant difference of free list length between the first set of free lists produced by participants (Before SB, M = 10.93, SD = 3.14) and the second set of free lists (After SB, M = 10.93, SD = 5.46): t(13) = 0.00, p (two-tailed) = 1.00. Conversely, both sets of free lists were fairly highly correlated with one another in regard to list length: r(12) = .77, p < .01.
Length of Free Lists, by Participant
Item Saliency
The most salient items of both sets of free lists (Before SB, n = 24, M Saliency = .0577; and After SB, n = 23, M Saliency = .0505) mentioned by more than two participants, sorted by saliency, can be found in Table 3.
Most Salient Items, Mentioned by More Than Two Participants, Sorted by Saliency

Table 3 shows a great deal of overlap between both sets of free lists: seventeen items were free listed by participants both before (71%) and after (74%) SB. What is more, there were also visible similarities in regard to the most salient items mentioned by participants. For instance, the ten most salient items from the first set of free lists (before SB) were, in decreasing order of importance, warm weather, friends, beach, girls, alcohol, sun, fun, crazy, relax, and party; the ten most salient items from the second set of free lists (after SB) were, in the same order, beach, friends, relax, warm weather, fun, sun, girls, expensive, bars, and party. While some items retained their relative saliency from one free list to the other (e.g., friends, sun, party, no school), others did not (e.g., relax, girls, expensive, alcohol). It is also interesting to note which items appear in one set of free lists but not in the other (e.g., MTV, Mexico, Florida, sunburn, dancing, laughing).
In regard to the items that were mentioned in both sets of free lists, there was no significant difference in the mean position of each item free listed before SB (M = 6.08, SD = 2.25) and after SB (M = 6.33, SD = 2.86): t(16) = −0.38, p (two-tailed) = .71. Nevertheless, overall the first set of free lists produced by participants (Before SB, M = 0.0596, SD = 0.0403) was significantly different from the second set of free lists (After SB, M = 0.0505, SD = 0.0475) in regard to mean saliency values of items mentioned by more than two participants: t(22) = 3.25, p (two-tailed) <.01. Interestingly, the mean saliency values from both free lists were highly correlated with one another: r(21) = .97, p < .01.
Visualizing Aggregate Free Lists
A two-dimensional MMDS representation of the aggregate free list items contained in Table 3 revealed unacceptable stress values (0.294 Before SB, 0.255 After SB), pointing toward the existence of other underlying dimension(s) in the data. Three-dimensional MMDS representations yielded better stress values (0.174 Before SB, 0.142 After SB), whereas the inclusion of a fourth dimension, while increasing goodness of fit, made the model too complex for analysis. Because three-dimensional representations are notoriously difficult to portray on two-dimensional space (paper), the MMDS data are presented as successive iterations of all the possible combinations between two dimensions (dimension 1 vs. dimension 2, dimension 1 vs. dimension 3, and so forth). Allowing for two possible positions for each dimension (along the x axis and along the y axis) resulted in a total of six MMDS representations for each set of aggregate free lists (Before SB and After SB), which are displayed in Figures 2 and 3.
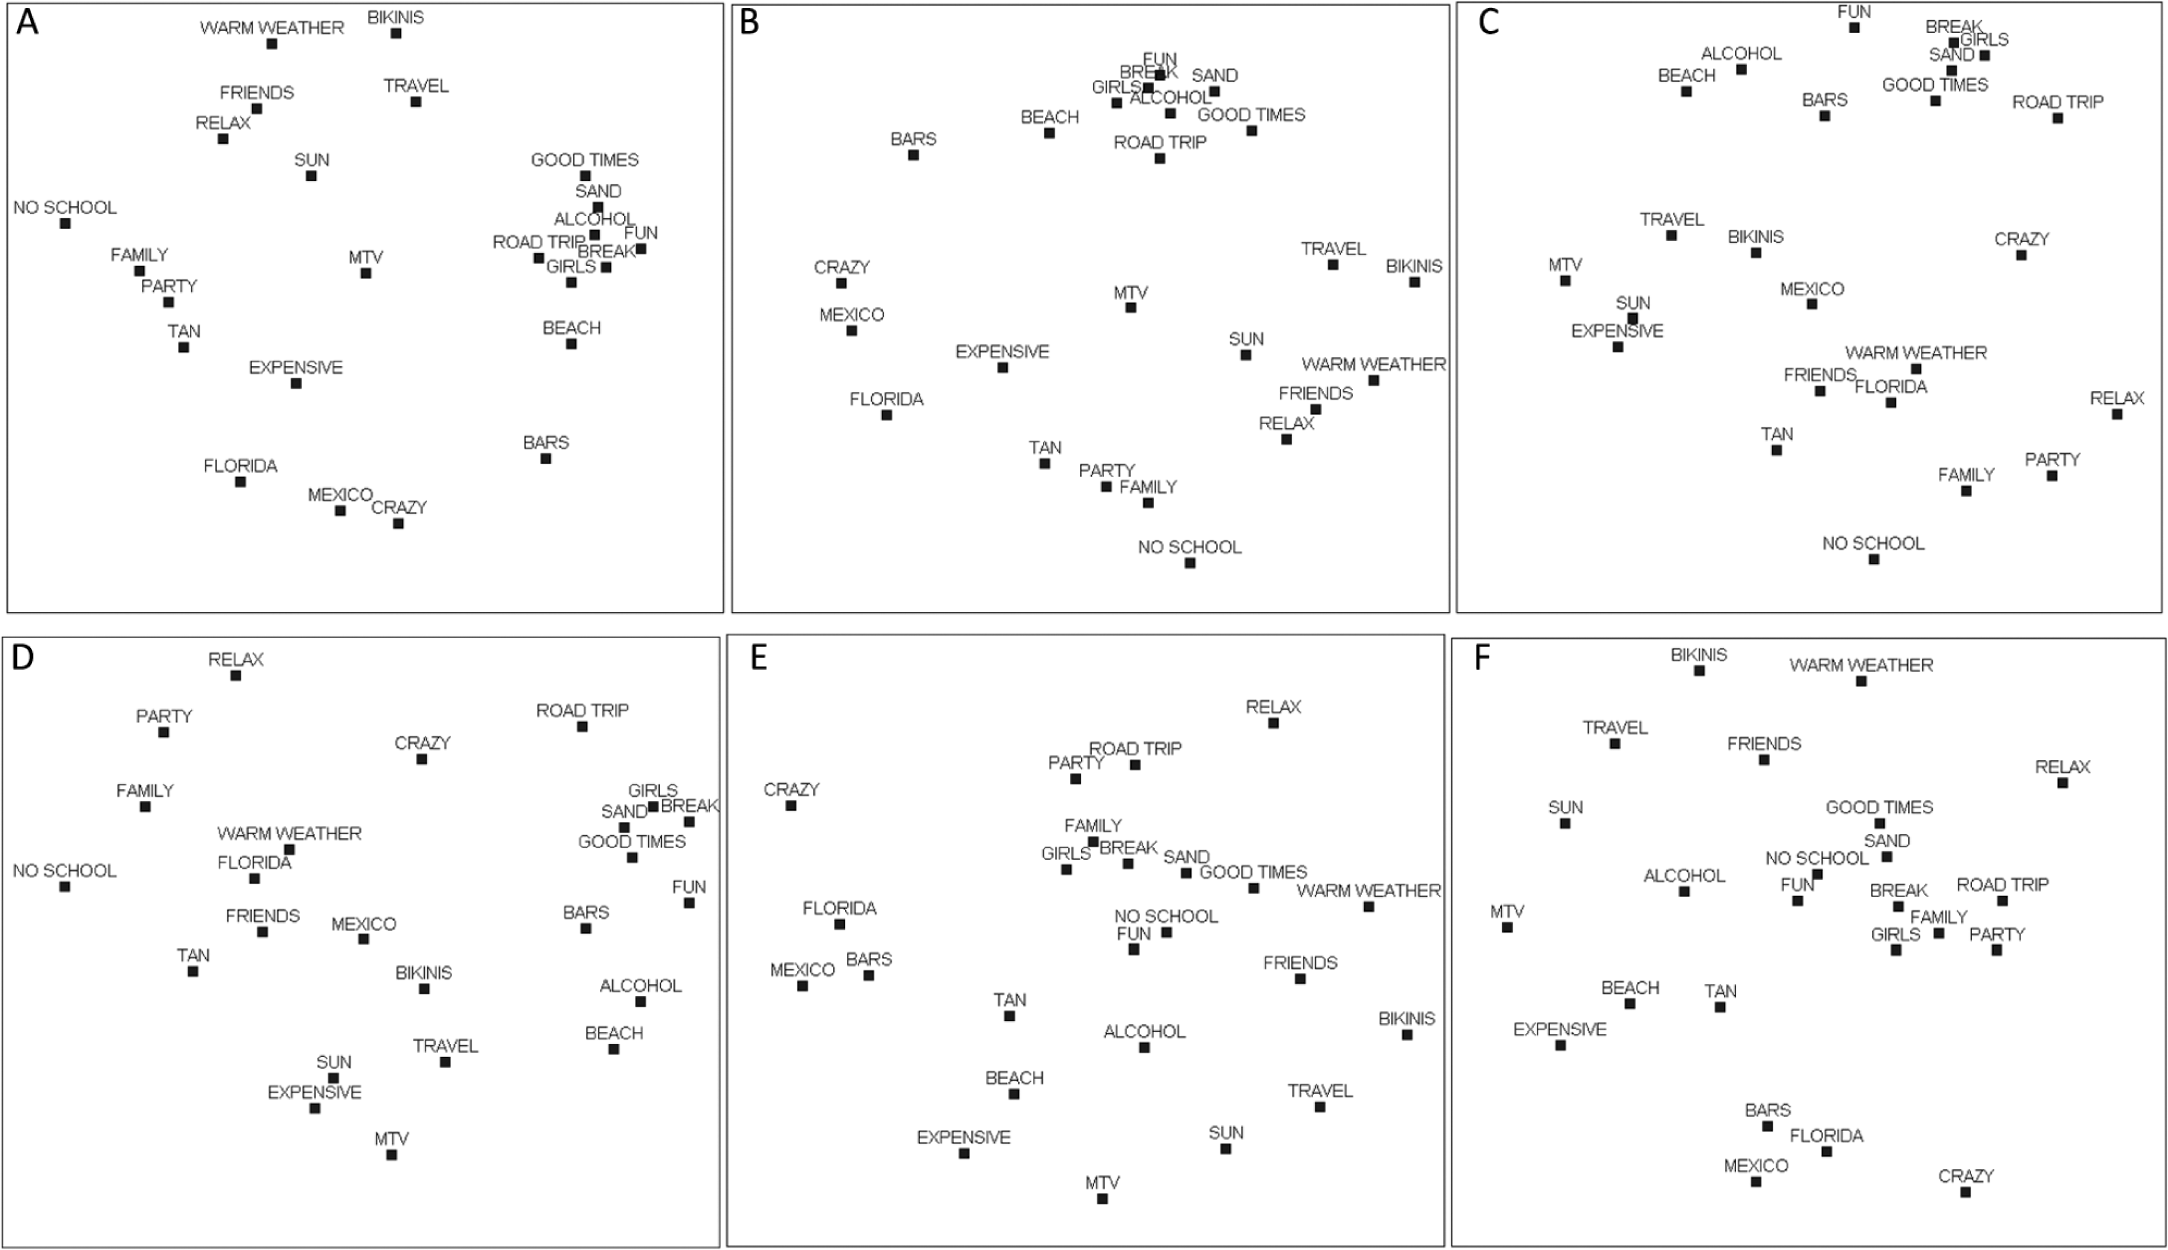
Metric multidimensional scaling plots of free list items—before spring break
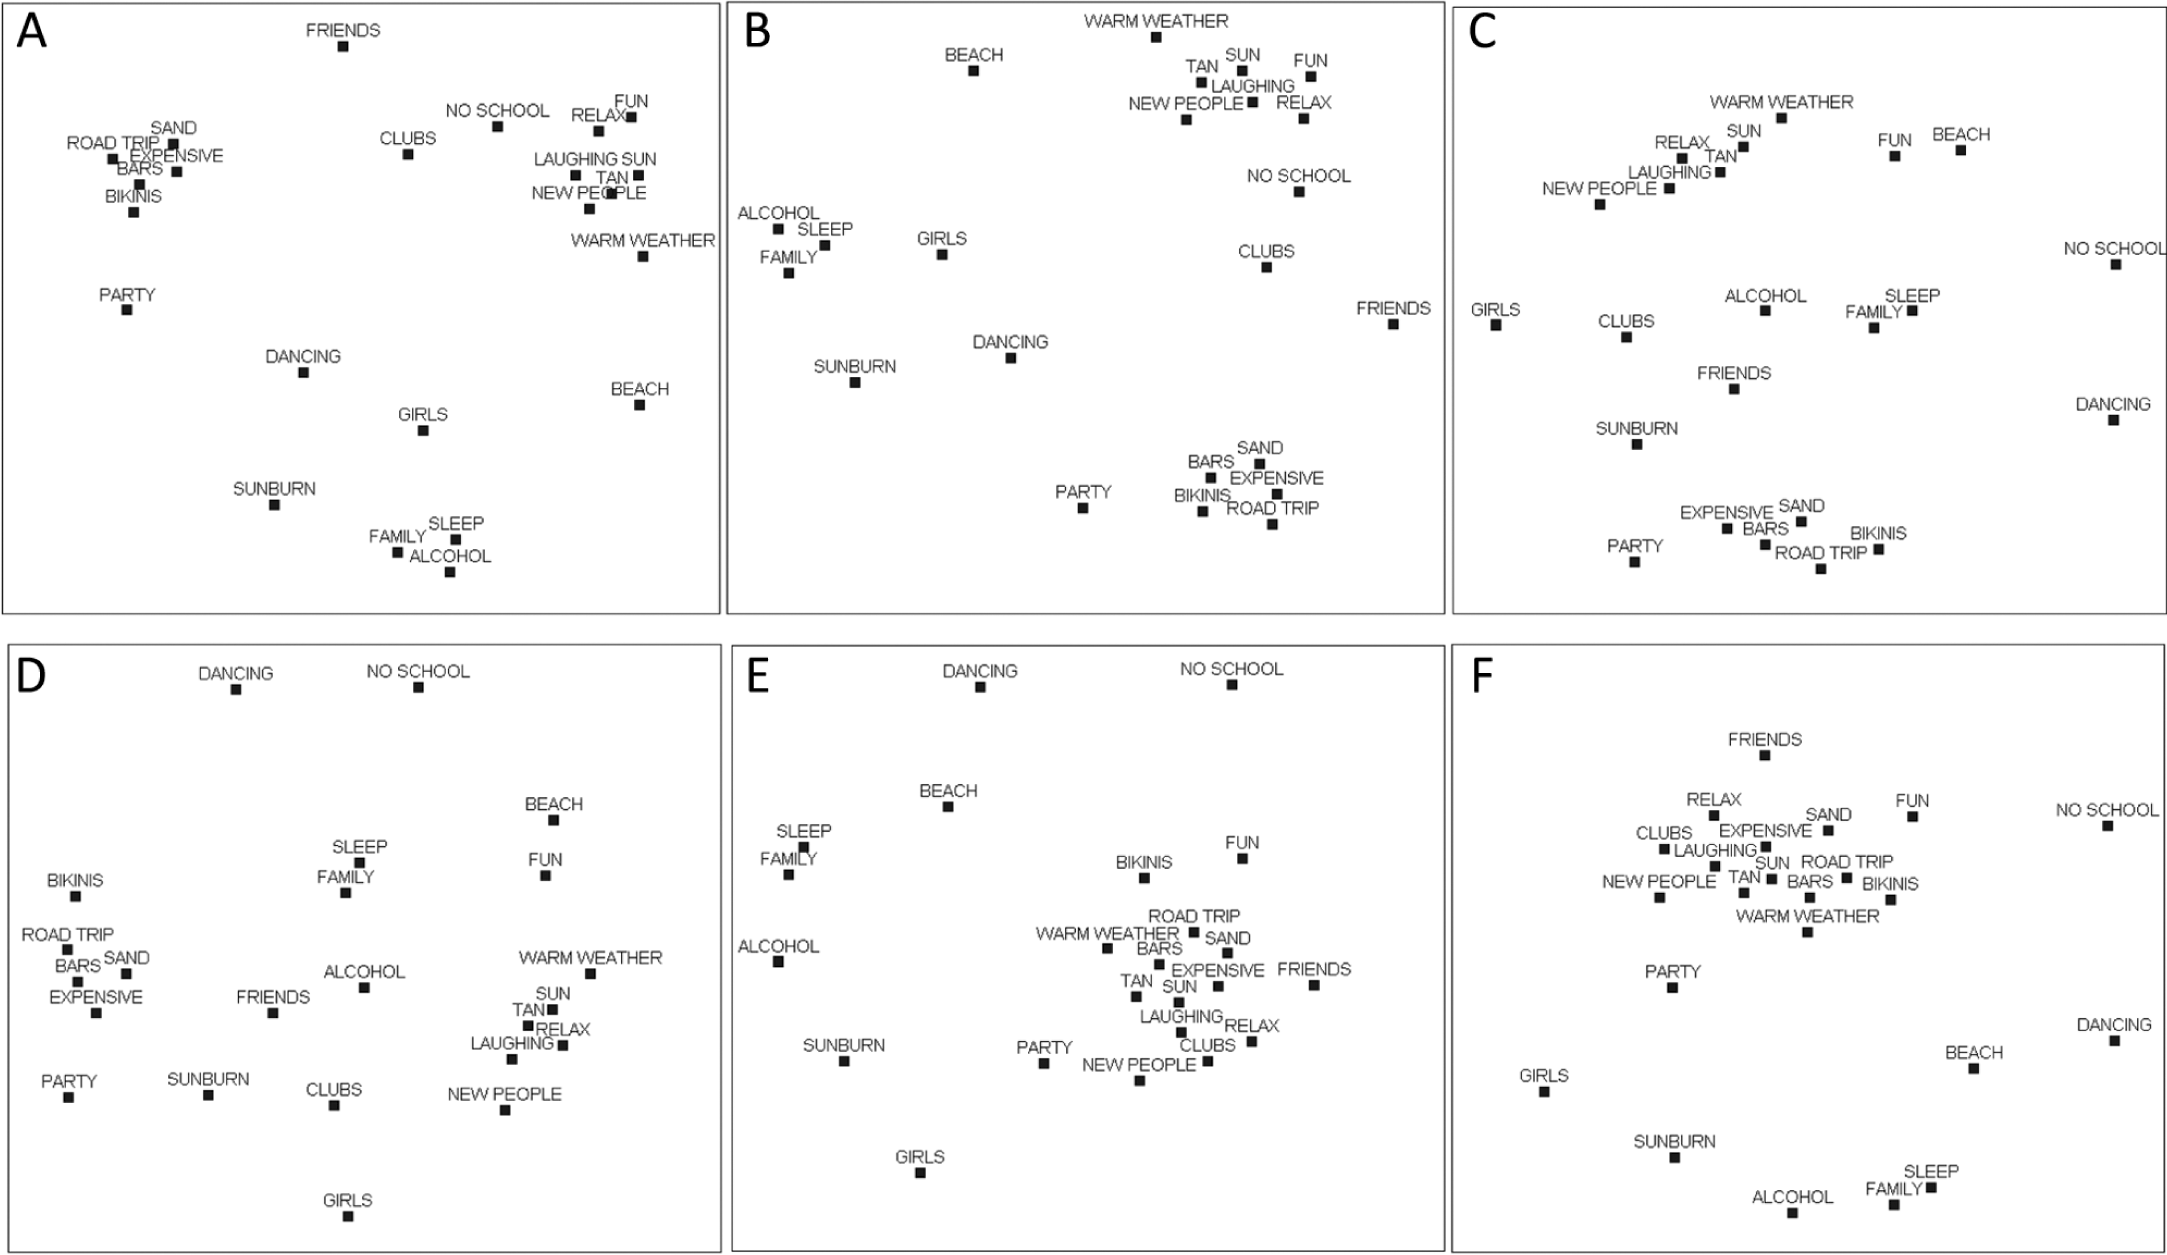
Metric multidimensional scaling plots of free list items—after spring break
Figure 2 shows a number of clusters of free list items which were consistent among all three dimensions. For instance, participants tended to group no school, family, party, and tan together; Florida, Mexico, bars, and crazy together; and good times, sand, alcohol, break, road trip, girls, and fun together. Other items, such as MTV, bikinis, sun, and expensive, had less stable positions across the different MMDS representations.
The three dimensions underlying the spatial representation of the free list items in Figure 3 appear to be related to the environment where SB activities occur (dimension 1), intensity of SB activities (dimension 2), and the SB stereotype (dimension 3). For example, Figures 2A and 2D show a clear distinction of SB activities that occur in a home environment (e.g., no school, family, party) on the left, and SB activities that occur when spring breakers travel outside their home environment (e.g., road trip, fun, good times). Figures 2B and 2E indicate that SB items related to more intense behaviors (e.g., crazy, Florida, Mexico, bars) are located on the left, whereas more “relaxing” activities tend to be grouped in the right quadrants (e.g., relax, friends, good times). Figures 2C and2F indicate the prevalence of an external influence on participants’ perceptions of SB, which I dubbed the SB stereotype: items more in tune with the MTV-type SB vacation (e.g., MTV, bikinis, beach, alcohol) tend to be grouped in the upper left quadrants and nonstereotypical SB activities (e.g., family, party, relax) in the lower right quadrants.
The MMDS representation of free list items obtained after SB in Figure 3 evidences clusters of items similar to the ones identified in the MMDS representation of items free listed after SB. After SB, participants tended to group sand, road trip, expensive, bars, and bikinis together; warm weather, sun, tan, relax, new people, and laughing together; and alcohol, family, and sleep together. Other items, such as girls, clubs, sunburn, and no school, for instance, appear to have a more idiosyncratic meaning for spring breakers and consequently appear in the MMDS representation as outliers.
The underlying dimensions of the MMDS representations displayed in Figure 3 (after SB) are also similar to the ones displayed in Figure 2 (before SB), albeit in a different order. For example, dimension 2 appears to be related to the environment where SB activities occur, with activities such as sleep, family, and alcohol occurring in the “home” environment and friends, clubs, new people, fun, and so forth taking place outside the home environment (Figures 3B and 3E). Dimension 3 is related to the intensity/consequences of the SB experience: activities such as no school, dancing, sleep, and family (portrayed in the right quadrants of Figures 3C and 3F) are not perceived by spring breakers as intense/ consequential as girls, party, new people, and sunburn, for instance (left quadrants in Figures 3C and 3F). Lastly, dimension 1 also seems related to the SB stereotype (dimension 3 in Figure 2), but participation in the SB experience appears to have introduced an added level of complexity to this dimension. Figures 3A and 3D (left to right) show a dichotomy between the stereotypical SB (e.g., bikinis, bars, sand, road trip, party) and the participants’ revised perceptions of SB (e.g., warm weather, sun, tan, relax, laughing), punctuated by their own SB experiences (e.g., sleep, family, alcohol, clubs, friends).
Discussion
The findings of this study suggest that a cohesive cultural domain concerning SB exists and that it was shared by the participants in this study. The analysis of the free listing data showed that participants’ cognitive representations of SB were consonant with the “Spring Bacchanal” stereotype of SB, and represented by words such as beach, girls, alcohol, party, fun, sun, bikinis, and so forth. These results support SB research that has highlighted spring breakers’ extreme behavior (e.g., Apostolopoulos, Sönmez, and Yu 2002; Josiam et al. 1998; Maticka-Tyndale and Herold 1997, 1999), and further validate Gerlach’s (1989: 15) claim that at least in their minds, spring breakers want nothing more than “to escape from the drudgeries of school and from the cold ( . . . ) by seeking sun, booze, members of the opposite sex, and other activities.” The findings from the analysis of free list data are corroborated by the participants’ own descriptions of what comes to their minds when they think about SB:
When I think about it, I always think about having a lot of fun, not being supervised at all, going crazy. (Jennifer, 18) I think about MTV Spring Break, there’s like a bunch of people on the beach, and stuff like that. (Michelle, 18) When you think of Spring Break, I always have these pictures of MTV since when I was little, you’d see all the crazy people out there in their bikinis in their beach parties. (Anna, 18) I have no idea. I think it’s . . . if you ask any of my friends, why are you going? Girls and booze, number one reason. (John, 18)
It is interesting to note that participants attribute the origin of such SB images to the media, especially MTV. Participants stressed the appeal and the impact of MTV’s annual SB broadcast (MTV Spring Break) on their image of SB:
MTV has a Spring Break where they party the whole time on the beach and that’s all, you don’t see anyone standing around, that’s all, they’re drinking, getting crazy . . . you see Spring Break on MTV, you see the girls going crazy, the guys like “Yeah!” (Sean, 18)
On the other hand, results from this study also revealed a complexity of the SB phenomenon that goes beyond the MTV-like SB stereotype of “crazy people out there in their bikinis in their beach parties.” The fact that items such as “friends,” “family,” “relax,” “break,” and “laughing” were frequently free listed by participants, and often ranked higher in terms of cognitive saliency than other more stereotypical SB-related items (see Table 3), suggests that while an overall cohesive cognitive representation of SB exists and is shared by spring breakers, such representation is not composed exclusively of “stereotypical” SB items. Analysis of the MMDS data and its underlying dimensions (space, intensity, and stereotypes) further highlighted the complexity of SB, as evidenced by participants’ cognitive representations of this travel phenomenon.
For the participants in this study, perceptions of the SB experience were shaped not only by the media-driven SB stereotype but also by the space where SB activities occur, and by the intensity of the SB experience itself, as the different clusters in the MMDS representations (before and after SB) show. The interplay between these three dimensions thus contributes to the complexity of the SB phenomenon and provides evidence that rejects the one-size-fits-all notion of SB propagated by the media (Marsh 2006) discussed above.
It is also likely that personal characteristics, such as attitudes, beliefs, personal experiences, and other personality traits, contribute to the formation of personal cognitive representations of SB, as evidenced by the frequency distribution of the most salient free list items (Table 3 and Figure 1). A testament to the influence of personality on the participants’ SB experiences was the fact that almost half of them chose to spend part or the entirety of this vacation period with their families and old friends, motivated by pangs of guilt for not having seen them in so long, as the following quote illustrates:
I really wanted to see my family. I would feel like I’m cheating them [if I didn’t go see them over Spring Break]. (Sharon, 19)
These findings echo those reported by Mattila et al. (2001) and Sönmez et al. (2006), who found that personal and religious beliefs, attitudes, and expectations were paramount in the shaping of the SB experience for undergraduates.
The results of the present study are all the more interesting when put in the context of the participants’ own SB experiences. The SB activities most commonly mentioned by the participants in this study were as diverse as spending time with family and friends, sleeping late, working (not schoolwork), going out at night, surfing, going out for dinner, and relaxing and hanging out with old friends and new acquaintances. The common denominator to all these experiences was the overall atmosphere of relaxation and perceived freedom that permeated the SB experience. Participants felt free of (school) work, duties, and responsibilities and, as one of the participants put it, felt that SB was “your one week out of an entire semester to be who you are, do whatever you want with no obligations” (Mary, 18). The following quotes illustrate the heterogeneous nature of the SB experiences of the participants in this study:
Well, we woke up probably around noon. . . . And we usually—the hotel had a café in there, so we usually got coffee or bagels they had. And then we’d go on the beach, but not for that long, like I said. And then we’d come back and usually just watch TV, take a nap. Every day we took a nap. And got ready, took a shower and all that stuff, and then went out to eat, and then after that we went to some parties. (Donna, 19) First of all I went back home, stayed there and visited my parents for three days, and then I left to Washington, D.C., and I have been there for five days, and then I came back to [campus] on Saturday. (Lisa, 18) I went to St. Augustine, Florida. Stayed at my friend’s apartment, who goes to Flagler College down there. And basically, surfed a lot, went out at night, went to the bars, which, they’re real lax with ID’s down there, so I used my friend’s who’s Puerto Rican and pretty dark. I used his ID and got into all the bars, so, that was interesting. First time I ever went to a bar. . . . That was fun. We had good waves. It’s just a good area down there. (Robert, 18)
After experiencing SB for themselves, participants recognized that their own SB experiences were very different from those advertised by MTV:
It gets a lot more publicity and . . . stuff like that. You always see commercials on MTV and other things like that that are just advertising. Come here to our spring break and they show a lot of young people going there where other vacations it could be like families. Like on cruise things they show families playing. It’s just different. (Jennifer, 18) You think it’s different whenever you watch it on TV. Like on MTV and all of that, they are in Cancun or wherever they are. There’s people doing the ridiculous games and stuff like that but once you get down there and start interacting with people, I think it’s a little bit different. We still had a great time and all of that but, it wasn’t like the craziness that it is on TV. I didn’t think it was, at least. (John, 18)
Therefore, perhaps the most striking finding of this study was the fact that cognitive representations of SB remained, for the participants in this study, virtually unchanged by participation in the SB experience. The statistical analysis of the free list data comprised in both sets of free lists (before and after SB) showed that there was no significant difference in regard to frequency distribution of free list items and length of free lists, which indicates that participants’ individual knowledge of SB did not suffer substantial changes with participation in the SB experience. Furthermore, while there were significant differences in regard to the mean saliency values of items mentioned by more than two participants, there was no significant difference in the mean position of each item free listed before and after SB. These results suggest that, while participation in the SB experience introduced some new variation to the participants’ cognitive understandings of what SB is, for the participants in this study their own SB experiences—even though they were at odds with the stereotypical SB vacation—were not sufficient to dethrone, or otherwise significantly alter, the media-propagated notion of SB as a “Spring Bacchanal.” The following quotes corroborate this hypothesis:
I don’t think the definition would change too much. I think it’d still be along the lines of you are off of school for a certain time and many people travel to places warm or some people travel colder and go. I’d still mention drinking, a bunch of college kids, basically going crazy and living with freedom for a little while. (Anna, 18) I would just say, it’s a blast . . . going to bars, drinking, having a good time, escaping. You don’t have to drink, of course, but escaping from the usual mundane college life. Going and drinking and laying on the beach and having fun. (William, 25)
Lastly, the results of this study point to a special case of cognitive dissonance (Festinger 1957) that warrants further research. For instance, the fact that no significant differences in free list length were found before and after SB, and the high correlation observed between both sets of free lists, suggest that participation in the SB experience did not alter significantly participants’ individual knowledge about SB. These findings stand in stark contrast with some previous SB research, which highlighted the transformative power of the SB experience (Josiam et al. 1998; Lee, Maggs, and Rankin 2006; Maticka-Tyndale and Herold 1997; Maticka-Tyndale, Herold, and Mewhinney 1998, Sönmez et al. 2006). Nonetheless, it is interesting to note that some free listed items did see their importance for participants (i.e., item saliency) change after SB: the significant difference found between both sets of free lists in regard to mean saliency implies that while the same elements/items may be present in the participants’ minds before and after SB, participation in the SB experience may lead to a reorganization of their relative importance.
What is more, the fact that participants’ perceptions of the SB phenomenon in general suffered virtually no alteration with participation in the SB experience suggests that the media may have been successful in creating a SB stereotype but that such stereotype and/or behavioral prescriptions and proscriptions do not necessarily translate into actual SB behavior (Litvin 2009; Ribeiro and Yarnal 2008), which has interesting implications for researchers and practitioners with an interest in destination marketing (e.g., destination marketing organizations [DMOs]).
Conclusions, Implications, and Directions for Future Research
This study introduced a common technique in cognitive anthropology—free listing—but less common in the tourism scholarship. Much can be learned from the use of free listing in tourism research, particularly in regard to emic perceptions of a given culture, as well as how cultural norms translate into actual behavior, which should be of value to tourism scholars, particularly those with an interest in tourism behavior. By virtue of its simplicity, low cost, and the richness of data it provides, free listing is a good complement to other methods in tourism studies such as in-depth interviews, participant observation, and other qualitative and mixed methodologies of inquiry, thus enriching the researcher’s and practitioner’s “research toolkit.”
The free listing data analyzed in this article also added to the bourgeoning body of SB research, contributing to dispel the myth of SB as nothing more than a “Spring Bacchanal.” Participants’ cognitive representations of SB vis-à-vis their own self-reported accounts of the SB experience indicate that the SB phenomenon may be more complex than what some previous scholars suggested and, given the nature of the sampling procedures used, they cannot be generalized to the broader population of American undergraduate students, these results suggest that a discrepancy between what spring breakers think SB is and their actual SB behavior exists.
The findings of this study are ultimately relevant not only for those with an interest in the SB phenomenon but particularly for scholars and practitioners who study issues of destination image, tourism representation, and tourism consumer behavior. For instance, as more and more U.S. coastal destinations make an effort to discard an unwanted SB image (Butts et al. 1996; Gianoulis 2000), they may find that social marketing campaigns will prove ineffective to change the image of “tiny bikinis, sweaty muscles, and beer.” The resilience of the MTV-like SB stereotype in the minds of undergraduate students, even in face of contradictory evidence, may prove too much of an obstacle for traditional destination (re)branding campaigns. It would be preferable to investigate how such an image is created in the first place, and how the SB stereotype achieves such cognitive predominance among undergraduates before embarking in costly social marketing campaigns that may not have the desired effect. Moreover, DMOs, when analyzing the perception(s) tourists have of their respective destinations, may wish to add free listing to their “arsenal” of qualitative research techniques (e.g., surveys, interviews, focus groups, Delphi technique). The inclusion of a simple free list prompt in a given destination impression survey (e.g., “Please list all the things that come to mind when you think about vacationing in _____”) can yield surprisingly rich data at a fraction of the cost of other methods.
It would be interesting to replicate the use of free listing with other populations/research sites, as well as attempt to minimize some of free listing’s limitations by increasing sample size and/or using probabilistic sampling procedures. Furthermore, free listing is likely to rise in popularity following the growing application of cognitive models to tourism research, namely, the cultural consensus model (e.g., Gatewood and Cameron 2009; Ribeiro and Chick 2009). Lastly, it would be of the utmost interest to investigate the cognitive-behavioral dichotomy highlighted in this study, especially in other tourism settings. The fact that what people say they do and what they actually do are often at odds with one another remains one of the most prevalent issues in the social sciences (Mills 1940) and the tourism setting appears to be an ideal arena in which to make substantial progress to mitigate it. The use of innovative and complementary methods of research is hopefully a step in the right direction.
Footnotes
Acknowledgements
The author wishes to thank Professor Robert W. Schrauf for his comments on an earlier draft of this article as well as the three anonymous reviewers’ insights in revising the manuscript.
Declaration of Conflicting Interests
The author(s) declared no potential conflicts of interest with respect to the research, authorship, and/or publication of this article.
Funding
The author(s) received no financial support for the research, authorship, and/or publication of this article.