
Abstract
The main purpose of this research is to investigate and estimate the spillover effects in inbound and domestic tourism flows to 341 cities in mainland China. In conjunction with this, the key determinants of tourism flows are also studied in the spatial econometric model. The results confirm the existence of spillover effects in both inbound and domestic tourism flows, and suggest that physical infrastructure factors, tourist attractions, and the SARS outbreak are significant determinants of inbound and domestic tourism flows. In addition, it is found that although the degree of openness to inbound tourists is important for inbound tourism flows, a city’s income is the key to enhancing domestic tourism flows. Significant differences in spillover effects and determinants of tourism flows are also discovered between cities in different regions.
Introduction
Spillover effects, a frequently referred economic term, include both positive and negative externalities resulting from economic activity or processes that affect any element not directly associated with the activity. In terms of tourism flows, the spillover effects are common as well, and this term refers to the indirect or unintentional effects that a region’s tourism industry exerts on tourism flows to other regions. As a result, regions can obtain benefits for local tourism development from their neighbors’ tourism growth through the positive spillover effects.
While some studies have highlighted the existence of spillover effects in tourism flows by nontourism scholars (Drakos and Kutan 2003; Gooroochurn and Hanley 2005; Neumayer 2004), their interpretations of spillover effects are vague and difficult to generalize to common cases. In addition, in the model of spillover effects, these studies failed to control for other factors influencing tourism flows, and hence their results were not persuasive or reliable. Therefore, more appropriate and accurate models are required to examine the spillover effects in tourism flows.
From a geographic perspective, the spillover effect in tourism flows can be regarded as a particular spatial interaction among destinations. In previous geographic studies of tourism flows, the adopted spatial interaction models only focused on the interaction between the origin and destination (Gil-Pareja, Llorca-Vivero, and Martínez-Serrano 2007; Khadaroo and Seetanah 2008; Um and Lee 1998; Yang and Wong forthcoming-a). Hitherto, no known studies have examined the spatial interaction between destinations. To fill this gap, the spillover effects in tourism flows between destinations are investigated in this research. More importantly, this research will provide a framework for the interpretation of these spillover effects and elaborate on potential factors contributing to these effects in tourism flows. As a result, it will contribute to the understanding of regional tourism growth and spatial interactions in tourism flows.
To our knowledge, this study represents one of the first attempts to apply spatial econometric models to analyze tourism flows. Since spillover effects may exist in tourism flows, traditional econometric models, which ignored these effects, yielded biased results. Previously documented models for spillover effects in tourism studies, such as the simultaneous equation model (SEM) and the seemingly unrelated equation model (SURE), are inappropriate for studies with large sample sizes. Thus, this study adopts the spatial econometric models to examine whether the spillover effects are significant. The coefficients estimated by these models are unbiased and efficient in the presence of spillover effects. Also, since other factors that may contribute to tourism flows are controlled for in the proposed model, the net effects of spillover can be exclusively examined.
Spillover Effects in Tourism Flows
Previous research has concentrated on spillover effects in tourism flows from certain perspectives. Using data from three Mediterranean countries—Greece, Israel, and Turkey—Drakos and Kutan (2003) discovered significant spatial spillover effects of terrorism on tourism market shares. In another paper by Neumayer (2004), the effect of political violence on tourism flows was investigated, and it was argued that the intraregional negative spillover effects in tourism flows were significant, triggered by events of political violence. Gooroochurn and Hanley (2005) investigated the spillover effects in long-haul visitors between the Republic of Ireland and Northern Ireland to assess the effect of joint promotion of the two destinations. The interconnection between the two regions’ long-haul tourism flows were investigated empirically through SURE models, and it was found that the spatial spillover effects were significant, albeit asymmetric.
There are several reasons why tourism flows to one geographic region are dependent on flows to other regions.
Productivity Spillover
The concept of productivity spillover was first used to examine the effect of technological externalities from multinational companies (MNCs) to host countries. It is argued that local firms gain the positive productivity spillover from foreign companies, which makes local firms more efficient (Caves 1996). The same is true for two neighboring tourism destinations (cities). The technical or productivity gap between them would result in the productivity spillover from the higher level to the lower level destination. We assume three main channels for the productivity spillover:
Labor movement
In China, the tourism industry is characterized by a high labor turnover rate (Gu, Kavanaugh, Yu, and Torres 2006). With less restriction on labor movement among regions, tourism employers, especially the youth, are likely to move between cities for better job opportunities (Zhang and Lam 2004). Therefore, some highly skilled staff from regions of higher-level productivity might take advanced knowledge and skills to the new region, which is beneficial for the productivity improvement of the new region. Moreover, intercity tourism labor movement can be observed between departments/units located in different regions within the same tourism enterprises/organizations, such as staff movement between franchised hotels and position transfer of officials between tourism administration units. Because of the service nature of the tourism industry, unlike manufacturing industries, the productivity is more dependent on the knowledge and skills of human minds rather than mechanical equipments. Therefore, once staff members move, the knowledge and skills move as well, which tends to contribute to the tourism growth of the host region.
Demonstration effect
Tourism enterprises, such as hotels, travel agencies, and scenic spots, tend to learn from their counterparts in regions with higher productivity consciously or unconsciously. In order to gain higher profit and increase efficiency, those enterprises with lower productivity imitate the products, service, management skills, and administration frameworks from their counterparts in superior regions. This effect is regarded as the demonstration effect (Blomström and Kokko 1998), and it is always associated with knowledge diffusion processes (Hashim and Murphy 2007; Le, Hollenhorst, Harris, McLaughlin, and Shook 2006). Apart from the demonstration effect among firms, we can also observe it from regional government and tourism administration units in different cities. Since government plays a dominant role in tourism planning and marketing in China, this interregional demonstration effect can be very significant.
Competition effect
Since major tourist attractions in China are natural sceneries and cultural attractions, their endowments are likely to cluster within a particular area. Because of the existence of the similarities in the type and range of tourist attractions, neighboring regions tend to target a relatively homogeneous visitor market that results in strong competition between regions in proximity insofar as their tourism development is concerned. Under the pressure of competition and in order to gain competitive advantages, tourism enterprises aim to raise productivity and improve efficiency either by using existing technology or obtaining new knowledge by innovation. In the process, the competition effect contributes significantly toward raising the productivity spillover between regions.
Market Access Spillover
In the study of FDI in the hotel sector, market access spillover refers to the direct and indirect effects by MNCs that lead to an increased share of certain markets in tourism (Wong 2004). Also, this type of spillover is obvious between neighboring cities as tourism destinations. When one city possesses a high share of a certain market, its neighboring cities are highly likely to receive the market access spillover and gain the easy access to this market. This is because of their geographic proximity and, possibly, the similarity of tourist attractions. The market access spillover is particularly important to international tourism development. Since international tourism promotions often require high costs and professional knowledge for marketing (Wong 2004), many cities in China, especially western ones, are not capable of conducting effective foreign tourism marketing individually, and usually, they heavily rely on this spillover to develop inbound tourism.
Joint Promotion
With the increase in demand for traveling, to facilitate local tourism development, many tourism sectors and organizations have recognized that collaborative tourism destination marketing is necessary (Palmer and Bejou 1995). It is extremely important for tourism organizations to enhance their competitiveness through collaboration. By collaboration, the attractiveness of overall regions to potential visitors is significantly amplified with a mixture of attractions from each collaborator. As a result, alliance members tend to receive benefits from the collaboration. Gooroochurn and Hanley (2005) even argued that joint promotion was viable only if interregional spillovers were generated in tourism flows.
Negative Events
Negative events in this study refer to natural, political, and social events (such as threats of disease, terrorism, political unrest, and grounding aircraft strikes) within a destination. These events tend to greatly threaten the growth of local tourism. Generally, negative events within one region may influence tourism flows to other regions. Neumayer (2004) adopted Lancaster’s (1971) theory to interpret the spillover effects in tourism flows from political violence. It was argued that unless the characteristics of tourist attractions in one region were highly valued, tourists tended to come to other regions with similar attractions if faced with violence. As a result, tourism flows to some neighboring regions with similar attractions increased because of positive spillover effects. However, according to a study by Drakos and Kutan (2003), only when political violence is modest could positive spillover effects be generated. In more general situations, there are negative spillover effects of such events in tourism flows to nearby destinations (Drakos and Kutan 2003; Neumayer 2004; Richter and Waugh 1986; Teye 1986). Because of threats of violence and safety considerations, tourists tend to give up their traveling plans even though their destinations are free of the influence of these events (Sönmez and Graefe 1998).
Tourists with Multidestination Travel Plans
Spillover effects in tourism flows also may be generated on the demand side. Some tourists may select more than one destination in a single tour, and undertake multidestination travel in a large geographic area that offers diverse tourist attractions (Lue, Crompton, and Fesenmaier 1993). Moreover, long-haul tourists are likely to divert and visit several destinations in order to make the journey worthwhile and to maximize its utility (Smith 1983). As a result of tourists’ multidestination travel, the spillover effects in tourism flows are strengthened.
The factors contributing to the spillover effects in tourism flows are summarized in Figure 1. In this study, further elaboration and analysis of these factors will not be conducted. Instead, the main purpose of this research is to detect whether the spillover effects are significant in tourism flows from the empirical study. As few econometric studies on tourism flows captured the spillover effects in the model, their estimation results were biased in the presence of spatial dependence (Wooldridge 2002).
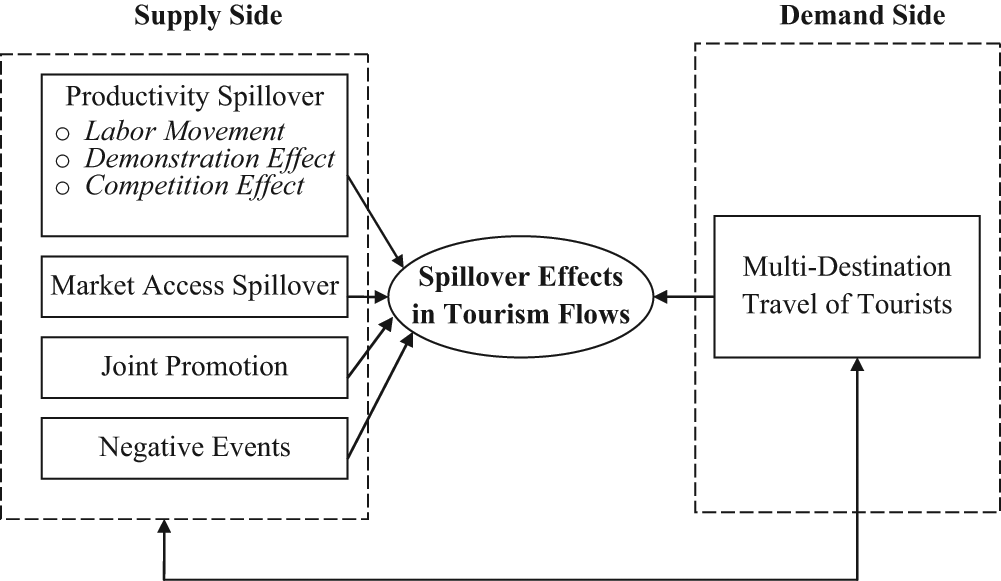
Factors contributing to spillover effects in tourism flows
Model Specification
Using a spatial econometrics approach, a panel data model is proposed to capture and estimate the spillover effects in tourism flows. In contrast to traditional panel data models, this spatial panel model includes a spatially lagged dependent variable. The model is specified as follows:

where i, j is one of 341 cities in mainland China, respectively; t is one of the years between 2002 and 2009, w
ij
is the element of the spatial weighting matrix
hotel it is the number of star rated hotels in city i at year t. It measures the capacity of tourism infrastructure, and β1 is expected to be positive.
FDI it is the total Foreign Direct Investment (FDI) relative to GDP of city i at year t, reflecting the degree of openness and economic relationship with foreign countries. FDI is helpful in attracting business travelers and holiday travelers (Khan, Toh, and Chua 2005; Kulendran and Wilson 2000). Therefore, β2 is expected to be positive for inbound tourism flows. This variable is not included in domestic tourism flow modeling.
road it is the density of roads in city i at year t, measured by the total length of roads divided by the administrative area of the city (in km/km2). It captures the influence of land transportation infrastructure on tourism flows. Since high-level transportation infrastructure provides good accessibility with low costs and brings a high level of satisfaction to tourists, β3 is expected to be positive.
air it is the total flight number at airports of city i at year t. Given that the air flight provides a high accessibility to inbound visitors and rich domestic travelers, it is beneficial for inbound and domestic tourism development. Moreover, the airport tends to bring in a large number of transit tourists. Hence, β4 is expected to be positive.
GDP it is the gross domestic product (GDP) of city i at year t (in 100,000,000 RMB). This variable measures the income of the city. It is hypothesized that cities with higher income are more likely to spend more budget on developing local tourism. Thus, β5 is expected to be positive. This variable is not included in inbound tourism flow models to avoid multicollinearity because lnFDI is a function of lnGDP according to their definitions.
tele it is the number of local fixed-line and mobile phone subscribers relative to the total population in city i at year t (in 10,000). It is referred to as the “penetration rate” and measures the capacity of telecommunication infrastructure (Shiu and Lam 2008). β6 is expected to be positive.
NP it is the number of national parks in city i at year t, reflecting the natural attractiveness of the destination. Since sight-seeing is the major motivation for either inbound or domestic tourists (CNTA 2006b), its coefficient is expected to be positive.
HERI i t is the number of World Heritage Sites in city i at year t, capturing the top-level attractiveness of the destination. Given the fact that the designation of a World Heritage Site acts as the catalyst to local tourism growth (Li, Wu, and Cai 2008), its coefficient is expected to be positive.
A4 it is the number of AAAA scenic spots in city i at year t. In the study period, the AAAA scenic spot is the highest-level scenic spot according to the regulation proposed by CNTA. This variable indicates the overall attractiveness of the destination, and its coefficient is expected to be positive.
D03 it is the dummy variable of the SARS outbreak; if year t is 2003, D03 it = 1; otherwise, D03 it = 0. This natural disaster tends to be detrimental to tourism flows (Neumayer 2004; Sönmez and Graefe 1998), and β10 is expected to be negative.
Finally, Σ
i
α
i
= 0, and
In the proposed model, the spillover coefficient δ measures the magnitude of spillover effects in tourism flows. Based on the estimation results, the significance of spillover effects can be evaluated from particular statistical tests on δ, such as the asymptotic t statistic, and LR test on spatial dependence. In addition, based on the estimation results of subsamples from different geographic regions, the values of δ can be compared to identify the regional differences in spillover effects. In the proposed research model, most variables are in logarithmic form. Therefore, the estimated coefficients of these variables can be interpreted as the elasticities of corresponding variables. This suggests that the coefficient is the ratio of the percentage change in this variable to the percentage change in the dependent variable.
Data Collection and Related Issues
The data of number of inbound tourist arrivals, number of domestic tourist arrivals, number of star-rated hotels, FDI, total length of roads, administrative area of cities, number of registered telephone numbers, and GDP were obtained from the China Statistical Yearbook for Regional Economy (2003-2010). The data of number of national parks for each city is collected from the website of the Ministry of Housing and Urban-Rural Development of China (http://www.mohurd.gov.cn). The data of number of AAAA scenic spots for each city is collected from the website of the National Tourism Administration of the People’s Republic of China (CNTA, http://www.cnta.gov.cn) and that of number of World Heritage Sites is obtained from the website of the United Nations Educational, Scientific, and Cultural Organization (UNESCO, http://whc.unesco.org)
This study focuses on all cities in mainland China. However, several issues about the sample cities should be highlighted. First, there are some special counties that are administered directly by the province. In this situation, the study combines these neighboring counties together and treats them as one city. Second, these special counties may also be isolated from other special counties and surrounded by cities, such as Jiyuan in Henan and Shennongjia in Hubei. The study considers them as individual cities. Third, as there is no prefecture level city administered by municipalities such as Beijing, Shanghai, Tianjin, and Chongqing, these four are treated as general cities. Finally, there are some new cities established during the study period, such as Zhongwei in Ningxia established in 2003. To keep the consistency of the sample, the data of these new cities are added to the data of the city they previously belonged to.
There are a limited number of missing values in the data set. Several attempts are made to fill in these values. Substantial efforts have been made to pool data from different sources, such as other statistical yearbooks and government reports. Because of the deficiency in China’s official statistics, extra care should be taken to ensure the consistency of the data over time. If the data cannot be found in all accessible sources, simple averaging method is adopted to fill in the missing values for each city.
The data set is stored in the geographic information system (GIS), which is convenient for spatial analysis and mapping. (Yang and Wong forthcoming-b) Once all information is coded in ArcGIS software, the spatial structure (nodes and links) of each city and the geographic distance between them can be identified. This research employs GeoDa package to calculate the spatial weighting matrix (Leitner and Brecht 2007). Descriptive statistics of variables are presented in Table 1. These statistics include mean value, standard deviation, and minimum and maximum values. The large differences between minimum and maximum for most variables indicate a broad range of variable intervals. In the proposed models, various tourist attraction variables (NP, HERI, and A4) are not in logarithmic form because most cities have a zero value for the tourist attraction variable. Moreover, since various economic variables are likely to be intercorrelated, bringing possible multicollinearity problem in model estimation, the variance inflation factor (VIF) is also reported for independent variables in inbound and domestic models, respectively. According to Belsley, Kuh, and Welsch (1980), a general rule is that VIF should not exceed 10. For our data, none of them is larger than 3.3, suggesting that multicollinearity is not an important problem. However, particular focus should be placed on some independent variables with high VIF, like lnGDP in domestic model with a VIF of 3.26.
Descriptive Statistics of Continuous Variables
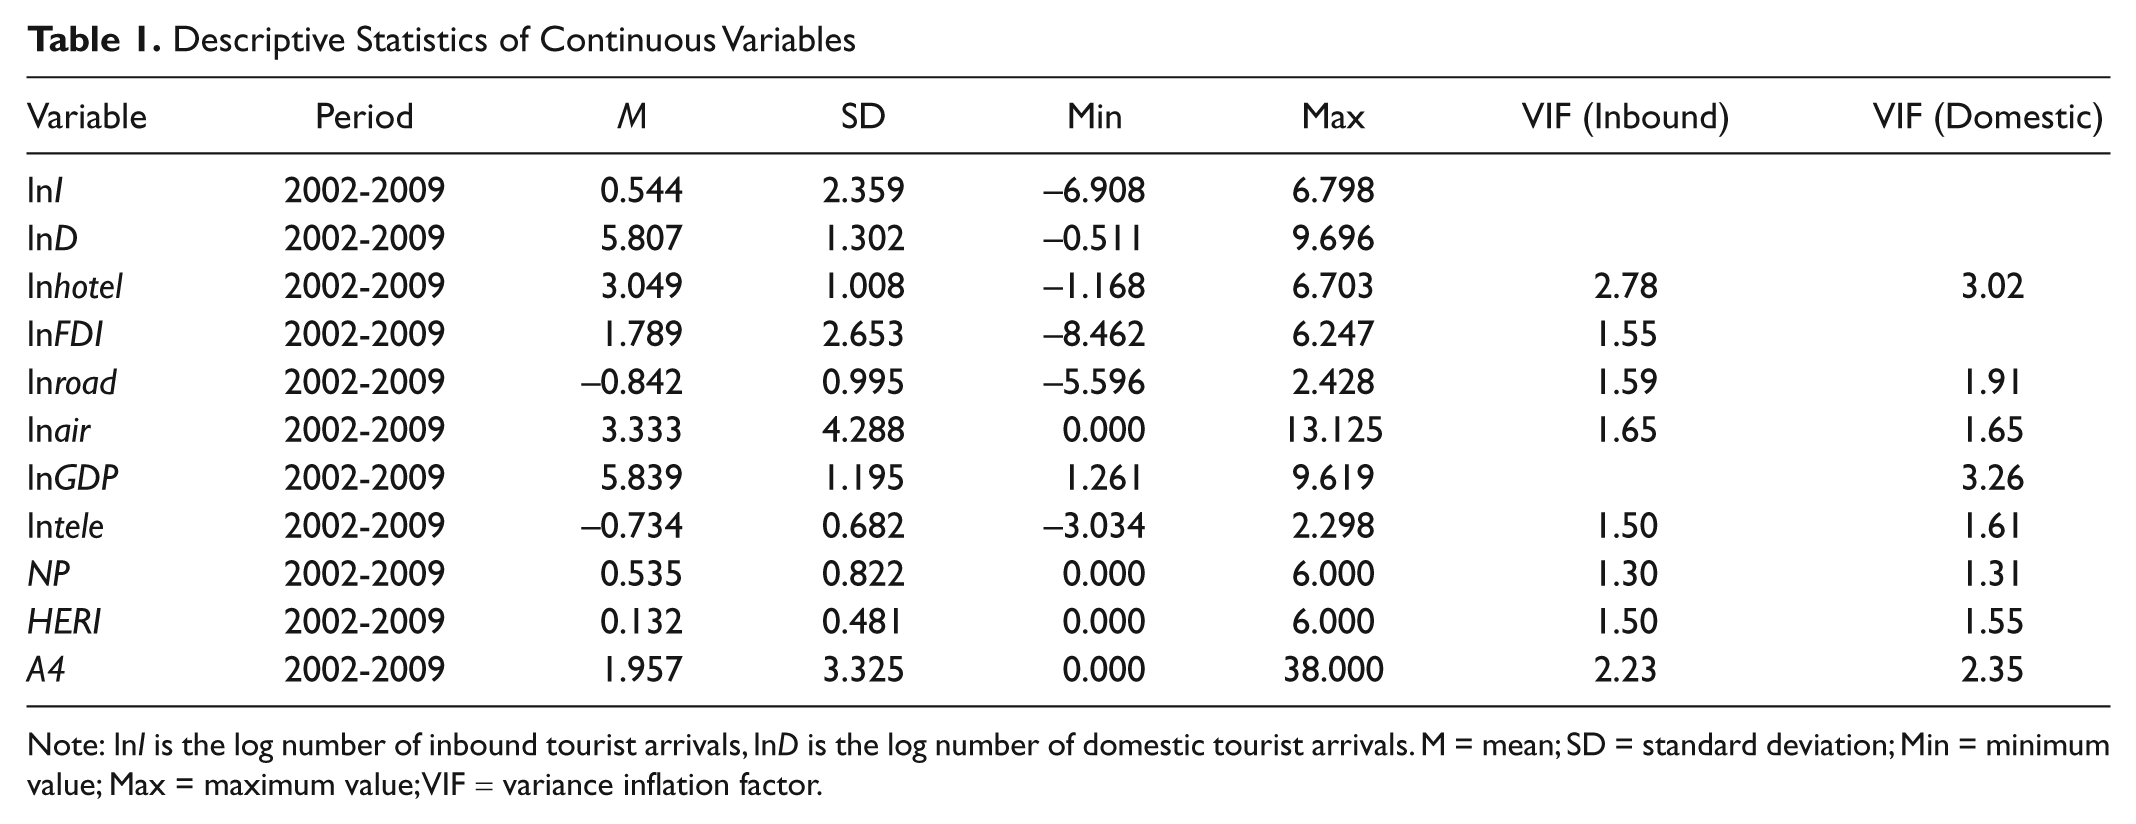
Note: lnI is the log number of inbound tourist arrivals, lnD is the log number of domestic tourist arrivals. M = mean; SD = standard deviation; Min = minimum value; Max = maximum value; VIF = variance inflation factor.
Findings and Discussion
Inbound Tourism Flow Model and Spillover Effects for All Cities
Table 2 reports the results for inbound tourism flows from 2002 to 2009. The negative and significant positive values of the Hausman test statistic show that random effect (RE) model is more appropriate than the fixed effect (FE) model (Greene 2000). Therefore, only results from RE models are presented. The first model is estimated using traditional nonspatial panel data model (Nonspatial All-RE), whereas the second using spatial panel data model (Spatial All-RE). The estimation of spatial model is conducted with the MATLAB code provided by Elhorst (2003). It is noted that nonspatial models generally overestimate the influences of various factors without capturing the spatial spillover effects. The majority of explanatory variables within the model are found to be statistically significant with expected signs.
Spatial Panel Model Results for Inbound Tourism Flows

Note: Asymptotic t statistics are in parentheses.
p < 0.01, **p < 0.05, *p < 0.1.
To explore the possible existence of multicollinearity problem, models with different sets of independent variables are estimated for robustness check. By investigating the estimated coefficient change after excluding different variables, we could gauge the degree of multicollinearity problem: if the estimated coefficient is similar over different specifications, this problem can be overlooked. lnFDI is excluded in Spatial All-RE-I model, the set of nontourism infrastructure variables is excluded in Spatial All-RE-II model, and the set of tourist attraction variables is excluded in Spatial All-RE-III model. By comparing the results of these three models with the original Spatial All-RE model, only minor changes can be observed from the estimated coefficients. Although the estimated coefficient of lnhotel rises after excluding nontourism infrastructure variables (in Spatial All-RE-II), this change is still not substantial and does not induce any controversial results from other models. Therefore, we interpret the results based on the Spatial All-RE model (column 2 of Table 2).
A major concern of the results is the spillover coefficient δ. In All-RE model, δ is 0.393. This result suggests that if inbound tourist arrivals to the five nearest-neighboring cities of a particular city increase by 1%, inbound tourist arrivals to that city will increase by 0.393% through the cross-city spillover effects. It confirms the findings from earlier studies by Drakos and Kutan (2003), Gooroochurn and Hanley (2005), and Neumayer (2004). Compared with previous studies of limited sample size, this study, which covers 341 Chinese cities, will allow us to draw more meaningful inferences. In addition, this study also controls for other factors influencing tourism flows in the spatial econometric model. Therefore, the results are expected to be more accurate and reliable.
All infrastructure factors in the model are found to exert significant and positive influences on inbound tourism flows, which tallies with the results from Eugenio-Martín, Martín-Morales, and Sinclair (2008) and Khadaroo and Seetanah (2007, 2008). This indicates that tourism development is not only dependent on infrastructure of tourism sectors, but also associated with infrastructures in other sectors, such as those in the transportation and telecommunication sectors. The coefficient of lnhotel is 0.279, implying that each 1% increase in the number of star-rated models is expected to stimulate inbound tourist arrivals to the city by 0.279%. Furthermore, as indicated by the positive and significant coefficient of lnroad, which is 0.144, the land transportation infrastructure has a positive influence on inbound tourism flows. If road density rises by 1%, inbound tourist arrivals will increase by 0.144%. Another variable measuring transportation infrastructure, lnair, has a smaller coefficient of 0.054, identifying a less important role that airport transportation plays in determining inbound tourism flows. Moreover, the coefficient of lntele is 0.215, highlighting the great importance of telecommunication infrastructure in facilitating inbound tourism growth.
With respect to different tourist attractions, both NP and HERI are significant with expected signs. Since these attraction variables are not in logarithmic form, their estimated coefficients cannot be regarded as the elasticity. Based on the estimation results, it is found that the World Heritage Site (HERI) with the largest estimated coefficient is most attractive to inbound tourists. This can be explained by the fact that the World Heritage Site is an inimitable attraction that provided a unique experience to visitors. Apart from that, the coefficient of NP in the model is large, suggesting that national parks are attractive to inbound visitors. Considering other explanatory variables, the coefficient of lnFDI is 0.032. This argues that the degree of openness of a city would influence inbound tourism growth. A higher degree of openness results in information of the destination being more accessible to potential inbound market segments. Moreover, the greater openness of the destination can reduce the perceived barriers associated with international travel in terms of language, custom, and politics, when tourists make travel decisions. Another factor within the model, the SARS outbreak in 2003, has a downward and significant effect on inbound tourist arrivals.
Inbound Tourism Flow Model and Spillover Effects for Cities in Different Regions
The analysis above reveals evidence of spillover effects between cities within inbound tourism flows throughout all Chinese cities. It is of interest to see if these effects remain constant when the sample is subdivided into three geographic regions: the East, Center, and West. The Eastern part is the most developed area in China with more qualified facilities to support tourism growth, while the West is less developed because of its physical conditions. Table 2 also shows the results of models for these regions. The negative values of the Hausman test statistics provide evidence that the RE model is superior to the FE model in fitting the data. Therefore, only the results of RE models will be examined in detail (specifically, column 6 for Eastern cities, column 7 for Central cities, and column 8 for Western cities).
The spillover coefficient δ is 0.304 for Eastern cities, 0.320 for Central cities, and 0.244 for Western cities. It implies that when there is a 1% increase in inbound tourism flows to the five nearest-neighboring cities, tourist arrivals will rise by 0.304%, 0.320%, and 0.244% to the Eastern, Central, and Western cities, respectively. The results reveal that the magnitude of spillover effects on inbound tourism flows is larger for Eastern and Central cities. It can be explained from both the tourism demand and supply perspectives. From the demand side, it may be argued that inbound travelers to the East are more likely to travel to a neighboring destination close to the original one, a past travel behavior that is partially supported by the survey data from CNTA in 2005. Furthermore, because of the highly developed tourism industry in the East and Center, each spillover channel on the supply side is more developed, leading to the greater spillover effects in tourism flows (Figure 1). For example, there are more professional activities organized by tourism associations, which provide more opportunities for organizations to learn from each other by these “demonstration effects,” generating greater spillover effects.
Within the model for Eastern cities (East RE), the coefficient of lnhotel is 0.583, while being 0.353 for Central cities (Center RE). Both of them are larger than that for Western cities, which is merely 0.214. This result was consistent with findings from the research by Eugenio-Martín, Martín-Morales, and Sinclair (2008) and Khadaroo and Seetanah (2008) in which infrastructure factors were found to be less important for tourism flows to less developed areas. This may be attributed to the fact that tourists do not expect high standards when visiting less-developed areas (Khadaroo and Seetanah 2007, 2008).
Regarding nontourism infrastructure variables, lntele is found to have the largest coefficient within the models for Eastern and Central cities, suggesting that telecommunication is the most important infrastructure for inbound visitors in most regions of China. The magnitude and significance of transportation infrastructure variables also vary from one region to another. In Western cities, the coefficient of lnair is much larger than those of Eastern and Central cities, suggesting that airport transportation infrastructure plays a more dominant role in inbound tourism growth of Western cities. The reason for this is that some famous tourist attractions in the Western parts of China have poor land accessibility, such as Jiuzhaigou in Sichuan and Dunhuang in Gansu. Airport transportation hence becomes important to tourists in entering these attractions in the peripheral region and facilitates local tourism development (Halpern 2008). Finally, as presented in the estimation results, lnFDI is only significant for Western cities, indicating the great importance of foreign investment on inbound tourism growth of Western cities.
With regards to the tourist attraction variables, World Heritage Sites are the most important determinants of inbound tourism flows to cities in all regions. This is especially true for Central and Western cities. One possible interpretation is that there is a trade-off between attraction and infrastructure factors when tourists choose destinations beyond the East. Only the top-level attraction, such as the World Heritage Site, is seen to be a deserving destination to inbound tourists. The significant and negative coefficients of D03 in all three models confirm the detrimental effects that the SARS outbreak exerted on inbound tourism flows. The results indicate that these detrimental effects are larger for Central and Western cities in comparison to those for Eastern cities, suggesting that the inbound tourism industry in Western and Central cities is more fragile. This is consistent with results from Zhao (2008). One possible explanation is that inbound tourists mainly stayed in major gateway cities and their neighboring areas in the East during the period of the SARS outbreak, and less inbound visitors traveled to Central and Western cities because of safety considerations. As a result, the inbound tourism industry of Central and Western cities suffered a great deal during the SARS outbreak.
Domestic Tourism Flow Model and Spillover Effects for All Cities
Table 3 presents results of the spatial panel model for domestic tourism flows to all 341 cities in mainland China. As shown by the negative value and significant positive value of the Hausman test statistic, only RE model results are presented. Traditional RE model (column 1 of Table 3) overestimates the coefficients in comparison to spatial RE models (column 2 of Table). We also try different specifications to check the multicollinearity problem in columns 3 and 4. The result suggests that the insignificance of lntele in Spatial All-RE model might be atttributed to its collinearity with lnGDP because lntele turns out to be statistically significant after excluding lnGDP. Therefore, we reestimate the model by excluding lntele in Spatial All-RE-III model (column 5 of Table 3), and it is chosen to interpret the estimation results.
Spatial Panel Model Results for Domestic Tourism Flows to All Cities

Note: Asymptotic t statistics are in parentheses.
p < 0.01, **p < 0.05, *p < 0.1.
The spillover coefficient δ in the model is 0.367, implying that 1% increase of domestic tourist arrivals to the five nearest-neighboring cities would lead to a rise of 0.367% of domestic tourist arrivals to the city. This coefficient is marginally smaller than the spillover coefficient of 0.393 within the inbound tourism flow model (column 2 of Table 2). A possible explanation for this is that inbound tourists are more likely to undertake multidestination travel for a single trip in order to maximize the use of time, money, and other resources associated with long-distance travel to mainland China. Hence, there are stronger spillover effects in inbound tourism flows from the demand side (Figure 1).
lnGDP is estimated to be 0.458, larger than other coefficients, suggesting that city’s income is the key to enhancing domestic tourism flows. Regarding infrastructure variables, the coefficient of lnhotel, 0.159, is larger than the coefficient of other infrastructures. This indicates that the influence of tourism infrastructure dominates domestic tourism development of Chinese cities. If the number of star-rated hotels grows by 1%, it would lead to a 0.159% increase of domestic tourism flows. The infrastructure of land and airport transportation is also positively associated with domestic tourism flows, showing an elasticity of 0.077 and 0.027, respectively. One would expect that the land transportation might be more elastic for domestic tourists, but the result suggests the reverse. One possible explanation is that unlike tourists in Western countries, domestic tourists in China usually take public vehicles, instead of private ones, for traveling. As a result, the influence of land transportation on domestic tourism may not be too large. A comparison between estimated infrastructure elasticities in the domestic tourism flow model and those in the inbound model indicates that the latter are larger, suggesting that inbound visitors attach huge importance to infrastructure when choosing a destination. The results are consistent with the findings from Eugenio-Martín, Martín-Morales and Sinclair (2008), and Khadaroo and Seetanah (2007, 2008) in that tourists from countries with higher standards of living placed more demands on infrastructure during their visit. This is attributed to the fact that inbound tourists have higher expectations with regard to infrastructure provision and prefer to use high-level infrastructure to maintain the same comfort as they do in home countries (Khadaroo and Seetanah 2007, 2008). Therefore, infrastructure factors are found to be more important to inbound tourism growth than domestic tourism development.
With reference to tourist attraction variables, both NP and HERI are significant in the model with expected signs. The coefficient of HERI is lower than that of NP, which is contrary to the results from the inbound tourism flow model in Table 2. One possible explanation is that World Heritage Sites, which include many cultural attractions, are less attractive to domestic travelers than foreign visitors (Yang, Lin, and Han 2010). In contrast, A4 is not significant in the model, although it is positive. Even though A4 is statistically significant in Spatial All-RE-I model excluding lnGDP, its magnitude is also small. The coefficient of HERI is much larger for inbound tourism flows than for domestic flows (Tables 2 and 3), suggesting that World Heritage Sites is crucial in attracting inbound tourists. This result is in line with findings from Ma and Li (1999), which stated that inbound tourists always choose top-level destinations during their visits in order to maximize the use of time, money, and other resources associated with long-distance travel to China.
D03 is negative and significant in the model, indicating the detrimental effects of the SARS outbreak on domestic tourism flows. Its coefficient, −0.082, is far smaller than its counterpart in the inbound tourism flow model, which is −0.267 (column 2 of Table 2). Therefore, it is indicated that the SARS outbreak had a larger negative influence on inbound tourism flows than domestic tourism flows. This phenomenon can be explained by the fact that inbound tourists are more concerned about safety when traveling outside their countries of residence, because of the unfamiliarity of culture, economy, and politics in the host country.
Domestic Tourism Flow Model and Spillover Effects for Cities in Different Regions
Table 3 also reports the results of domestic tourism flow models for cities within different geographic regions. After a preliminary detection, lntele is excluded from the model because of its collinearity problem with lnGDP. The Hausman test statistic suggests that the RE model is more appropriate than the FE model for modeling domestic tourism flows to each region. Therefore, the interpretation of the results is based on the estimates for RE models in Table 3 (specifically, column 6 for Eastern cities, column 7 for Central cities, and column 8 for Western cities).
Results indicate that the spillover coefficient in the Eastern model, 0.445, is larger than its counterparts in the Central and Western models, 0.294 and 0.402, respectively. As indicated in the all-sample model, lnGDP has the largest coefficient in the domestic tourism flow model for each region. This implies that a city’s income plays the most important role in developing domestic tourism, as cities with higher income can allocate more resources on local tourism development. The order of elasticity between various infrastructures follows the same pattern across all regions. That is, the elasticity of tourism infrastructure is largest, followed by the elasticity of land transportation, with the elasticity of airport transportation being the smallest. Moreover, it is found that even though lnroad is not significant for inbound tourists in the West, it is significant for domestic tourists. This highlights the difference between inbound and domestic tourists in transport usage in Western cities: inbound tourists prefer air transport while domestic ones usually choose land transport.
Cities within the three regions differ considerably in the roles that distinct tourist attractions play in contributing to domestic tourism growth. In Eastern cities, both national parks and World Heritage Sites are equally appealing to domestic tourists since the coefficients of NP and HERI are similar. However, in Western cities, the coefficient of NP, 0.183, is much larger than that of HERI, 0.061. This highlights the greater importance of National Parks in attracting domestic visitors to Western cities.
The SARS outbreak is also found to be detrimental to domestic tourism flows in all regions of China. The negative influence of the SARS outbreak is smallest for Western cities, suggesting that the Western domestic tourism industry was more resilient during the SARS outbreak. This is contrary to findings from the inbound tourism flow model, which indicated that the Eastern inbound tourism industry was more resilient (Table 2). It may be explained by the spatial distribution of the incidence of SARS. According to the China Statistical Yearbook of Health, the incidence of SARS was lowest in the West; therefore, the influence of the SARS outbreak on domestic tourism flows to Western cities was smaller because of less constraints of human mobility within the area.
Conclusion
This study applies spatial panel models in estimating spillover effects and other determinants of inbound and domestic tourism flows to Chinese cities. The findings confirm the existence of spillover effects in tourism flows, suggesting that infrastructure factors, tourist attractions, and the SARS outbreak are significant determinants of both inbound and domestic tourism flows. In addition, while the degree of openness is found to be important to inbound tourism flows, a city’s income is the key to enhancing domestic tourism flows. Furthermore, significant regional differences in tourism growth are highlighted across different regions. Both tourism and nontourism physical facilities are of great significance in the East, while top-level tourist attractions are crucial in the West. Finally, the comparison between the results for inbound tourism flows and those for domestic flows reveal different traveling patterns, infrastructure elasticities, attraction preferences, and sensitivities to negative events between inbound and domestic tourists.
The findings from the spatial econometric models in this study have highlighted the significance of spillover effects, indicating that a city surrounded by cities with prosperous tourism can receive the positive spillover effects in tourism flows. There are several important implications based on the model’s estimation results. Spillover effects in tourism flows should be seriously considered in local tourism development. This suggests that cities, particularly less developed ones, should make full use of the cross-city spillover effects in tourism flows from neighboring cities to support local tourism development. For example, some supra-city agencies, such as tourism destination marketing alliances across cities, the supra-city tourism resource management administration, and regional tourism association should be established to take full advantage of these benefits. According to the tourism spillover framework presented in Figure 1, several measures may be adopted to maximize the benefits from potential cross-city spillover in tourism flows. Some suggested measures include releasing restrictions of labor and capital flows to remove the barriers for productivity spillover; providing more opportunities to tourism organizations and sectors to learn from each other through demonstration and competition effects; conducting joint promotions as an efficient means of collectively branding, theming, and packaging tourism products; and designing package tour products with other destinations to attract tourists undertaking multidestination travel.
Some limitations of the study should be noted. Because of the unavailability of data, inbound tourists could not be further disaggregated into international tourists and tourists from Hong Kong, Macau, and Taiwan. As international tourists and those from the nonmainland areas of China tend to make different destination choices, separate models of these two flows may be necessary. Moreover, to assess the influence of information diffusion on tourism growth, the number of internet subscribers might be a more reasonable measurement of telecommunication infrastructure. In future research, the validation of spillover factors indicated in the spillover framework is necessary as it will shed light on the formation of spillover effects. Hence, it is suggested that further qualitative and quantitative studies focus on the investigation of potential factors that contribute to spillover effects: how these factors are related to spillover effects, to what extent these factors are significant, and whether regional differences are substantial.
Footnotes
Acknowledgements
This article is part of an M.Phil. thesis at the Hong Kong Polytechnic University. We appreciate the helpful comments made by Prof. Haiyan Song, Prof. Donggen Wang, Prof. Honggang Xu, and the referees.
Declaration of Conflicting Interests
The author(s) declared no potential conflicts of interest with respect to the research, authorship, and/or publication of this article.
Funding
The author(s) received no financial support for the research, authorship, and/or publication of this article.