



Abstract
In this study, we apply an agent-based modeling approach to understand individual visitors’ multidestination travel patterns and the spatial spillover effects in visitor flows as an aggregate outcome. Based on previous literature, we specify three hypothetic visitor categories (global optimizers, sequential optimizers, and radial optimizers) according to visitors’ attraction selection rules. We conduct an ABM simulation with a sample of 341 Chinese cities as destinations and 1,990 attractions to measure the degree of spillover between destinations by observing the frequency with which visitors traveling across destination boundaries visited attractions in other destinations. The simulation results demonstrate slightly different spillover effects based on visitor type and highlight three regions with particularly strong spillover effects: the Bohai Rim region, the Yangtze River Delta region, and the Sichuan and Chongqing region. These results appear consistent with those of exploratory spatial data analysis in a validation check. Lastly, policy implications are provided.
Keywords
Introduction
Spillover effects in visitor flows refer to specific types of spatial externalities generated across destination regions (Yang and Wong 2012). Because of these effects, a destination/region’s tourism development could benefit from tourism growth in its surrounding destinations/regions. Many empirical studies have confirmed the existence of spillover effects in visitor flows (Gooroochurn and Hanley 2005; Lazzeretti and Capone 2009; Yang and Fik 2014; Andraz, Norte, and Gonçalves 2015), which are particularly beneficial for less-developed destinations to leverage and internalize. Spillover effects can be triggered and facilitated by supply- and demand-side factors. From a demand-side perspective, tourism spillovers stem primarily from multidestination travel. The resultant interregional visitor flows greatly contribute to tourism spillover effects across destinations (Reintinger, Berghammer, and Schmude 2016; Yang, Fik, and Zhang 2017).
Several empirical and analytical models have been used to investigate spillover effects in visitor flows, including multiequation models (Gooroochurn and Hanley 2005; Balli and Tsui 2015), spatial econometric models (Zhou et al. 2017; Marrocu and Paci 2013), the gap model (Li et al. 2011), and the distance model (Yang, Fik, and Zhang 2017). Most of these models essentially capture interdependences across variables/error terms as spillover effects based on aggregate tourism demand analysis; however, they shed little light on the channels creating these effects from a micro perspective. To abridge this research gap, we introduce the method of agent-based modeling (ABM) to provide an innovative perspective through which to understand multidestination travel and spatial spillover effects in visitor flows. Unlike macro-models that use aggregate data, our method effectively mimics visitors’ decision-making processes vis-à-vis destination choice in a multidestination travel context; therefore, this model seeks to unveil factors and decision-making rules related to spillover effects at the aggregate level. Because of several inherent advantages of ABM, such as considering systematical complexity and nonlinearity and overcoming assumptions of homogeneity, equilibrium, and rationality typical to traditional modeling techniques, the adoption of ABM within tourism research is suited to a wide variety of potential applications (Nicholls, Amelung, and Student 2016; Johnson et al. 2016).
In this study, we concentrate on tourism spillover effects (from the demand side) across 341 prefecture-level Chinese cities by measuring intercity interaction in terms of visitor flows between two cities’ destinations during multidestination travel. We further classify agents (i.e., visitors) into three hypothetic categories:
Notably, however, this visitor/tourist typology could be different from popular typologies segmenting visitors/tourists from observable characteristics such as motivations, travel distance, and duration of stay. Next, we propose different utility-maximization decision-making rules for each agent type based on his or her destination/attraction choices (Yang, Fik, and Zhang 2013; Ferrante, Abbruzzo, and De Cantis 2017). Based on the simulation results, we then calibrate the magnitude and direction of spillover effects according to the number of agents moving across destinations during a single multidestination tour. Lastly, we check the validity of our simulation-based measure of spillover effects and compare our results to those of exploratory spatial data analysis (ESDA).
This study aims to make several contributions to the current tourism literature. First, using ABM, we are able to highlight micro-level factors that shape spillover effects at the aggregate level as well as to examine macro-level outcomes from heterogeneous individual-level behaviors based on a set of heterogeneous agents (Nicholls, Amelung, and Student 2016). In particular, ABM is well suited to deciphering spillovers as a complex, nonlinear phenomenon in visitor flows (Johnson et al. 2016). Second, unlike previous studies classifying multidestination behavior via spatial layouts of travel routes, we provide a typology based on utility-maximization rules to develop a more process-based understanding of spillover effects in visitor flows. Lastly, our simulation offers a valuable tool with which DMOs and practitioners can conduct “what-if” simulations and seize opportunities for cross-destination collaboration (Johnson and Sieber 2009).
The article is organized as follows: after the introduction, relevant literature is reviewed, including that which focuses on tourism spillover effects, multidestination travel, methods of examining spatial spillover, and ABM applications in tourism. Based on past research, the ABM method is then detailed, with a description of the study’s research region and corresponding empirical data. Next, the simulation results are presented, discussed, and compared with those of ESDA. Finally, conclusions and implications are presented.
Literature Review
Spatial Spillovers and Multidestination Travel
Yang and Wong (2012) first proposed an integrated framework to explain different channels associated with spatial spillover effects of tourism. From a supply-side perspective, one major channel is productivity spillovers, which tourism-related firms across regions can use to improve their mutual productivity. Three different subchannels also contribute to this type of spillover: labor movement, demonstration effect, and competition effect (Mao and Yang 2016). Majewska (2015) highlighted the importance of agglomeration economies in contributing to spatial spillovers in visitor flows and argued that agglomeration can spread beyond the borders of geographic units to generate positive spatial externalities as spatial spillovers. In addition, negative natural, political, and social events represent another primary channel that triggers spatial spillovers in tourism. Along with these events, competing countries tend to receive spatial spillover benefits (i.e., as alternative destinations) and thus experience increased visitor arrivals (Perles-Ribes et al. 2018).
From the demand-side perspective, visitors’ multidestination travel is a significant driver of spatial spillover effects in visitor flows. Many studies have found that visiting multiple destinations in a single tour is cost-efficient, economically sensible, and less risky and uncertain compared to trip in a single destination (Lue, Crompton, and Stewart 1996; Tideswell and Faulkner 1999), which ultimately creates a higher level of utility for visitors (Tussyadiah, Kono, and Morisugi 2006). Past studies underscored several factors that inform multidestination travel, such as travel distance, travel party, trip purpose, travel transport, and length of stay (Santos, Ramos, and Rey-Maquieira 2012; Yang, Fik, and Zhang 2013; Koo, Wu, and Dwyer 2012). Apart from these visitor-specific factors, the decision to visit multiple destinations also depends on the compatibility between subsequent and previous destinations in a single tour (Jeng and Fesenmaier 1998).
Several studies have also investigated the spatial pattern of multidestination travel. Lue, Crompton, and Fesenmaier (1993) summarized four spatial patterns according to a trip itinerary’s spatial layout: (1) en route pattern (i.e., visitors visit a single major destination with other places of interest to visit on the route, with no side trips); (2) base camp pattern (i.e., visitors visit a primary destination plus other nearby satellite destinations for side trips); (3) regional tour pattern (i.e., visitors visit a specific region where a series of destinations are visited sequentially); and (4) trip chaining pattern (i.e., visitors have multiple foci to travel to and from). This typology has been used in a number of studies to explore multidestination travel (Hwang and Fesenmaier 2003; Önder 2017; Stewart 1997). Hwang and Fesenmaier (2003) found that more than 90% of US multidestination pleasure trips fit the en route pattern, whereas Önder (2017) argued that base camp patterns dominate for visitors in Austria. Other empirical studies have aimed to quantify the geographic pattern of multidestination travel. For example, Koo, Lau, and Dwyer (2016) calibrated the geographic dispersal of visitors engaging in multidestination travel in Australia, and Yang, Fik, and Zhang (2017) developed a geometric typology of Chinese multidestination travelers based on trip direction and length in different tour stages.
Multidestination travel connects destinations through a network of tourist movement, and the network structure helps understand the global pattern of multidestination travel and the economic impacts injected into the local community. For example, Shih (2006) investigated the multidestination travel network of 16 tourism destinations and calculated several network indicators such as degree centrality, betweenness centrality, closeness centrality, and structural holes. D’Agata, Gozzo, and Tomaselli (2013) examined the network characteristics of tourism routes to map the spatial distribution of visitor flows and tourism mobility in Sicily. Based on the anchor-point theory, Kang et al. (2018) found that in the network of multidestination travel, the spatial patterns of the centralities were hierarchically structured and differentiated depending on the length of stay in a destination, an important indicator of local tourism economic impact. Likewise, Stienmetz and Fesenmaier (2019) looked into the relationship between the network structure of destinations and the economic impact of tourists. The result from network analysis showed that density, out-degree centralization, and in-degree centralization are negatively correlated with total visitor-related spending within a destination, while betweenness centralization has a positive relationship. Therefore, the tourism-generated economic value is constrained by the destination network structure as a consequence of supply- and demand-side interactions (Stienmetz and Fesenmaier 2019).
Methods Examining Spatial Spillover
Multiequation models
In multiequation models, each equation captures the tourism-related indicator of a single destination/region. Therefore, a common way to identify spillover is to incorporate indicators of other destinations/regions (from other equations) into the equation at hand. Popular multiequation models include the seemingly unrelated regression (SUR) model, simultaneous equation model (SEM), vector autoregressive (VAR) model, and multivariate generalized autoregressive conditional heteroscedasticity (GARCH) model. Bassil (2014) applied a three-equation SUR model to investigate the impact of spillovers resulting from terrorism on tourism demand to Lebanon, Turkey, and Israel, whereas Gooroochurn and Hanley (2005) employed a two-equation SEM to capture interregional spillovers in tourism between the Republic of Ireland and Northern Ireland. Moreover, Andraz, Norte, and Gonçalves (2015) applied a VAR model to investigate tourism spillovers in five Portuguese regions. This model captured spillovers using dynamic feedback of tourism dependence terms with other regions, which became a notable advantage compared to other static multiequation methods. Last but not least, multivariate GARCH models became popular to examine interregional/international spillovers related to tourism demand fluctuation (i.e., volatility) (Balli and Tsui 2015; Balli, Curry, and Balli 2015; Hoti, McAleer, and Shareef 2007). However, multiequation models, in general, suffer from a major limitation: they can only capture spillovers across a limited number of destinations/regions by accommodating a small number of equations.
Spatial econometric models
Unlike multiequation models, spatial econometric models can assess spillovers across a large sample of geographic units. A typical application of these models in tourism demand analysis is to investigate if visitor arrival/receipt in a destination/region is influenced by that of nearby destinations/regions (i.e., spatially lagged units). Usually, a spillover coefficient can be derived in this regression-type model as the regression coefficient of the spatial lag term. Several empirical studies have applied various spatial econometric models to investigate destination-side spatial spillovers of inbound visitor flows (Zhou et al. 2017; Yang and Wong 2012), spatial spillovers of regional tourism growth (Lazzeretti and Capone 2009; Yang and Fik 2014), and spatial spillovers in dyadic visitor flows from origin and destination sides (Patuelli, Mussoni, and Candela 2013; Marrocu and Paci 2013). However, there are two major drawbacks of these models when examining spatial spillovers in visitor flows. First, spatial weighting matrix specifications (i.e., defining “nearby” units and spatial lag) can be arbitrary and sensitive, yet they largely determine spillover scope. Second, spatial econometric models generally assume a universal spillover coefficient for all observations, which tends to mask spillover heterogeneity across different pairs of destinations/regions.
Gap model
As an analytical model, the gap model has been popular in explaining geographic externalities (e.g., knowledge spillovers) by highlighting gaps between spillover generators and receivers (Caniëls and Verspagen 2001). Extending the traditional gap model, Li et al. (2011) developed a new model to understand spatial spillover effects in tourism flows. Their model assumed that the magnitude of spillover between destinations depends on two types of inter-destination gaps: the grade gap in the tourism system hierarchy, and the gap of tourism destination type (Tang and Li 2016).
Distance model
Although most empirical models examine spatial spillover effects using aggregate data from a macro perspective, a recent study introduced the distance model of multidestination travel to understand spillovers from the demand side (Yang, Fik, and Zhang 2017). Here, the dependent variable captures the distance between two destinations in a multidestination tour, and a destination spillover index can be calibrated by aggregating individual visitors’ predicted distance.
ABM Applications in Tourism
ABM is “a computational method that enables a researcher to create, analyze, and experiment with models composed of agents that interact within an environment” (Gilbert 2008, p. 2). Unlike statistical and econometric models that seek to fit collected data, ABM simulates system dynamics based on a theoretical understanding of agent behavior (Gilbert 2008). Because a tourism system exhibits significant systematical complexity and nonlinearity, the application of ABM to tourism studies appears especially promising (Nicholls, Amelung, and Student 2016; Johnson et al. 2016). Nicholls, Amelung, and Student (2016) pinpointed four major areas of ABM application: visitor motivation and behavior (Soboll and Schmude 2011), management and modeling of visitor flows (Qiu, Xu, and Li 2016), tourism planning and development (Johnson and Sieber 2011), and tourism policy and marketing (Ma, Weng, and Yu 2015).
Several studies have demonstrated the usefulness of ABM in modeling tourist behavior and understanding visitor flows as the aggregate outcome of individual behavior. By specifying three visitor agent profiles (i.e., sun and sea seeker, culture seeker, and gastronomy seeker), Boavida-Portugal, Ferreira, and Rocha (2017) used ABM to study visitors’ destination choices and simulated visitor flows to five destinations. Reintinger, Berghammer, and Schmude (2016) applied ABM to evaluate how sociodemographic and economic factors shaped tourism demand to 109 European destinations under three different scenarios of global change. Similarly, after specifying decision-making rules behind visitors’ destination choices, Qiu, Xu, and Li (2016) employed ABM to understand the diffusion of visitor flows to other destinations within a province in China. ABM has also been used to understand the demand for specific tourism products. For instance, Pons et al. (2014) leveraged ABM to evaluate the effects of climate change on visitor participation in ski tourism under various scenarios including differential temperature increases, natural snow depth, and skiing season extension.
ABM Specifications
Agent and Environment Definitions
A typical ABM simulation framework consists of three major components: agents, the environment, and interactions that occur either among agents or between agents and their environment (Gilbert 2008). When using ABM to simulate visitor flows, we treated an individual visitor as an agent who is able to share information or knowledge with other individuals and interact with his or her environment based on predefined decision-making rules (Itami et al. 2003). In our proposed ABM framework (Figure 1), we investigated the interaction between agents and their environment by modeling agents’ attraction choices (located in different destinations) in a multidestination tour as a function of visitor agent attributes and environmental characteristics. As shown in Figure 1, we captured the spatial-temporal behavior of visitor agents under this framework, namely, how they move across attractions and destinations based on utility maximization given a set of spatial and temporal constraints. In turn, destination and attraction characteristics in the environment were found to influence spatial and temporal constraints and visitor agents’ perceived utility when making decisions.
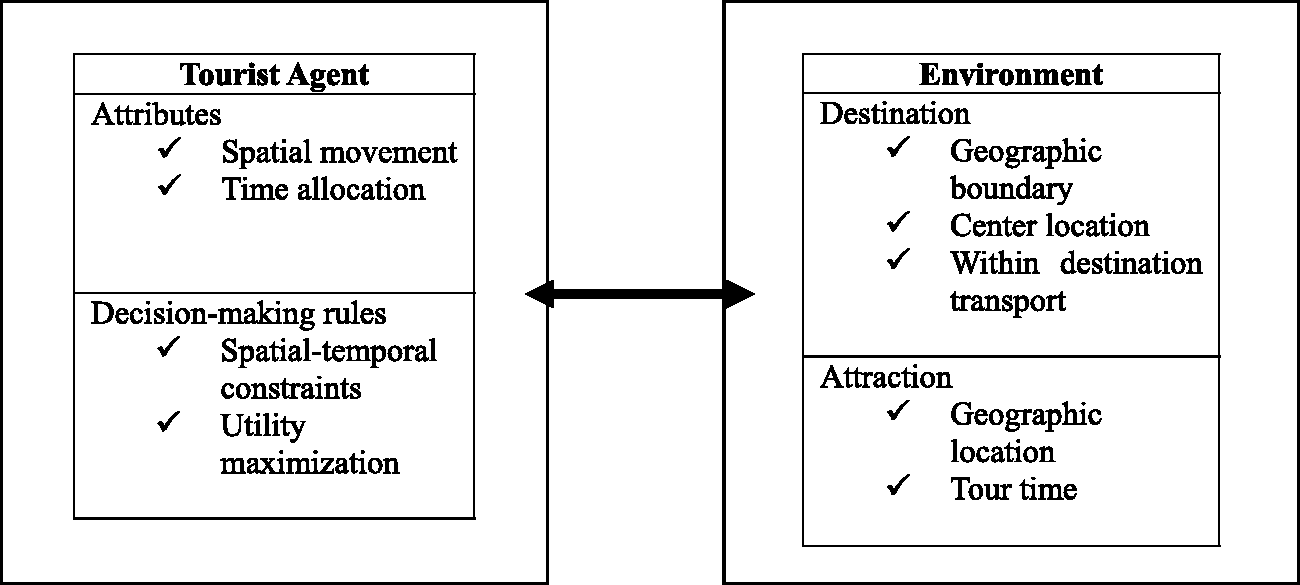
A simulation framework for visitor flows: Interactions between visitor agents and environment.
The environment, which represents geographic space, provides a virtual world where agents act (Gilbert 2008). In this study, we considered two types of geographic units: destinations and attractions located within a destination (see Figure 1). Specifically, in our ABM environment, a destination, as a “polygon” object in space, has a specific boundary, and each destination has three basic attributes: geographic boundary, center location, and within destination transport. For our purposes, we treated each of the 341 prefecture-level cities in mainland China as a single destination (Yang and Wong 2012). Under the Chinese governmental system, each city has its own administrative tourism unit to supervise local tourism development, conduct destination marketing, and oversee tourism service quality. To measure the three destination-specific characteristics, we (1) defined the administrative boundary of each city as a geographic destination boundary; (2) geo-referenced the location of each city center from http://www.gpsspg.com/; (3) and used road density as a measure of with-in destination transport (Chhetri et al. 2017). Road density data for each city were obtained from the Chinese Regional Economic Census Yearbook (Sheng and Yan 2013), and we standardized this variable to range between 0 and 1 such that
In our ABM simulation, we focused on visitor agents’ attraction choices. By noting the destinations where these attractions are located, we could observe destination choice indirectly. As a “point” object in the ABM environment, each attraction is associated with two major characteristics: geographic location and tour time for a typical visitor (Figure 1). In this study, 1,990 4A and 5A scenic spots (1,843 4A spots and 147 5A spots) were included as attractions. These scenic spots are evaluated and monitored by national and provincial tourism administrative units according to a set of predefined rules, and they represent first-class visitor attractions in China. Moreover, other types of well-established attractions, such as World Heritage Sites and national parks, are endowed with a 4A or 5A designation. These 1,990 attractions cover a broad spectrum of attraction types, including natural scenic areas, cultural heritage sites, amusement parks, and museum and recreational facilities. Notably, to serve the burgeoning Chinese tourism demand, the number of 4A and 5A designations are growing rapidly. Therefore, the growing competition across these attractions undoubtedly has a significant impact on the simulation results. For instance, after the opening of Shanghai Disneyland in 2016, travel agencies allocate more time in Shanghai than before for package tours in the Yangtze River Delta region, leading to a shortened tour time at other destinations.
Detailed information about each attraction (e.g., ticket price) can be found in the Chinese Tourist Attraction Development Report (Wu 2013). To measure two attraction-specific characteristics, we (1) geo-referenced each attraction as a single point based on its geographic coordinates from http://www.gpsspg.com/ and (2) collected information on attractions’ tour times for a typical visitor. Data on tour time spent in attractions were collected from 8,300 online records of package tour routes offered by the top 100 Chinese travel agencies (conducted in July–December 2012). If multiple tour times were found for an attraction, we used the mode value. Statistically, the tour time in attraction
According to official tourism statistics from 341 cities in 2012, the total number of domestic visitor arrivals was 6.865 billion. Note that this number is higher than the nationwide statistics on domestic visitors (which is nearly 2.957 billion) due to double-counting at the city level. Each city was expected to receive an average of 20.13 million domestic visitors. Because of computational power limitations, we assumed each single visitor agent to represent 30,000 actual visitors in the ABM simulation. The corresponding number of visitor agents for each city could, therefore, be determined by the number of actual visitors. For example, we assigned a total of 919, 836, and 134 visitor agents to Beijing, Shanghai, and Guangzhou, respectively, and the total number of assigned visitor agents for mainland China was 22,833. Note that not all of these agents are multidestination travelers, and they share different tripographic characteristics in terms of duration of stay, travel distance, motivation. Based on this sample of agents, this article specifically focuses on calculating the total cross-city frequency of these agents between 341 Chinese cities as a measure of the tourism spillover effect.
Spatial Spillover Measures
From a demand-side perspective, visitors’ multidestination travel plays a lead role in spatial spillover effects in visitor flows (Yang and Wong 2012). As a specific type of spatial interaction, spillover effects can be measured by the frequency of cross-boundary travel between destinations. Following this idea, we developed three indexes to measure spillover effects: inbound cross-boundary frequency of spillover receivers, outbound cross-boundary frequency of spillover generators, and total cross-boundary frequency (Li et al. 2011).
Inbound cross-boundary frequency is specified as Outbound cross-boundary frequency is specified as Total cross-boundary frequency is specified as
In the extant literature, multiequation models and spatial econometric models have captured only inbound tourism spillovers to spillover receivers, akin to the inbound cross-boundary frequency
Time Spending of Agents
An accurate understanding of visitor movement across destinations involves both spatial and temporal dimensions. A visitor agent’s time spent on different activities will shape a tour’s utility (to be detailed in the next subsection). Time constraints underlie agents’ decisions to terminate a multidestination tour or not (Yang, Fik, and Zhang 2013). Therefore, as shown in Figure 1, we need to specify agents’ time allocation for different types of activities during multidestination travel.
Destination duration of stay
We estimated a visitor agent’s total duration of stay as a function of travel distance from his or her place of origin to a destination (Zalatan 1996). Based on a data set of 7,765 tours provided by the national top 100 travel agencies in China from July to December 2012 (see Figure 2), we estimated the relationship between duration of stay (

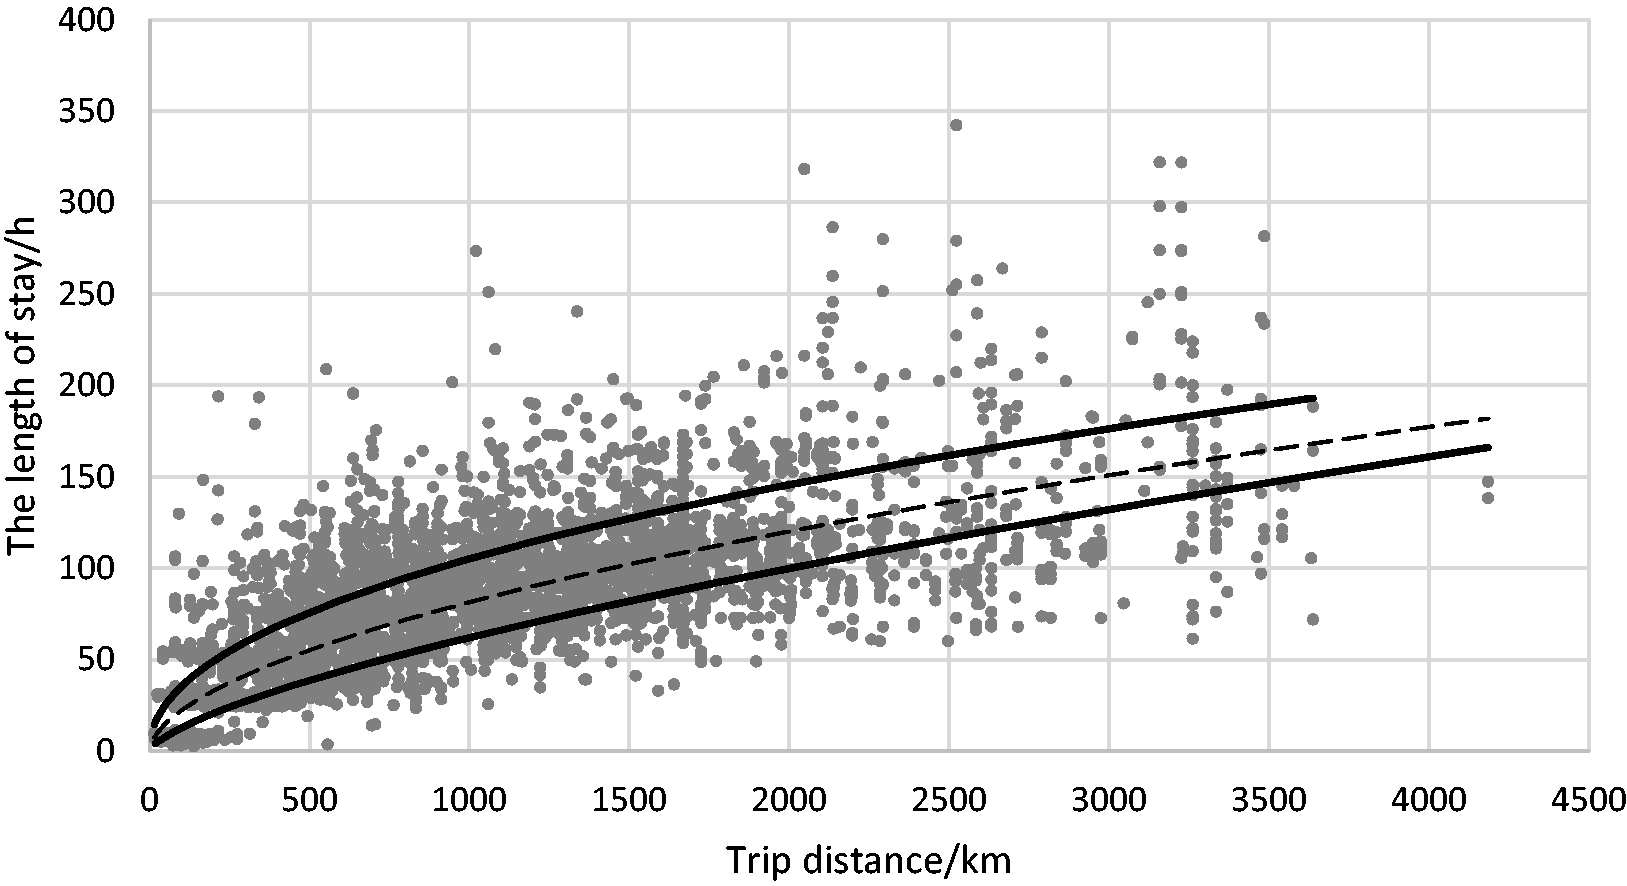
Length of stay in a tourist destination and travel distance.
To predict duration of stay using Equation 1, we needed each visitor agent’s travel distance in a given destination. In our ABM environment, a visitor in a destination could come from any other of the 341 Chinese cities in the sample, including the destination city itself. Because of a lack of relevant statistical and survey data, visitor origin market share was estimated based on a destination-specific gravity-type model suggested by Sen and Smith (1995), defined as follows:

Agents’ time allocation
As noted earlier, visitors devote their total time in a destination to different activities. We separated the total duration of stay in a destination

We collected data on tour time (
Agents’ Decision-Making Rules
In this subsection, we discuss and explain the decision-making rules specified for visitor agents in the ABM simulation. As shown in Figure 1, visitor agents make decisions on attraction choices based on utility maximization under a set of spatial-temporal constraints. According to a classical visitor market survey conducted in the 1990s, most Chinese domestic visitors will limit their tourism activities within a 250-km radius from their primary destination (Wu et al. 1997). More recent geo-computation results in the 2000s suggested that a multidestination visitor will not choose a subsequent destination more than 300 km away from the original (Li and Wang 2009). Therefore, we defined a spatial constraint of 300 km to encompass visitors’ potential subsequent destination choices (
According to random utility theory, we assumed that visitor agents choose attractions based on utility (
In this study, according to different utility-maximization decision-making rules based on attraction and destination choices, visitor agents were mainly divided into three hypothetical categories: (1) global optimizers; (2) sequential optimizers; and (3) radial optimizers (see Figure 3). Further diagram of the algorithm for each type can be found in the Appendix.
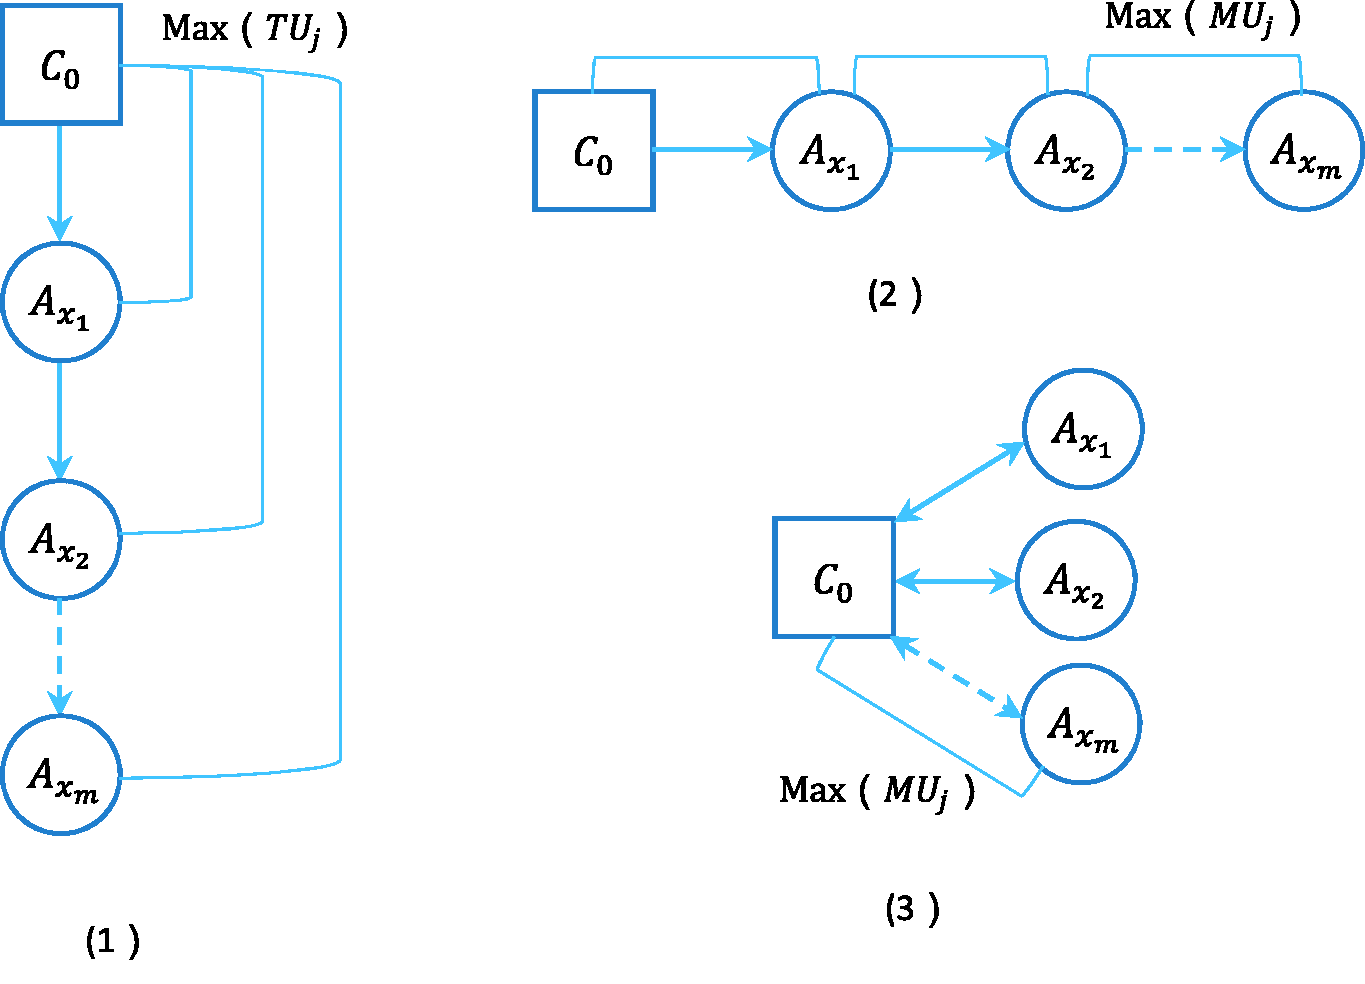
Principle of utility maximization for three types of visitor agents.
Global optimizers apply a global optimization strategy based on their entire tour, and their travel route demonstrates a chainlike pattern. A global optimizer is expected to maximize total trip utility
Sequential optimizers adopt a sequential optimization strategy based on each stage of their tour conditional on previous decisions made. Their travel route also follows a chainlike pattern, but they enjoy more flexibility in making decisions that deviate from their initial tour plan. Rather than seeking a global optimization of the entire tour, sequential optimizers embrace more context-based decision rules at different stages of tour. In our models, utility principle considering proximity and personal preference is chosen here. Notably, the utility is no longer based on the total utility of the whole tour, but on the marginal trip utility of the current position. A sequential optimizer is also likely to seek to maximize marginal trip utility
Radial optimizers employ a local optimization strategy based on side trips from the tour hub. Their travel route displays a spatial pattern similar to a base camp pattern (Lue, Crompton, and Fesenmaier 1993). A typical example of this visitor type is vacation visitors who choose a major destination as the hub and travel to nearby attractions as side trips. Like sequential optimizers, radial optimizers are also expected to maximize marginal trip utility
Results
ABM Simulation Results
Based on the aforementioned ABM simulation rules and algorithms, we simulated Chinese visitor agents’ multidestination travel patterns. Simulations were conducted in Microsoft Visual Basic 6.0 with mapping and spatial analysis completed in ESRI ArcGIS. We carried out multiple simulations, all of which indicated a moderate level of variation of numeric results. For example, based on the results from 10 simulations, the standard deviations of the three spillover measures are small (see supplementary materials), suggesting that our ABM rule specifications are robust. We then conducted 10 simulations for the three visitor agent types and obtained the inbound cross-boundary frequency, outbound cross-boundary frequency, and total cross-boundary frequency of each destination by observing if between-attraction trips crossed destination boundaries. The three spatial spillover measures were calibrated for 341 Chinese cities in our ABM environment, and simulation results were standardized to 100.
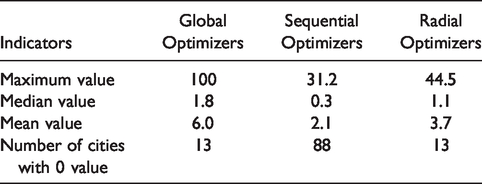
Descriptive statistics for the total cross-boundary frequencies of our 341 sample cities appear in Table 1; inbound and outbound cross-boundary frequency results are available upon request. The three different scenarios show significant variations in spillover effects (see Table 1 and Figure 4). The greatest spillover effect applies to global optimizers, followed by radial optimizers and then sequential optimizers. More specifically, guided by a global utility maximization strategy, global optimizers are more likely to travel to neighboring destinations compared to other types of agents, thus generating the largest spatial spillover effect in visitor flows. Because many global optimizers are sightseeing visitors attending package tours arranged by travel agencies, their itineraries often consist of top-tier attractions in different destinations rather than less popular visitor excursions in a single destination. As a result, their geographic scope of multidestination travel covers a larger area compared to other agent types, a finding consistent with that of Yang, Fik, and Zhang (2017). By adopting a local utility maximization strategy at different stages of travel, sequential optimizers are more apt to limit place-to-place travel to a smaller geographic scope. Geographic proximity is, therefore, a primary concern when sequential optimizers choose a subsequent attraction, as they are generally unlikely to travel across destinations to visit other attractions by maximizing a marginal utility. As a result, sequential optimizers’ spatial spillover effects are comparatively small. Lastly, although radial optimizers also employ a local utility maximization strategy, their side trips from the travel hub may bring them to attractions in another destination entirely, thereby generating more spillover than sequential optimizers but less than global optimizers.
Descriptive Statistics of Total Cross-Boundary Frequencies of 341 Cities.
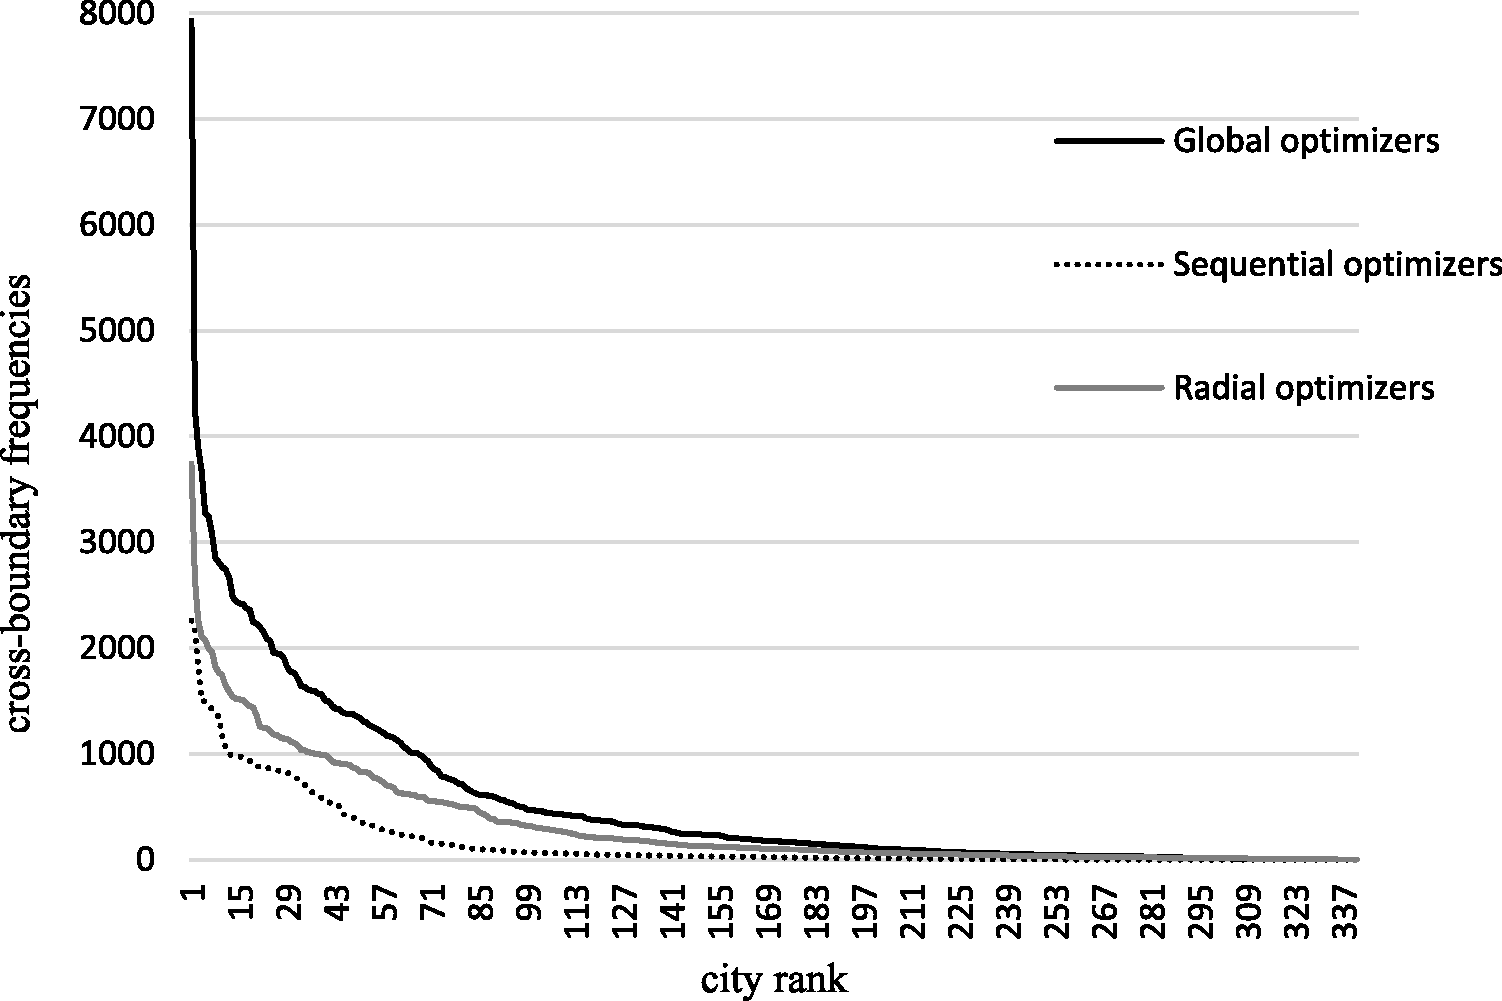
Rank-size curves of total cross-boundary frequencies of 341 cities.
Figure 5 depicts the total cross-boundary frequency for each visitor agent type across 341 Chinese cities. The map classifies cities into four categories (i.e., by rank) based on the following frequencies: top 25%, top 25%-50%, bottom 50% without 0 value, and 0 value. Also, Kendall’s W test is 0.796 on the ranking results from three different simulations, suggesting an ideal level of consistency across different ranking results. Overall, the three maps in Figure 5 demonstrate a clear east–west divide with regard to the magnitude of spillover effects: most cities with a 0 value are located in the west, whereas most cities with top 25% values are located in the east. A possible explanation for this pattern is that most attractions in our ABM environment are located in the east with better-developed public transport systems (i.e., road and rail) than in the west. Efficient transportation facilitates multidestination travel via shorter travel times.
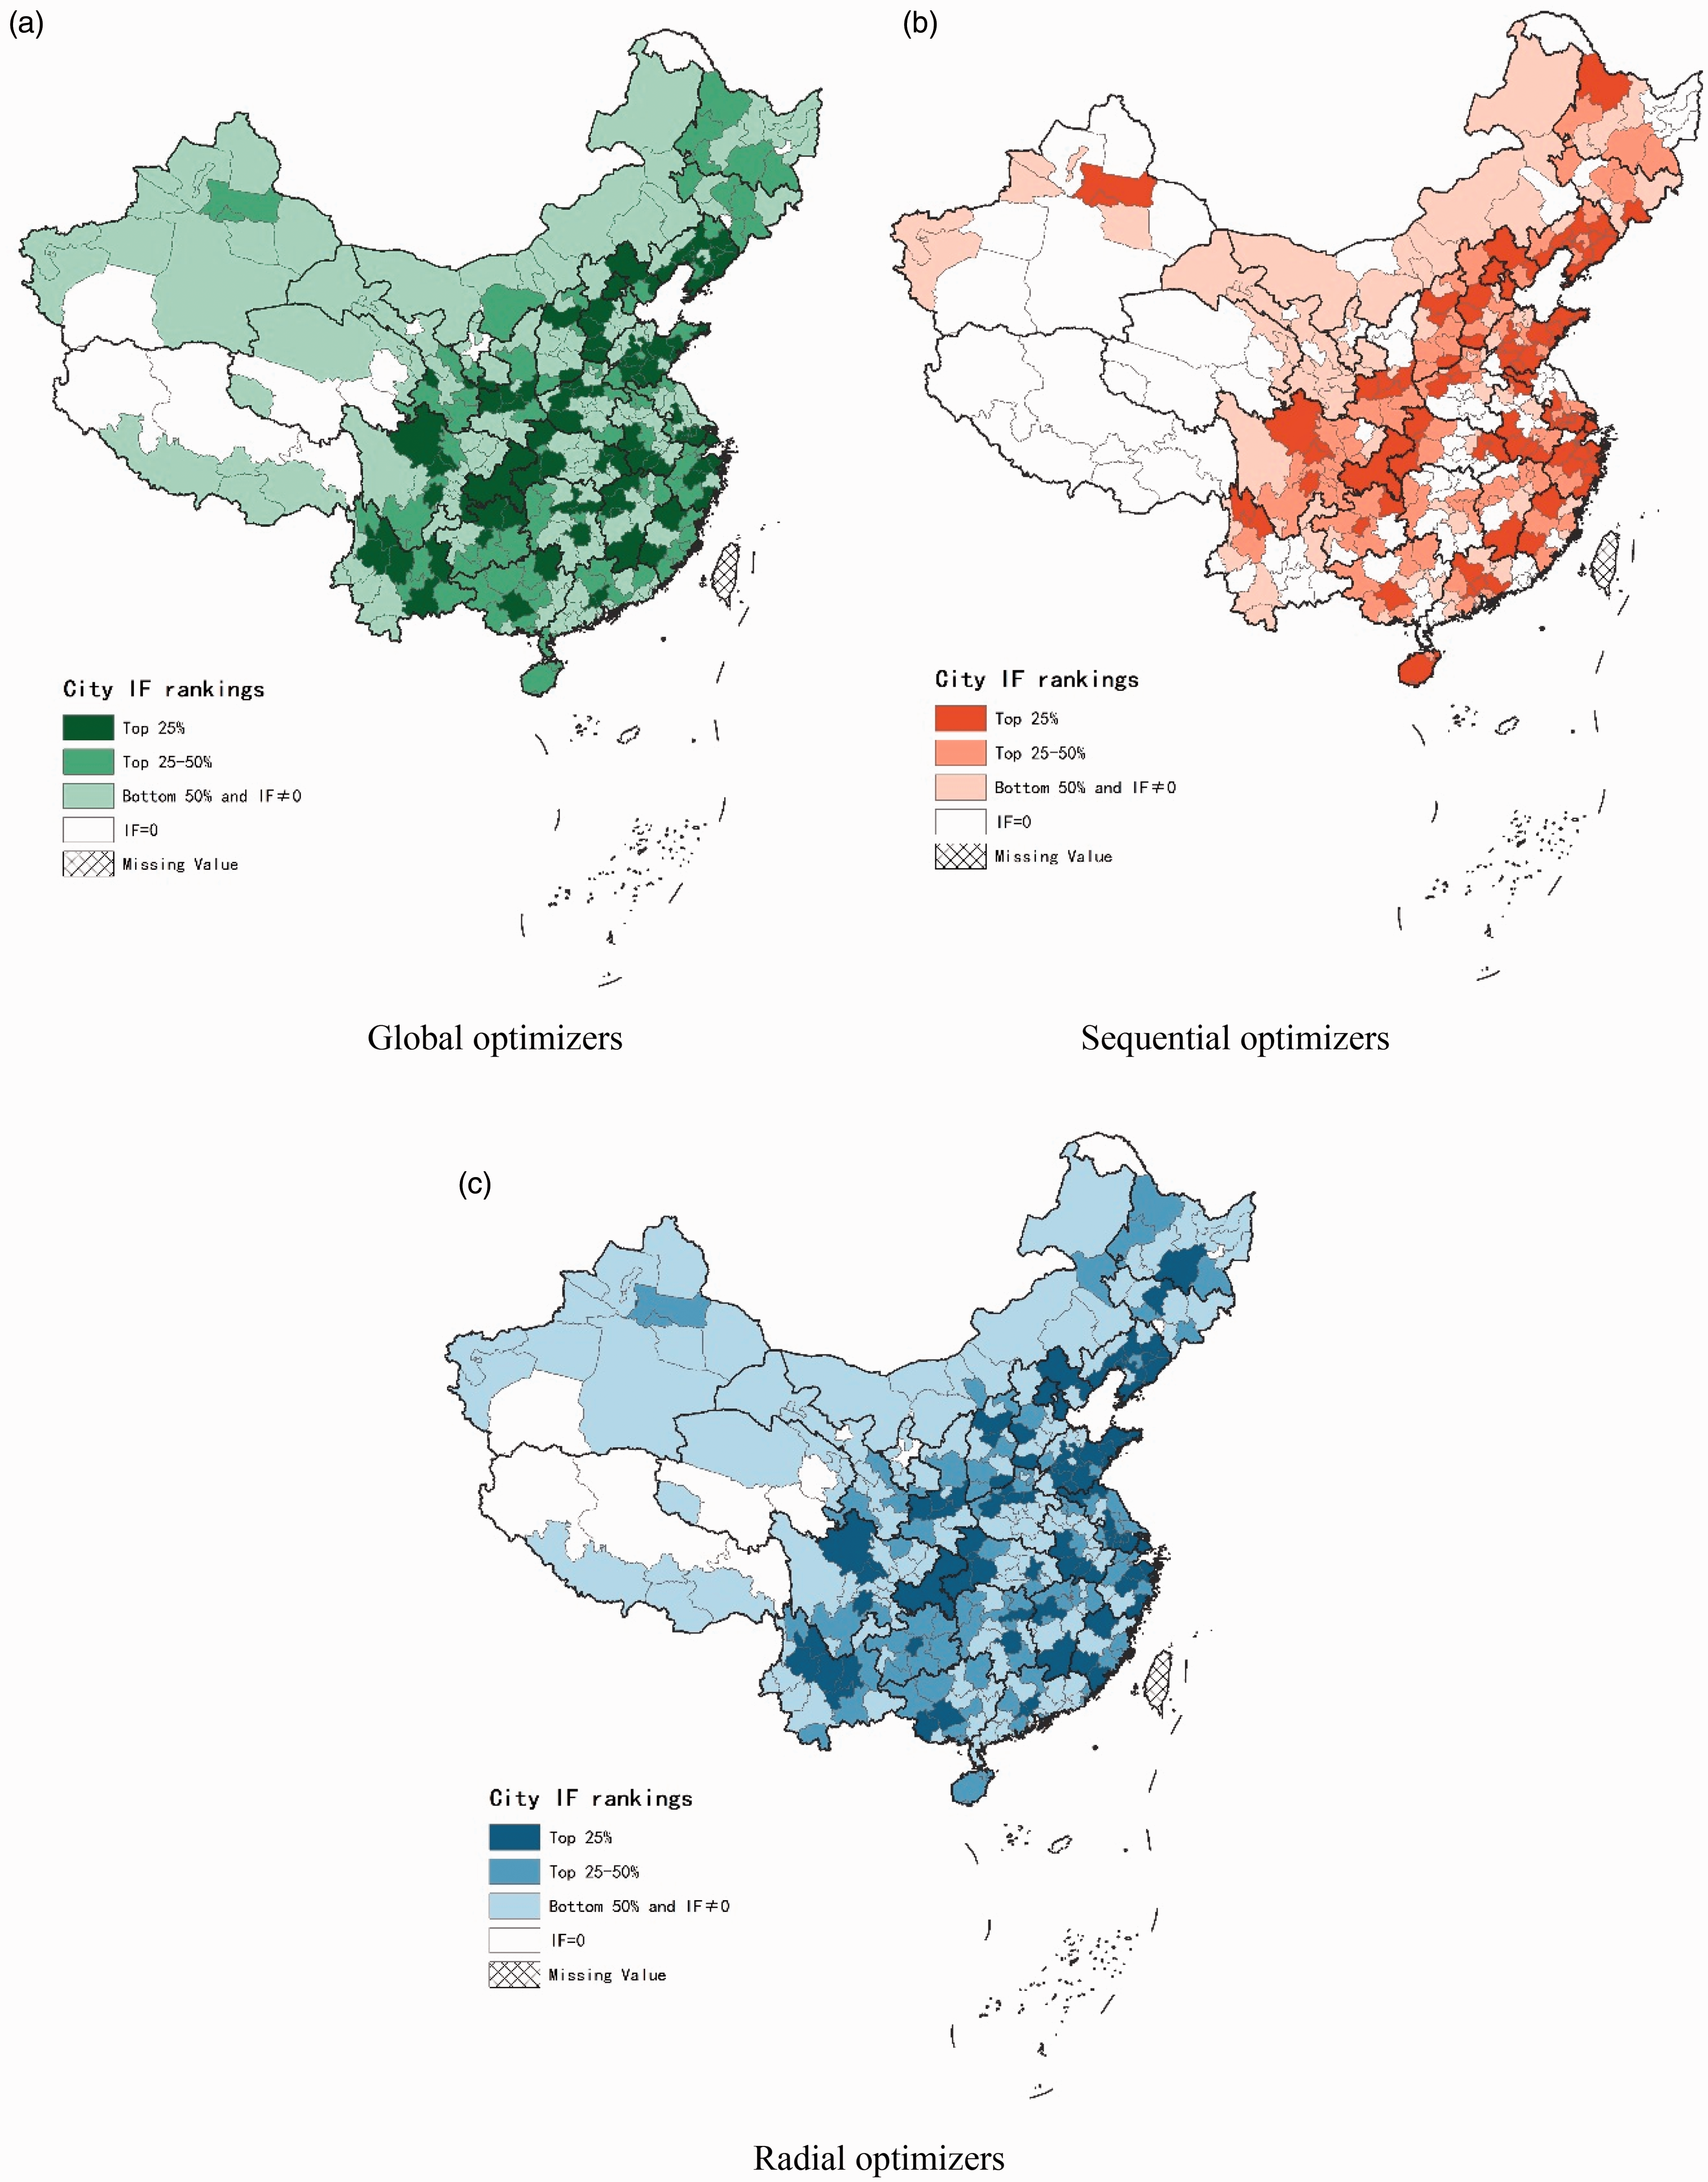
Spatial spillover effects measured by total cross-boundary frequency in Chinese cities.
We also identified those cities where spillover rankings shifted depending on visitor agent type (see Figure 6). It is worth noting that cities’ rankings remained relatively stable across different agent types for the most part, with 51.9% of cities retaining a consistent rank from global to sequential optimizers, 74.8% from global to radial optimizers, and 55.4% from radial to global optimizers. Among cities with shifting ranks, we found that 22.9% of cities were ranked one level higher from sequential to global optimizers, and 22.0% of cities were ranked one level higher from sequential to radial optimizers. In general, the spillover effects from global and radial optimizers demonstrated a similar pattern across all 341 cities. Figure 6 indicates the spatial spillover of cities with changing rankings. The rankings of most cities in northwestern China remained consistent regardless of agent type, implying that different categories of visitors in this area contribute to similar levels of spillover effects in visitor flows. More notably, as shown in Figure 6 (a) and (c), we found that compared to sequential optimizers, global and radial optimizers contributed a substantially higher level of spillover in the eastern part of Yunnan province (southwestern China). Similar patterns were found in three to four cities in Hunan, Hubei, and Jiangxi, all of which are located along the Yangtze River. On the other hand, we found several cities in Sichuan province to have a lower spillover ranking for global and radial optimizers compared to sequential optimizers. Taken together, our results suggest that spillover effects depend on the type of visitor agents visiting different areas: some may contribute to a greater extent of spatial spillover than others.
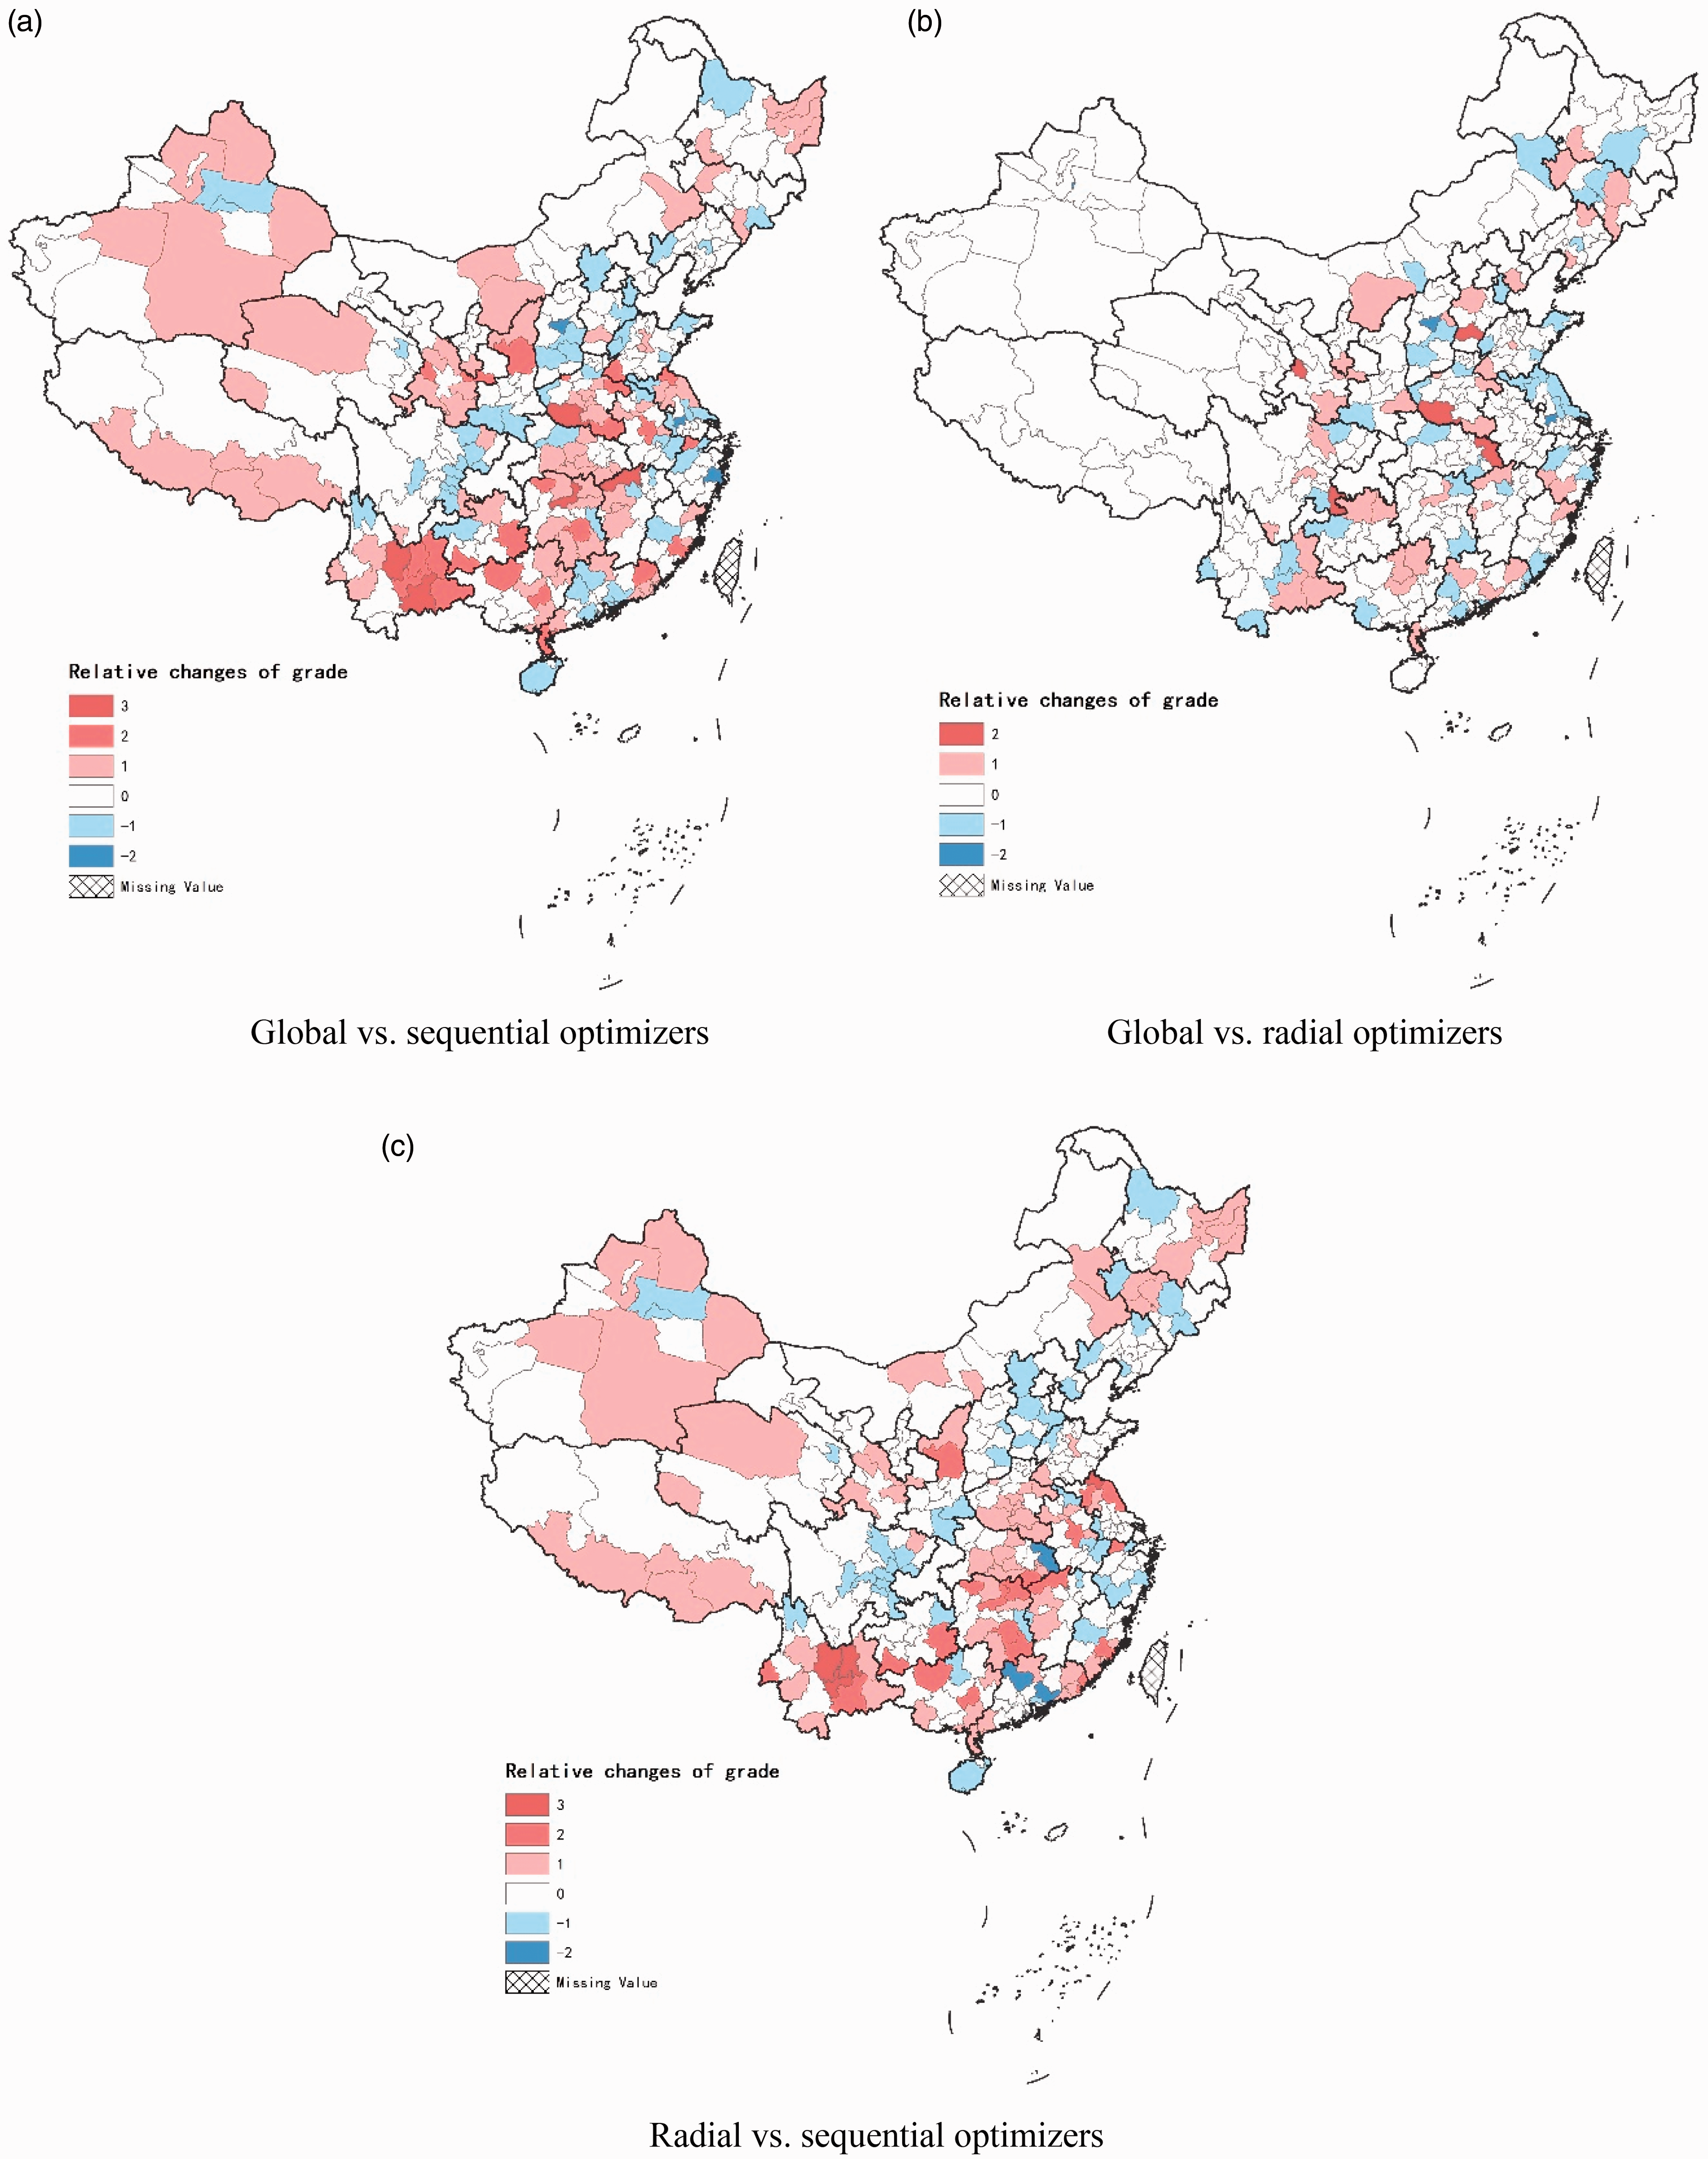
Ranking shifts in cities based on different agent types.
After recognizing the spillover effects contributed by different types of visitor agents, we aggregated the effects to calculate the total spillover effect contributed by all three types. As shown in Figure 5, our study included cities with the top 25% highest spillover measures in the “largest spillover” category. To calculate the total effect, we counted the number of times a city was listed in the top 25% for each type of visitor agent. If a city fell into the largest spillover category for all three visitor agent types, it was assigned a value of 3 and deemed to have the strongest visitor spillover when interacting with nearby cities. Based on this criterion, 61 Chinese cities had a value of 3. We defined other cities similarly, assigning a value of 2 to those with the largest spillovers for two of three visitor agent types (20 cities) and a value of 1 to those with the largest spillovers for any one visitor agent type (32 cities). Remaining cities were assigned a value of 0 when mapping the overall level of spillover effect in visitor flows.
Figure 7 presents a map of the overall level of spillover effect in visitor flows across 341 Chinese cities. Many cities with strong overall spillover effects are located in the eastern part of China. Compared with cities in the western part of China, eastern cities are typically covering smaller geographic areas with fewer attraction spots; hence, the spillover effects can be more intense because of the higher possibility to travel across city boundary to other cities in a multidestination trip. Moreover, the map highlights three regions that include several cities with notably strong spillover effects: the Bohai Rim region (northern China), the Yangtze River Delta region (eastern China), and the Sichuan and Chongqing region (southwestern China). Interestingly, the four Chinese municipalities are located in these four regions with Beijing and Tianjin in the Bohai Rim region, Shanghai in the Yangtze River Delta region, and Chongqing in the Sichuan and Chongqing region.

Overall spatial spillover effect in visitor flows of Chinese cities.
Result Validation with ESDA
Result validation is an essential part of ABM simulation that allows researchers to verify the validity and credibility of results using alternative methods or data sets (Nicholls, Amelung, and Student 2016; Gilbert 2008). In this study, we chose to use the ESDA method for a validation check. ESDA spatial statistics reflect spatial associations between geographic units (Majewska 2015). Several studies have applied ESDA tools and the local Moran’s I statistic, a correlation-type measure, to understand the association between visitor flows to one destination and nearby destinations when investigating the spatial dependence of visitor flows (Majewska 2015; Kang, Kim, and Nicholls 2014). This spatial statistic is similar to the spillover coefficient of spatial econometric models without any control variables.
We calculated local Moran’s I statistics for all sampled Chinese cities based on domestic visitor arrival numbers from 2012 as they appeared in the China Statistical Yearbook for Regional Economy 2013. Because ESDA results are particularly sensitive to spatial weighting matrix when defining spillover scope (Le Gallo and Ertur 2003), we chose different matrices to check the robustness of results, such as the contiguity matrix and nearest-neighbor matrix with n = 5, 10, and 15 (Anselin 2006). The results, including the significance levels of permutation tests, appear in the Appendix (Figure A4). In general, the ESDA results echo those of our ABM simulation (Figure 7). The results of local Moran’s I statistics highlight three major areas that fall into the “high-high” category, which indicates a high level of spatial dependence of visitor flows between nearby cities with high levels of visitor arrivals. These areas include the Bohai Rim region, the Yangtze River Delta region, and the region around Chongqing, all of which were identified in our ABM simulation results.
Conclusion
In this study, we conducted an ABM simulation to measure the spillover effect in visitor flows between destinations by measuring the frequency with which visitors travel across destination boundaries. Based on a utility maximization framework, visitor agents were expected to select an attraction to maximize utility under certain spatial-temporal constraints. We proposed a typology consisting of three types of visitors to examine the heterogeneity of visitor behavior and decision-making rules: global optimizers, sequential optimizers, and radial optimizers. Using a simulation environment of 341 Chinese cities and 1,990 4A and 5A attractions, we calibrated the spillover effect of each city based on ABM simulation results. Our findings demonstrated a clear “east–west” divide: most western cities in China were characterized by low levels of spatial spillover, whereas eastern cities in the sample were found to have higher spillovers in visitor flows. Moreover, we found three regions to have the highest spillover effects: the Bohai Rim region, the Yangtze River Delta region, and the Sichuan and Chongqing region. Lastly, we compared the ABM results to those of ESDA and were able to confirm the validity of our results.
Our research contributes to the current tourism literature in several ways. First, this study represents a pioneering attempt to apply ABM to individual visitors’ multidestination travel behavior and spatial spillover effects in visitor flows as an aggregate outcome. We demonstrated the usefulness of ABM in capturing the complexity and heterogeneity of spatial spillover effects. In particular, we focused on spillover effects, a macro-level indicator, by investigating visitors’ micro-level behavior. Second, we proposed a visitor typology in a multidestination travel context with three hypothetical visitor categories (global optimizers, sequential optimizers, and radial optimizers). Unlike the previous typology that looked exclusively at the spatial pattern of travel routes, our typology identified distinct decision-making rules leveraged by different types of visitors. Therefore, this typology is well suited to examining various results following visitors’ decision-making processes, such as travel routes, expenditure patterns, and duration of stay.
Last but not least, the spillover measure we presented owns some advantages over those available through multiequation models and spatial econometric models. Specifically, on the one hand, multiequation models are proficient in measuring spillovers between a limited number of destinations. When the number of destination increases, the parameter to be estimated increases exponentially, leading to severe issues on model identification and estimates’ reliability. On the other hand, although spatial econometric models can calibrate spillovers across destinations from the spatially lagged variables, the specification of spatial lags is predefined and fixed for all destination pairs, and therefore, they can hardly capture the nuanced spillover channels from the spatial lag matrix. Compared to these two models, our ABM-based measure captures received and generated spillovers. Our model is, therefore, more feasible given that spillover is a bilateral spatial interaction (Fotheringham and O’Kelly 1989).
The results of this study carry significant implications for tourism policy. First and foremost, our empirical results provided vital insights into the potential of destination cooperation from a spillover perspective. Although a large number of Chinese destinations have been engaging in interdestination cooperation in the course of tourism development, how to select partners could be a critical issue for them. Considering that spillover effects were found to be location-specific, if the magnitude of spillover effects (calculated by our ABM model) is modest, the effectiveness and prospects of regional tourism cooperation should be questioned. For example, according to our results, many western Chinese cities were characterized by low spillover levels; thus, it would be unwise to invest heavily on interdestination collaboration in this region. An effective way to promote regional tourism cooperation and regional tourism integration is to design and develop a number of cross-regional tourism routes and organize package tourism products through travel agencies and other organizations.
Second, as demonstrated in the simulation results, the existence and prevalence of spillover effects offer many opportunities for interdestination collaboration. Local tourism administrative units should propose specific strategic plans to embrace and internalize spillover effects from neighboring destinations. Our results suggested that the magnitude of spillover effects depends on a destination’s visitor portfolio (i.e., the types of visitors that destination mostly serves), and if higher spillover effects characterize the region, magnifying spillovers would be helpful for the policy makers to promote regional tourism development. Therefore, leveraging these spillovers can be particularly beneficial for poverty reduction purposes. For example, we discovered that sightseeing visitors attending package tours (i.e., global optimizers) were especially helpful in magnifying spillovers in the Jiuzhaigou Valley in Aba-Chengdu area, Sichuan province and Shangri-La city in Diqing-Lijiang-Dali area, Yunnan province, respectively, which are typical regions with a less developed local economy. Moreover, our simulation offers a valuable tool with which local tourism administrative units and practitioners can conduct “what-if” simulations and seize opportunities for cross-destination collaboration. For example, “what-if” simulations can be carried out to understand how spillover effects will respond to the establishment of more visitor attractions, the increase of tour time in attractions, and the change of visitor portfolio.
The outbreak of the COVID-19 pandemic can significantly shape the strength and scope of the spillover effects of tourism. With this unprecedented challenge to the tourism industry worldwide, the plummeting demand and government regulation of human mobility jeopardize the sustainability of the tourism industry and bring in long-term uncertainty even after the bounce-back. Along with the COVID-19 shock, the stifled long-haul travel demand will substantially weaken the spillover effects of tourism and shrink the scope of spillovers. In terms of the three types of tourists we discussed, global optimizers are more likely to visit fewer attractions with longer duration in each to reduce the potential health risk. This will ultimately lead to a lower level of spillovers. Regarding radial optimizers, they may reduce the scope of activities around the hub, which results in a smaller geographic scope of spillovers. Lastly, sequential optimizers may end up with the decision to return home earlier with fewer stops on tour. In the post-COVID-19 period, the spillover will still play a substantial role to leveraging and internalizing the economic impacts of tourism across destinations. Despite their relative promise, our results are not without limitations. First, we did not consider visitors who adopt a hybrid decision-making process by using more than one strategy from our predetermined categories. Therefore, we recommend that future studies consider hybrid decision-making strategies for visitors. Second, the ABM we specified heavily depends on the utility maximization decision rules. Some alternative rules, such as the regret minimization rules (Masiero, Yang, and Qiu 2019), may apply, and more importantly, the assumption of perfect rationality is highly questionable when people are making the decision. In the context of tourism, we may observe cognitive biases (Wattanacharoensil and La-ornual 2019) and irrationalities (Min and Juan 2011), which complicates the specification of decision-making rules. Third, although Chinese visitors’ multidestination travel patterns were simulated based on the real data of scenic spots and cities, three hypothetical visitor categories cannot fully reflect the visitor behavior in real life. Thus, further studies can develop a more comprehensive visitor typology to mimic the real situation in the context of multidestination travel. Fourth, the visitors’ attraction selection rules based on the cost–utility principle downplays the role of cost factors associated with the ticket price and fails to comprehensively capture visitors’ heterogeneity in decision making based on age, gender, occupation, and educational level. Regarding utility factors, we only used the tour time in attraction to proxy attraction’s appeal; therefore, the measure overlooked the other utility factors like accessibility, reputation, and attraction type, which deserve further exploration. Fifth, we predetermined a visitor’s category-specific tour time without looking into the heterogeneity across individual visitors. In the future study, the tour time can be simulated randomly with a conditional distribution based on some individual characteristics like age, travel motivation, and group size. Although the ABM model, by its nature, lays a micro-analysis foundation with simple rules, the results aggregated at the macro-level can provide more convincing and nuanced results that are of greater significance for the related stakeholders compared to those without solid microfoundations.
Supplemental Material
sj-pdf-1-jtr-10.1177_0047287520930105 - Supplemental material for Agent-Based Modeling of Spatial Spillover Effects in Visitor Flows
Supplemental material, sj-pdf-1-jtr-10.1177_0047287520930105 for Agent-Based Modeling of Spatial Spillover Effects in Visitor Flows by Shan Li, Yang Yang Zhangqi Zhong and Xiaoli Tang in Journal of Travel Research
Supplemental Material
sj-xlsx-2-jtr-10.1177_0047287520930105 - Supplemental material for Agent-Based Modeling of Spatial Spillover Effects in Visitor Flows
Supplemental material, sj-xlsx-3-jtr-10.1177_0047287520930105 for Agent-Based Modeling of Spatial Spillover Effects in Visitor Flows by Shan Li, Yang Yang Zhangqi Zhong and Xiaoli Tang in Journal of Travel Research
Supplemental Material
sj-xlsx-3-jtr-10.1177_0047287520930105 - Supplemental material for Agent-Based Modeling of Spatial Spillover Effects in Visitor Flows
Supplemental material, sj-xlsx-3-jtr-10.1177_0047287520930105 for Agent-Based Modeling of Spatial Spillover Effects in Visitor Flows by Shan Li, Yang Yang Zhangqi Zhong and Xiaoli Tang in Journal of Travel Research
Footnotes
Acknowledgment
The authors thank Huating Liu for data collection and YiWang and Yijing Shen for assistance in cartography.
Declaration of Conflicting Interests
The author(s) declared no potential conflicts of interest with respect to the research, authorship, and/or publication of this article.
Funding
The author(s) disclosed receipt of the following financial support for the research, authorship, and/or publication of this article: This study was supported by the Humanities and Social Sciences Foundation of MOE of China (no. 16YJA790021) and the National Natural Science Foundation of China (no. 41801118).
Author Biographies

Supplemental Material
Supplemental material for this article is available online.
References
Supplementary Material
Please find the following supplemental material available below.
For Open Access articles published under a Creative Commons License, all supplemental material carries the same license as the article it is associated with.
For non-Open Access articles published, all supplemental material carries a non-exclusive license, and permission requests for re-use of supplemental material or any part of supplemental material shall be sent directly to the copyright owner as specified in the copyright notice associated with the article.
