



Abstract
Information systems (IS), such as Internet applications, are widely used by the tourism and travel industry. Extranets, in particular, allow controlled access of outside organizations into a company’s internal systems. In the travel industry, these technological applications are generated and supplied by tour operators and used by travel agents to conduct their business. Use of an extranet is of benefit to a travel operator who gains more revenue if travel agents select or recommend its particular products. This article classifies the attributes of a tour operator’s extranet system in terms of its asymmetric influence on its user (travel agency sales representatives) satisfaction. In addition, a revised version of impact-asymmetry analysis is presented, called asymmetric impact-performance analysis, which is a simple and visual technique that assesses the key attributes for increasing overall user satisfaction.
Introduction
Travel agencies play an intermediary role between suppliers and customers by selling tourism and travel services (such as package tours, flight tickets, hotel reservations, daily tours, guide services, etc.). Tour operators, on the other hand, act like wholesalers through their large-scale purchases of tourism and travel products (such as hotel rooms, flight seats, cruises, etc.) in order to combine them into package deals. As a result, travel agencies and tour operators are very dependent and bound to each other in a kind of distribution channel. For example, the suggestions and guidance of the travel agency staff (sales representatives), from among the numerous package tour alternatives, can be influential on a customer’s decision and at the same time, on sales figures and the market shares of tour operators. Sales representatives often employ tour operators’ extranets to assist in planning purchases for customers. Extranets are Internet-based applications that allow external organizations access to a company’s internal information. In the case of the travel industry, tour operators (suppliers) provide this access to sales representatives via a web-based interface. Thus, sales representatives are no longer just the users but also the “internal customers” of the tour operators (in this study, they are called the “users”) in terms of internal marketing. The satisfaction levels of these users with a tour operator’s extranet encourage them to prefer certain systems above their alternatives. Therefore, tour operators need to identify which extranet attribute(s) should be improved in order to increase user satisfaction for their system. However, identification of the most important extranet attributes in terms of their influences on overall user satisfaction is quite a complex task. This is because some studies have shown that the importance of an attribute for satisfaction varies according to performance level of the attribute (Mittal and Baldasare 1996). That means there is an asymmetric relationship between attribute(s) performance and user satisfaction. The present study introduces an asymmetric impact-performance analysis (AIPA) that shows which extranet attribute(s) should be improved by adapting the approach that there is an asymmetric relationship between attribute(s) performance and overall user satisfaction.
The particular objectives of this study are (1) to classify extranet attributes according to their asymmetric influences on overall user satisfaction, (2) to identify the resource allocation areas for the supplier companies (tour operators) for increasing user satisfaction with AIPA that considers the asymmetric effects of the extranet attributes on user satisfaction.
The remainder of the article proceeds as follows; first, the relationships between tour operators and travel agencies are summarized. Then, the website quality measurements and Webqual™ scale are briefly explained. In the next section, the three-factor theory of customer satisfaction that exhibits the asymmetric relationships between attribute(s) performance and overall satisfaction is explained. In the analyses and results section, in order to answer the research questions, dummy variable regression analysis is used for classifying extranet attributes according to their asymmetric effects on overall user satisfaction. Next, extranet attributes are positioned on the matrix obtained by AIPA. Finally, the findings of the analyses are discussed.
Relationships between Tour Operators and Travel Agencies
Traditionally, tour operators and travel agencies are bound to each other as part of the distribution channels of the travel sector. While wholesaler tour operators package airline seats, hotel rooms, and tours into products that are supplied to travel agencies, travel agents act as intermediaries between tour operators and customers (Barnett and Standing 2001). Consequently, tour operators depend on travel agencies to present, promote, explain, and distribute their products or services to customers (Harrington and Power 2001). In today’s travel industry, “businesses have been moving away from short-term, price-driven transactions toward long-term, collaborative relationships that seek not only cost savings but also quality improvement and high level performance” (Le 2001). In such relationships, partners tend to collaborate with each other (Cheng 2011). In this regard, information systems (IS) instruments have great potential for travel companies in terms of meeting their internal and external customers’ expectations, offering internet-based services and extra value to customers and delivering competitive advantages (Kuttainen, Iliachenko, and Salehi-Sangari 2005; Buhalis 1998, 2004; Panagiotarakis, Maglogiannis, and Kormentzas 2004). In the contemporary e-commerce age, the tour operator’s extranet system is one of the most used information and communication points of travel agency sales representatives. As one of the main platforms of interaction between users and tour operators, the quality of the extranet is expected to directly affect user satisfaction (Zhou and Zhang 2009). Functional, aesthetic, and user-friendly extranets enable travel agents to complete their transactions on time, update customer and product information, and work more efficiently. However, sales representatives may prefer to connect to another supplier’s system, if they perceive that using that system is easier and more functional or beneficial for their work processes. Fundamentally, sales representatives play a vital role in the marketing and sales success of package tours that tour operators offer to the travel marketplace. In this study, the quality of the extranet is assumed to increase sales representatives’ (user) satisfaction and to improve business-to-business relationships among collaborating travel companies.
Website Quality
The number of academic studies on tourism and hospitality industry has increased considerably with the usage of the Internet (Han and Mills 2006). These studies have been reviewed by many scholars. For example, Ip, Law, and Lee (2011) examined 68 website evaluation studies related to tourism and hospitality published between 1996 and 2009 and found that there was no standard method of evaluating websites. Law, Qi, and Buhalis (2010) also reviewed website evaluation studies published between 1996 and 2009, in the tourism and hospitality field, and specified five methodological approaches: counting, automated, numerical computation, user judgment, and combined methods. The counting method identifies the existence of certain website attributes. The user judgment method examines user satisfaction and the automated approach tests the technical performance of certain attributes of a website. The computation method uses a mathematical computation process to produce numeric scores for performance evaluation. However, Law, Qi, and Buhalis (2010) emphasize that the first four approaches have some disadvantages along with their advantages. The combined approach brings together the advantages of these various approaches. In spite of these various approaches, a new method offers a way of assessing the websites of the tourism and hospitality industry and a continuous evaluation of user perception of the websites. This is because user perception of website performance is an important determinant indicating their satisfaction of the website.
The information systems and technology literature includes numerous methods and models that aim to assess the user’s perceptions of website quality such as E-S-QUAL (Parasuraman, Zeithaml and Malhotra 2005), eTailQ (Wolfinbarger and Gilly 2003), PIRQUAL (Francis and White 2002), SITEQUAL (Yoo and Donthu 2001), and WebQual (Loiacono 2000). Among these, Loiacono, Watson, and Goodhue (2007) hierarchical model WebQual is a comprehensive and compatible tool for measuring the website quality of companies that operate on business-to-business (B-to-B) marketplaces. The 12 first-order dimensions (attributes) of the WebQual (informational fit-to-task, tailored communication, online completeness, relative advantage, visual appeal, innovativeness, emotional appeal, consistent image, ease of understanding, intuitive operations, response time, trust) explain the 5 second-order website quality dimensions (usefulness, entertainment, ease of use, response time, trust) of the websites.
WebQual has a conceptual structure that is based on the theory of reasoned action (TRA; Fishbein and Ajzen 1975) and the technology acceptance model (TAM; Davis 1986). The basic assumption of WebQual is that users’ revisit and reuse intentions are the consequence of their overall perception of website quality (Iliachenko 2006). The information obtained from such perspectives usually benefits website designers in their projections about website interfaces. In previous studies, WebQual has been rigorously tested and validated by large sample sizes. In all of the studies, it showed significantly large goodness-of-fit measures (Kim and Stoel 2004; Loiacono, Watson, and Goodhue 2007; Longstreet 2010; Liu and Goodhue 2008) for business-to-customers (B-to-C) electronic commerce (e-commerce) applications (Sigala and Christou 2006; Kim and Stoel 2004). Though extranet usage of travel agency users is voluntary in this study, such as a B-to-C environment; the scale requires further testing within the B-to-B e-commerce environments. Loiacono, Watson, and Goodhue (2007) propose such studies as the natural extension of the original WebQual model. Therefore, we use WebQual to measure user perceptions of the extranet’s quality in this study.
The Three-Factor Theory of Customer Satisfaction
Researchers attempted to identify the most influential website attributes on customer satisfaction levels. They generally employed techniques such as regression analysis (e.g., Jeong, Oh, and Gregoire 2003) and structural equation modeling (e.g., Bai, Law, and Wen 2008) for the identification of the key drivers that influence satisfaction. The assumption underlying such “key driver” models is that there is a symmetric and linear relationship between attribute-level performance and dependent constructs such as overall customer satisfaction. Such assumptions imply that the positive or negative performance of an attribute would have a similar influence on satisfaction (Mittal and Baldasare 1996). However, many studies have reported asymmetric relationships between attribute performance and overall satisfaction (Johnston 1995; Mittal, Ross, and Baldasare 1998; Ting and Chen 2002; Matzler and Sauerwein 2002). Asymmetric relationships are essentially based on two approaches. The first is the prospect theory (Kahneman and Tversky 1979) which suggests that the negative performance of an attribute has a higher impact on overall satisfaction than its positive performance (Kahneman and Tversky 1979). The second is the memorability of positive versus negative events (Mittal, Ross, and Baldasare 1998), which assumes that “attributes with negative performance are more perceptually salient than attributes with positive performance, and attributes with negative performance have a greater impact on the cumulative satisfaction judgment of the customers” (Mittal, Ross, and Baldasare 1998).
A study by Kano (1984) was the first to refer to Herzberg et al.’s (1959) two-factor theory of job satisfaction to categorize quality attributes into three groups according to their asymmetric influences on overall customer satisfaction (Figure 1). While some attributes (1) increase satisfaction when present but do not increase dissatisfaction when absent (excitement factors), some (2) increase dissatisfaction when absent but do not increase satisfaction when present (basic factors), and others (3) influence both satisfaction and dissatisfaction to the extent that they are present or absent (performance factors). The Kano Model is also known as the three-factor theory of customer satisfaction by some researchers (Matzler, Sauerwein, and Heischmidt 2003; Deng, Kuo, and Chen 2008).
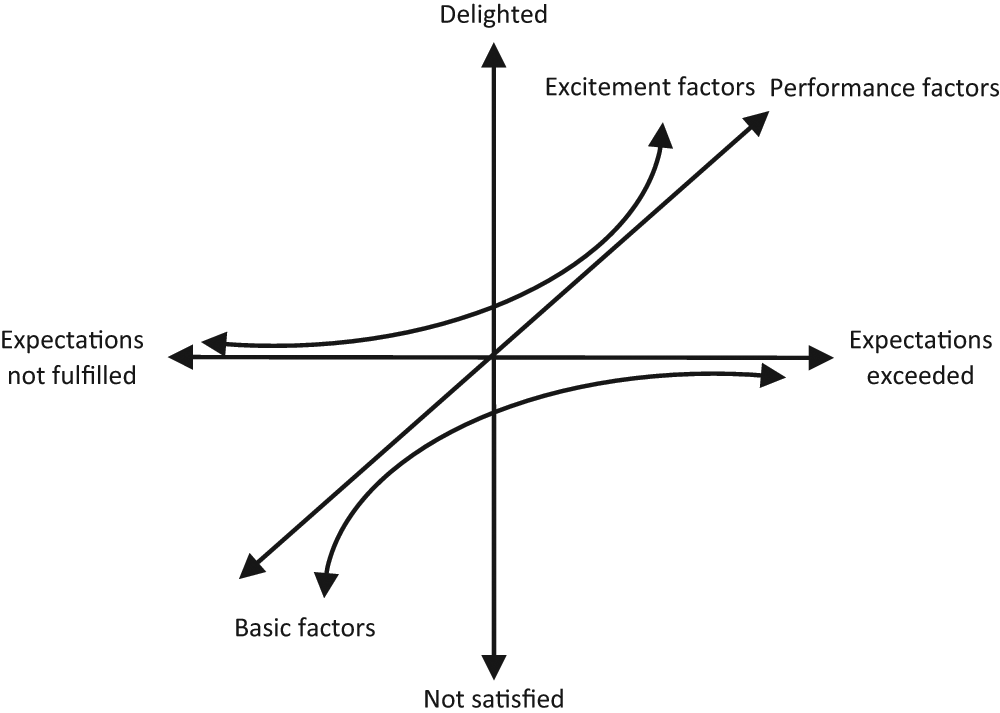
The three-factor theory of customer satisfaction
The asymmetric relationships between attribute performance and overall customer satisfaction have been verified by numerous studies, including studies of the health services (Mittal, Ross, and Baldasare 1998; Mittal and Baldasare 1996), ski resorts (Füller and Matzler 2008), banking (Johnston 1995), tourist destinations (Füller and Matzler 2008; Fuchs and Weiermair 2004), business-to-business relationships (Matzler et al. 2004), online shopping (Falk, Hammerschmidt, and Schepers 2010), websites (Zhang and Dran 2002), and destination websites (Kim and Fesenmaier 2008). However, there is limited research on the quality of extranets produced by tour operators and used by their travel agencies.
Methodology
Study data were collected by surveying extranet users working as sales representatives in the intermediary travel agencies, located in Ukraine, Bulgaria, and Kazakhstan, of a multinational tour operator located in Antalya, Turkey. The tour operator which co-operated with the researchers in this study controls 7% of total foreign tourist arrivals in Antalya, Turkey (the arrivals are mostly from the Commonwealth of Independent States-C.I.S.). The tour operator’s extranet obviously has different functions than its homepage. These functions are classified in Feinberg and Kadam’s (2002) perspective and it is seen that (except for the membership and complaint facilities of the homepage) similar functions are offered to customers and extranet users by the tour operator on its website homepage and extranet.
Procedure
A major difficulty in cross-national research is how to establish the equivalence of scales and measures used to obtain data from different countries (Malhotra 2004). In this study, translation equivalence was ensured by using back-translation. In addition, a pilot test was conducted with 30 extranet users of the tour operator in three countries to detect potential sources of bias and translation equivalence (Douglas and Craig 2006). The similarity of the demographic characteristics of the three countries’ respondents (see Table 1) shows sample equivalence. Data collection equivalence was ensured by using the same method in each country. After the pilot test, revised questionnaires were sent out by the quality department manager of the tour operator with an e-mail message to travel agency managers in the Ukraine, Bulgaria, and Kazakhstan; these managers then e-mailed the questionnaires to sales representatives at their offices with a cover letter explaining the aim and process of the study. Completed questionnaires were collected by the travel agency managers and returned to the e-mail address of the quality department manager, who transmitted all files for the present study at the end of this process.
Demographics of the Respondents by Their Nationalities

The tour operator works in association with 92 travel agencies in Bulgaria, 80 in the Ukraine, and 70 in Kazakhstan. The average number of sales representatives is determined as 2 for each agency, and the total number of the sales representatives is calculated as 2 × 242 (total number of the agencies) = 484. During a three-month period, a total of 336 fully completed questionnaires (127 from Bulgaria, 101 from Ukraine, and 108 from Kazakhstan) were obtained—a response rate of 69%.
Measures
The present study used Loiacono’s (2000) WebQual scale to measure the quality of the extranet system produced by the tour operator. The overall satisfaction of the users was measured by four items (“In general, I am satisfied with the service I have received from X tour operator’s extranet”; “The experience that I have had with this extranet has been satisfactory”; “I think that my travel agency made the correct decision to use this extranet”; “In general terms, I am satisfied with the way that this extranet has carried out transactions”), which were obtained from a previous study by Flavian, Guinaliu, and Gurrea (2006). Responses were indicated on a 5-point Likert-type scale anchored at the end points by “strongly disagree” and “strongly agree.” In addition, the demographic characteristics of the respondents were identified by six items (gender, age, nationality, education level, computer experience, and experience of software).
Participants
The demographic characteristics of the respondents are shown in Table 1. The study group (n = 336) is composed of 101 (30.1%) Ukrainian, 127 (37.8%) Bulgarian, and 108 (32.1%) Kazakh respondents. In terms of gender, 75.9% were female and 24.1% male. The majority of the respondents (76%) were university graduates. In terms of age, 124 (36.9%) of the respondents were between 26 and 33 years old, and 68 (20.2%) respondents were aged 40 or older. The majority of the sample (66.6%) had more than three years of experience using software and 92.5% of the sample had more than five years of experience using computers.
Analyses and Results
First, factor analysis was conducted in order to determine the structure of the items and the dimensions of WebQual for further analysis. The factor analysis was based on the principal components analysis with quartimax rotation. Items that had communality below .5 or loaded highly on more than one component were not retained (Bernstein, Garbin, and Teng 1988). The remaining 26 statements that were employed to measure extranet quality were classified under six dimensions, namely Usefulness, Relative Advantage, Entertainment, Ease of Use, Response Time, and Trust. All dimensions had eigenvalues exceeding 1 and factor loadings exceeding 0.5 (except “I find X Tour operator’s extranet easy to use,” 0.485). Moreover, the cumulative variance was found to be 66.28%. The Cronbach’s α values for the dimensions of WebQual (Usefulness, Relative advantage, Entertainment, Ease of use, Response time, Trust) ranged from 0.729 to 0.899 (Table 2). The results show that the scale has a good level of reliability (Hair et al. 1998).
Results of the Explanatory Factor Analysis

R = item is reversed before analysis.
Whereas Loiacono (2000) proposed 12 first-order and 5 second-order dimensions for the WebQual scale, in the present study, factor analysis produced 6 dimensions that explained 66.3% of the total variance. In the original scale, 5 second-order dimensions were obtained. By contrast, Kim and Stoel (2004) compared 5 alternative models of WebQual using structural equation modelling in order to test its validity and reliability as well as its dimensional hierarchy. One of the alternative models obtained 6 second-order dimensions, which were as follows: (1) Information (information fit to task, tailored communication); (2) Transaction (online completeness, relative advantage); (3) Entertainment (visual appeal, innovativeness, emotional appeal); (4) Consistent Image (consistent image); (5) Ease of Use (ease of understanding, intuitive operations, response time); and (6) Trust (trust). Thus, in addition to the 5 subdimensions, 6 subdimensions can be obtained, depending on the analysis techniques used. Many researchers have also suggested that the dimensions of website quality may differ by the types of products or retailers (Peterson, Balasubramanian, and Bronnenberg 1997).
Second, multiple regression analysis was performed by using the factor scores of the WebQual dimensions (attributes) as independent variables and the mean value of the four overall user satisfaction items (4.16; SD = 0.524) as the dependent variable to test the symmetric relationship. The overall model (F = 27.294, p = .000) and all attributes’ coefficients were significant, while explaining 32.2% of the overall user satisfaction. Results showed that Usefulness had the highest influence on overall user satisfaction. In the following phase, a regression analysis with dummy variables was used to identify the asymmetric impact of the WebQual dimensions’ performance on overall user satisfaction (Anderson and Mittal 2000; Matzler and Sauerwein 2002). For each attribute, one set of dummy variables was created and used to quantify excitement factors, while another set was created to quantify basic factors. For the analysis, factor scores were recoded as follows: factor score values in the lowest quartile (up to 25%) were used to form one dummy variable to quantify basic factors (value of 1), while factor values in the highest quartile were used to form the second dummy variable to quantify excitement factors (value of 1). Based on this recoding, multiple regression analysis was conducted to empirically test the basic and excitement factors using the mean value of four overall satisfaction items as the dependent variable and the two types of dummy variables (computed for the six attributes) as independent variables. This analysis produced two types of coefficients for each dimension, one of which was for penalty indices (standardized regression coefficients that show the influence of the attribute at low performance level on overall user satisfaction) and another was for reward indices (standardized regression coefficients that show the influence of the attribute at high performance level on overall user satisfaction).
The results of the analysis, as shown in Table 3, suggest that attribute importance differs depending on their performance. The column Penalty Indices shows the regression coefficient when the performance of these attributes is low and the column Reward Indices shows the regression coefficient when the performance is high. If the penalty exceeds the reward, the attribute in question is a basic factor. If the reward outweighs the penalty, the attribute is considered as an excitement factor. If the reward and penalty are equal, the attribute leads to satisfaction when the performance is high, as well as to dissatisfaction when the performance is low; it is classified as a performance factor (Füller and Matzler 2008).
Relationships between Attributes’ Performance and Overall User Satisfaction

Shows asymmetric impact of the attributes, R2 = .291.
Shows linear impact of the attributes, R2 = .332.
p < .01, **p < .05, ***p < .1.
As seen in Table 3, Ease of Use and Usefulness were classified as basic factors, because the reward for satisfaction is low (in addition, Ease of Use was found to be statistically insignificant), whereas the penalty for dissatisfaction for both was high and statistically significant. On the other hand, Relative Advantage, Trust, and Response Time were classified as excitement factors, as the rewards for satisfaction were higher than the penalty for dissatisfaction and also statistically significant. Finally, Entertainment was classified as a performance factor, since both its reward and penalty indices were approximately equal.
At the last stage of the analysis, penalty and reward indices were used to perform an asymmetric impact-performance analysis (AIPA), which is proposed by us and is an extended version of Mikulić and Prebežac’s (2008) impact-asymmetry analysis (IAA), as shown below. Impact asymmetry is an index that quantifies the asymmetry of an attribute’s impact on overall user satisfaction (Mikulić and Prebežac 2008). The values of the IA index can range from −1 to +1. The range of an attribute’s impact on overall user satisfaction (RIOCS) is the sum of its impacts in cases of high and low performance.


r i = reward index for attribute i (see Table 3); p i = penalty index for attribute i (see Table 3); RIOCS = |p i | + |r i | : range of impact on overall user satisfaction; IA = impact asymmetry; SGP = satisfaction-generating potential; DGP = dissatisfaction-generating potential.
A bidimensional matrix was obtained for the AIPA by setting the IA scores on the vertical axis (as in Mikulić and Prebežac 2008), and the performance scores of the attributes on the horizontal axis. The IA scores were used to classify the attributes as basic, performance, and excitement factors (Table 4). In their study, Mikulić and Prebežac referred to the attributes in the lower part of the grid as “dissatisfiers” and “frustrators.” However, these attributes are simply termed “basic” in the present study. The attributes positioned in this area have a greater potential to create dissatisfaction than satisfaction; the opposite is true for the attributes in the upper part of the matrix. In other words, these attributes have a greater potential to create satisfaction than dissatisfaction, and are therefore termed “excitement” factors. Dimensions with IA scores between −0.1 and 0.1 are termed “performance” factors (termed “hybrid” by Mikulić and Prebežac). Moreover, the matrix was subdivided into low-performance and high-performance areas according to the grand mean value of the attribute means. With the help of this matrix, it could be possible to interpret the influence of the attributes on overall user satisfaction by both their asymmetric effect and performance.
Impact on Satisfaction Indices

Note: RIOCS: range of impact on overall user satisfaction; SGP: satisfaction-generating potential; DGP: dissatisfaction-generating potential; IA: impact asymmetry.
On the matrix, originated by two diverse criteria of the attributes, the estimations are relative rather than absolute. A similar situation can be observed in AIPA. As seen in Figure 2, Entertainment has a low performance score, and is a performance factor. When compared to the basic and excitement factors, performance factors have linear influences on overall user satisfaction. If the performance of these attributes increase or decrease, then overall satisfaction will change in the same direction. It would be useful for them to improve the performance of these attributes, if extranet designers wish to increase user satisfaction. Usefulness and Ease of Use both have high performance scores and are basic factors. Basic factors show the characteristics of high influence on overall user satisfaction if their performance is low, but low influence if their performance is high, as was the case here. Since basic factors have high performance scores, system designers may try to maintain the quality of these attributes. Therefore, no further efforts are required for these attributes.

Asymmetric impact-performance analysis results
Since Relative Advantage and Trust are positioned on the matrix as high-performance excitement factors, they are not expected to create any difficulty for the users. When these attributes’ performances are high, their influence on overall satisfaction is high as well. But their influence becomes lower at the low performance level. In contrast, Response Time is positioned as a low performance excitement factor. Excitement factors do not cause user dissatisfaction (if their performance is low, as in this case), but improving the performance of these types of attributes is important for increasing overall user satisfaction.
Discussion
The existing literature includes limited research on the asymmetric influences of extranet attributes on user satisfaction within B-to-B environment, especially within the travel sector. Therefore, the first objective of this study was to classify extranet quality attributes according to their asymmetric influences on overall user satisfaction. Accordingly, dummy variable regression analysis was used, and the result of the analysis showed that the Usefulness and Ease of Use attributes of the scale were the basic factors. While the main characteristic of basic factors is creating user dissatisfaction when their performances are low, performance improvements are not necessarily correlated with satisfaction. The Entertainment attribute is a performance factor. In other words, this attribute ensures user satisfaction when its performance is high but increases dissatisfaction if its performance declines. Relative Advantage and Response Time are the excitement factors in the present study. Tour operator should therefore make greater efforts to increase the performance of these attributes, which will only continue to increase satisfaction.
The second objective of this study was to identify the extranet attributes to which limited company resources (such as time, money, and human resources) should be allocated, based on the asymmetric influences of these attributes on overall user satisfaction. To this end, a matrix was developed with an IA index (developed by Mikulić and Prebežac 2008) on the vertical axis, and the attributes’ performance scores were positioned on the horizontal axis. The matrix clearly shows the performance and asymmetric influence of each attribute on overall user satisfaction. Thus, it enables researchers to identify the relative importance of the extranet attributes on overall satisfaction. The analysis results show that Response Time is a low-performance excitement factor. However, excitement factors may greatly improve overall user satisfaction, if their performance can be increased, and they do not create dissatisfaction if they are not offered. Thus, more resources can be allocated to such factors if the aim is to increase the overall user satisfaction. However, the same is not the case for Entertainment, which is a performance factor. This factor, at present, creates user dissatisfaction as it has a low performance score. The factors Relative Advantage and Trust are high-performance excitement factors that indicate the tour operator does not need to improve performance, but rather to keep the performances at the same level. Because Trust is positioned very near to performance limits, its influence on overall user satisfaction can be assumed to be linear. Similarly, Usefulness and Ease of Use are high-performing basic factors that, like the excitement factors, do not need to be improved. It should be noticed that when the linear influence is taken into account, Usefulness had the highest influence on overall user satisfaction. Thus, a consideration of only the linear influence might be the reason for wrong decisions being made.
Most previous studies of website quality issues presume a linear relationship between website attributes and overall user satisfaction while identifying prior areas for the company resource allocation. However, recent studies indicate that the relationship between attribute importance and performance may not be linear, a situation that may result in inappropriate managerial decisions. However, studies considering the asymmetric relationships between attribute performance and overall user satisfaction only classify the attributes. Such a classification by itself is insufficient to guide managers, and a more comprehensive approach is needed, which prioritizes the attributes in resource allocation, such as importance-performance analysis (Martilla and James 1997). Thus, in the present study, going beyond the classification of the product or service attributes, a revised version of Mikulić and Prebežac’s (2008) impact-asymmetry analysis (IAA), which facilitates decisions on allocation of limited resources, is offered and named asymmetric impact-performance analysis (AIPA). The resulting matrix provides visual clarity and is very easy to understand, like the IPA technique.
In addition, this study shows that there is a need for specific scales to measure the extranet system quality in the literature. Following the suggestion made by Loiacono, Watson, and Goodhue (2007) that B-to-B website quality needs to be further investigated, this study takes that next step. Finally, future research is needed to evaluate the extranet both before and after changes are made, based on the asymmetric impact-performance analysis proposed by us in the present study. This will improve the understanding of the utility of AIPA and its use in strategic management.
Footnotes
Declaration of Conflicting Interests
The author(s) declared no potential conflicts of interest with respect to the research, authorship, and/or publication of this article.
Funding
The author(s) received no financial support for the research, authorship, and/or publication of this article.