



Abstract
The study provides critical tests of the usefulness of four alternative theories, proposed by Hofstede, Inglehart, Schwartz, and Steenkamp, of national cultures’ influences for explaining consumers’ consumption of international services. The study applies critical testing of these four theories in two research contexts: visiting Australia by holiday (vacation) travelers from 5 Asian and 5 Western nations and visiting the United States by holiday (vacation) travelers from 12 nations. The study is unique and valuable in proposing and testing configurational perspectives of cultural influences rather than testing via “unpacking” the net effects of cultural dimensions separately. The findings indicate that cultural configurations do impact consumption behavior of international services beyond the influences of demographic conditions (distance and national wealth) and that Schwartz’s theory is useful in particular in explaining unique aspects of consuming international services.
Keywords
Introduction
According to the United Nations World Tourism Organization (WTO 2009), tourism has grown to become one of the top five global industries with a market value of USD 946 billion, accounting for 30% of world’s exports of services. International tourist arrivals reached 924 million in 2008, a number that is expected to reach approximately 1.6 billion by 2020 (WTO 2001, 2009). Thus, understanding the different behaviors of tourists from various countries with different cultural backgrounds is very important for countries’ tourism authorities in designing marketing strategies to attract international tourists.
National cultures represent complex values acting in concert rather than as individual factors affecting behavior. For example, considering low, medium, and high levels on each of Hofstede’s four factors (e.g., collectivism/individualism, power distance, masculinity/feminism, and uncertainty avoidance) permits a property space (Lazarsfeld 1937) analysis of 81 complex antecedent conditions or antecedent recipes within a 3 × 3 × 3 × 3 matrix. While not all 81 combinations are likely to exist among specific samples of observable national cultures, data and research methods are available to permit the examination of how such complex cultural conditional recipes affect the behavior of individuals or firms. Each combination represents a specific algorithm that combines a low, medium, or high level across the four dimensions. The study of such algorithms embraces the view that the low versus high scores of any one factor (e.g., low power distance) becomes more meaningful in a combination of high versus low scores of the other factors rather than simply considering the net effect of any one factor while holding the other factors constant. This algorithm perspective offers a unique and major breakthrough in testing cultures’ consequences on tourism behavior because culture represents a holistic concept and research benefits from adopting conjunctive approaches to data analysis rather than examining net effects (e.g., multiple regression analysis and structural equation modeling).
Prior researchers mainly focus on examining how individual factors of cultural dimensions influence consumer behavior. For example, using Hofstede’s (1983) typology of four principal cross-cultural values (including individualism, power distance, masculinity, and uncertainty avoidance), Lynn, Zinkhan, and Harris (1993) examine each value’s impact on tipping behavior. No attempt is made by Lynn, Zinkhan, and Harris (1993) or other researchers to go beyond examining single cultural conditions’ net influences on individual or organizational behavior with the exception of Woodside, Hsu, and Marshall (2011).
Therefore, the study proposes a theoretical approach for examining the influences of alternative configurations of national cultural values on international tourist behaviors by examining the relevancy of configurations within four principal theories of national cultural influences that explain behavior (listed here in order from high to low citation impact): Hofstede (1980), Schwartz (1994, 2006), Inglehart and Baker (2000), and Steenkamp (2001). This study includes conducting “critical tests” (Carlsmith, Ellsworth, and Aronson 1976) of these alternative theories of cultural consequences on international tourist behavior. A critical test focuses on comparing the efficacy of two or more theories empirically—a substantial step beyond testing whether or not one theory is informative empirically.
Following this introduction, the next section reviews the four major cultural value theories. The third section explains the method of the study; the method includes applications of “fuzzy-set qualitative comparative analysis” (see fsQCA.com and Ragin 2008) using two data sets relating to international travel to Australia and the United States. The analytical method, fsQCA, relies on Boolean algebra and set theory to estimate the specific combinations of antecedent conditions that associate with a high score on an outcome condition (e.g., a lengthy visit to a given destination). The fourth section provides the analyses and findings. The fifth section includes conclusions, limitations of the study, and implications for theory and management practice.
Literature Review
One of the early definitions of culture is defined by Tylor in 1871, quoted by Soares, Farhangmehr, and Shoham (2007), as the complex whole that includes knowledge, belief, art, morals, custom and any other capabilities and habit acquired by man as a member of society. More recently, scholars define culture as an interactive aggregate of common characteristics shared by the population of a nation (Clark 1990; Hofstede 1980, 2001; Steenkamp 2001). Therefore, the impacts of culture need to be studied as configurations (i.e., recipes) of antecedent conditions on human behavior instead of as the influence of individual cultural dimensions one at a time.
The relevant literature includes negative critiques about national cultural theories. Critics think that more than one culture exists in a nation so that nation may not be the best unit of analysis for examining cultures. In addition, with globalization and advances in communication technology, people from different cultural backgrounds travel and interact with each other easily so that the original cultures are contaminated and changed (Craig and Douglas 2006; Douglas and Craig 1997, 2006; McSweeney 2002). These critics, however, do not provide any empirical evidence to support their assertions.
On the contrary, many scholars perceive substantial relevancy in national cultural theories in explaining human behavior, including Clark (1990), Dawar and Parker (1994), Hofstede (2002), Schwartz (2006), and Steenkamp (2001). These scholars point out delimiting subcultural groups in a nation is almost impossible. Nation is a meaningful proxy for culture because within country commonalities and between country differences do exist (Dawar and Parker 1994; Schwartz 2006; Steenkamp 2001). In addition, culture has centuries-old roots and thus changes very slowly so that a need still exists to study culture on national basis.
According to Taras’s (2010) “culture survey catalogue” a total of 154 instruments are publicly available for measuring culture. Among these cross-cultural theorists, Geert Hofstede, Ronald F. Inglehart, Shalom H. Schwartz, and Jan-Benedict E. M. Steenkamp are the four most widely cited authors of cross-cultural studies in the Social Science Citation Index. This section first introduces their comprehensive national cultural frameworks used for cross-cultural theorizing and empirical research, then compares their works to learn the similarities among them, and concludes with the critical review of Hofstede’s work to show that it is still the most important framework in social science.
Hofstede’s National Cultural Value Dimensions
Hofstede’s (1980, 2001) well-known theory of national cultural value dimensions is based on the data collected in two survey rounds from IBM’s international employee attitude survey program between 1967 and 1973. The data include answers to more than 116,000 questionnaires from 72 different countries in 20 languages. However, the initial analysis is limited to the data from 40 countries because of missing data in the occupational categories for some countries. Later, in 1982, the list of countries was extended to 50 countries plus three regions (Hofstede 1980, 2001).
Hofstede (1980) identifies four principal national cultural dimensions, including power distance, uncertainty avoidance, individualism versus collectivism, and masculinity versus femininity. Hofstede’s four dimensions of national culture values are summarized as follows.
Power distance measures the degree of inequality in power between a superior and a subordinate in a hierarchy as perceived by the less powerful member. Inequality is a common phenomenon found in countries with high scores on the power distance index (PDI).
Individualism measures the degree of independence in the way people work. In countries that score high on the individualism index (IDV), people act as individuals with a great deal of independence. High IDV countries are called individualism countries. On the contrary, countries scoring low on IDV are collectivistic countries, and people in collectivistic countries like to act as members of groups.
Masculinity measures the degree of dominance of the masculine values in a country. Masculine values like assertiveness and competitiveness are dominant in countries with high scores on the masculinity index (MAS). In contrast, feminine values like nurturance and tenderness are dominant in countries with low MAS scores.
Uncertainty avoidance measures the degree of how comfortable people of a culture are in unstructured situations. People in countries with higher scores on the uncertainty avoidance index (UAI) feel more anxious and stressed when facing uncertain situations than those in countries with lower scores on UAI.
Hofstede’s national cultural framework may be the most influential conceptual foundation in cross-cultural studies (Fernandez et al. 1997); his work has been cited 1,101 times for the years 1987 through 1997 according to the Social Science Citation Index (Sivakumar and Nakata 2001). His framework is both conceptually and empirically important. Many similarities occur in different typologies of culture corresponding to his national value dimensions (Clark 1990). In addition, his four principal dimensions are validated by 140 various survey and nonsurvey studies that compare between 5 and 39 countries (Hofstede 2001).
Inglehart’s World Values
Inglehart, Baker, and Norris (Inglehart and Baker 2000; Inglehart and Norris 2003) identify two value dimensions of cross-cultural variation through four waves of the World Values Survey (WVS) from 1981 to 2001 to address issues in sociology about modernization. The WVS data were collected from interviewing an average of 1,400 respondents per country from 81 countries on all six inhabited continents; these nations contain more than 80% of the world’s population. The two dimensions are summarized as follows.
Traditional versus secular-rational dimension concerns orientations towards authority. In traditional societies, people emphasize the importance of religion, nation, and family. People in secular-rational societies, on the other hand, rely less on these factors as sources of authority.
The survival versus self-expression dimension concerns the relation reliance on the group versus reliance on the self for quality of life. Survival values emphasize the importance of economic and physical security. In survival societies, people feel unhappy and insecure when facing unfamiliar issues and changes. On the contrary, self-expression values emphasize subjective well-being and quality-of-life. In self-expression societies, people take survival for granted and they accept differences and changes.
Even though Inglehart’s framework receives less attention by researchers than Hofstede’s model, Ingelhart’s model deserves to receive scholarly attention not only because of the sound methodology in his research but also the extensive size of his data set and the duration of his data collection.
Schwartz’s Cultural Value Orientations
Schwartz (2006) validates three cultural value dimensions containing seven cultural value orientations based on his findings from data collected in 73 countries via two different instruments: the Schwartz Value Survey (SVS) and the Portrait Values Questionnaire (PVQ). The SVS data were collected from school teachers and college students in 67 nations in 1988 and again in 2000. The PVQ data were gathered from the European Social Survey (ESS) in 20 countries. Schwartz’s seven cultural value orientations are summarized in three bipolar cultural value dimensions as follows.
Autonomy versus embeddedness emphasizes the relations between the individual and the group. In autonomy cultures, people are independent and unique. Autonomous cultures encourage individuals to express their own internal attributes such as feelings, ideas, and preferences. The two types of autonomy are intellectual autonomy and affective autonomy. On the contrary, in embeddedness cultures, people are collectivity entrenched in their thoughts and actions. Embedded cultures emphasize maintaining the status quo and restraining actions that may disrupt group unity or the existing order.
Egalitarianism versus hierarchy emphasizes people’s responsibilities associated with their roles in society and social resource allocation. In egalitarianism cultures, people are moral equals who have shared interests and are committed to cooperating with and considering the welfare of others. However, hierarchy cultures legitimate and maintain unequal distribution of roles, power, and resources. People play unequal roles in hierarchical systems that grant them different powers and responsibilities.
Harmony versus mastery emphasizes the way people manage to fit in the natural and social worlds. In harmony cultures, people understand and appreciate the world and try to preserve it as it is. However, in mastery cultures, people try to actively direct and change the surrounding environment in order to achieve their goals.
Unlike Hofstede and Inglehart’s frameworks based on a posterior theorizing, Schwartz’s cultural value dimensions are based on a priori theorizing (Schwartz 2006). In addition, Schwartz’s approach views “cultural dimensions as forming an integrated, non-orthogonal system” that distinguishes his interdependent dimensions from Hofstede and Inglehart’s orthogonal dimensions (Schwartz 2006, p. 142). Although Schwartz’s model is based on strong theoretical foundations with more updated data than Hofstede’s, his framework has not been applied widely empirically (Steenkamp 2001).
Steenkamp’s National-Cultural Dimensions
Steenkamp (2001) examines the two major cultural dimensions proposed by Hofstede and Schwartz. Steenkamp creates four comprehensive national-cultural dimensions by analyzing the national cultural ratings of the 24 countries included in both Hofstede and Schwartz’s data sets. His four national-cultural dimensions are stated as follows.
Autonomy versus collectivism dimension—consistent with both Hofstede’s individualism/collectivism dimension and Schwartz’s autonomy/embeddedness dimension—deals with the relation between the individual and the group. Hofstede’s power distance also associates with individualism/collectivism because both focus on order in a society.
Steenkamp’s egalitarianism versus hierarchy dimension, like Schwartz’s egalitarianism/hierarchy dimension, refers to how people consider the interests of others and cooperate in harmony with them. Steenkamp’s mastery versus nurturance dimension, similar to Hofstede’s masculinity/femininity and Schwartz’s harmony/mastery, deals with how people fit into the social and natural environment with an emphasis on assertiveness and achievement for mastery. Both Hofstede and Steenkamp include uncertainty avoidance, which refers to how people handle uncertain situations.
Steenkamp reports that the first two dimensions correlate significantly with each other while other correlations are negligible. A society high on conservatism tends to be hierarchical; a society that views individuals as autonomous, on the other hand, is more likely to address the importance of egalitarianism in order to maintain a functioning society.
Although Steenkamp’s national cultural dimensions are derived entirely from Hofstede and Schwartz’s data sets, his study supports the relevance of these earlier cultural theories by pointing out the commonalities between the two.
Comparison of Hofstede’s, Inglehart’s, Schwartz’s, and Steenkamp’s Value Dimensions
Similarities appear in comparing Hofstede’s, Inglehart’s, Schwartz’s, and Steenkamp’s value dimensions, although each conducts different research using different subjects, methods, and time periods. Table 1 summarizes the two, three, and four dimensions in Hofstede’s framework associated closely with both Inglehart and Baker’s dimensions, Schwartz’s three dimensions, and Steenkamp’s four dimensions.
Comparison of Major Cultural Theories and Dimensions.

First, Hofstede’s power distance is similar to both Schwartz’s and Steenkamp’s egalitarianism/hierarchy and Inglehart and Baker’s traditional/secular-relational dimension because they all refer to authority orientation. Second, Hofstede’s individualism/collectivism overlaps with Schwartz’s autonomy/embeddedness, Inglehart and Baker’s survival/self-expression, and Steenkamp’s autonomy/collectivism as all are concerned with the relationship between the individual and the group. Third, Hofstede’s masculinity/femininity, Schwartz’s harmony/mastery, and Steenkamp’s mastery/nurturance associate with people’s relationships to social and natural environments. Fourth, both Hofstede and Steenkamp include an uncertainty avoidance dimension that deals with how people respond to uncertain situations.
In comparison to Hofstede’s research, both Inglehart and Schwartz cover a relatively small number of national cultural value dimensions. Therefore, Hofstede’s theory is still by far the most comprehensive national cultural framework in cross-cultural studies.
Key Propositions and Empirical Paradox
Based on the literature review, the study here includes six key propositions for empirical examination.
Proposition 1: Culture is a configuration of values. Nearly all prior studies examine only the influences of individual cultural values, one at a time, on consumer behavior. In fact, these studies examine the impact of individual cultural values, not cultures’ impacts per se. Since the nature of a culture includes various combinations of values, cultures’ impacts need to be examined as configurations of values. Configurations of cultural values should work better in predicting and explaining consumer behavior than individual values examined one at a time.
Proposition 2: Nations differ in meaningful ways by the different configurations of their values. Since the debate about whether or not there is such a thing as a national culture has been going on for a long time, researchers need to study whether cultures differ across countries or not. National cultures can be described by different configurations of cultural values. For example, using recipes of Hofstede’s national cultural values, Americans appear to be low in power distance, high in individualism, high in masculinity, and low in uncertainty avoidance while Japanese are high in power distance, low in individualism, high in masculinity, and high in uncertainty avoidance.
Proposition 3: The impact on tourism behavior varies in size in the following pattern, from greatest to smallest: Schwartz > Steenkamp > Hofstede > Inglehart > GDP and distance. Before doing any analysis, the study predicts that the demographic conditions of gross domestic product (GDP) per capita and home–destination distance will not work as well as all four of the cultural theories in predicting high levels of tourism behavior. The cultural value theory proposed by Inglehart and Baker may be the least effective of the four cultural in explaining tourist behavior because it only covers two cultural values while the other theories include four or more cultural values. Schwartz’s theory may work the best of all of the theories because it is based on sound prior theory and has not received any negative criticism as of yet.
On the other hand, Hofstede’s theory, developed 30 years ago, has been attacked by many scholars (e.g., Bearden, Money, and Nevins 2006). Steenkamp’s theory should be placed in between Schwartz’s and Hofstede’s theories because it is based on the two theories. Each of the four theories, however, has its own strengths and weaknesses in explaining consumer behavior and so should be included in the study.
Proposition 4: Cultural influences differ by purposes of the trip and prior trip experiences. The degree of cultural influences is greater for people traveling for holiday purposes than for people traveling to visit friends and relatives. For the latter trip type, friends and relatives are very likely to open their homes to the travelers and make arrangements for activities during their visit. Thus, friends and relatives are likely to have a greater influence on the consumption behavior of the travelers than cultural factors when the purpose of the trip is a personal visit.
The degree of cultural influence is greater for first-time visitors than those who have prior visiting experience. For those who have visited the destination before, demographic characteristics and previous trip experiences are expected to have a greater influence on consumption behavior than cultural factors.
Proposition 5: Culture affects consumer behavior. Culture affects consumer behavior in different ways. People from Eastern versus Western cultures exhibit observable differences in their consumption patterns. For example, people from Western countries tend to stay longer on a trip to a foreign country than do people from Eastern countries because of the higher power distance and hierarchy usually found in Eastern cultures; people from Eastern culture countries need to return home to maintain their hierarchical and power positions.
People from Eastern countries may spend more money per day on their trip than people from Western countries because Eastern cultures are high in uncertainty avoidance and masculinity. People from Eastern cultures do not just worry about food or accommodations in a foreign country; they want to show that they are able to stay in a five-star hotel and enjoy fine-dining.
People from Eastern cultural countries are likely to spend more money on shopping than people from Western cultural countries because Western cultures are high in individualism and Eastern cultures are high in collectivism. People from Eastern cultural countries are more likely to buy gifts for their relatives and friends at home than people from Western cultural countries. Thus, people from Eastern cultural countries are more likely to shop for gifts for their friends and family at home—and to spend more on these gifts—than people from Western cultures do.
People from Western cultural countries are likely to visit more places on a particular trip than people from Eastern cultural countries because Western cultures are high in individualism. Even though Eastern cultures are high in uncertainty avoidance, people from Eastern cultural countries do not spend as much time as people from Western cultural countries pre-trip planning trips. This behavior reflects the fact that people from Eastern cultural countries tend to join group tours and take short trips.
Proposition 6: Cultural influences differ by age. Many people think that culture is becoming less important for young people than for old people because of their conceptions that old people are more cultured and traditional but young people are less traditional and may be even repelled by traditions. However, scholars, such as Hofstede (2001, 2002) and Schwartz (2006) believe that culture has “centuries-old roots” and it changes very slowly. Therefore, any speculation about whether the proposed relationship between age and cultural influences will be supported or refuted is left to the empirical results of the study.
Based upon the literature review and available secondary data, the study proposes a theory that culture does influence tourist behavior and that these influences differ by certain consumption moderating variables (i.e., purpose of the trip and prior trip experience) as well as some subcultural dimensions (e.g., age). The study also includes the influences of demographic characteristics such as GDP per capita and home–destination distance on travel consumption behavior. Figure 1 summarizes the conceptual framework of the study.

The conceptual framework of culture’s influences on international tourism.
Method
Individual national cultures consist of complex statements of cultural dimensions representing unique configurations of conditional multiple-value recipes leading to outcomes. Configurational thinking (in terms of degree of membership in different combinations of causally relevant factors) provides unique and useful understanding that goes beyond net-effects approaches (i.e., multiple regression and ANOVA methods) for explaining behavior (McClelland 1998; Ragin 2008).
Configurational thinking includes the recognition that no individual antecedent is necessary or sufficient for predicting a high score on an outcome condition. In this study, individual antecedents are individual cultural values and outcome conditions include number of nights visiting the destination, number of destination regions visited, and levels of expenditures for gifts to take home for friends and relatives. Analyses using configural thinking tools (e.g., fsQCA) provide algorithms that are sufficient (but usually still not necessary) for a high score in an outcome condition. For example, the American cultural configuration (I•M•~P•~U) using Hofstede’s typology—representing high individualism (I), high masculinity (M), low power distance (~P), and low uncertainty avoidance (~U) results in relatively low levels of gift (G) expenditures (i.e., ~G). The sideways tilde, “~”, indicates a negative (low) value and the mid-level dot (“•”) represents the logical “and” condition. Additional details on fsQCA applications of set theory appear below.
The study’s design permits “critical tests” on the four alternative culture value models as well as the demographic factors by using meta-analysis. Meta-analysis is defined as “the statistical analysis of a large collection of analysis results from individual studies for the purpose of integrating the findings” (Glass 1976, p. 3). Scholars often use meta-analysis for conducting systematic reviews to point out what is already known and what need to be addressed in specific fields (Dickersin and Berlin 1922).
The study transforms (“calibrates” in the language of fsQCA, see Ragin 2008) all values of all antecedent and outcome conditions into (0.00 to 1.00) fuzzy-set scores for analysis to find out the impact of the cultural value configurations on consumer behaviors as well as the behavioral tendencies of consumers in each country. Four sets of the cultural value data and two sets of the secondary consumption data along with the demographic data examined in the study are summarized as follows.
Australian Data
Prior research by Woodside and Ahn (2008) is the source of the first data set. The Cooperative Research Centre for Sustainable Tourism in Australia funded their research to support the data acquisition from the Australian Bureau of Tourism Research. The data set contains information on 2,630 international visitors to Australia in 2000 from 14 countries, including Canada, Germany, Hong Kong, Indonesia, Japan, Malaysia, the Netherlands, New Zealand, Singapore, Korea, Switzerland, Taiwan, United Kingdom, and the United States. The respondents were classified into three age group segments of young (<30 years old), middle (30-49), and old (50+), and the four purposes of their trips, including first-time holiday, first-time visiting friends and relatives (VFR), repeat holiday, and repeat VFR. The consumption data used in the study to analyze the behavioral tendencies of visitors from different countries include average number of nights of stay, average daily trip expenditures, average daily shopping expenditures, and the number of regions and states visited.
Because of limited availability of country scores in the four value data sets, the present study includes analyses of data from the following ten countries: Germany, Hong Kong, Japan, Malaysia, the Netherlands, New Zealand, Singapore, Switzerland, Taiwan, and the United States.
American Data
The second set of the data was published by the Office of Travel and Tourism Industries, International Trade Administration of the U.S. Department of Commerce. The data set includes measures for inbound travelers to the United States in 2008 from 18 countries; however, because of the limited availability of the country scores in the four cultural value data sets, only the data for the 12 following countries were analyzed in the study: Australia, Brazil, France, Germany, Italy, Japan, the Netherlands, New Zealand, Singapore, Spain, Switzerland, and Taiwan The consumption data used to analyze the behavior of tourists from each country in the study includes average daily travel spending, length of stay, time spent on planning the trip, and the number of states visited.
Distance and GDP per Capita Data
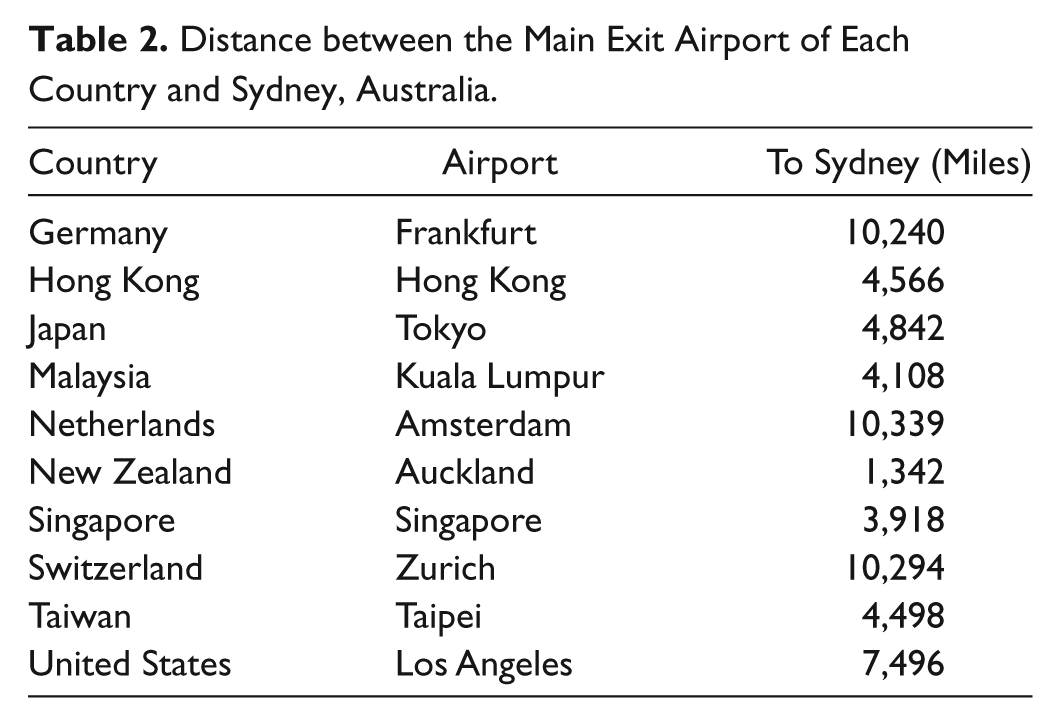
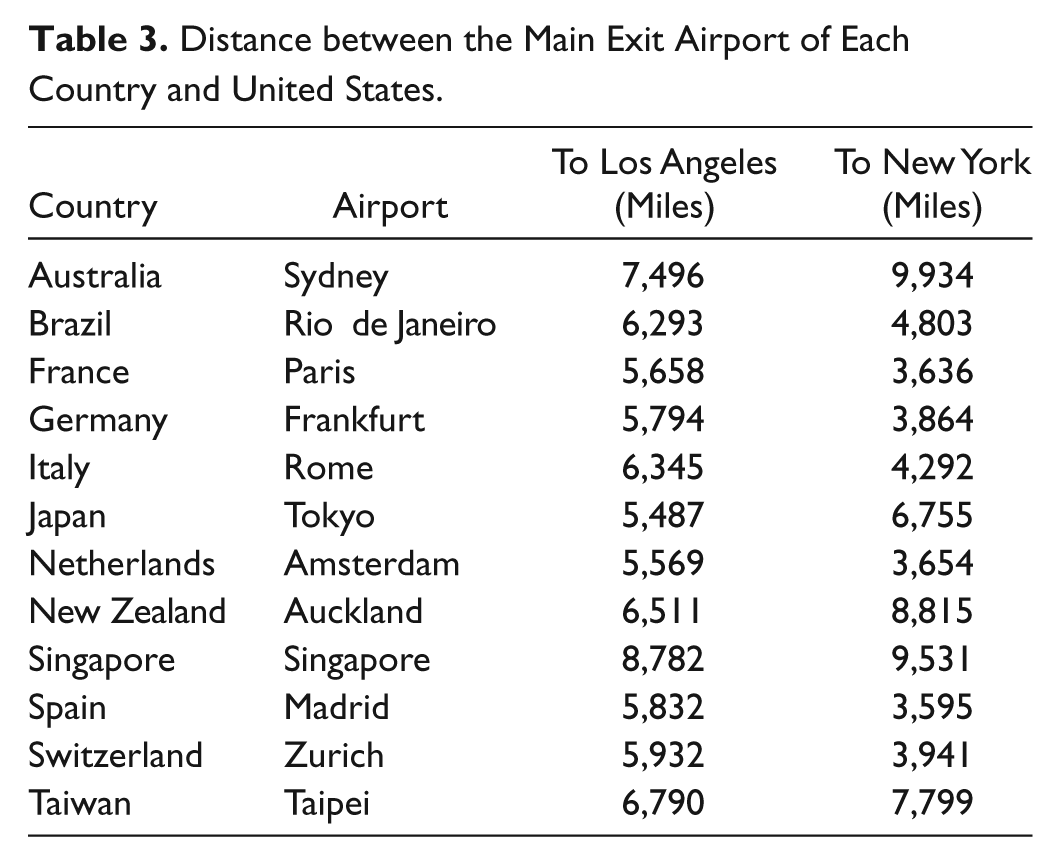
The study included retrieving information on the flight distance between the main exit airport from each country to Australia and the United States from http://www.travelmath.com/distance/. Sydney is the main airport in Australia that receives international arrivals. Los Angeles and New York are the main entrance airports for international arrivals on the West and East coasts of the United States (see Tables 2 and 3 for details). The study uses the shorter distance from the main exit airport of each country to either Los Angeles or New York in the analysis.
Distance between the Main Exit Airport of Each Country and Sydney, Australia.
Distance between the Main Exit Airport of Each Country and United States.
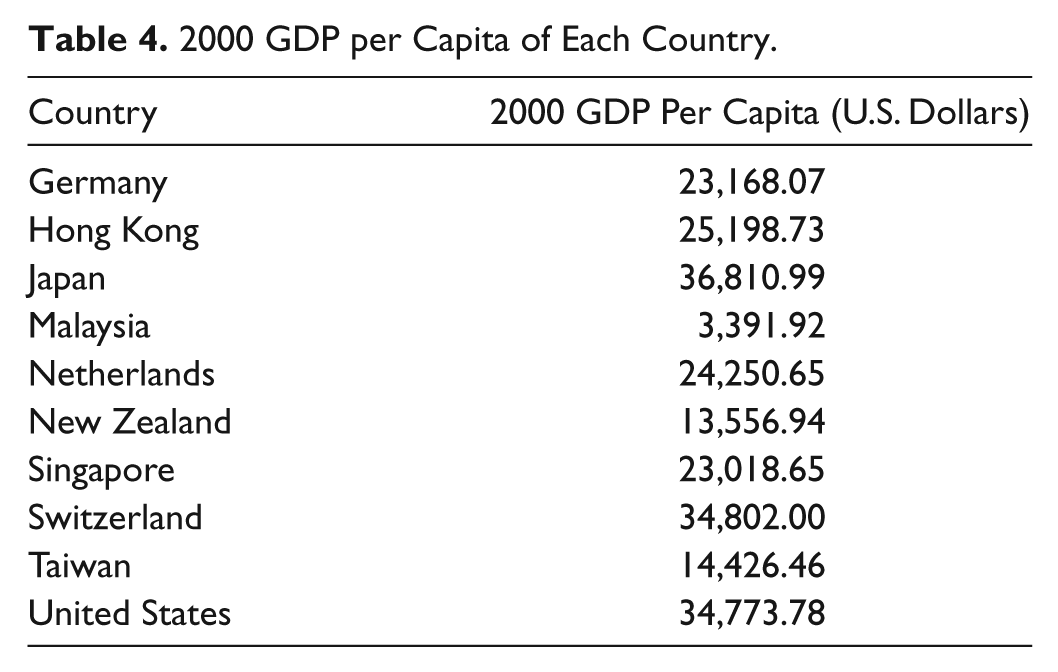
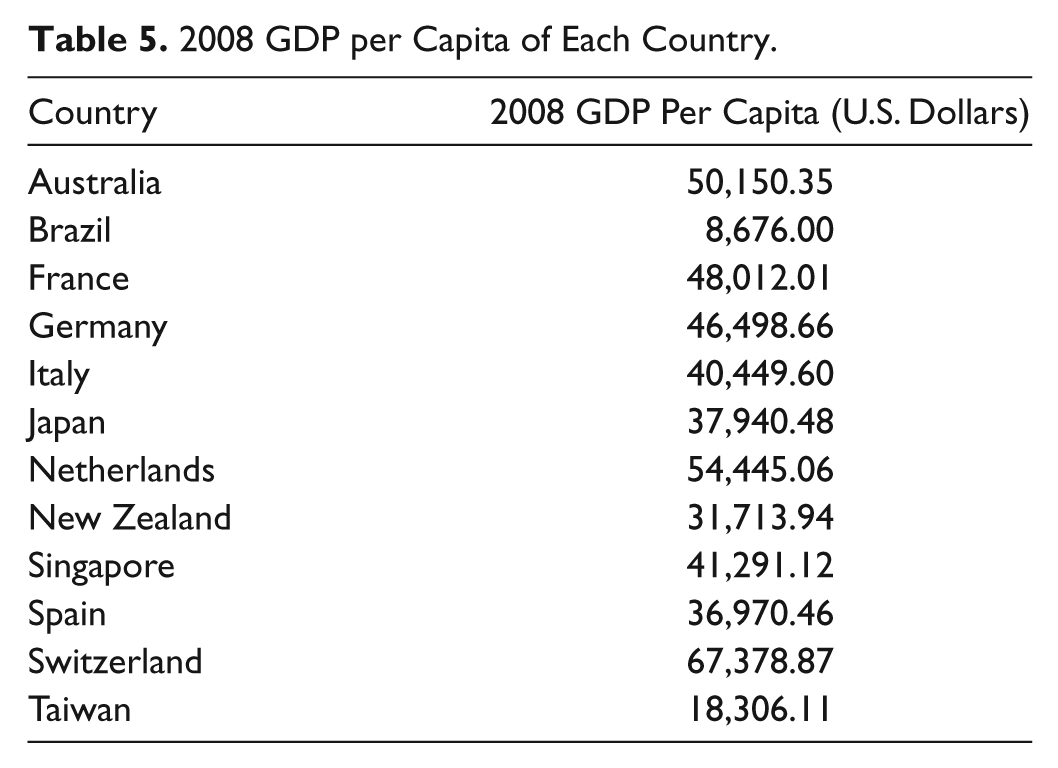
GDP per capita is a frequently-used index that represents the economic performance of a country. The study adopts GDP per capita data from the database of the International Monetary Fund (http://www.imf.org/external/data.htm) as a potentially valuable antecedent condition. GDP per capita for the year 2000 is used with the Australian data set and GDP per capita for 2008 is used with American data set (Tables 4 and 5).
2000 GDP per Capita of Each Country.
2008 GDP per Capita of Each Country.
Qualitative Comparative Analysis
Social and behavioral researchers often find themselves engaging in qualitative comparative analysis in examining and comparing cases. Most of the time, these cases are very limited in number for meaningful macro-level comparisons; for example, there are only six states and five political parties in Australia. These small numbers of cases are far too few for undertaking most conventional quantitative statistical analysis. In addition, the main limitation of single or small number case studies is that it is very difficult to produce any form of statistical generalization from these cases to a broader population because the findings are limited to a single or a few cases (Bryman and Bell 2007).
American political sociologist, Charles C. Ragin, takes a middle path between quantitative and qualitative methods with a data analysis method called Qualitative Comparative Analysis (QCA). The initial purpose of QCA was to solve the problem of generalizing findings of a small number of cases to more macro levels (Ragin 1987). Ragin states in his theory and method treatise, Configurational Comparative Methods, that his aim in using this method is to “allow systematic cross-case comparisons, while at the same time giving justice to within-case complexity, particularly in small- and intermediate-N research designs” (Rihoux and Ragin 2009, p. xviii).
With the work of Ragin (2008) and many other scholars over the past two decades, QCA and its related techniques, including crisp sets (csQCA), multivalue QCA (mvQCA), fuzzy-set (fsQCA), and MSDO/MDSO (most similar, different outcome / most different, same outcome), were developed and have been productively applied not only in small- and intermediate-N research designs at the macro-level, but also in large-N research at the meso- or even micro-level (Rihoux and Ragin 2009).
The Importance/Advantage of QCA
Often for social and behavioral researchers, QCA is a more relevant form of analysis than quantitative analysis for the reason that almost all social science theory is verbal in nature and also fundamentally formulated in terms of sets and set relations (Ragin, 2008). However, conventional quantitative analysis methods treat independent variables as separable causes of an outcome to explain variation of dependent variables individually.
Unlike conventional quantitative analysis, QCA emphasizes analyzing asymmetric set relations rather than calculating the net effects of independent variables in linear models from a symmetric (correlation and multiple regression) perspective. “In set-theoretic work, the idea of a causal recipe is straightforward, for the notion of combined causes is directly captured by the principle of set intersection” (Ragin 2008, p. 9). QCA allows researchers to identify the commonalities across a set of observed cases by examining different configurations (combinations) of causally relevant condition variables linked to a particular outcome. In other words, QCA helps researchers to find patterns in the condition variables for the cases they study and make sense of the variables.
Similar to quantitative analysis approaches, replicability and transparency are the two major advantages QCA has over other qualitative approaches. QCA techniques are a formalized system of techniques based on set theory and Boolean algebra with fixed and stable rules of logic. In addition, QCA techniques require researchers to act with transparency through all of the stages of the research process so that other researchers can easily replicate their studies for confirmation or falsification (Rihoux and Ragin 2009).
Fuzzy-Set QCA
Ragin (2000, 2008) adopts Zadeh’s (1965) set theory to develop fsQCA. This technique allows researchers to calibrate partial membership in sets using values ranging from 0.0 and 1.0 with three-value, four-value, or six-value fuzzy-sets or even a continuous fuzzy-set (Ragin 2008; Rihoux and Ragin 2009).
Similar to the assessments of significance and strength in analyzing correlational connections, consistency and coverage are the two descriptive measurements used to assess fuzzy-set relations. “Consistency” refers to estimating if a given configuration of conditions is sufficient for an outcome to occur by assessing the degree to which one set (e.g., high scores on a complex antecedent condition) is contained within another (e.g., high scores on a given outcome condition). Usually a consistency score has to be .75 or higher to be substantial. Only after a consistent subset of the outcome is established is it reasonable to calculate the coverage scores. While consistency scores are distinct to QCA, consistency scores are analogous to a Pearson’s r coefficient in statistical analysis. “Coverage” refers to estimating the empirical relevance of a consistent subset (Ragin 2008; Rihoux and Ragin 2009) and is analogous to the “coefficient of determination,” r2, in statistical analysis.
If the membership scores in a combination of antecedent conditions are consistently less than or equal to the membership scores in the outcome across the cases, then the combination of conditions is a subset of the outcome. Usually, the same outcome may result from a few different combinations of conditions; these combinations are then assessed for their coverage of the outcome. A combination that covers a greater proportion of the outcome is judged to be more empirically important than a combination that covers a lesser proportion of the outcome. Additional details on how to apply QCA methods, including fsQCA, are available in Ragin (2008).
Analysis and Findings
In order to test the propositions, the study first evaluated the consistency and coverage scores of the fuzzy-set relations of individual cultural values, as well as cultural value configurations, on different outcome conditions for the Australian and American data sets. The analyses were based on the four alternative cultural value theories in order to learn whether the individual values or the combination of the cultural values perform well in predicting high scores on tourists’ consumption behaviors.
Second, the study identifies the most predictive cultural value configuration in each of the four cultural value theories to represent each country by choosing the maximum score from the various cultural value configuration scores. Third, the study adopts a restricted meta-analysis to analyze only the consistency scores over 0.749 of the best-fitting models in each of the four theories—as well as the demographic conditions—to determine the most useful theory for explaining and predicting tourism behavior. “Restricted meta-analysis” includes estimating the number of substantial consistency scores and their ranges for findings to test a given theory.
Fourth, restricted meta-analysis allows the study to explore whether or not the degree of cultural influences on consumer behavior changes for first-time versus repeat travelers as well as for holiday-only travelers versus travelers visiting friends and relatives. Fifth, the study adopts the most relevant cultural theory by examining the consumption patterns of tourists from different countries, comparing the consumption patterns of people from Eastern versus Western countries, and verifying if the consumption patterns of tourists from different countries are consistent for both the Australian and the American data set. Finally, restricted meta-analysis allows the study to explore whether or not the degree of cultural influences on consumer behavior differs by the three different age groups of young, middle, and old travelers.
Calibrating Variables into Fuzzy Membership Scores
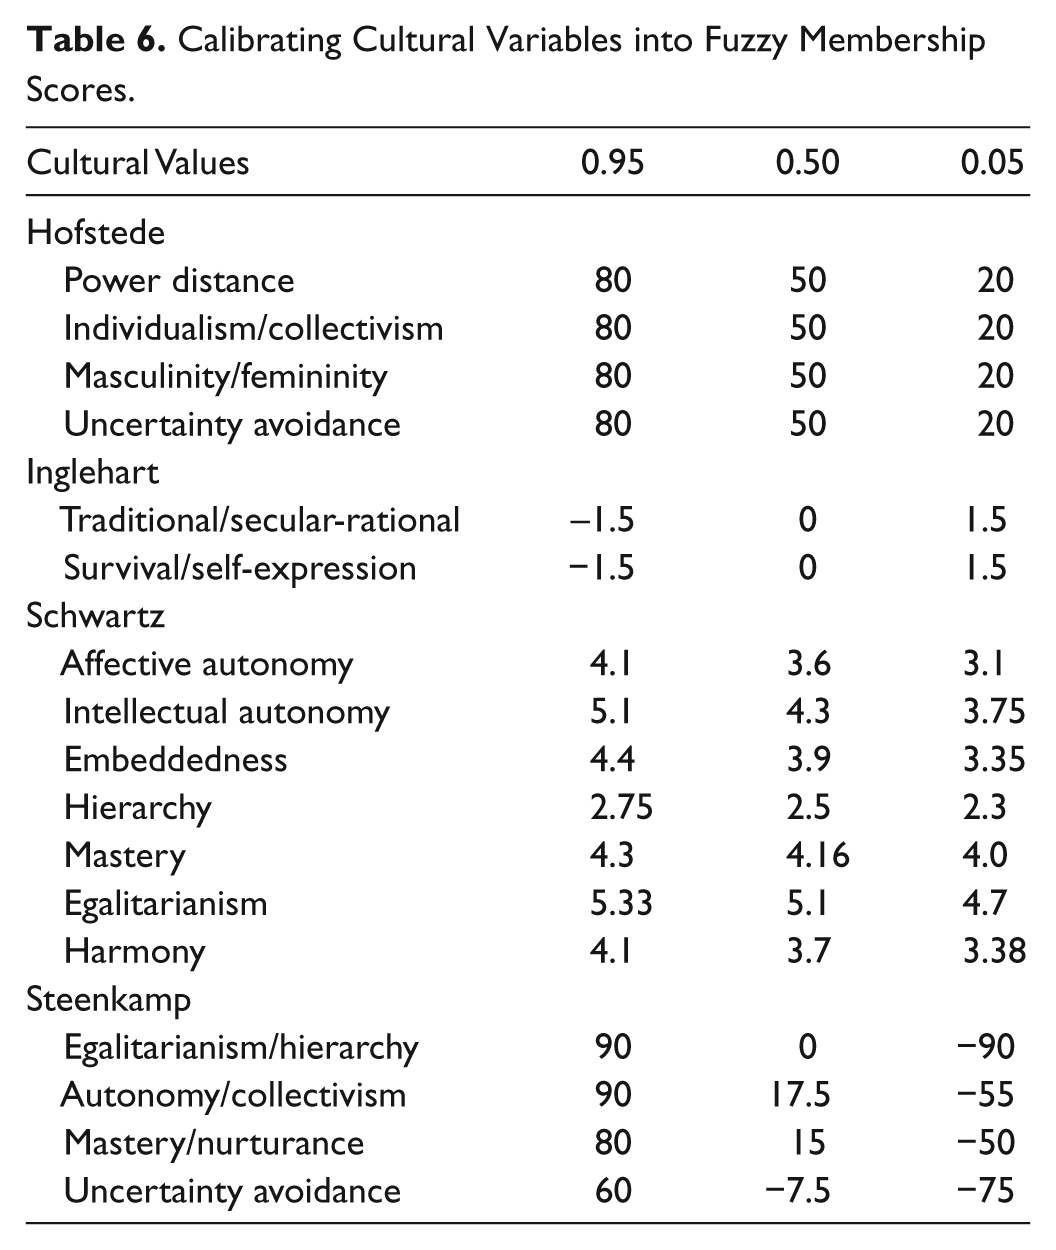
To transform—or calibrate—the original cultural variables and behavioral variables into fuzzy membership scores, variables (antecedents) were identified as meeting the threshold for full membership (fuzzy score = 0.95), the crossover point (fuzzy score = 0.50), or full nonmembership (fuzzy score = 0.05). Tables 6 and 7 contain the details for the calibration procedures.
Calibrating Cultural Variables into Fuzzy Membership Scores.
Calibrating Behavioral Variables into Fuzzy Membership Scores.

Findings for Proposition 1: Culture Is a Configuration of Values
Fuzzy-set membership scores of cultural values from the four cultural theories and consumption data from Australian and American data sets were entered into the fsQCA software program for analysis. Note that for the Australian data, only the data of first-time holiday visitors to Australia are used to demonstrate the analysis.
In order to estimate whether individual cultural values or the configurations of cultural values work better in predicting and explaining the behavioral outcomes, consistency and coverage scores were evaluated. According to Ragin (2000, 2008), consistency scores should be equal to or higher than coverage scores to indicate the antecedent conditions are subsets of the outcome conditions. In addition, consistency scores should be at least 0.75 or higher to indicate that the antecedent conditions are sufficient for the outcome conditions to occur.
Table 8 lists the best predicting individual values and the best predicting configuration of values for the outcome condition using the data from Hofstede’s country scores for first-time holiday visitors to Australia. Table 8 shows that all of the best configurations of Hofstede’s cultural values have higher consistency scores than all of the best individual cultural values. Tables through 11 show similar results when using Inglehart’s, Schwartz’s, and Steenkamp’s data. As Tables 8 through 11 show, the average improvement possible of the consistency scores of fuzzy-set relations are 29%, 40%, 77%, and 40% for Hofstede, Inglehart, Schwartz, and Steenkamp, respectively.
Consistency and Coverage Scores of the Causal Fuzzy-Set Relations of the Best Hofstede’s Individual and the Configuration of Cultural Values on the Australian Outcome Conditions.
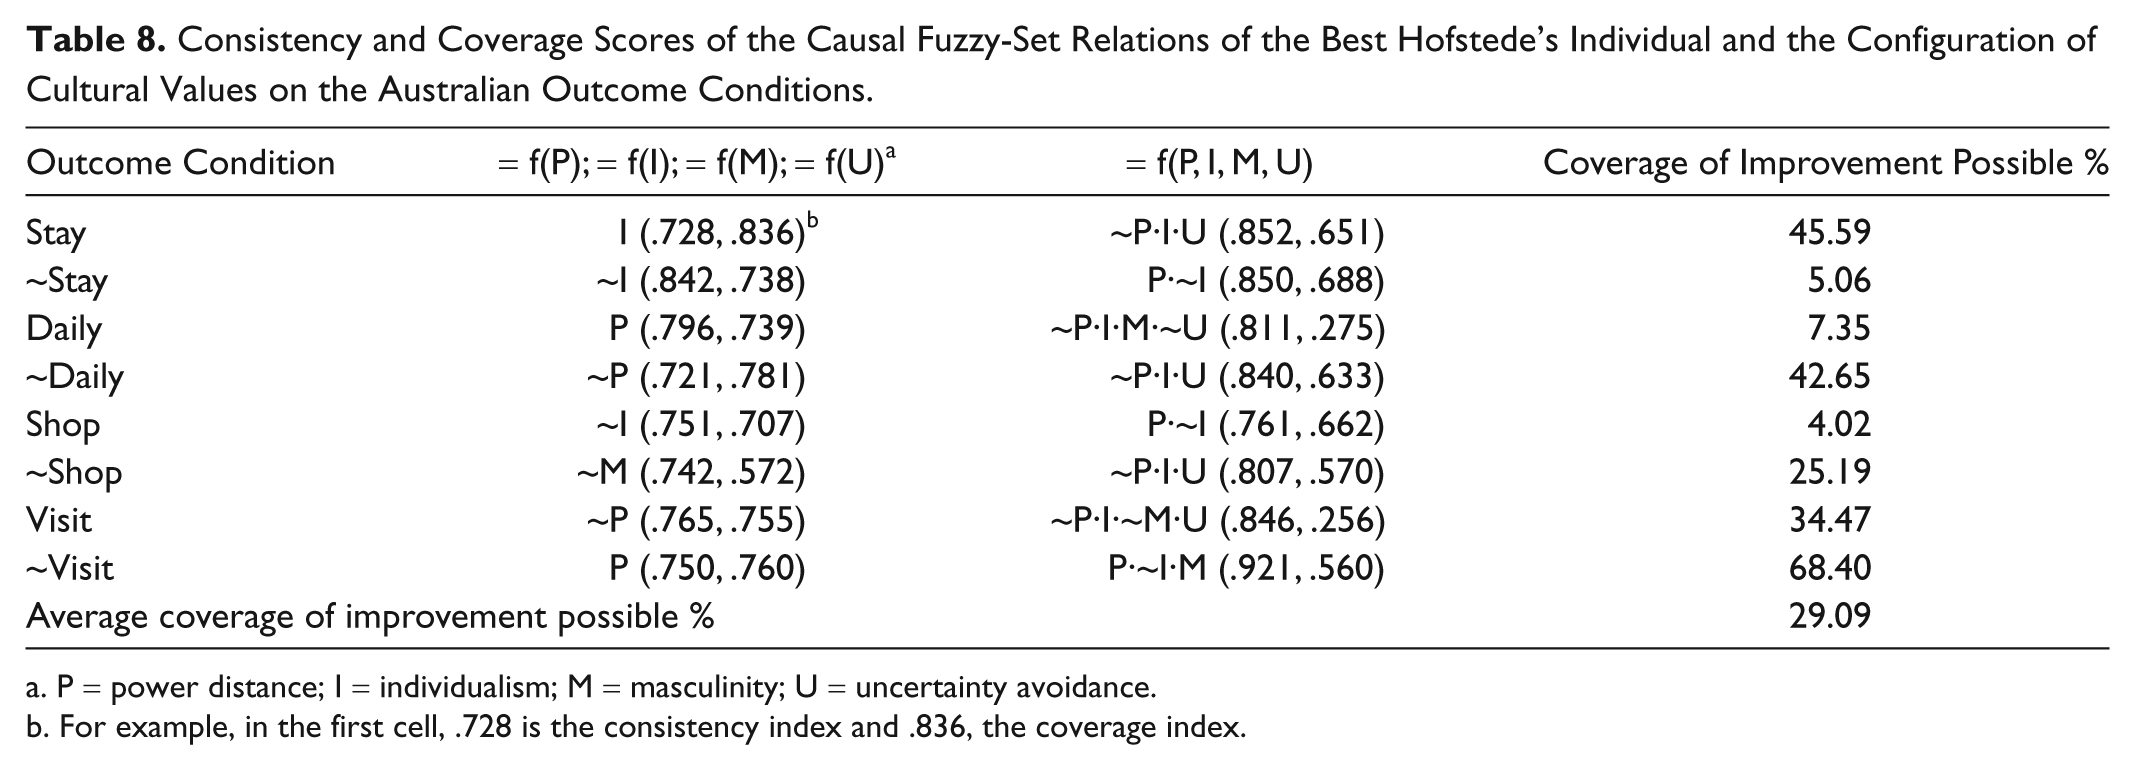
P = power distance; I = individualism; M = masculinity; U = uncertainty avoidance.
For example, in the first cell, .728 is the consistency index and .836, the coverage index.
Consistency and Coverage Scores of the Causal Fuzzy-Set Relations of the Best Inglehart’s Individual and the Configuration of Cultural Values on the Australian Outcome Conditions.

Note: T = traditional; S = survival.
Consistency and Coverage Scores of the Causal Fuzzy-Set Relations of the Best Schwartz’s Individual and the Configuration of Cultural Values on the Australian Outcome Conditions.
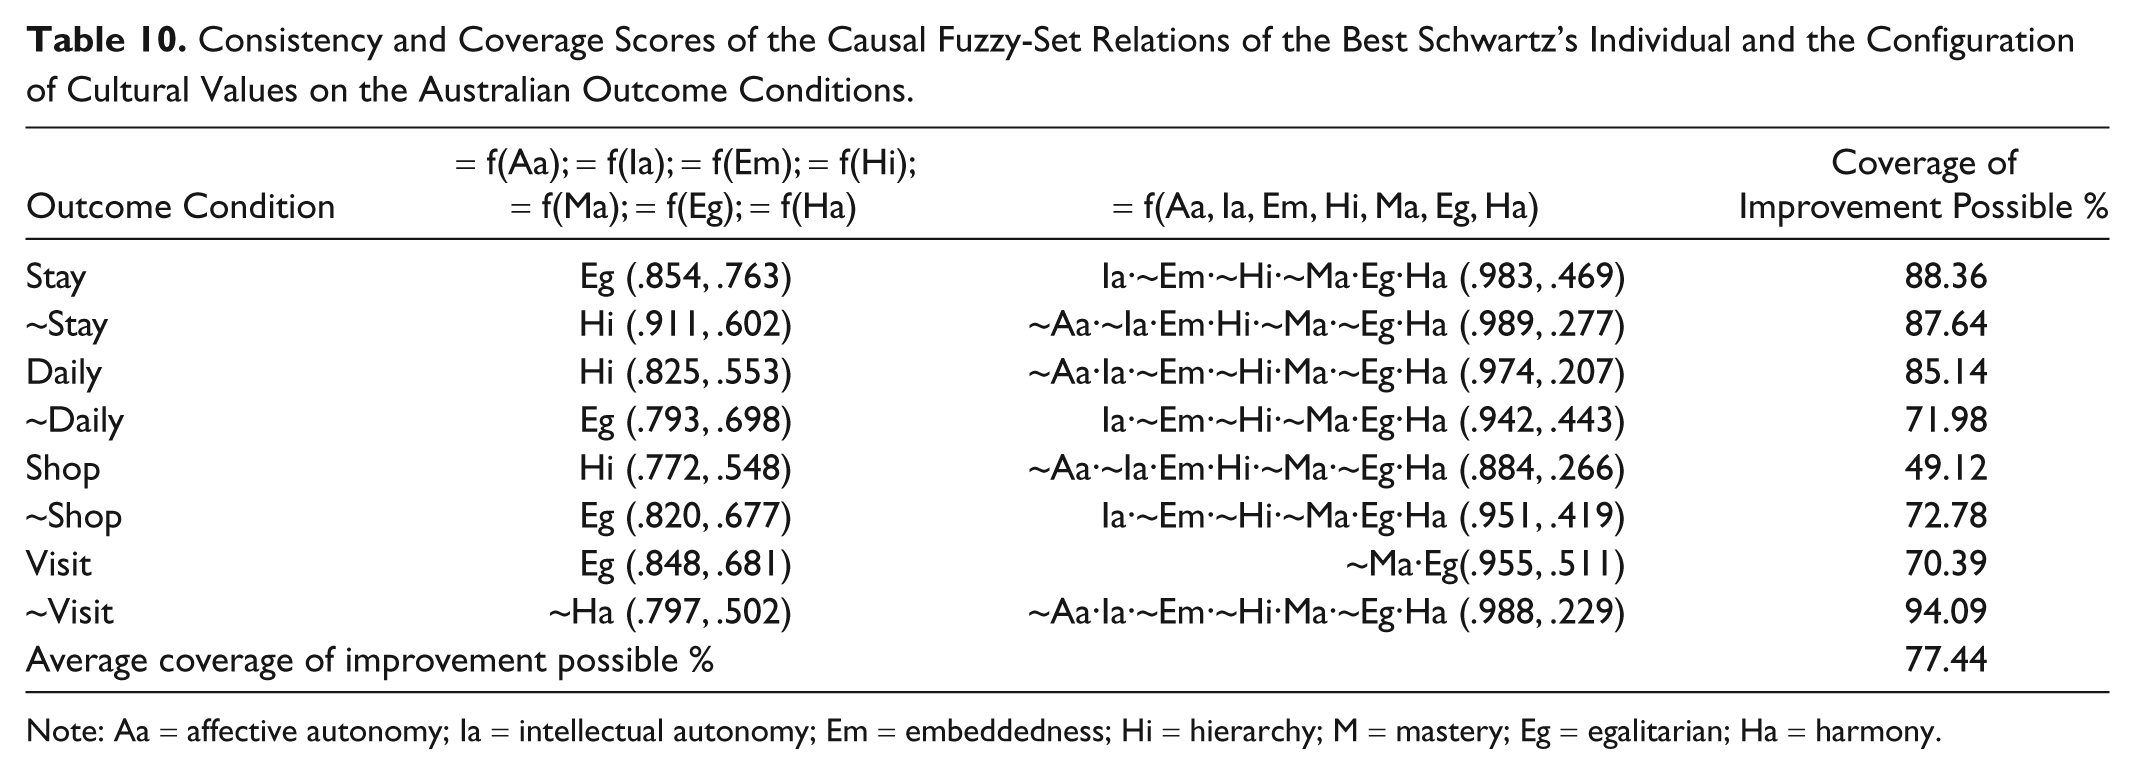
Note: Aa = affective autonomy; Ia = intellectual autonomy; Em = embeddedness; Hi = hierarchy; M = mastery; Eg = egalitarian; Ha = harmony.
Consistency and Coverage Scores of the Causal Fuzzy-Set Relations of the Best Steenkamp’s Individual and the Configuration of Cultural Values on the Australian Outcome Conditions.
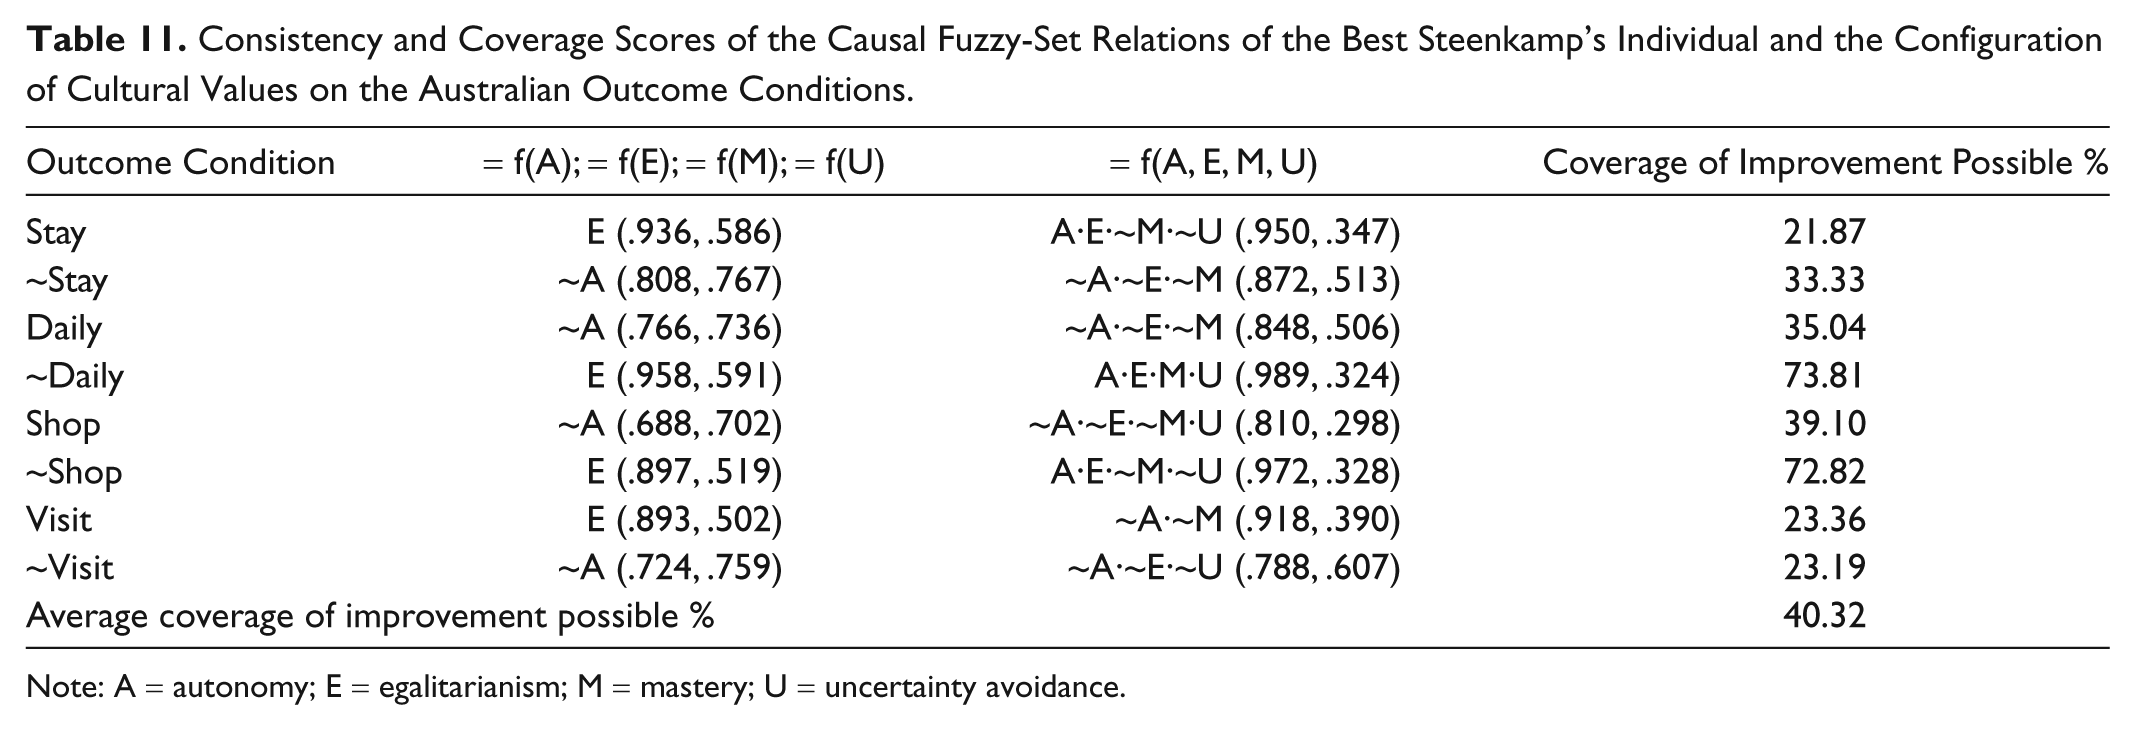
Note: A = autonomy; E = egalitarianism; M = mastery; U = uncertainty avoidance.
Similar to the analysis with Australian consumption data, the analysis with American consumption data also shows the configurations of cultural values score higher in consistency than individual values for Hofstede’s, Inglehart’s, Schwartz’s, and Steenkamp’s theories (see Tables 12-15 for details). The average improvement possible of the consistency scores of fuzzy-set relations are 59%, 55%, 46%, and 68% for Hofstede, Inglehart, Schwartz, and Steenkamp theories, respectively. Based on the analysis, cultures should be viewed as configurations of values rather than as individual values acting alone when studying culture’s influences on consumer behavior.
Consistency and Coverage Scores of the Causal Fuzzy-Set Relations of the Best Hofstede’s Individual and the Configuration of Cultural Values on the American Outcome Conditions.
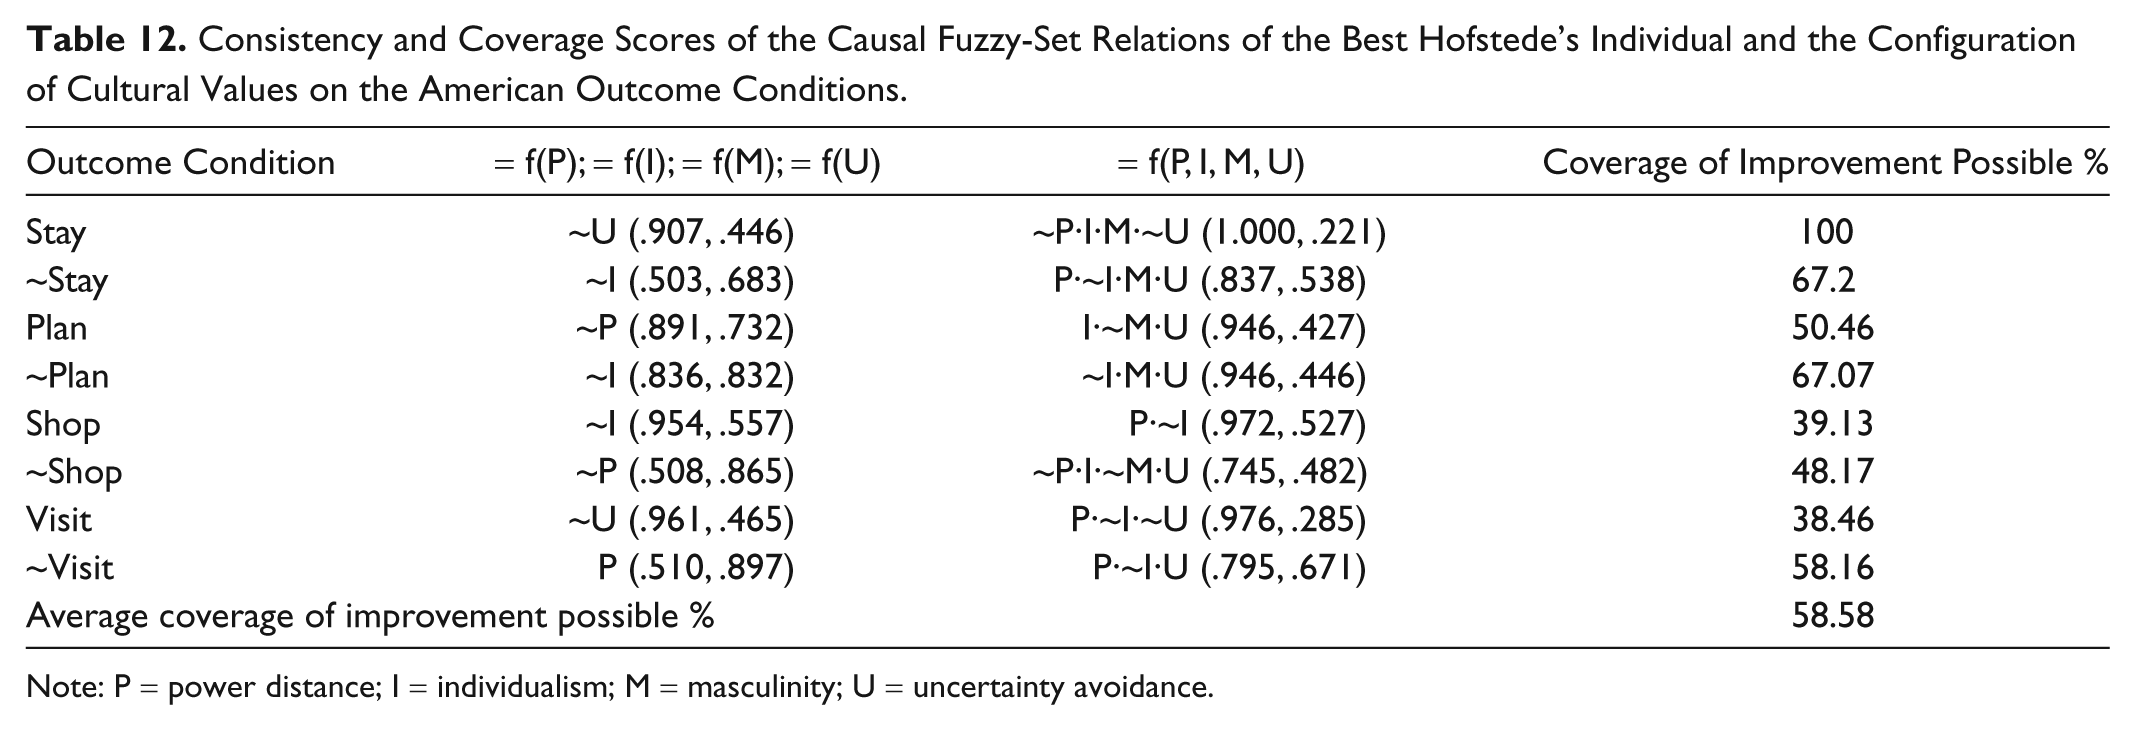
Note: P = power distance; I = individualism; M = masculinity; U = uncertainty avoidance.
Consistency and Coverage Scores of the Causal Fuzzy-Set Relations of the Best Inglehart’s Individual and the Configuration of Cultural Values on the American Outcome Conditions.

Note: T = traditional; S = survival.
Consistency and Coverage Scores of the Causal Fuzzy-Set Relations of the Best Schwartz’s Individual and the Configuration of Cultural Values on the American Outcome Conditions.
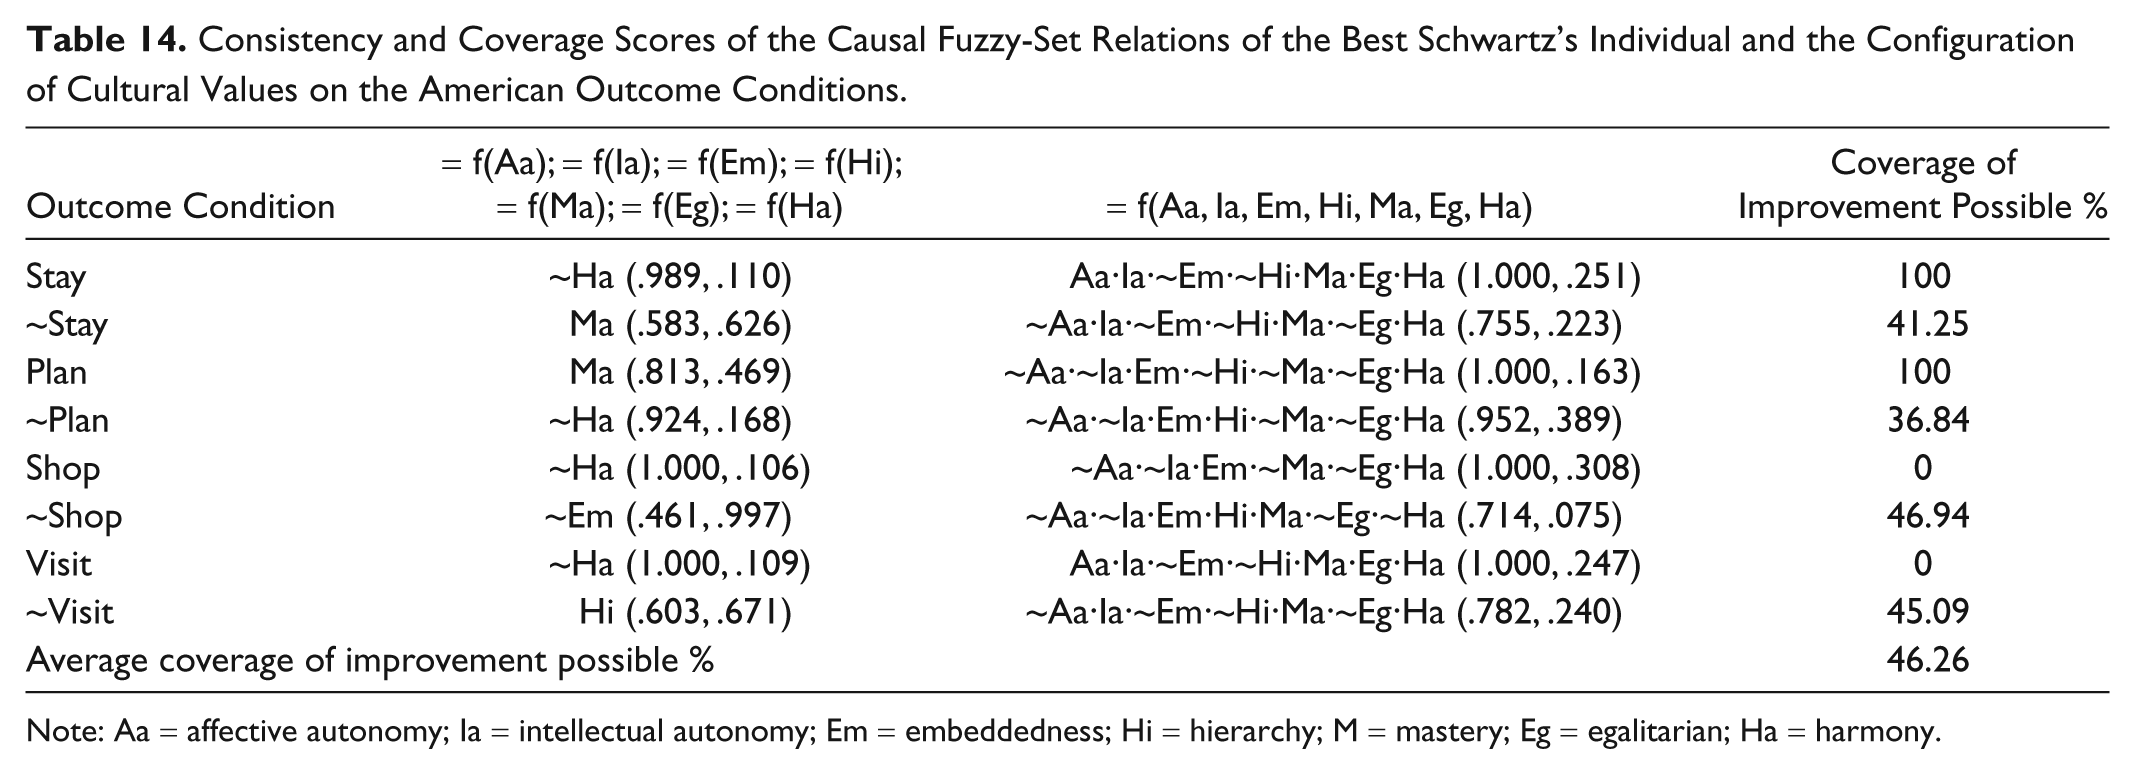
Note: Aa = affective autonomy; Ia = intellectual autonomy; Em = embeddedness; Hi = hierarchy; M = mastery; Eg = egalitarian; Ha = harmony.
Consistency and Coverage Scores of the Causal Fuzzy-Set Relations of the Best Steenkamp’s Individual and the Configuration of Cultural Values on the American Outcome Conditions.

Note: A = autonomy; E = egalitarianism; M = mastery; U = uncertainty avoidance.
Proposition 2: Nations Differ in Meaningful Ways by Configurations of Values
In order to estimate the best cultural configuration to represent each country under each of the four cultural theories, cultural value scores of each country from Hofstede’s, Inglehart’s, Schwartz’s, and Steenkamp’s theories were entered into EXCEL.csv for analysis. A country’s representative cultural configuration is identified by choosing the maximum score from all the possible cultural configuration scores of that country.
The study examined data from 15 countries including Australia, Brazil, France, Germany, Hong Kong, Italy, Japan, Malaysia, the Netherlands, New Zealand, Singapore, Spain, Switzerland, Taiwan, and the United States. Table 16 shows the representative cultural configurations for each country using Hofstede’s cultural theory. (Additional summary tables for representative culture configurations for the Inglehart, Schwartz, and Steenkamp theories are available on request from the authors.)
Representative Cultural Configurations by Hofstede’s Theory.
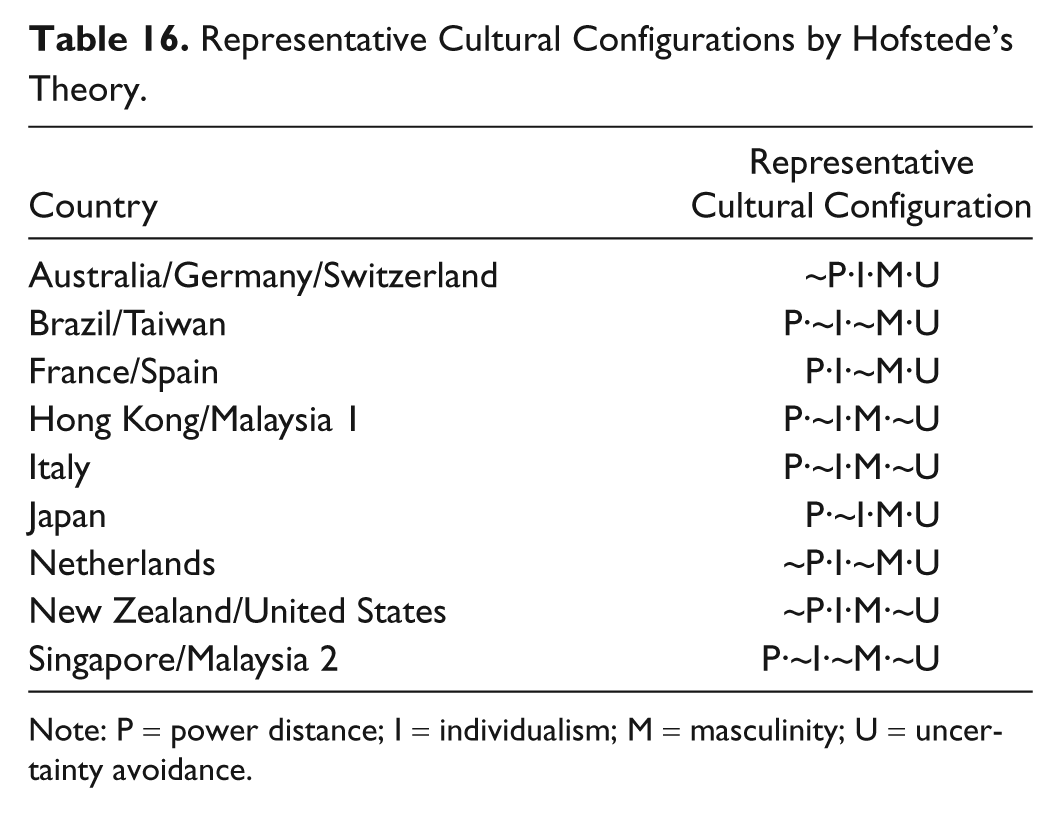
Note: P = power distance; I = individualism; M = masculinity; U = uncertainty avoidance.
Although there are 16 possible cultural configurations using the four cultural values in Hofstede’s theory, not all of them occur in the countries studied. Table 16 shows that all of the Eastern countries in the study, including Hong Kong, Japan, Malaysia, Singapore, and Taiwan, are high in power distance and low in individualism while most Western countries are low in power distance (except for Italy, France, and Spain) and high in individualism (except for Italy). Unlike other Western countries, Italy and the Netherlands are special cases and their cultural configurations are exactly opposite from each other.
Only four possible cultural configurations exist with Inglehart’s theory because he has only two cultural value dimensions. Singapore is culturally distinct from all of the other 14 countries in the study, and Singapore is high in both traditional and survival values. Other Asian countries, such as Hong Kong, Japan, and Taiwan, are low in traditional (high in secular-rational) and high in survival values. European countries, including France, Germany, Italy, the Netherlands, Spain, and Switzerland, are grouped together with Australia and New Zealand as high secular and high self-expression countries. However, since New Zealand is located in the boundary between traditional and secular-rational values, New Zealand can also be classified with Brazil, Malaysia, and the United States as a high self-expression country.
Schwartz’s seven cultural values permit 128 possible cultural configurations. Compared to the other three cultural theories, the additional cultural configurations permitted applying Schwartz’s theory are useful for representing the 15 countries in the study. Most Eastern countries, except for Japan, are low in affective autonomy and high in embeddedness; most Western countries are high in affective autonomy and low in embeddedness.
With Steenkamp’s theory, most Western countries are high in autonomy (except for Italy) and high in egalitarianism (except for Australia, New Zealand, and the United States), while most Eastern countries are low in both autonomy and egalitarianism (except for Japan, which is high in autonomy).
Inglehart’s theory is limited to only two cultural value dimensions. Hofstede’s, Schwartz’s, and Steenkamp’s theories, on the other hand, show that distinct cultural differences exist between Eastern and Western countries no matter which of the three culture theories applies. Eastern countries, such as Hong Kong, Japan, Malaysia, Singapore, and Taiwan, either stand out alone with unique cultural configurations or group together with other Eastern countries. The conclusion applies to the Western countries as well.
Among the 15 countries in the study, the cultural configuration of Brazil is the same as that of some Eastern and some Western countries. For example, Brazil’s cultural configuration is not only the same as Taiwan’s with Hofstede’s, Schwartz’s, and Steenkamp’s theories, but also the same as New Zealand’s and the United States’ with Inglehart’s theory. The study illustrates how culture affects consumer behaviors by showing the consumption patterns of some countries in testing the fifth proposition.
Proposition 3: Order of Impact: Schwartz > Steenkamp > Hofstede > Inglehart > GDP and Distance
Meta-analysis was used to estimate the usefulness of the four cultural theories and demographic conditions (GDP per capita and home-destination distance) in explaining and predicting consumer behavior. Consistency index scores over 0.749 of the best fitting models of the four theories and G•D for affirmation and negation of the four consumption data were estimated, including length of stay, not length of stay, daily expenditure, not daily expenditure, shopping expenditure, not shopping expenditure, number of states/regions visited, and not number of states/regions visited, for international inbound visitors to Australia. The same analyses were run using the American-visit consumption data, including length of stay, not length of stay, pre-trip planning, not pre-trip planning, shopping expenditure, not shopping expenditure, number of states/regions visited, and not number of states/regions visited, for international inbound visitors to the United States.
Figure 2 shows that after analyzing Australian consumption data, Schwartz’s theory was the most useful one followed by Steenkamp’s, Inglehart’s, G•D, and Hofstede’s theory, in explaining and predicting consumer behavior. Not only is the mean consistency score of Schwartz’s theory higher than those of the other three theories and the demographic data, but also the range of the means for Schwartz’s theory ± 1.96 standard errors is tighter than those of the others. In other words, the findings of the meta-analysis indicate that Schwartz’s theory is more powerful and can more accurately estimate consumer behavior than the other three theories or the demographic configurations.
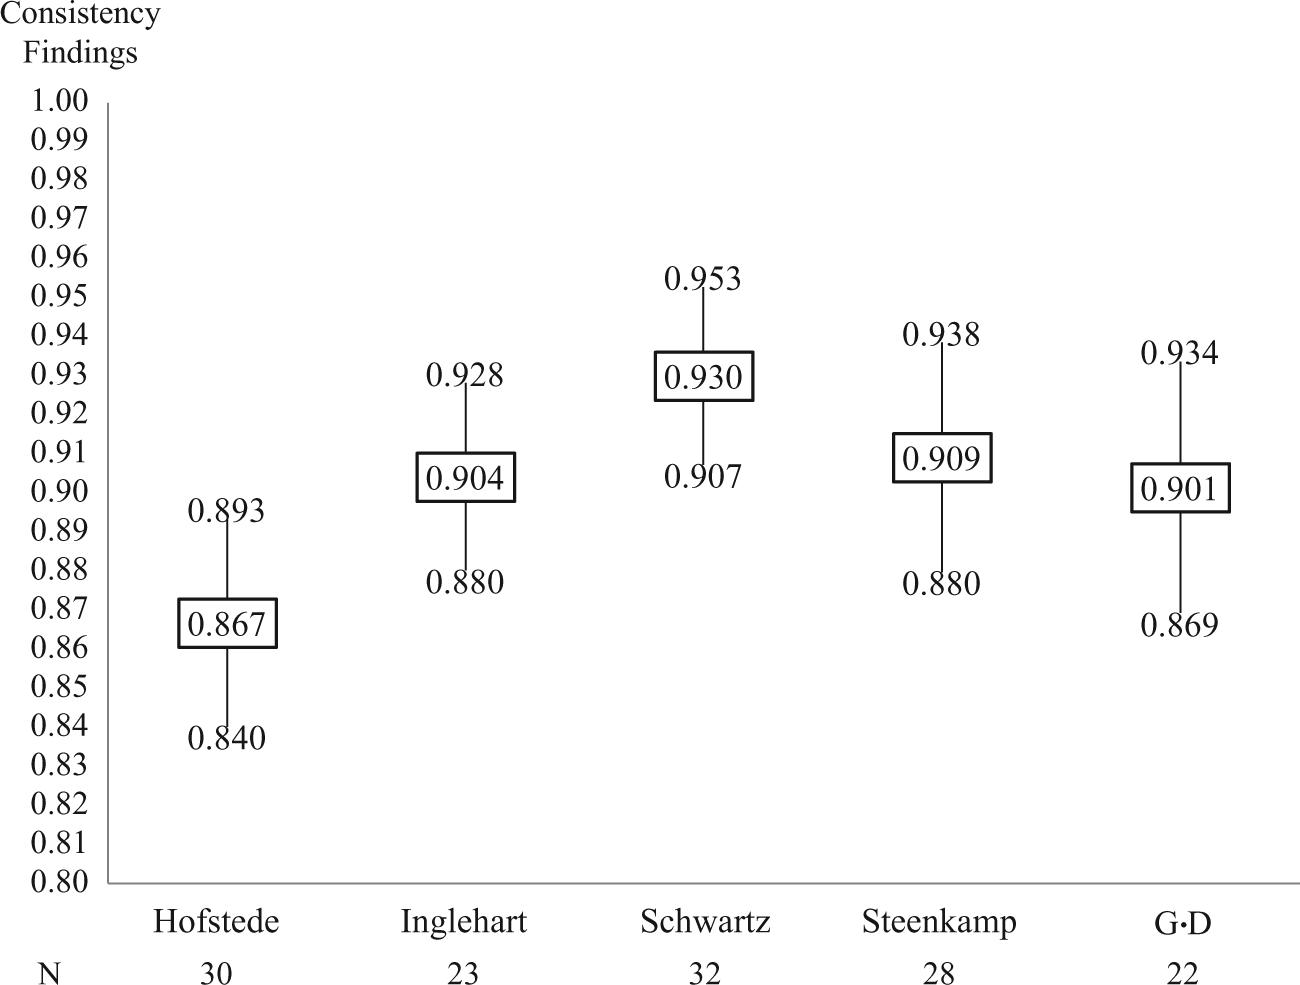
Meta-analysis of consistency averages of best-fitting models of four theories and G•D for grouped data of visitors to Australia (range covering ± 1.96 average values for consistency estimates > 0.749).
However, analysis of the American consumption data yields different results. Figure 3 shows Hofstede’s, Inglehart’s, and Schwartz’s theories perform better than Steenkamp’s theory and the demographic configurations in explaining and predicting consumer behaviors. Also, the ranges of the theories in Figure 3 are much wider than those in Figure 2. The discrepancy between the findings of the two analyses may be due primarily to the higher consistency score for the Australian versus the American data.

Meta-analysis of consistency averages of best-fitting models of four theories and G•D for grouped data of visitors to United States (range covering ± 1.96 average values for consistency estimates > 0.749).
Proposition 4: Cultural Influences Differ by Purposes of the Trip and Previous Trip Experience
Meta-analysis was applied to analyze whether or not cultural influences on consumer behavior differ by purposes of the trip and previous experience. Figures 4 to 8 show the findings of the meta-analysis by four purposes of the trip for visitors to Australia applying Hofstede’s, Inglehart’s, Schwartz’s, and Steenkamp’s theories as well as the demographic configurations.
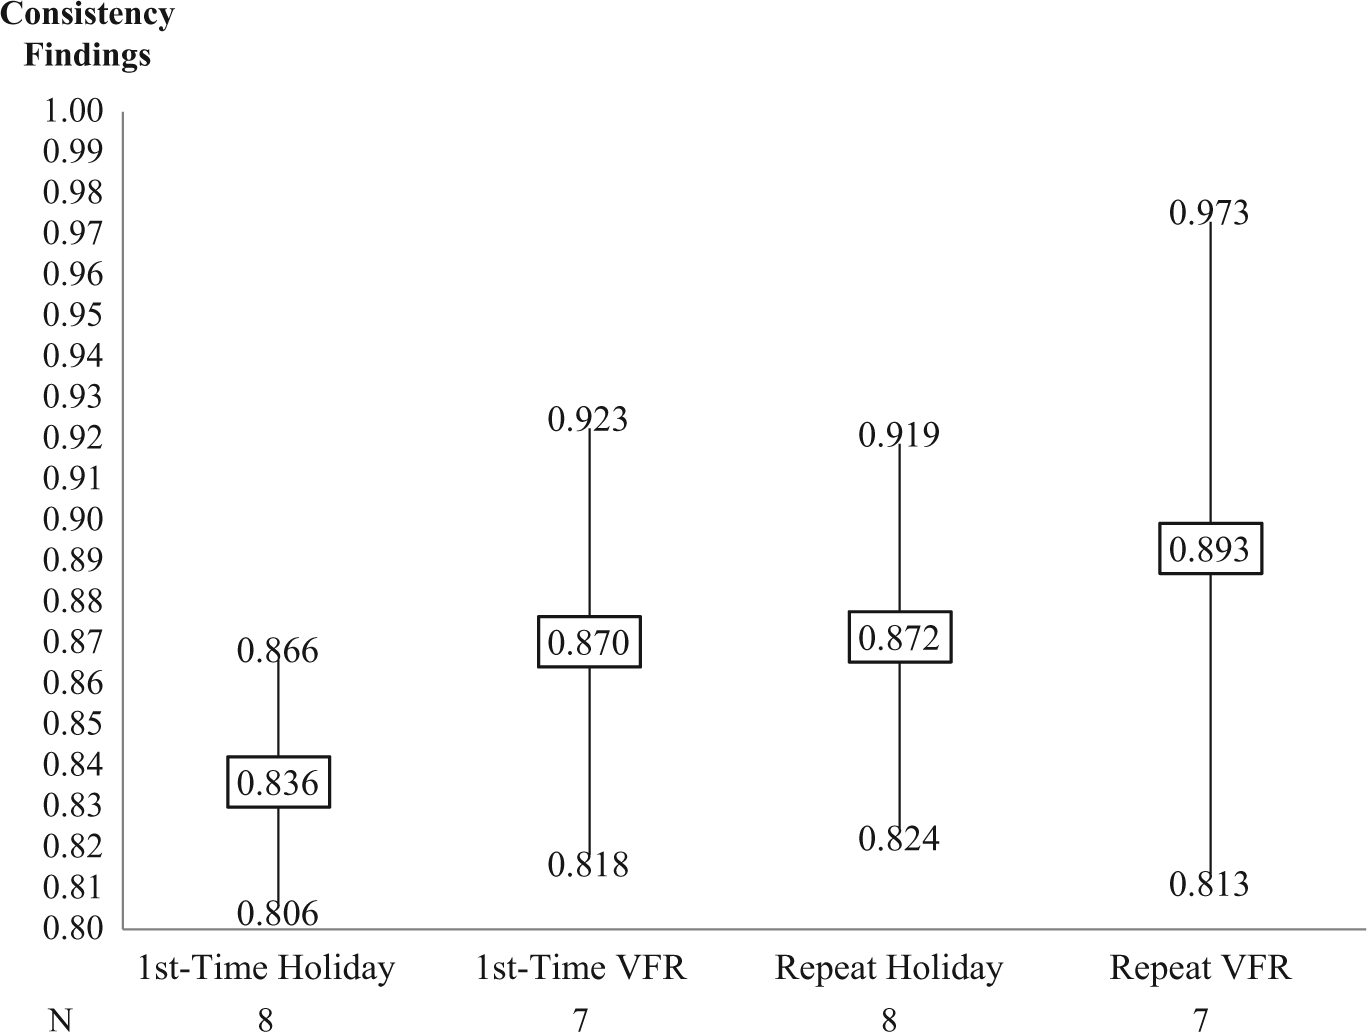
Meta-analysis of consistency averages of Hofstede’s best-fitting models by four purposes for grouped data of visitors to Australia (range covering ± 1.96 average values for consistency estimates > 0.749).

Meta-analysis of consistency averages of Inglehart’s best-fitting models by four purposes for grouped data of visitors to Australia (range covering ± 1.96 average values for consistency estimates > 0.749).

Meta-analysis of consistency averages of Schwartz’s best-fitting models by four purposes for grouped data of visitors to Australia (range covering ± 1.96 average values for consistency estimates > 0.749).

Meta-analysis of consistency averages of Steenkamp’s best-fitting models by four purposes for grouped data of visitors to Australia (range covering ± 1.96 average values for consistency estimates > 0.749).
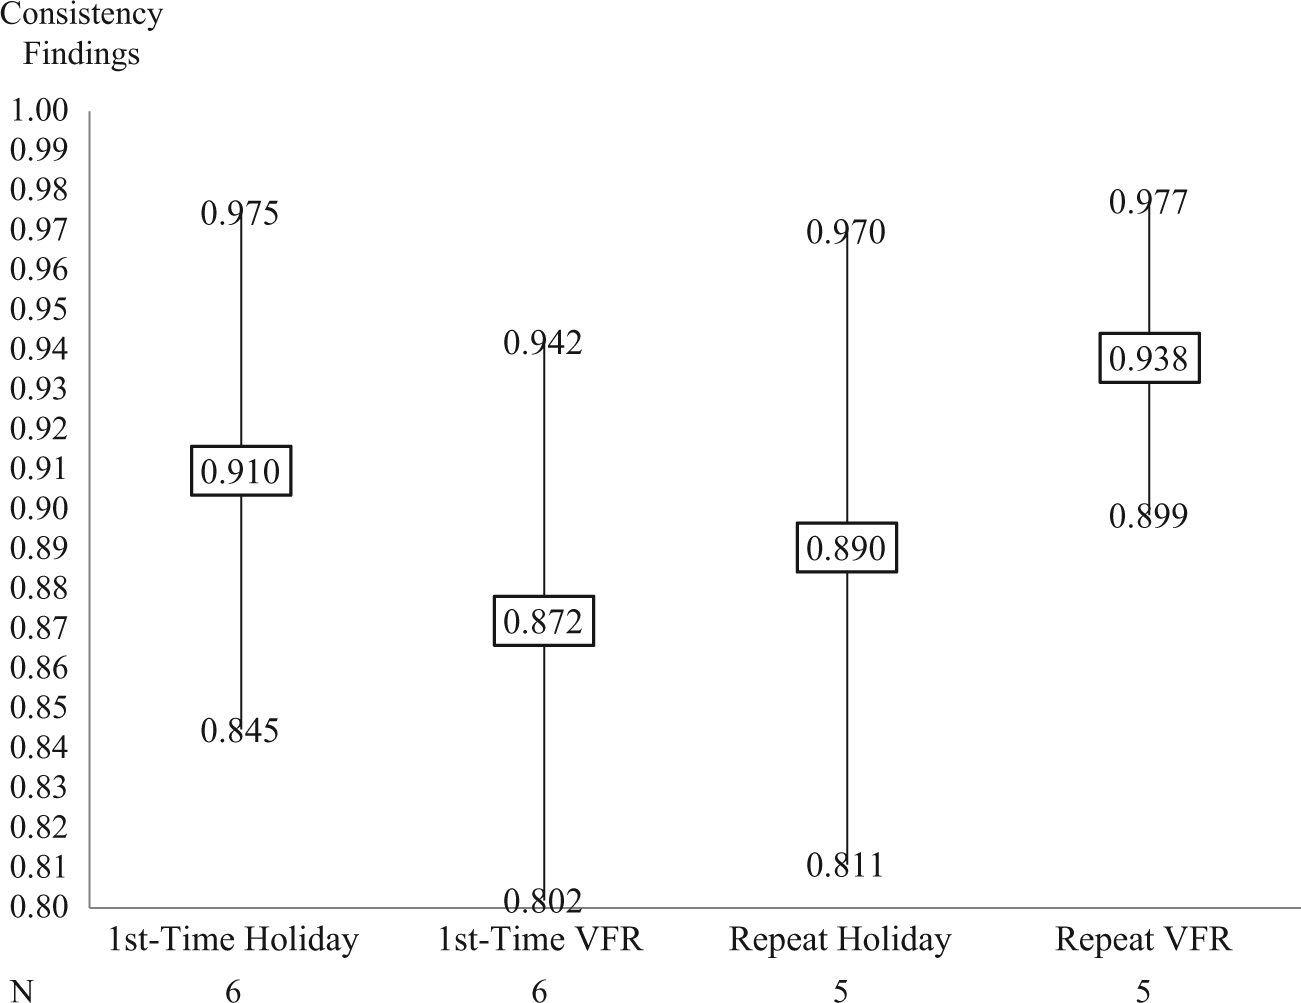
Meta-analysis of consistency averages of best G·D-fitting models by four purposes for grouped data of visitors to Australia (range covering ± 1.96 average values for consistency estimates > 0.749).
As Figures 4 through 7 illustrate, the ranges of the means ± 1.96 standard errors of first-time holiday travelers for all four cultural theories are obviously narrower than those of the other three experience/purpose combinations for all four cultural theories. This finding demonstrates cultural configurations are able to estimate the behaviors more accurately for first-time holiday visitors than visitors with other trip purposes and previous experience. Thus, culture’s influences are stronger for first-time holiday visitors than for VFR visitors and repeat visitors.
Figure 8 shows the ranges of the means ± 1.96 standard errors of repeat VFR travelers for the demographic figures is much tighter than those of the other three experience/purpose combinations. This finding indicates the configuration of GDP per capita and home–destination distance estimates consumer behavior more precisely for repeat VFR visitors than visitors with other trip experience/purposes. In other words, demographic configurations have stronger influence for repeat VFR visitors than visitors on holiday and without previous visit experience.
Figures 4 through 7 also show that Schwartz’s theory is more theoretically and empirically useful for explaining travel behavior outcomes than the other three cultural theories. This finding is illustrated by the patterns of the four trip experience/purpose combinations in the findings of the meta-analysis appearing in Figure 11. The mean consistency scores from high-to-low, as well as the ranges of the means ± 1.96 standard errors from narrow-to-wide, are in the following order: first-time holiday, repeat holiday, first-time VFR, and repeat VFR. The findings support the theory that cultural influences are stronger for holiday visitors than for VFR visitors and for first-time visitors than for repeat visitors.
Therefore, the findings of the meta-analysis confirm the research proposition that culture has powerful influences on the behaviors of first-time holiday visitors. On the other hand, for those who either have experience traveling to a foreign country or who travel to visit friends and relatives, other influences, such as per capita GDP and distance traveled, become stronger than cultural influence. The findings also reaffirm the third proposition that Schwartz’s theory is more theoretically and empirically useful in explaining and predicting consumer behavior than the other culture theories.
Proposition 5: Culture Affects Consumer Behavior
The study examined Proposition 5 in three parts to test whether culture affects consumer behavior and whether differences of consumption behavior exist between Eastern and Western cultures. First, the study identifies the consumption patterns of the countries with their representative cultural configurations. Second, the study compares the findings of Australian and American consumption data to see if the consumption behavioral patterns are consistent in both data sets. Third, the study used the models that best fit consumption behaviors to illustrate how people from Eastern countries behave differently from people from Western countries.
Because of the consistency of the findings relevant to the third proposition, Schwartz’s cultural theory appears to be the most useful theory to explain consumer behavior in the context of this study. Therefore, only Schwartz’s cultural value configurations are used to analyze the consumption data in this study.
The findings for Proposition 4 suggest cultural influences are stronger for first-time holiday visitors than visitors who travel for other purposes, so the study uses only the data of first-time holiday visitors in the Australian data set. In addition, analysis of the second proposition shows that Japan and the Netherlands are the most special Eastern and Western countries among the countries in the study; thus the study uses Schwartz’s cultural value configurations for Japan and the Netherlands to illustrate the influences of culture on consumer behavior for the first two parts of proposition testing in this section.
Figure 9 shows the Japanese cultural configuration (estimated for all countries in the study) works well in explaining consumer behavior for first-time holiday visitors to Australia by using Schwartz’s cultural theory. The Japanese cultural configuration explains and predicts that visitors with strong Japanese cultural characteristics tend to not stay long, to spend much money on food and accommodations daily, to buy a lot of gifts to bring home, and to visit a few regions during their trips to Australia. On the contrary, Figure 10 shows that the Netherlands’ cultural configuration explains that visitors with strong Dutch cultural characteristics tend to stay long, to spend little money on food and accommodations daily, to not buy many gifts to bring home, and to visit many places during their trips to Australia.
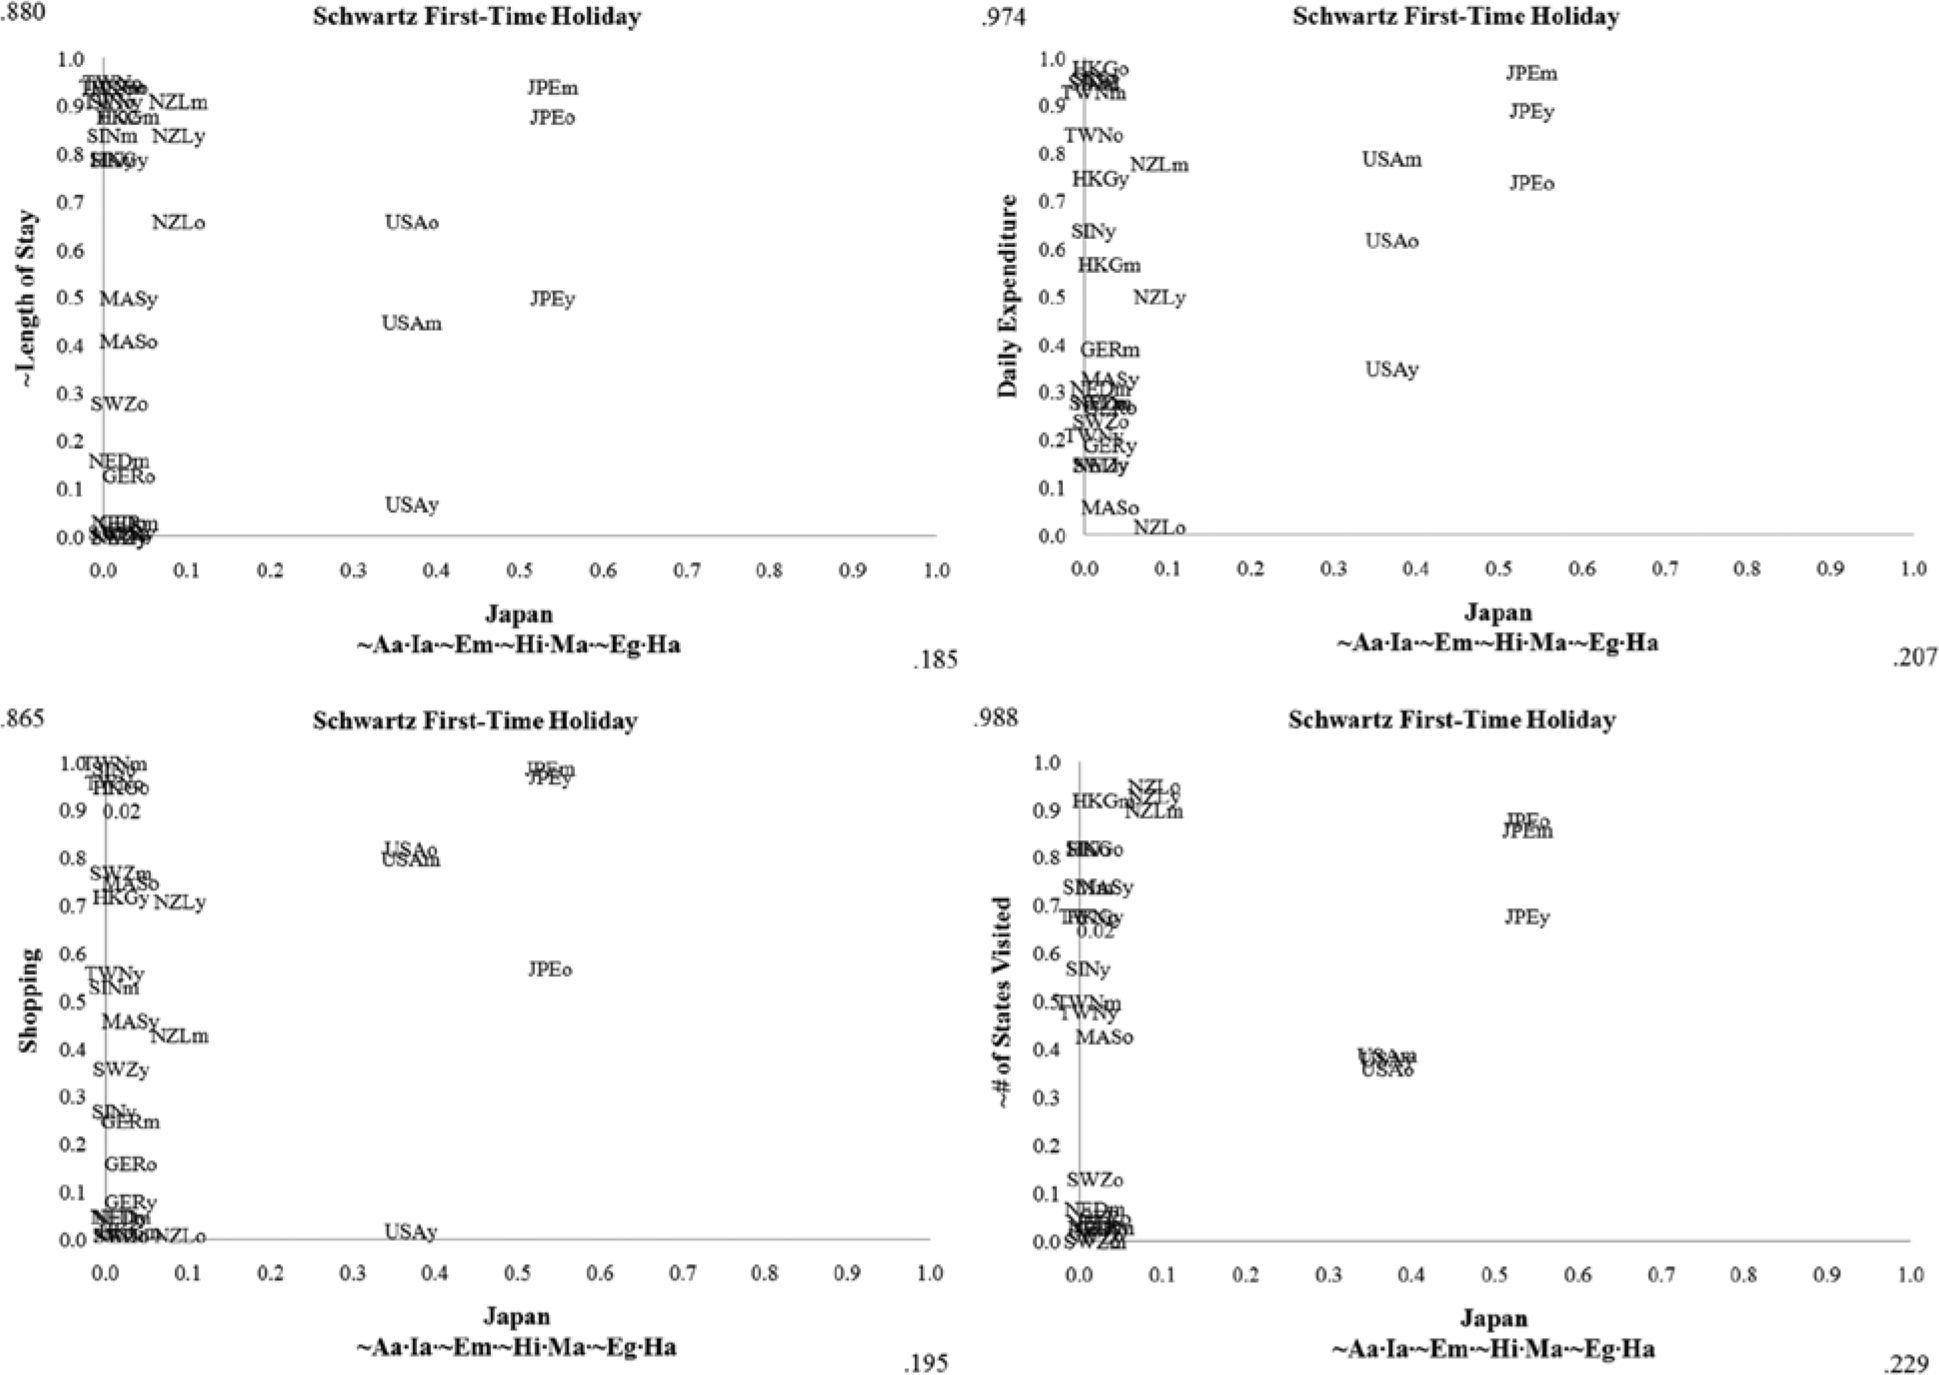
Japanese cultural configuration for first-time holiday visitors to Australia by Schwartz’s cultural theory.
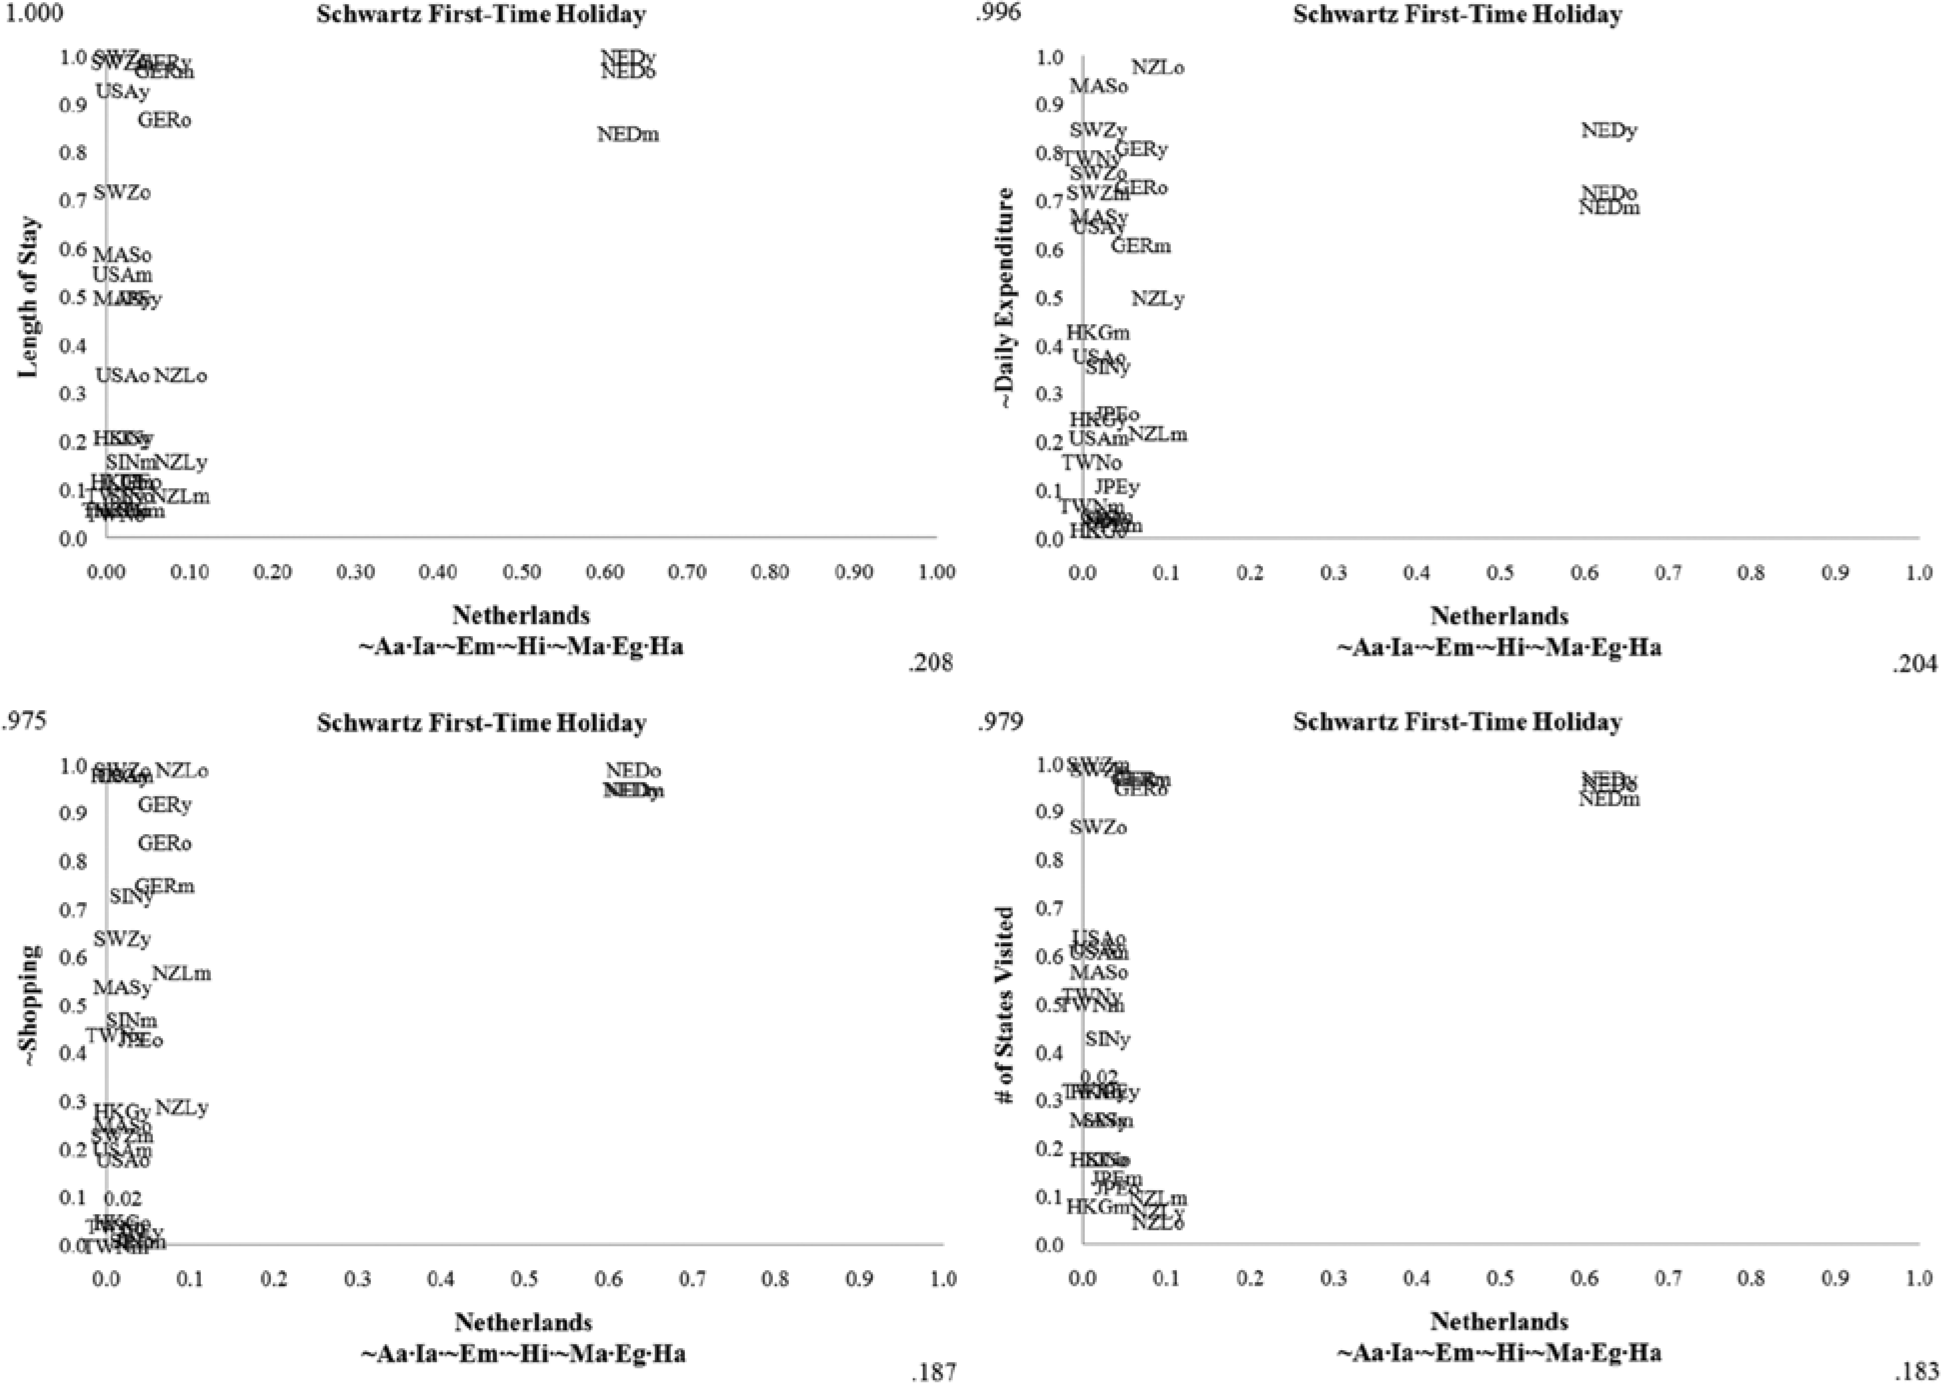
Netherlands’ cultural configuration for first-time holiday visitors to Australia by Schwartz’s cultural theory.
The study included American consumption data to see if the consumption behaviors of Japan and the Netherland’s cultural configurations are consistent for international visitors traveling to Australia and the United States. Figures 11 and 12 show similar findings to Figures 9 and 10. Figure 11 shows visitors with strong Japanese cultural characteristics tend to not stay long, to spend much money on shopping, to visit a few states during their trips to the United States, and to spend little time on planning before the trips. Opposite to Japanese cultural configurations, Figure 12 shows that visitors with strong Dutch cultural characteristics are more likely to stay long, to visit many states during their trips to the United States, and to spend much time on planning before the trips.
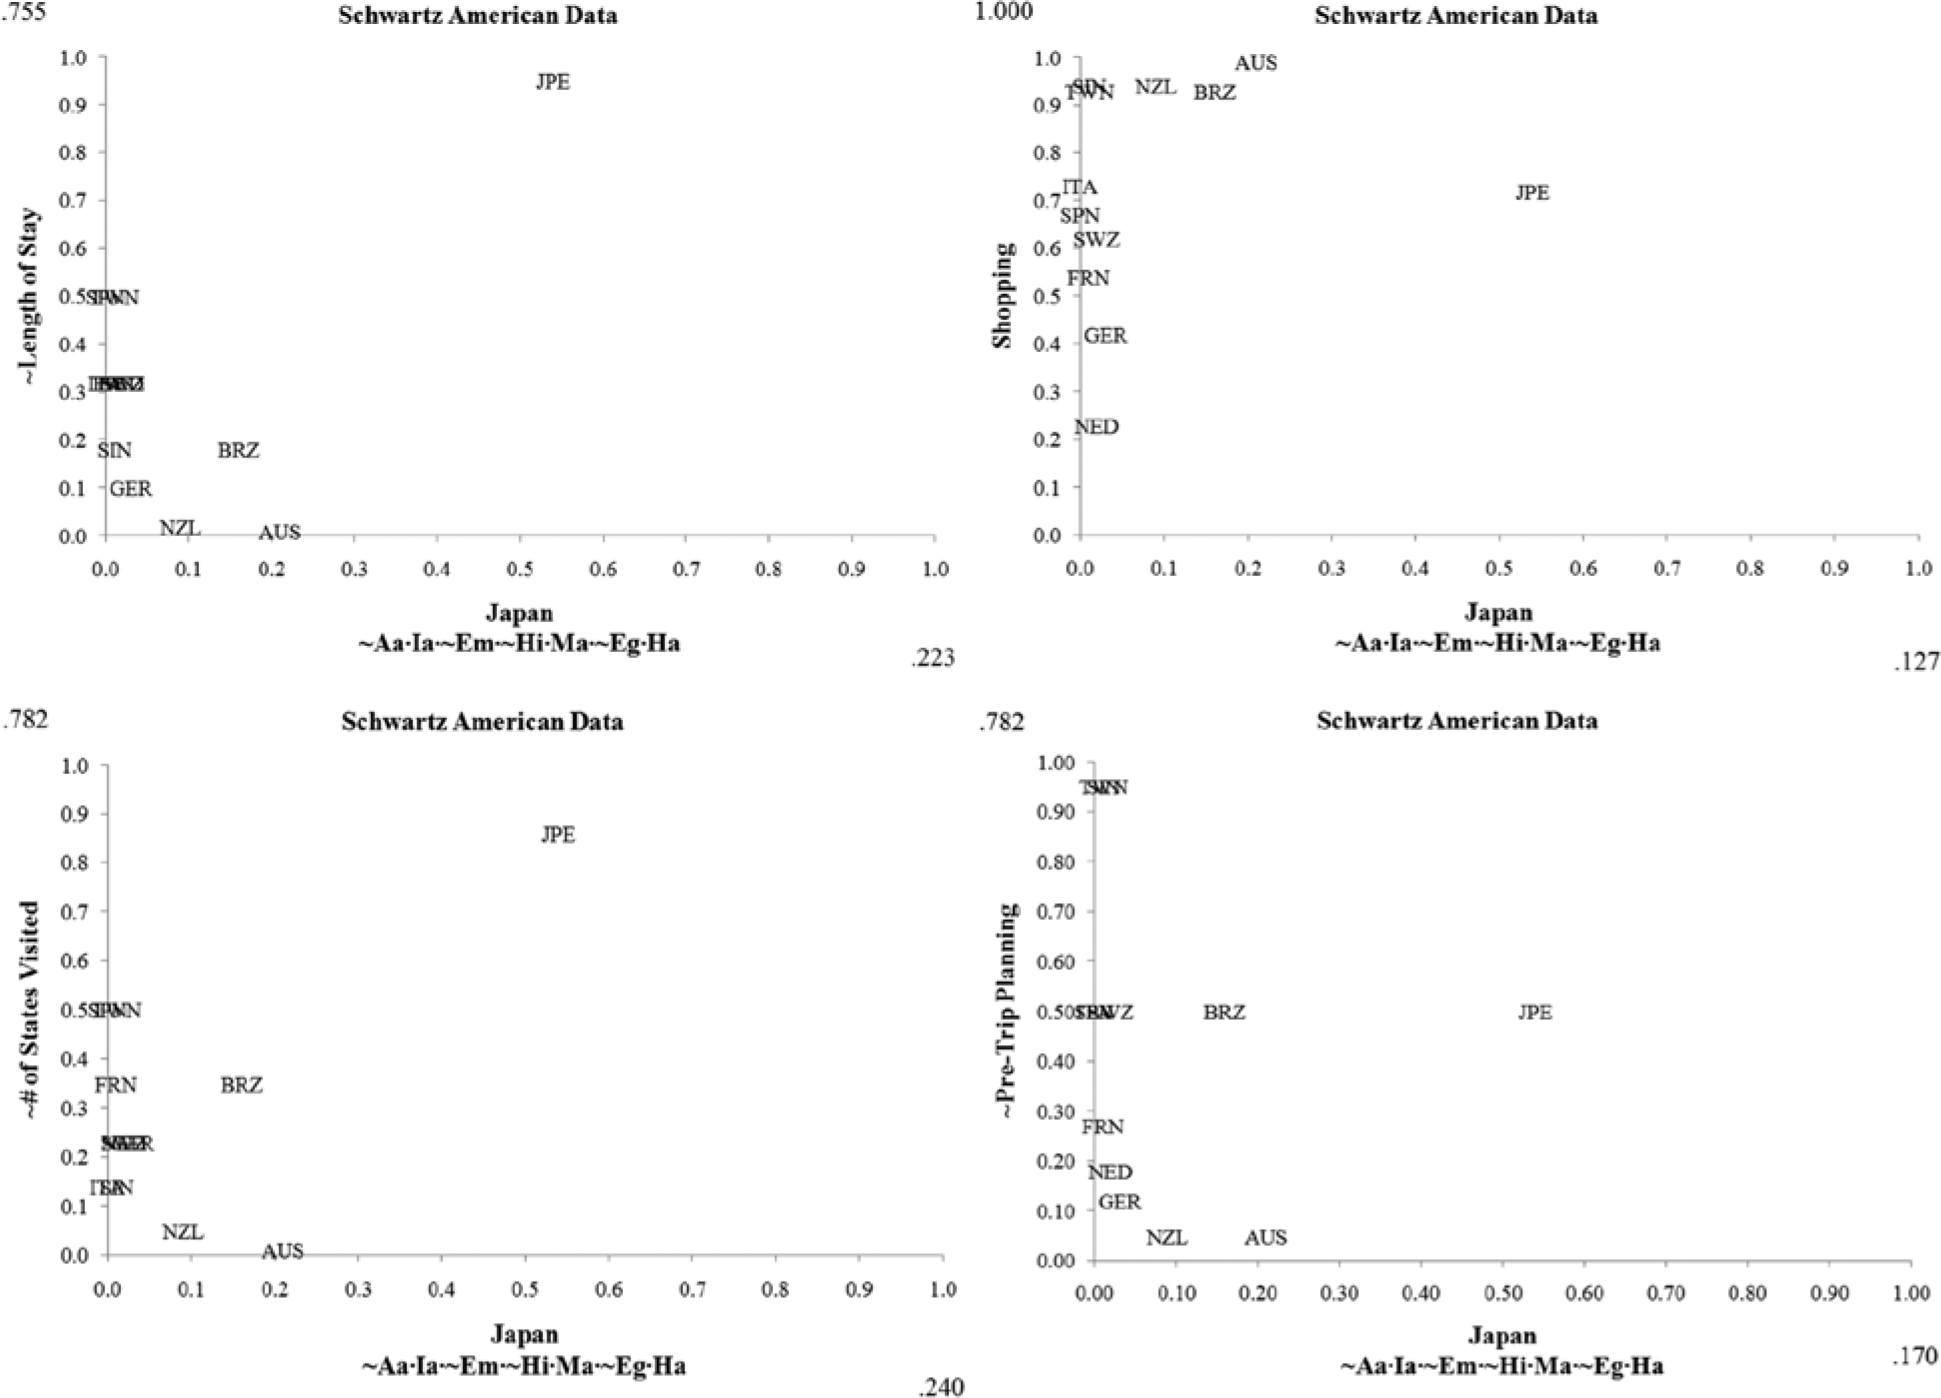
Japanese cultural configuration for visitors to the United States by Schwartz’s cultural theory.
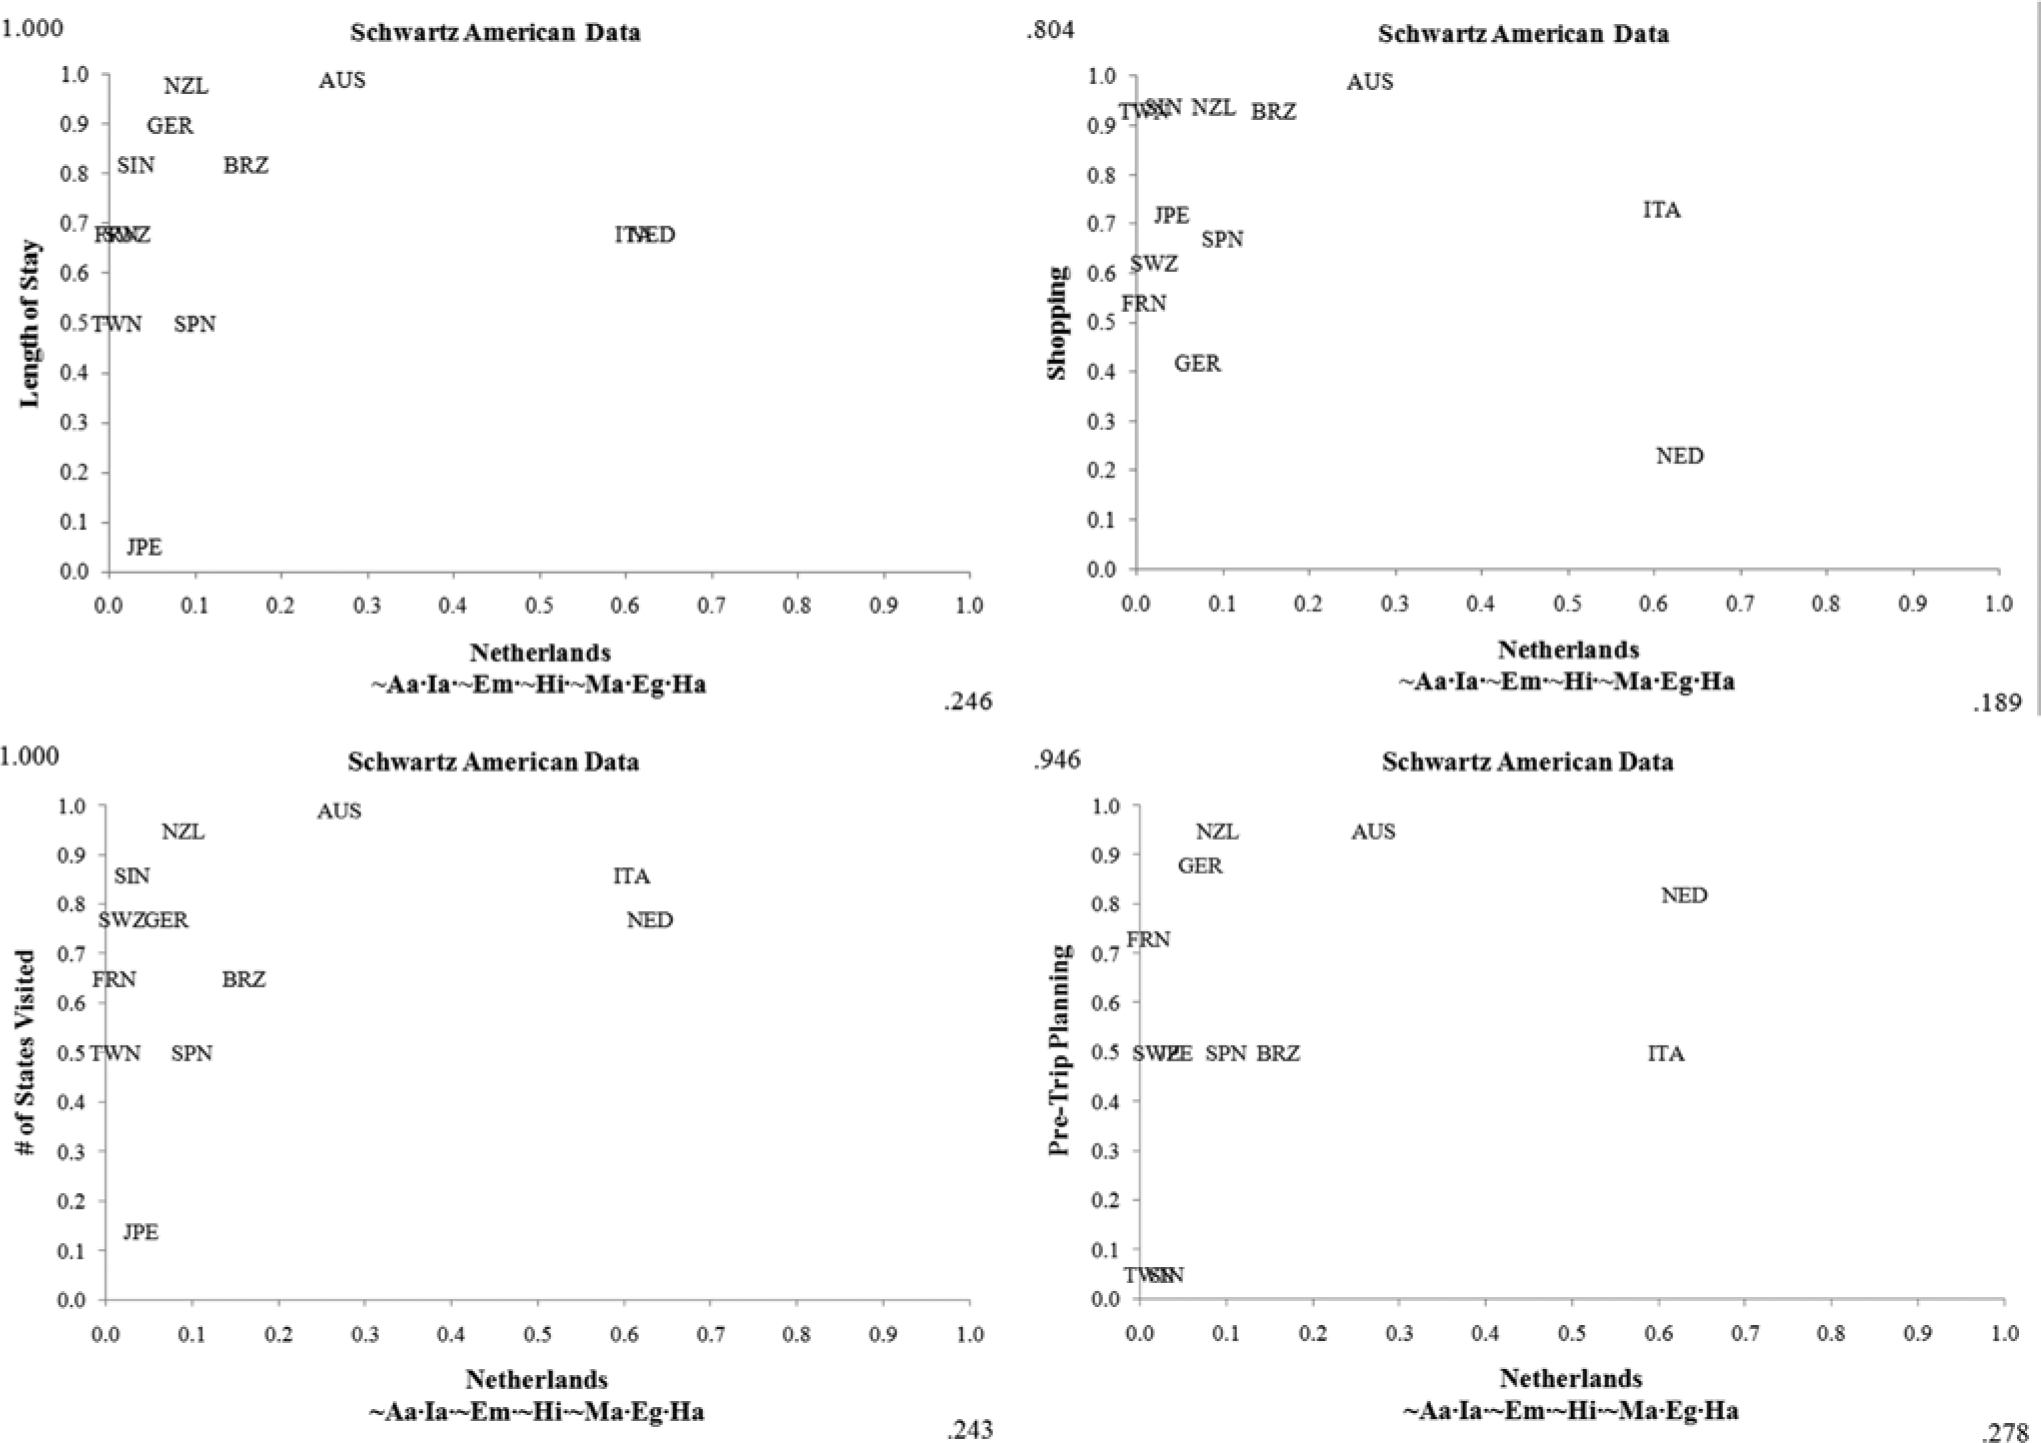
Netherlands’ cultural configuration for visitors to the United States by Schwartz’s cultural theory.
Shopping behavior for the Netherlands’ cultural configuration differs between the Australian and the American data. Visitors with strong Dutch cultural characteristics tend to spend little money on gift shopping when visiting Australia, but they tend to spend much money on shopping when visiting the United States. However, Figure 12 shows that the Netherlands itself is the only exception in the shopping XY plot, which means Netherlanders do not spend much money on shopping.
Figures 13 and 14 summarize the findings of Schwartz’s best-fitting models for visitors to Australia and the United States, respectively. Figure 13 shows Western countries, such as Germany, the Netherlands, and Switzerland, usually stand out on the upper right side of the plots for consumption behaviors, including length of stay, not daily expenditure, not shopping, and number of states visited. This plot indicates that people from Western countries are more likely to stay more nights, spend less money on food and accommodations daily, shop for fewer gifts to bring home, and visit more regions during their trips to Australia than people from Eastern countries.
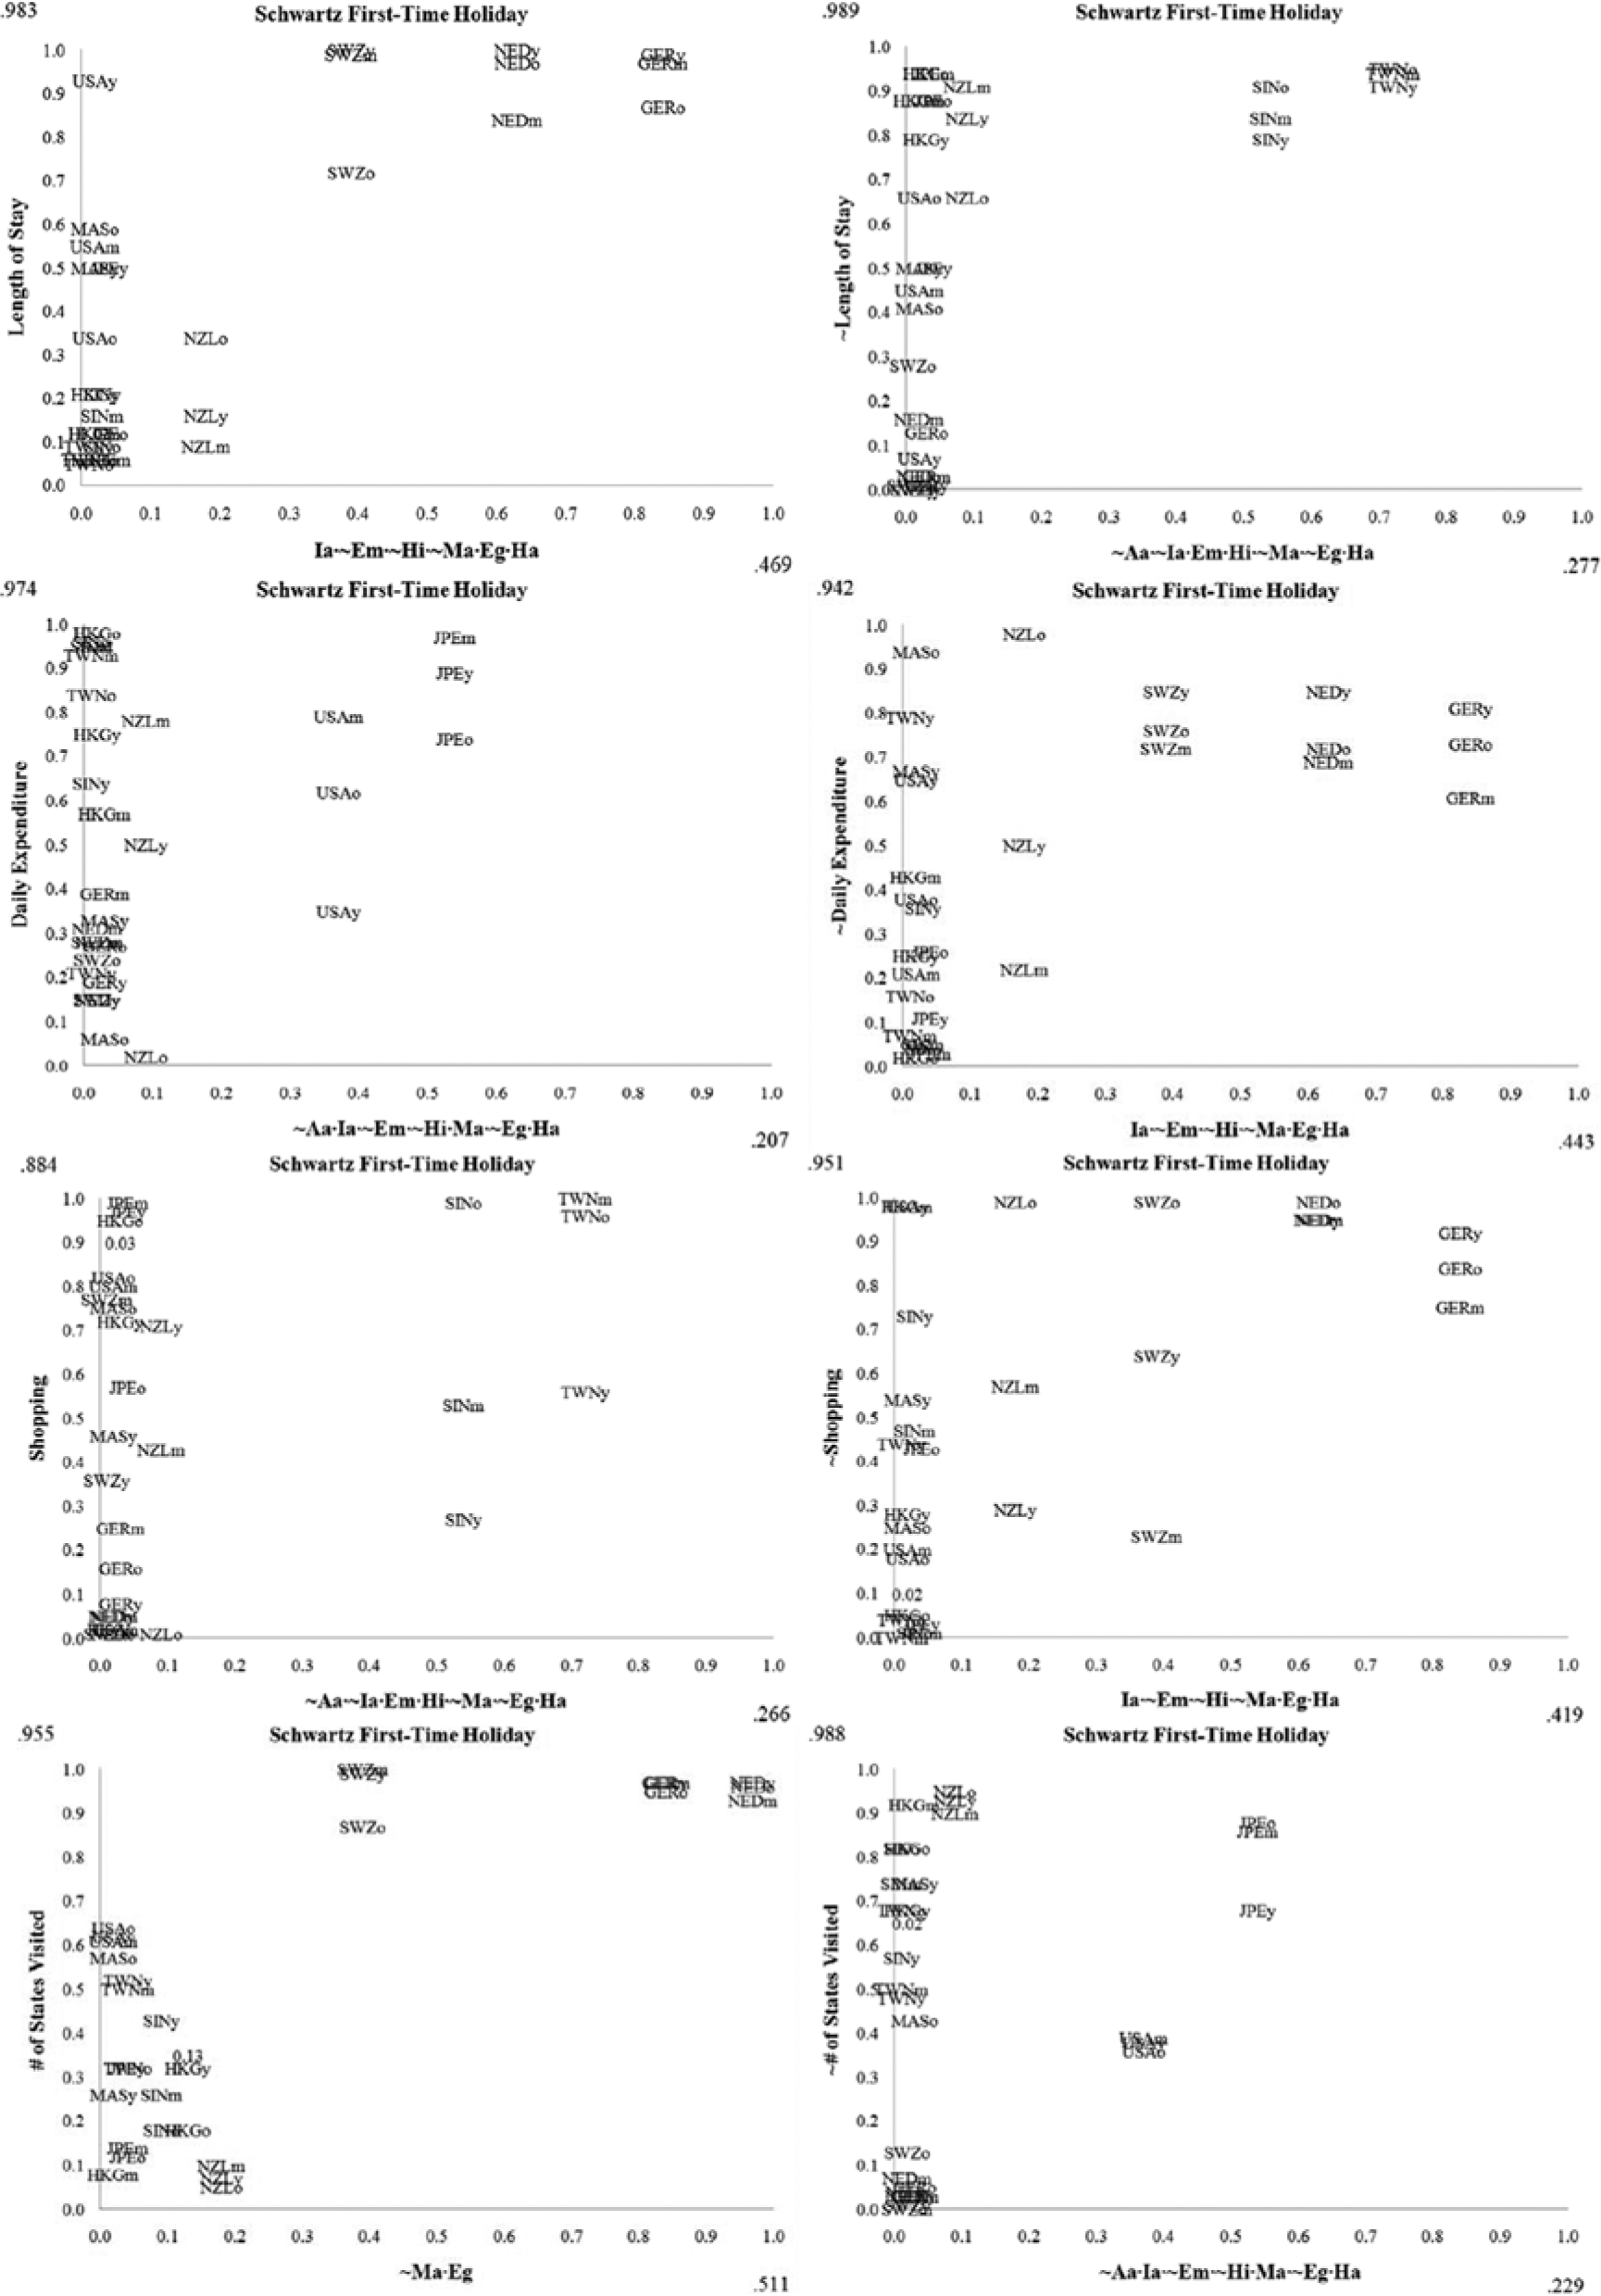
Schwartz’s best-fitting models for first-time holiday visitors to Australia.
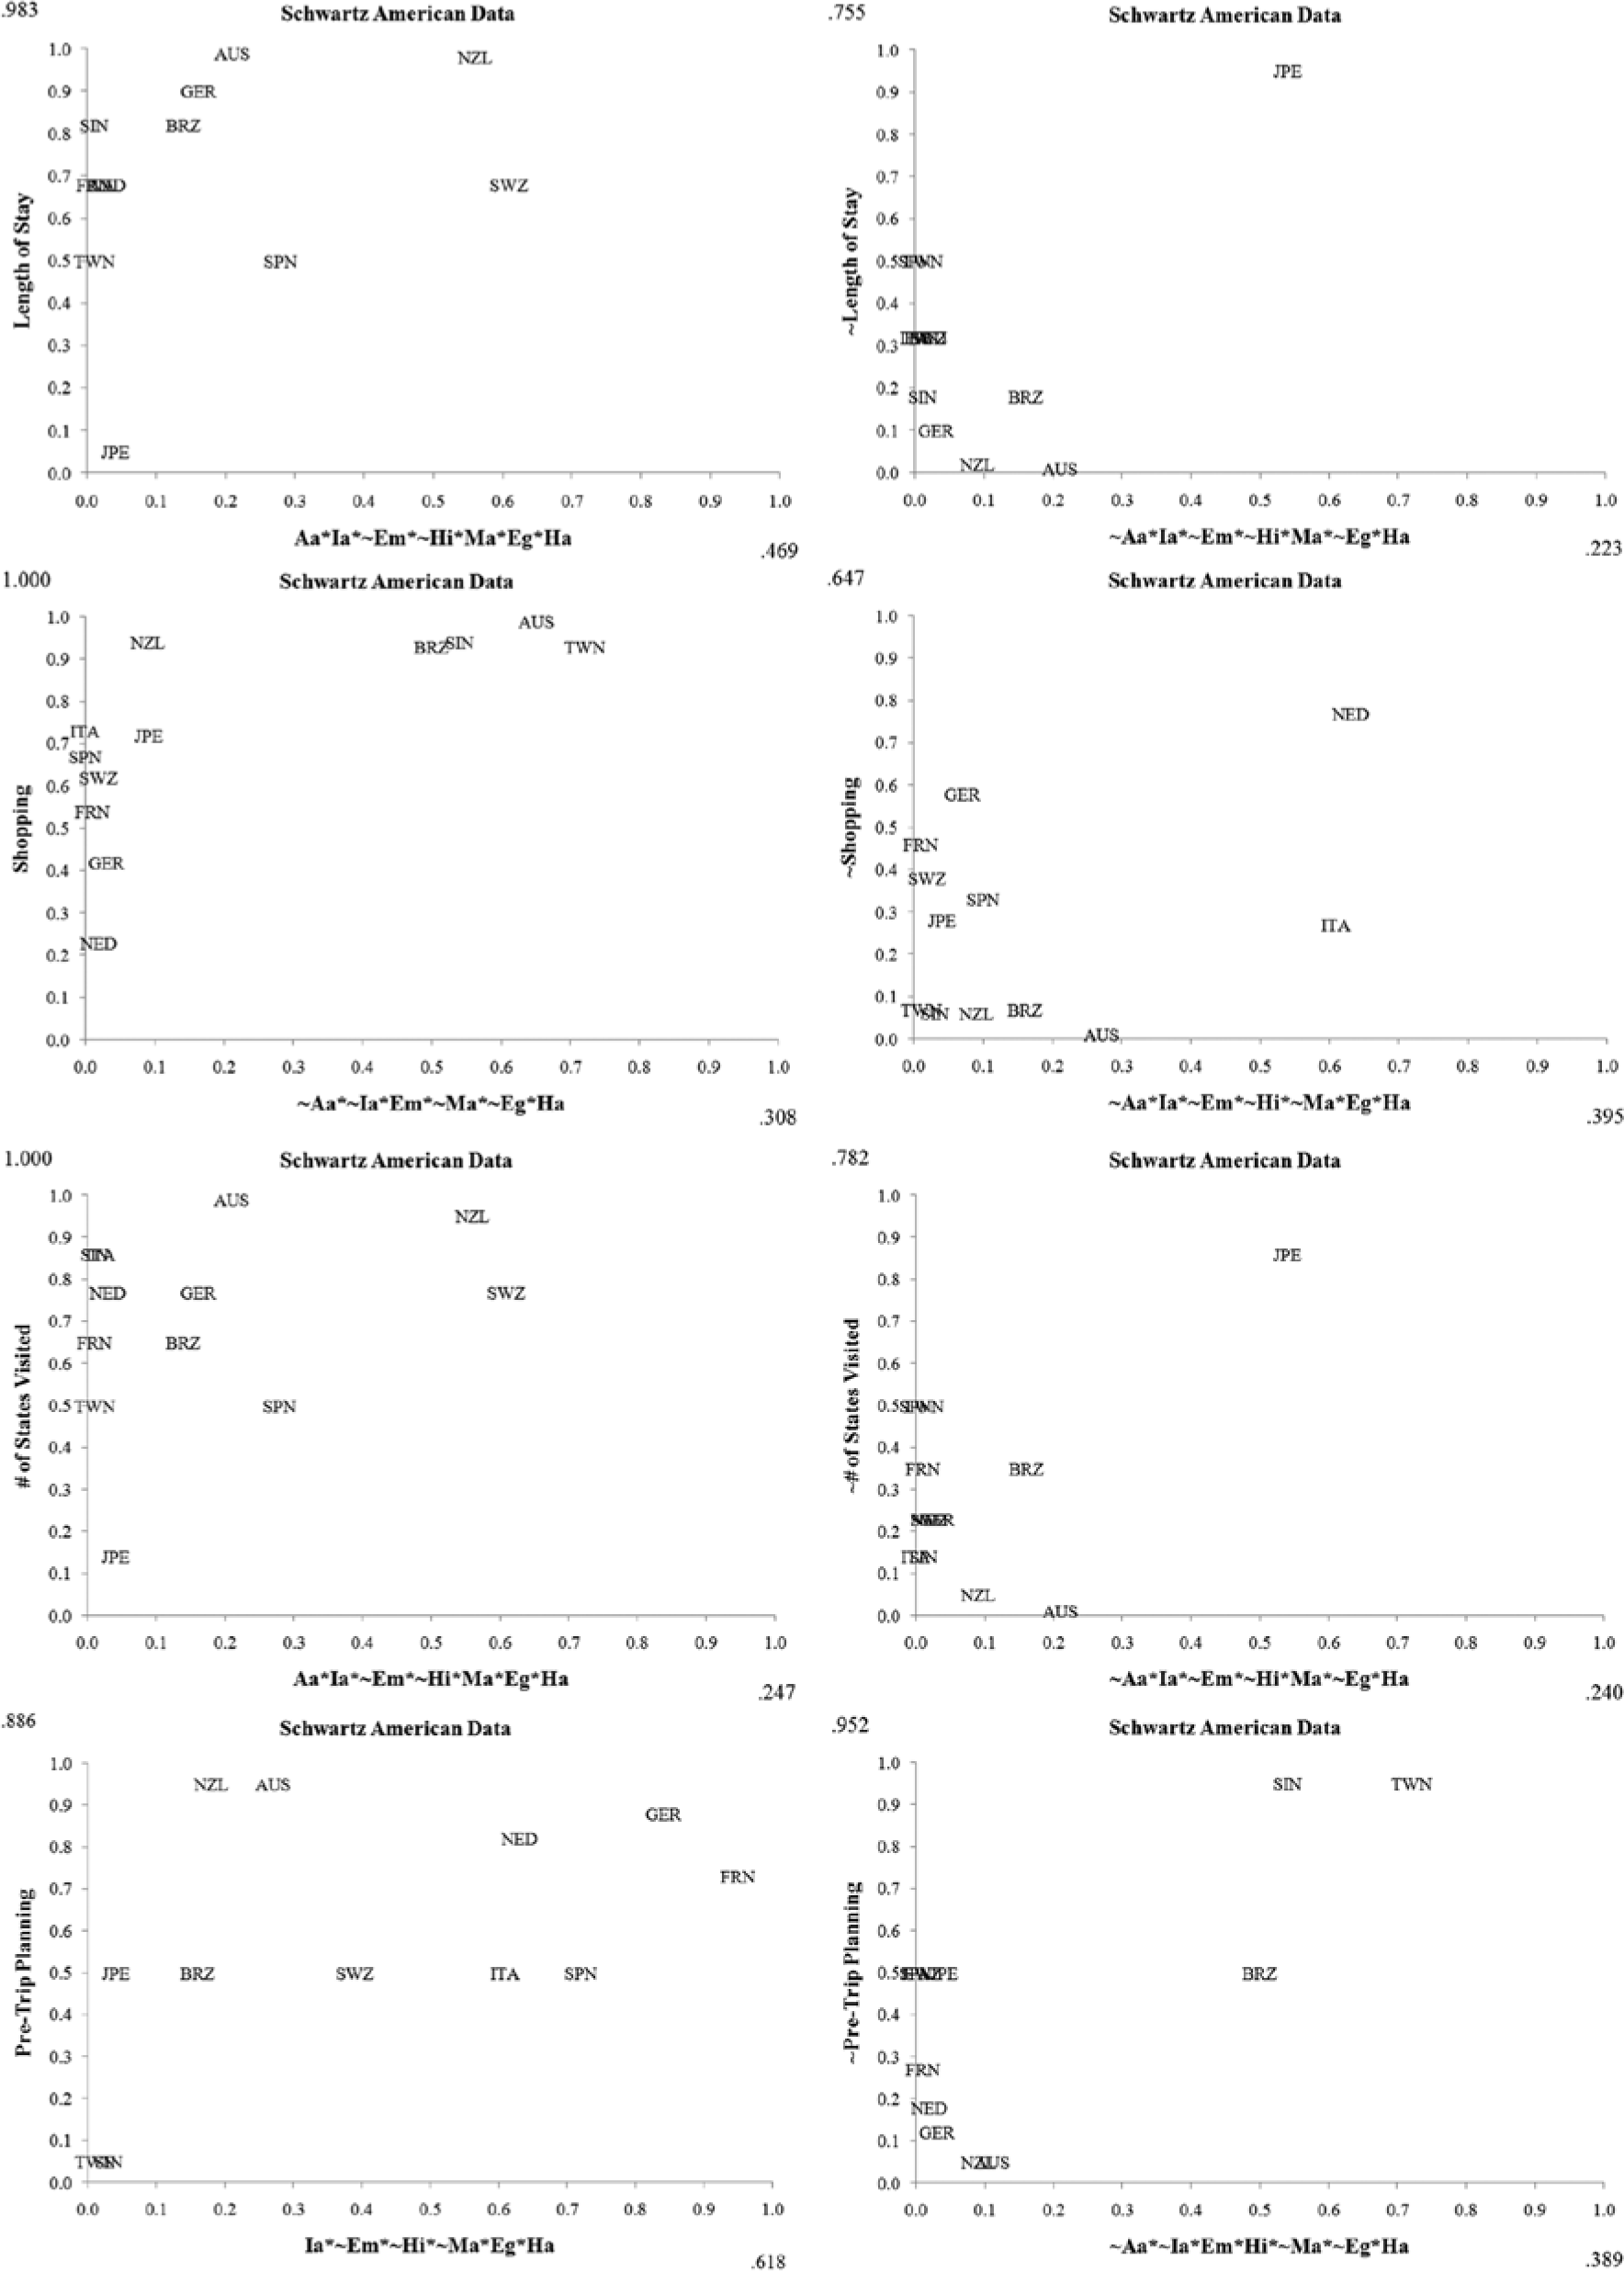
Schwartz’s best-fitting models for visitors to United States.
On the contrary, Eastern countries, such as Taiwan, Singapore, and Japan, usually appear on the upper right of the plots for consumption behaviors including not length of stay, daily expenditure, shopping, and not number of states visited. The findings indicate that people from Eastern countries tend to stay fewer nights, spend more money on food and accommodations daily, shop for more gifts to bring home, and visit fewer regions during their trips to Australia than people from Western countries.
Figure 14 shows similar findings that people from Western countries, such as New Zealand, Switzerland, and the Netherlands, tend to stay more nights, spend less money on shopping, visit more states during their trips to the United States, and spend more time on planning before their trips than people from Eastern countries. On the other hand, people from Eastern countries, such as Japan, Taiwan, and Singapore, are more likely to stay fewer nights, spend more money on shopping, visit fewer states during their trips to the United States, and spend less time on planning before their trips than people from Western countries.
Therefore, the findings support the conclusions that culture configurations affect consumer behavior and people from Eastern countries do not behave the same as people from Western countries.
Proposition 6: Cultural Influences Differ by Age
Since the tests of the third and the fifth propositions suggest Schwartz’s theory is theoretically and empirically useful in explaining consumer behavior—and that cultural influence is greater for visitors who travel to Australia on first-time holiday than for other experience/purpose combinations—the study analyzed the consumption data of first-time visitors to Australia with the best-fitting models of Schwartz’s theory to investigate whether or not the degree of cultural influences differ by age, the three age groups being young (<30 years of age), middle-aged (30-49), and old (50+) travelers.
A restricted meta-analysis using Schwartz’s best-fitting models give mean consistency scores of 0.962, 0.940, and 0.963 for young, middle-aged, and old travelers, respectively. These high mean consistency scores indicate that culture strongly influences the consumption behavior about equally for all three age groups of travelers. The negligible variation among the mean consistency scores for the three different age groups implies that cultural influences do not differ by age. When the same type of analysis is applied to the demographic configural conditions of GDP per capita and home–destination distance, findings also suggest that demographic configurations do influence the consumption behavior for all three age groups of travelers but that the influences do not vary by age.
The study examined the consumption behaviors of the three age groups to gain further understandings of cultural influences on different consumption behaviors for travelers of different ages. All of the consistency scores of the fuzzy-set relations are high; these findings indicate cultural influences are substantial for all the three age groups of travelers for different consumption behaviors. Besides that, negligible variation among consistency scores implies that the degree of cultural influence does not change by age on different consumption behaviors. (Details are available from the three authors.) In addition, similar patterns across three different age groups for each of the consumption behaviors also suggest cultural influences are about the same for different age groups of people. Therefore, the findings support the conclusion that cultural influences do not vary substantially by age.
Conclusion, Limitations, and Management Practice Implications
National culture consists of a complex combination of cultural values acting in configurations to influence the international tourism behavior of people in a nation. The model-testing method, fsQCA, permits the investigation of how complex cultural influences affect consumer behavior. After analyzing the consumption data of international visitors to Australia and the United States, the study is able to provide the following conclusions.
First, configurations of cultural values work better than individual values alone in explaining and predicting consumer behavior so that cultural values need to be examined together at the same time, not one at a time. Prior researchers frequently state that they are studying culture’s influences on consumer behavior; however, they only report the influence of individual cultural values one at a time using a net effects perspective. Based on the findings of the first proposition, the study suggests future researchers need to treat cultural values together in recipes when studying culture’s influences on consumer behavior.
Second, the findings show that nations differ in meaningful ways and can be represented by special configurations of cultural values. The study confirms the idea proposed by Clark (1990), Dawar and Parker (1994), Hofstede (2002), Schwartz (2006), and Steenkamp (2001) that nation is a meaningful proxy for culture because within-country commonalities and between-country differences do exist. Thus, there is still a need to study culture on a national basis.
Third, the findings show that Schwartz’s cultural theory is more theoretically and empirically useful in comparison to Hofstede’s, Inglehart’s, and Steenkamp’s cultural theories and the demographic variables of GDP per capita and home-destination distance. Hence, the study suggests future researchers adopt Schwartz’s theory when studying culture’s influences on consumer behavior.
Fourth, the degree of cultural influences is greater for holiday travelers than for travelers visiting family and friends and greater for first-time visitors than for repeat visitors. Accordingly, culture researchers should focus more on first-time holiday visitors than on visitors traveling for other purposes or repeat visitors when studying culture’s influences on consumer behavior.
Fifth, the findings support the proposition that culture does influence consumer travel behavior. In addition, obvious distinctions exist between the behaviors of people from Eastern countries and those from Western countries. Therefore, researchers may choose to conduct further investigations into the influences of culture on consumer behavior when conducting cross-cultural studies.
Sixth, the findings show that young, middle-aged, and older people from the same country behave in very similar ways when visiting destinations overseas. In other words, cultural influences do not differ substantially by age. This conclusion supports the belief of Hofstede (2001, 2002) and Schwartz (2006) that culture has centuries-old roots and changes very slowly. Although people may think culture is becoming less important now than before, culture still influences people’s behaviors substantially. Therefore, further studies of culture’s influences on consumer behavior are still necessary.
Limitations
Because of time and resources restrictions, this study has some notable limitations. First, the cases used in the study are on the national level instead of the individual level. Although differences exist between individuals, culture is commonly shared by the population of a country. Thus, the study only focuses on macro- rather than micro-level data analysis.
Second, the study tests only four major cultural theories of consumer behavior even though many other cultural theories are available. Some cultural theories that have not yet become well known or applied widely may work better than the four theories in the study.
Third, because of the limited availability of secondary data, the study only examines five types of consumption behavior: length of stay, daily expenditure, shopping expenditure, number of states/regions visited, and pre-trip planning time. Fourth, and also because of the limitations in secondary data, the study examines only international tourists from fifteen countries. Fifth, both destination countries in the study, Australia and the United States, are Western countries. The question of whether tourists behave differently when visiting Eastern countries, such as China and Japan, remains unknown.
Accordingly, the limitations of this study provide several directions for researchers in their future studies. Researchers may adopt other cultural theories and include more countries in their studies to investigate culture’s influences on other aspects of consumer behavior of visitors traveling to other destination countries.
Implications for Management Practice
Based on the findings, the study provides helpful clues for countries’ destination management organizations and hospitality firms in designing marketing plans to attract international tourists. Host countries may design different tour packages and emphasize different highlights to attract visitors from different countries.
In order to attract people from Eastern countries, such as Japan, Singapore, and Taiwan, tourism operators in the host country will find designing five- to seven-day tour packages with four- or five-star hotel accommodations to be most effective. These tour packages should include just a few attractions and quality shopping places. Marketing campaigns will emphasize these features and frequently broadcast the commercials on TV, radio, or other media during the period of time between one and two months prior to national holidays or summer and winter vacations.
To attract people from Western countries, such as Germany, the Netherlands, and Switzerland, management organizations and hospitality firms in the host country will find providing many mid-price-range accommodation choices with discounts for staying for a week or longer to be most effective. Marketing communications should contain information about many tourist attractions and make this information continuously and publicly available in ads, brochures, travel magazines, tourist information websites or any other media for Western travelers to make their long-visit plans.
Footnotes
Acknowledgements
The authors are grateful to Dan Fesenmaier, Rick Purdue, and Carol M. Megehee for comments and insights on early versions of this article.
Declaration of Conflicting Interests
The authors declared no potential conflicts of interest with respect to the research, authorship, and/or publication of this article.
Funding
The authors disclosed receipt of the following financial support for the research, authorship, and/or publication of this article: The authors express gratitude to the Cooperative Research Centre for Sustainable Tourism in Australia for funding the research to support the data acquisition from the Australian Bureau of Tourism Research that this study reports.